Article

Enhancing Feature Selection Optimization for COVID-19 Microarray Data

1
Department of Mathematics, University of Ruhuna, Matara 81000, Sri Lanka
2
Institute for Learning Sciences & Teacher Education, Australian Catholic University, Brisbane, QLD 4001, Australia
3
School of Business Administration and Customs, Shanghai Customs College, Shanghai 201204, China
*
Author to whom correspondence should be addressed.
COVID 2023, 3(9), 1336-1355; https://doi.org/10.3390/covid3090093
Submission received: 30 June 2023 / Revised: 30 August 2023 / Accepted: 1 September 2023 / Published: 4 September 2023

Abstract

:
The utilization of gene selection techniques is crucial when dealing with extensive datasets containing limited cases and numerous genes, as they enhance the learning processes and improve overall outcomes. In this research, we introduce a hybrid method that combines the binary reptile search algorithm (BRSA) with the LASSO regression method to effectively filter and reduce the dimensionality of a gene expression dataset. Our primary objective was to pinpoint genes associated with COVID-19 by examining the GSE149273 dataset, which focuses on respiratory viral (RV) infections in individuals with asthma. This dataset suggested a potential increase in ACE2 expression, a critical receptor for the SARS-CoV-2 virus, along with the activation of cytokine pathways linked to COVID-19. Our proposed BRSA method successfully identified six significant genes, including ACE2, IFIT5, and TRIM14, that are closely related to COVID-19, achieving an impressive maximum classification accuracy of 87.22%. By conducting a comparative analysis against four existing binary feature selection algorithms, we demonstrated the effectiveness of our hybrid approach in reducing the dimensionality of features, while maintaining a high classification accuracy. As a result, our hybrid approach shows great promise for identifying COVID-19-related genes and could be an invaluable tool for other studies dealing with very large gene expression datasets.

1. Introduction

The utilization of DNA microarray technology provides a useful means of measuring gene expression levels simultaneously, making it a valuable tool for various applications, such as SNP and mutation detection, tumor classification, target gene and biomarker identification, chemo-resistance gene identification, and drug discovery [1]. Both microarrays and RNA-seq are valuable technologies for gene expression analysis, but they have their respective strengths and limitations. Here are some scenarios where microarrays might have advantages over RNA-seq: (1) Microarrays are generally less expensive than RNA-seq, making them a more budget-friendly option, especially when dealing with a large number of samples. (2) Microarray data generate smaller datasets compared to RNA-seq, which can be advantageous when dealing with limited storage or computational resources. (3) Microarrays have been in use for a longer time, and the experimental protocols are well-established. The process is relatively straightforward, while RNA-seq requires more complex sample preparation and data analysis workflows [2].
Despite its usefulness, the high cost of these experiments often results in a limited availability of experiments for classification. In combination with a large number of genes being present in each experiment, this creates the “curse of dimensionality”, which presents a challenge for both classification and data processing in general. The majority of genes present are housekeeping genes that provide little information for the classification task, while only a small proportion of genes are discriminatory [3,4]. Therefore, gene selection (GS) is an essential step in achieving effective classification. GS aims to identify discriminatory genes and reduce the number of genes used for classification, which is required in many applications. It should be noted that the number of irrelevant genes is typically much higher than the number of discriminatory genes.
The process of GS involves identifying the most consistent, non-redundant, and relevant features for use in constructing a model, as outlined by Lai et al. [5]. When increasing the size and diversity of datasets, it is crucial to systematically reduce their size. The primary objective of feature selection is to enhance the performance of predictive models while minimizing the computational costs associated with modeling.
There are four types of feature selection methods, namely filter methods [6], wrapper methods [7], hybrid methods [8], and embedded methods [9]. Filter methods select a subset of appropriate features that are independent of any learning algorithm and use the intrinsic and statistical characteristics of the features. To weight features, these methods assign a weight to each feature based on its relevance to class labels, often using correlation criteria and information-theory-based criteria. Examples of gene selection filter methods include minimum redundancy maximum relevance (MRMR) [10], information gain (IG) [11], and chi-square [12]. Wrapper methods employ heuristic search algorithms to find a subset of features. These methods begin with a randomly generated solution and progress toward the best subset of the solution with each iteration. The genetic algorithm [13], whale optimization algorithm [14], ant colony optimization algorithm [15], binary particle swarm optimization algorithm [16], binary grey wolf search algorithm [17], binary dragonfly algorithm [18], and other evolutionary algorithms are used in wrapper methods.
In the field of microarray data analysis, researchers have proposed hybrid approaches to enhance the identification of disease biomarkers. These methods aimed to overcome the limitations of the filter and wrapper methods. Filter methods are useful for datasets with a high number of features since they involve fewer computations, but their accuracy may be compromised. Conversely, wrapper methods yield superior classification accuracy but demand significantly more computational resources. Due to the complementary strengths and weaknesses of the two methods, the hybrid approach was developed. This involves first selecting a subset of features based on their importance using a filter method, followed by applying the wrapper method to the selected features, to determine the most effective ones [19,20].
Although numerous non-iterative optimization algorithms (NIOAs) have been employed in microarray data, there is no assurance that these techniques will discover the best subset of genes for classification problems, because of their stochastic nature [21]. In addition, gene selection remains a challenging task, due to the large search space of genes and intricate gene interactions [22,23]. Therefore, further research is necessary to develop an efficient gene selection approach.
Among the different optimization algorithms, the gray wolf optimization (GWO) algorithm is a bio-inspired optimization technique introduced by Mirjalili et al. [24] for feature selection in classification problems and imitates the hunting behavior of gray wolves in nature. Later, the binary version of gray wolf optimization (BGWO) [17] was proposed, to maximize the classification accuracy, while minimizing the number of selected features. BGWO provided significant results when compared to two well-known feature selection methods and using KNN as a classifier.
Abualigah et al. [25] introduced the reptile swarm algorithm (RSA), which mimics the hunting behavior of crocodiles, specifically their encircling and hunting coordination and cooperation. However, the RSA currently only works for single-objective optimization problems with conflicting variables, but it could be extended to handle binary and multi-objective variants to address a wide range of discrete and multi-objective real-world optimization problems.
The RSA algorithm has gained popularity due to its attractive features, such as requiring minimal initialization parameters and not needing derivative information in basic search. It is also a scalable, easy-to-use, and sound algorithm, making it suitable for various real-world problems. However, like other metaheuristic algorithms, RSA’s performance may also be affected by the problem’s size and complexity, leading to premature convergence, due to a lack of balance between exploration and exploitation capabilities [26]. To overcome these limitations, the problem-specific knowledge embedded in the search space should be considered, and the optimization structure of RSA should be appropriately adjusted. Moreover, there is evidence in the literature to show that continuous nature-inspired algorithms can be converted into a binary version using appropriate transfer functions to enhance classification accuracy. As a binary version of RSA has not yet been developed, in this study a novel binary version of the RSA algorithm is proposed and evaluated using COVID-19 data analysis.
In this study, a two-stage hybrid feature selection approach is utilized to improve classification performance. Initially, the best transfer function was selected among the common support vector machine (SVM) [27], random forest (RF) [28], and k-nearest neighbor (KNN) [29] classifiers. It is worth noting that most binary versions of nature-inspired algorithms in the literature employ average classification accuracy as the fitness function. Therefore, in the second stage, an alternative fitness function was explored, to yield better results in terms of feature selection and classification accuracy.
Indeed, a novel optimized feature selection method is proposed, combining the LASSO regression method with the binary reptile search algorithm (BRSA). This hybrid approach guides the search for a more robust and useful subset of genes while considering feature selection accuracy and stability. The performance of the proposed BRSA was evaluated with the identified best classifier and appropriate sigmoid transfer function, and the results indicated its superior classification accuracy compared to other existing gene selection techniques. Finally, the proposed method was used to identify the optimal subset of genes associated with COVID-19 from the RNA-seq dataset.

2. The Preliminaries

This section begins by introducing the LASSO filtering method and proceeds to describe the standard RSA and its basic steps. Additionally, the SVM classification algorithm is introduced.

2.1. The Penalized Logistic Regression—LASSO Method

LASSO, which stands for least absolute shrinkage and selection operator, is a method used for feature selection and regression analysis [30]. Its primary objective is to reduce certain coefficients while setting others to zero. The LASSO method employs an l 1 penalty, which results in some of the estimated coefficients becoming equal to zero.
Given a linear regression with standardized predictors x i j and centered response values y i for i = 1 , 2 , , N and j = 1 , 2 , , p , LASSO solves the l 1 -penalized regression problem as
arg   min β 1 , , β p i = 1 N ( y i β 0 j = 1 p x i j β j ) 2 + λ j = 1 p β j ,
where λ is a tuning parameter that controls the amount of shrinkage applied to the coefficients. The optimal value of λ is typically determined through techniques such as cross-validation.
Cross-validation [31] is a statistical technique employed to assess a model’s performance and its ability to generalize to unseen data. It involves dividing the dataset into subsets, training the model on some of them, and validating it on the remaining data. Cross-validation helps to evaluate a model’s robustness and prevent overfitting. Optimal lambda cross-validation [32] is a specific application of cross-validation used to find the optimal value of lambda in LASSO regression, balancing the trade-off between model complexity and data fitting. By performing optimal lambda cross-validation, the most suitable lambda value is determined, resulting in an effectively tuned LASSO model with improved predictive performance and meaningful variable selection [33].

2.2. The Reptile Search Algorithm (RSA)

Nature-inspired optimization algorithms often take inspiration from various natural processes and organisms to develop efficient algorithms. Abualigah et al. [25] introduced the RSA, a metaheuristic optimization algorithm inspired by the hunting behavior of crocodiles. The algorithm mimics the natural habitat of crocodiles, which prefer areas with abundant food and water and are able to hunt both in and out of the water. The RSA algorithm incorporates essential features of modern optimization algorithms to compute its main formula. The procedure of RSA can be summarized as below:
Stage 1: RSA parameter initialization
Before running the RSA algorithm, it is necessary to initialize the control and algorithmic parameters. The control parameters consist of N, the number of candidate solutions (i.e., the number of crocodiles); T, the maximum number of iterations, α , which controls the exploitation ability; and β , which controls the exploration ability. These parameters are used throughout the search process to balance exploration and exploitation.
Stage 2: Population initialization of RSA
In this stage, a random set of solutions is initialized using the following equation, as proposed by Abualigah et al. [25]:
x i j = r a n d ( U B L B ) + L B , i = 1 , 2 , N , and j = 1 , 2 , , n .
Here, x i , j refers to the jth position of the ith solution, n is the dimension size of the problem, rand is a random value between 0 and 1, L B is the lower bound value, and U B is the upper bound value. Thus, a set of N solutions is generated and stored in a matrix:
X = x 1 , 1 x 1 , j x 1 , n 1 x 1 , n x 2 , 1 x 2 , j x 2 , n 1 x 2 , n . . . . . . . . x N 1 , 1 x N 1 , j x N 1 , n 1 x N 1 , n x N , 1 x N , j x N , n 1 x N , n .
Stage 3: Fitness function estimation
The fitness value of each solution x i j in the population, denoted by X, is computed as  f ( x i j ) .
Stage 4: Exploration phase
The RSA algorithm utilizes two strategies, known as high walking and belly walking, during the exploration phase to discover better solutions by exploring new regions in the problem’s search space. The following equation is used to update the position of each solution in the population during the exploration phase:
x i , j ( t + 1 ) = B e s t j ( t ) η i , j ( t ) β R i , j ( t ) r a n d if ( t T / 4 ) ,
and
x i , j ( t + 1 ) = B e s t j ( t ) x r 1 , j E S ( t ) r a n d if ( T / 4 < t 2 T / 4 )
with x i , j representing the decision variable of the ith solution at the jth position. The value of B e s t j ( t ) corresponds to the jth position in the best solution obtained at iteration t, while t + 1 represents the new iteration, and t represents the previous iteration. The hunting operator of the jth position in the ith solution, η i , j ( t ) , can be calculated using Equation (6). x r 1 , j refers to the decision variable at the jth position in the ith solution, where r 1 is a value between 1 and N. The high walking strategy is controlled by t T / 4 , whereas the belly walking strategy is controlled by T / 4 < t 2 T / 4  [25]. The values of η i , j , M ( x i ) , P i , j , R i , j and E S ( t ) are calculated using
η i , j = B e s t j ( t ) P i , j ,
M ( x i ) = 1 n i = 1 n x ( i , j ) ,
P i , j = α + x i , j M ( x i ) B e s t j ( t ) ( U B j L B j ) + ϵ ,
E S ( t ) = 2 r 3 ( 1 1 / T ) ,
and
R i , j = B e s t j ( t ) x r 2 , j B e s t j ( t ) + ϵ .
Here, the percentage difference between the decision variable at the jth position of the best solution ( B e s t j ( t ) ) and the decision variable at the position of the current solution ( x i ) is denoted by P i , j , while α is used to control the exploration capability of the RSA during the hunting phase, with a value of α = 0.1 . Additionally, ϵ is a random value between 0 and 2, and M ( x i ) is the average value of all decision variables of the current solution. The variable R i , j is used to reduce the search area of the jth position in the ith solution. The evolutionary sense probability, E S ( t ) , is randomly assigned a value decreasing from 2 to 2 , and is calculated using Equation (9). The parameter r 2 is a random value between 1 and N, and r 3 is a random integer value of 1 , 0, and 1 [25].
Stage 5: Exploitation phase
This phase of RSA is designed to exploit current search areas, to find optimal solutions using two strategies: hunting coordination and hunting cooperation, as shown in
x i , j ( t + 1 ) = B e s t j ( t ) P i , j r a n d if ( 2 T / 4 t 3 T / 4 ) ,
and
x i , j ( t + 1 ) = B e s t j ( t ) η i , j ϵ R i , j r a n d if ( 3 T / 4 t T ) .
During the time interval 2 T / 4 t 3 T / 4 , the hunting coordination strategy is employed, while during the time interval 3 T / 4 t T , the hunting cooperation strategy is used.
Stage 6: Stop criterion
The process of Steps 3–5 needs to be repeated iteratively, until the maximum number of iterations T is achieved.
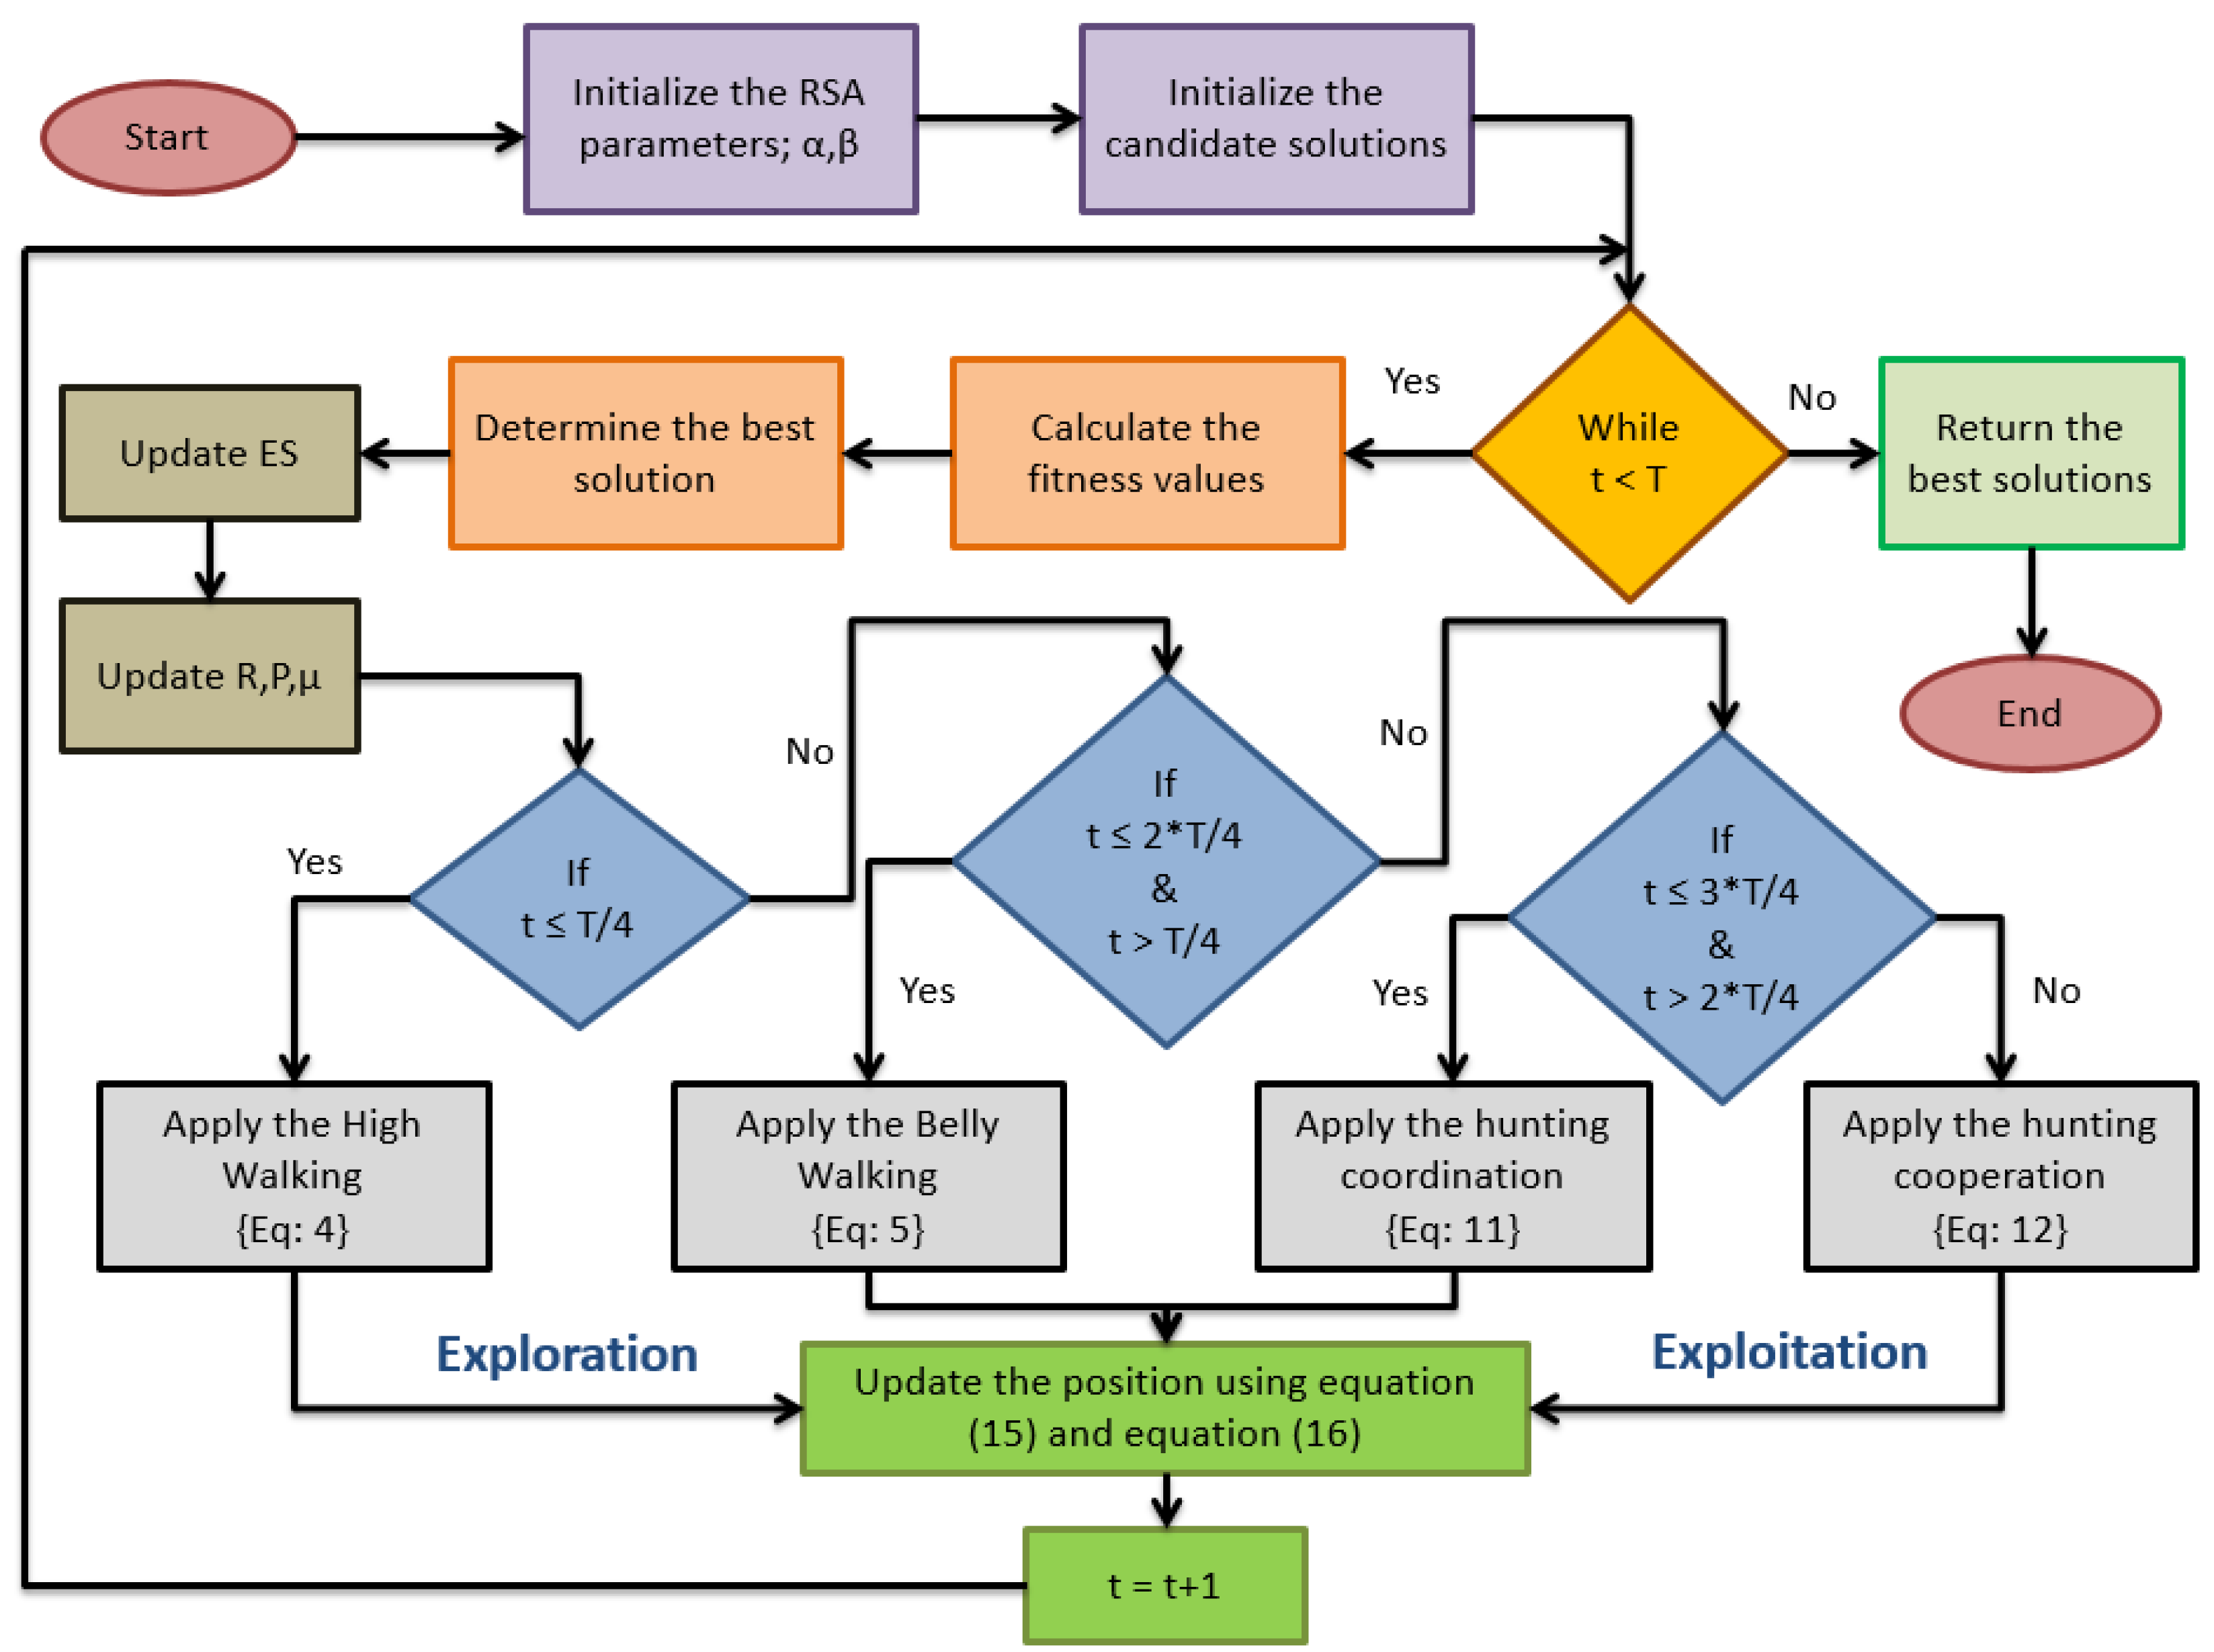
Finally, a flow chart of the continuous RSA is shown in Figure 1, and Algorithm 1 presents the pseudo-code of the RSA.

2.3. Support Vector Machine

SVMs are known to perform exceptionally well in microarray data analysis, which can be attributed to several theoretical factors [34]. First, SVMs are resilient to high ratios of variables to samples, as well as large numbers of variables. Additionally, they can effectively learn complex classification functions in a computationally efficient manner and employ robust regularization principles to prevent overfitting.
The fundamental principle underlying SVM classifiers is to identify a hyperplane with a maximum margin that can effectively separate two classes of data [35]. However, in situations where the data are not linearly separable, kernel functions are utilized to implicitly map the data to a higher-dimensional space and identify a suitable hyperplane. In this study, the linear kernel implementation of the SVM classifier was adopted, utilizing the “libSVM” software library [36].
Algorithm 1: Pseudocode of the Reptile Search Algorithm (RSA)
1:
Initialization phase
2:
Initialize RSA parameters
3:
Initialize the solution’s positions randomly; X : i = 1 , , N
4:
while   t < T   do
5:
    Calculate the Fitness value for the candidate solutions ( X )
6:
    Find the best solution
7:
    Update the ES using Equation (9)
8:
    The beginning of the RSA
9:
    for ( i = 1 to N) do
10:
        for ( j = 1 to n) do
11:
           Update the η i , j , P i , j , R i , j and values using Equations (6), (8) and (10), respectively
12:
           if  ( t T / 4 )  then
13:
                x ( i , j ) ( t + 1 ) = B e s t j ( t ) η ( i , j ) ( t ) β R ( i , j ) ( t ) r a n d
14:
           else if  ( t 2 T / 4 and t > T / 4 )  then
15:
                x ( i , j ) ( t + 1 ) = B e s t j ( t ) x ( r 1 , j ) E S ( t ) r a n d
16:
           else if  ( t 3 T / 4 and t > 2 T / 4 )  then
17:
                x ( i , j ) ( t + 1 ) = B e s t j ( t ) P ( i , j ) r a n d
18:
           else
19:
                x ( i , j ) ( t + 1 ) = B e s t j ( t ) η ( i , j ) ϵ R ( i , j ) r a n d
20:
           end if
21:
        end for
22:
    end for
23:
     t = t + 1
24:
end while
25:
Return the best solution ( B e s t ( X ) )

3. The Proposed Method

This section provides a detailed account of the methodology and techniques utilized in the proposed BRSA approach, which is divided into two primary modules:
  • LASSO-based filter approach: This stage involves identifying a set of relevant features through the application of a LASSO-based filter approach;
  • BRSA-based wrapper approach: In this stage, the final subset of features is determined utilizing a BRSA-based wrapper approach.
The following subsections provide a complete description of these two phases.

3.1. The First Stage: Filter Approach

The LASSO approach involves utilizing the LASSO method to choose an initial subset of features based on gene significance and redundancy, rather than exhaustively studying all extracted features. By reducing the high dimensionality of the original dataset, the LASSO method generates more discriminative genes for the wrapper method, resulting in improved classification accuracy and reduced computational burden. The LASSO method achieves parameter regularization by shrinking and eliminating some regression coefficients, resulting in a feature selection phase that includes only non-zero values in the final model.

3.2. The Second Stage: Wrapper Approach

In this phase, the wrapper method is utilized to choose a subset of the most significant genes from the list of top genes identified by the LASSO filtering technique. BRSA was specifically designed to serve as a rapid search strategy for the wrapper model. RSA is a gradient-free, population-based method that can tackle both simple and complex optimization problems, subject to certain constraints. Although the RSA is susceptible to local optimization, it is more stable than other algorithms and can be applied to a binary algorithm. The recommended BRSA evaluates the quality of feature subsets using the F-measure as the fitness function, with the ultimate goal of improving classification performance by minimizing the number of selected genes.

3.2.1. Solution Representation

The process of feature selection involves identifying the most important features from the original dataset, in order to perform classification. This is achieved using the BRSA algorithm, where features are assigned a value of either ‘0’ to denote non-selected features or ‘1’ to indicate selected features.

3.2.2. The Fitness Function

In general, feature selection aims to identify a small set of features that exhibit high classification performance. The quality of the chosen subset is determined by the combination of high classification accuracy and a low number of selected features. With this in mind, the fitness function for the proposed feature selection technique was carefully designed. The F-measure was selected as the fitness function, with higher scores indicating better performance, ranging from 0 (worst) to 1 (best). Therefore, the optimization problem focused on maximizing the fitness function.The formula for the F-measure is expressed as
F-measure = 2 True Positive 2 True Positive + True Negative + False Negative .
It should be noted that reducing the number of selected genes can enhance classification accuracy. Therefore, when two subsets exhibit a similar classification accuracy, the subset containing fewer genes is preferred.

3.2.3. Binary Reptile Search Algorithm (BRSA)

The first stage of the proposed approach involves the selection of the top n genes using the LASSO filter approach, which is then passed on to the new BRSA algorithm in the second stage. In this phase, the BRSA algorithm is utilized to design an effective gene selection strategy that offers improved exploration and exploitation capabilities, with rapid convergence. While the BRSA algorithm is conceptually similar to the original RSA algorithm, the main difference lies in the search space. The original RSA operates in a continuous search space, whereas the binary version operates in a discrete search space. Since the search space for the BRSA is restricted to binary values (0 and 1), it is not possible to alter the position of the search space. To overcome this, the sigmoid transfer function is employed to transform the new reptile’s position from continuous to binary values. The sigmoid transfer function is chosen to ensure that the selected transfer function lies within the range of [ 0 , 1 ] .

3.2.4. Sigmoid Transfer Functions

The transfer function plays a crucial role in determining the probability of changing binary solution values from 0 to 1. The S-shaped transfer function is mathematically defined as
S = 1 1 + exp ( x ) .
The positions in the S-shaped function are updated using
B s t e p = 1 if ( s r a n d n ) 0 else ,
and
X i , j ( t + 1 ) = 1 if ( x i , j + B s t e p 1 ) 0 else ,
where r a n d n means a random number between 0 and 1.
In this study, the impact of four different sigmoid transfer functions on the performance of BRSA was examined [37]. The mathematical formulas for each of these functions are provided in Table 1, and their corresponding graphs are shown in Figure 2.
To sum up, the proposed BRSA is presented in Algorithm 2, and its corresponding flow chart is provided in Figure 3.
Algorithm 2: Pseudo-code of the Binary Reptile Search Algorithm (BRSA)
1:
Initialization phase
2:
Initialize BRSA parameters α , β , etc.
3:
Initialize the solution’s positions randomly. X : i = 1 , , N
4:
while   t < T   do
5:
    Calculate the Fitness Function for the candidate solutions ( X ) .
6:
    Find the Best solution so far.
7:
    Update the ES using Equation (9)
8:
    The beginning of the BRSA
9:
    for ( i = 1 to N) do
10:
        for ( j = 1 to n) do
11:
           Update the η , R , P and values using Equations (6), (8) and (10), respectively
12:
           if  ( t T / 4 )  then
13:
                x ( i , j ) ( t + 1 ) = B e s t j ( t ) η ( i , j ) ( t ) β R ( i , j ) ( t ) r a n d
14:
           else if  ( t 2 T / 4 and t > T / 4 )  then
15:
                x ( i , j ) ( t + 1 ) = B e s t j ( t ) x ( r 1 , j ) E S ( t ) r a n d
16:
           else if  ( t 3 T / 4 and t > 2 T / 4 )  then
17:
                x ( i , j ) ( t + 1 ) = B e s t j ( t ) P ( i , j ) r a n d
18:
           else
19:
                x ( i , j ) ( t + 1 ) = B e s t j ( t ) η ( i , j ) ϵ R ( i , j ) r a n d
20:
           end if
21:
           Update the position using Equations (15) and (16)
22:
        end for
23:
    end for
24:
     t = t + 1
25:
end while
26:
Return the best solution ( B e s t ( X ) )

4. Case Study

4.1. GSE149273 (COVID19) Dataset

The GSE149273 dataset is an SRA dataset downloaded from the GEO that contains 25343 genes, 90 samples, and three categories (RVA, RVC, Control). A description of the dataset is given below:
  • Status—Public on 25 April 2020
  • Title—RV infections in asthmatics increase ACE2 expression and stimulate cytokine pathways implicated in COVID-19
  • Organism—Homo sapiens
  • Experiment type—Expression profiling using high throughput sequencing
  • Summary—We present evidence that (1) viral respiratory infections are potential mechanisms of ACE2 overexpression in patients with asthma and that (2) ACE activation regulates multiple cytokine anti-viral responses, which could explain a mechanism of cytokine surge and associated tissue damage.
These results suggest that the recent finding of severe COVID-19 in asthma patients with recent exacerbations may be attributable to synergistic biomolecular interactions with viral co-infections.
Overall design—In paired design experiments across discovery and validation cohorts of asthmatic patients, biological replicates treated with RVA and RVC were compared to non-treated ones [38].

4.2. Experimental Results

This study utilized a binary metaheuristic algorithm to decrease the number of features in the common gene dataset obtained through differential expression analysis, resulting in an optimized dataset that includes only crucial features pertinent to the research. The LASSO regression method was used to analyze data from a maximum of 14 genes.
The implementation of the method was carried out using R software. In LASSO regression, the lambda ( λ ) value needs to be kept constant, to adjust the amount of coefficient shrinkage. The optimal lambda cross-validation for the dataset minimizes the prediction error rate. Figure 4 shows that the left dashed vertical line corresponds to the logarithmic value of the optimal lambda that minimizes the prediction error, which is approximately 5 and provides the most accurate results.
In general, regularization aims to balance accuracy and simplicity by finding a model with the highest accuracy and the minimum number of predictors. The optimal value of lambda is usually chosen by considering two values: l a m b d a . 1 s e and l a m b d a m i n . The former produces a simpler model but may be less accurate, while the latter is more accurate but less parsimonious. In this study, the accuracy of LASSO regression was compared with the accuracy of the full logistic regression model, as shown in Table 2. The results showed that l a m b d a m i n produced the highest accuracy, and the obvious choice of the optimal value was 0.001. Finally, the most significant genes were selected based on this optimal value.
The LASSO method applies l 1 or absolute value penalties in penalized regression and is particularly effective for variable selection in the presence of many predictors. The resulting solution is often sparse, containing estimated regression coefficients with only a few non-zero values. Table 3 presents the list of selected genes obtained using the LASSO method.
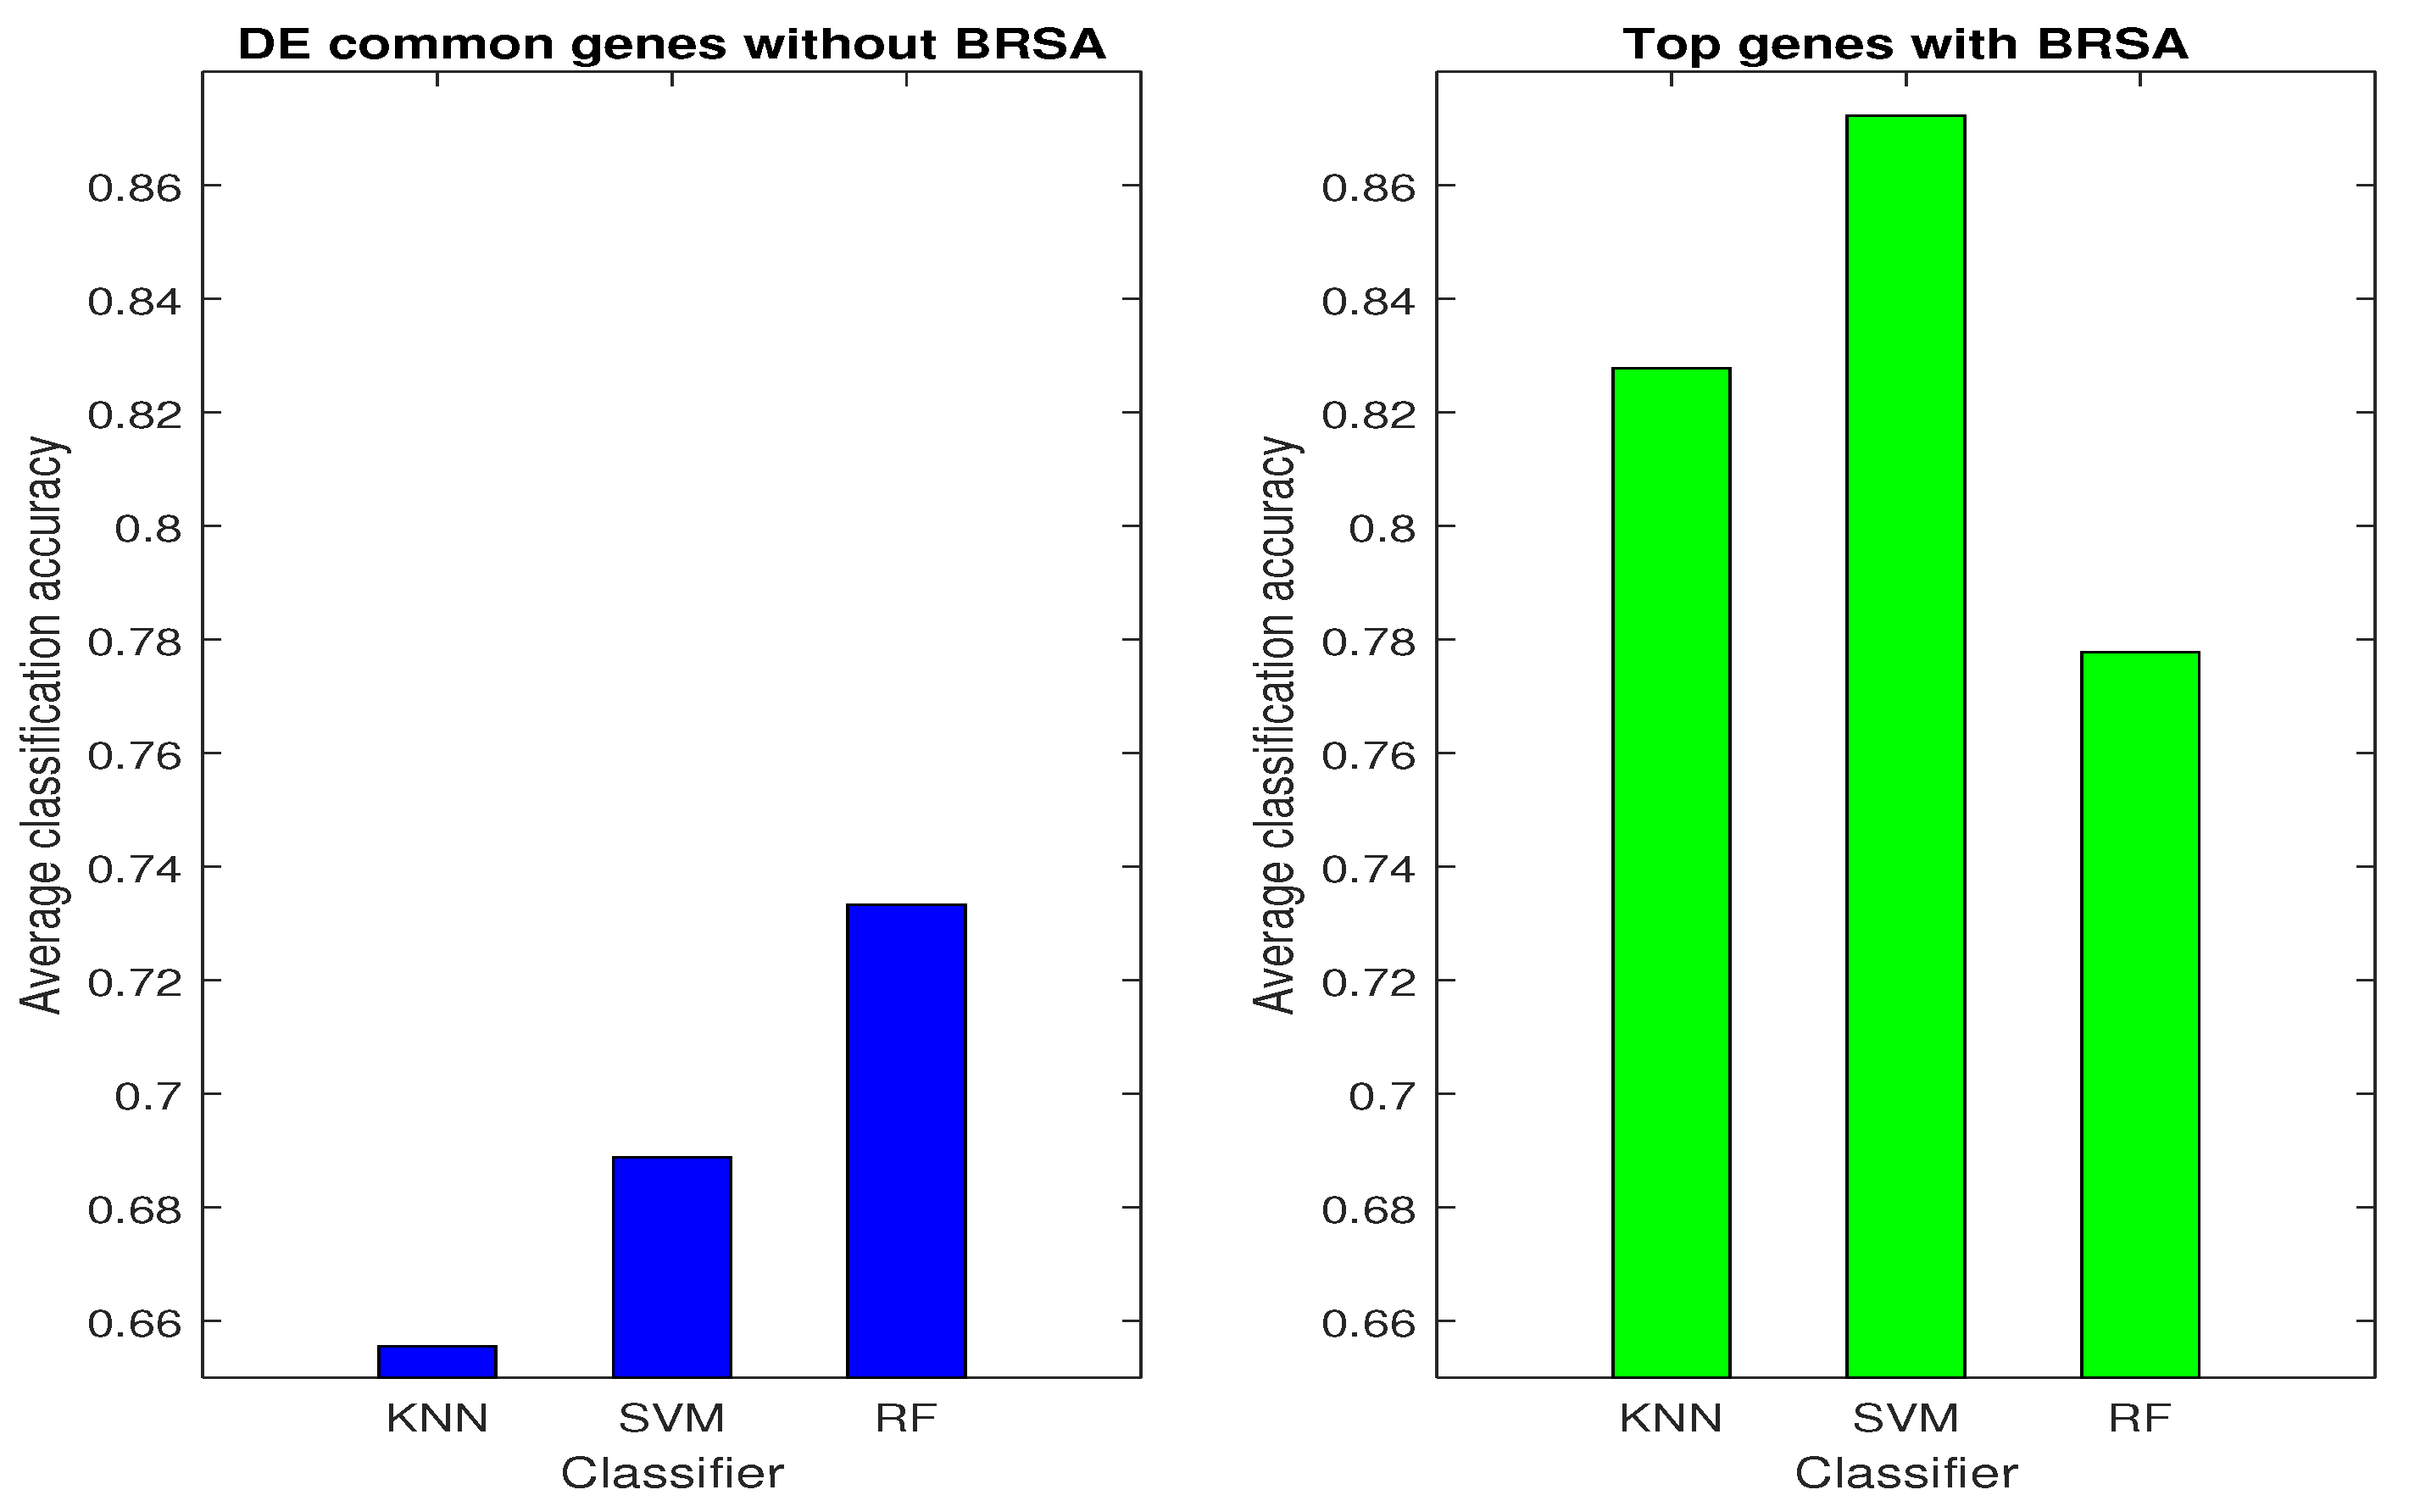
Next, the best classification algorithm was selected among SVM, RF, and KNN, by applying each algorithm to the full dataset and the filtered dataset separately. As shown in Table 4 and Figure 5, the RF algorithm achieved the highest average accuracy of 73.32% on the full dataset. On the other hand, the filtered dataset performed very well with the SVM classifier, achieving a high average classification accuracy and low variance. The performance of SVM with the BRSA algorithm was found to be the highest (87.22%) when compared to the KNN and RF classifiers. Therefore, the SVM was selected as the best classifier to be adopted in this study.
To convert the continuous search area into a binary version in BRSA, a sigmoid function was used. Table 5 shows the statistical outcomes obtained for each of the evaluation matrices used in each sigmoid transfer function. The best statistical results of the sigmoid transfer functions are highlighted in bold.
The fourth sigmoid transfer function ( S 4 ) showed significantly higher averages for classification accuracy, fitness value, precision, and specificity compared to the other three transfer functions. Specificity refers to the percentage of true negatives, and S 4 exhibited a specificity of 82.78%, indicating that 82.78% of those without the target disease will test negative. The best and worst values for the evaluated matrices of the four transfer functions were almost equal. Figure 6 provides a clearer representation of the average number of selected features, where S 4 has the fewest significant features (6.05). Furthermore, Figure 7, shows that S 1 and S 2 had similar average fitness values, but different accuracy and sensitivity values. A higher sensitivity in S 2 indicates that the model correctly identifies most positive results, whereas a low sensitivity means the model misses a significant number of positive results.
Furthermore, the convergence of four distinct sigmoid functions is compared in Figure 8 and illustrates the efficiency of the algorithms.
Figure 8 depicts that the S 4 sigmoid transfer function not only attained a superior convergence speed but also acquired the best fitness scores. It typically achieved its optimal solution in around 70 iterations, whereas S 1 began with a low fitness value and converged to a high fitness value after approximately 220 iterations. As a result, the S 4 sigmoid transfer function was deemed the most appropriate for the proposed BRSA.
Next, the proposed BRSA was compared with four alternative algorithms: the binary dragonfly algorithm (BDA), binary particle swarm optimization (BPSO), and two variants of the binary gray wolf optimization algorithm (BGWO1 and BGWO2). To initiate the analysis, we applied various statistical metrics, and the results are presented in Table 6. Indeed, Table 6 indicates that the average accuracy, average F-measure, and average sensitivity of BRSA were higher than those of the other algorithms, except for the average precision value.
Additionally, BDA was found to be the most competitive algorithm, with BRSA following closely behind. Based on these findings, we can infer that BRSA outperformed BPSO, BDA, BGWO1, and BGWO2 in selecting the most relevant features from the tested datasets to optimize classification performance, while minimizing the number of selected features.
Furthermore, according to the conclusion by Demšar [39] and Benavoli et al. [40] that “the non-parametric tests should be preferred over the parametric ones”, we employed the Friedman test [41] to validate the obtained results and determined that the differences between the competing methods were significant. Table 7, Table 8 and Table 9 display the final rank of each algorithm as determined by the Friedman test. The test was conducted using IBM SPSS Statistics version 22. Based on the ranks, it is evident that BRSA achieved the first rank in terms of performance measures for both classification accuracy and fitness value, thereby taking first place among all algorithms. However, in terms of the number of selected features, BRSA ranked second, with BDA obtaining first place in the Friedman test.
After implementing the proposed BRSA approach on 4055 common DE genes, the top subset of six genes was identified as the optimal subset with 87.22% accuracy for the SVM classifier. Table 10 presents the selected genes obtained using this approach.
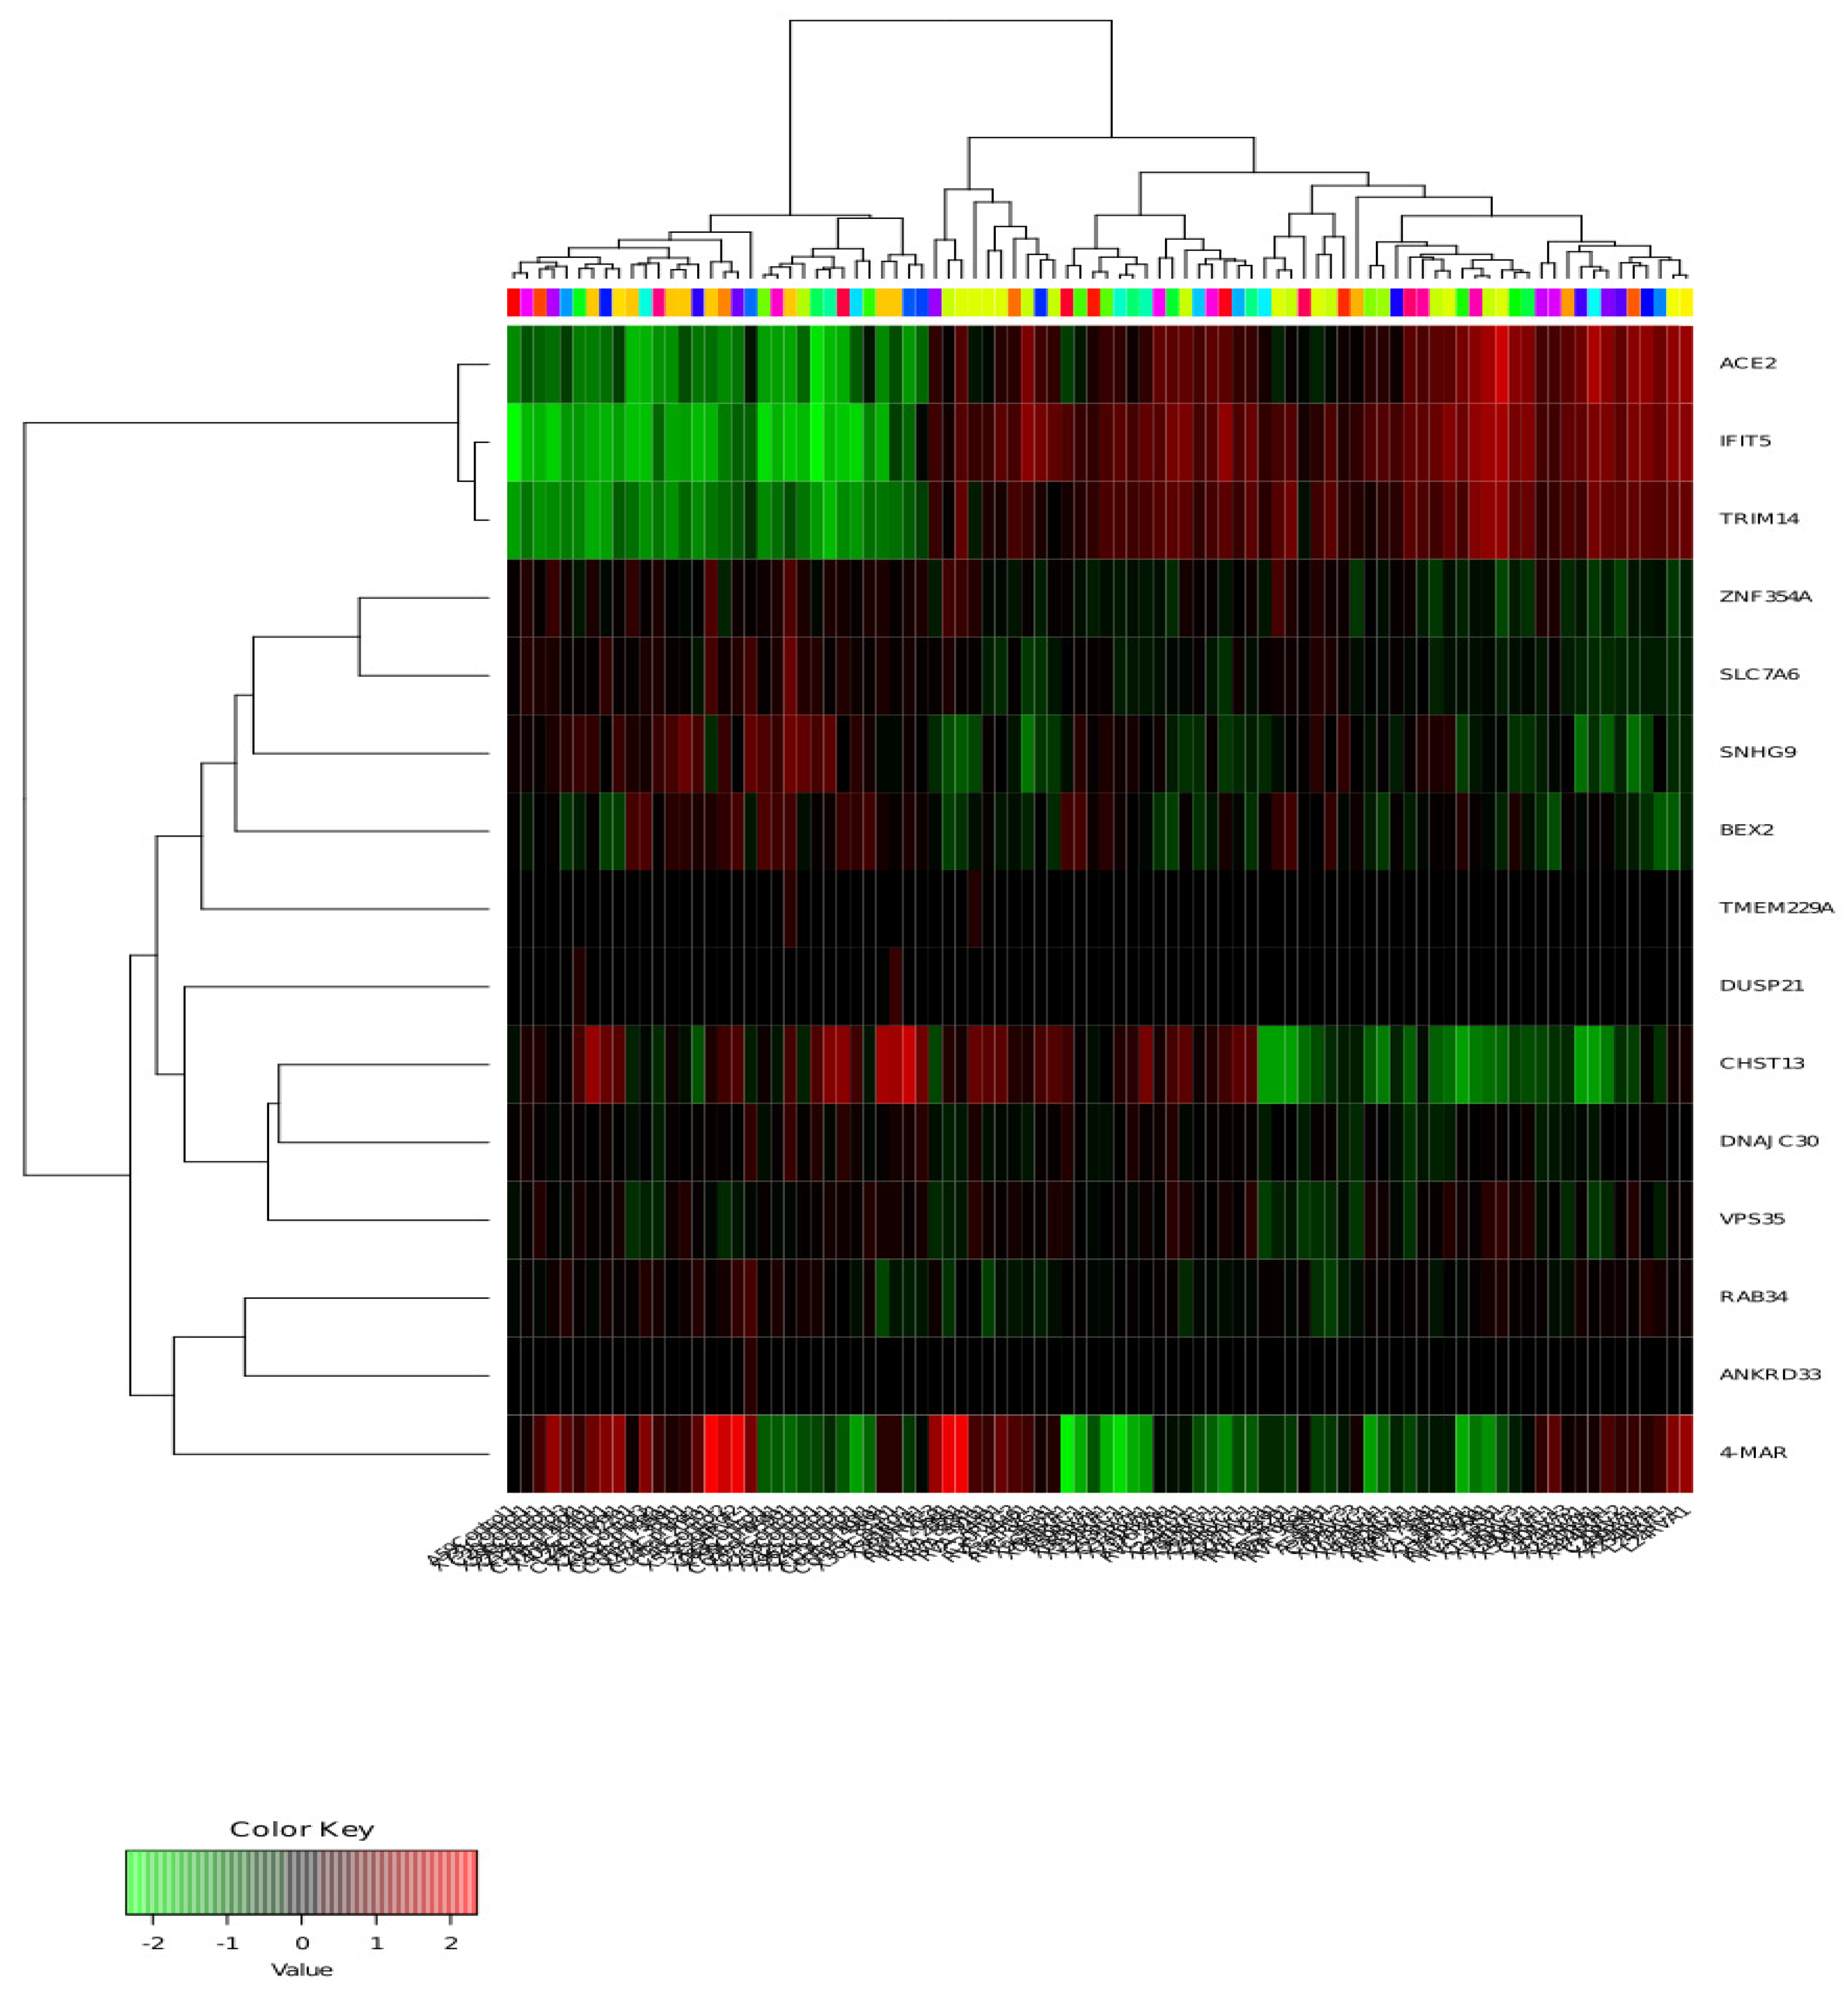
In order to enhance the predictive accuracy of ACE2 in COVID-19 diagnosis, the selected genes obtained using the proposed method were compared with the ACE2 gene, and genes were identified through LASSO regression. Figure 9 illustrates a heatmap presenting the ACE2 gene and the genes selected through LASSO regression. Displaying gene expression data as a heatmap is a popular way to visualize it. A heatmap can also be used in conjunction with clustering techniques, which pair together genes and/or datasets based on how similarly their genes are expressed. This can be helpful for determining the biological signatures linked to a specific situation (such as disease or an environmental condition) or genes that are frequently regulated.
The heatmap displayed in Figure 9 indicates that the expressions of ACE2, IFIT5, and TRIM14 were almost identical, and the proposed algorithm selected them. This implies that IFIT5 and TRIM14 share the characteristics of ACE2, which is a COVID-19-related gene. ACE2, also known as ACEH, may play opposing roles in health and disease. The COVID-19 virus uses the ACE2 receptor to enter human cells, and this receptor is found in almost all organs of the body [42,43]. In addition, BEX2 and SNHG9 show similarities in their up and downregulated genes, but they are not related to COVID-19 symptoms. According to “the National Library of Medicine” website, BEX2, and SNHG9 genes have no connection with COVID-19 symptoms.

5. Conclusions

This paper introduced the binary reptile search algorithm (BRSA), an extension of the reptile search algorithm (RSA), which is critical for enhancing the performance of machine learning algorithms and delivering superior results in gene selection problems. The proposed method is divided into two stages. First, the LASSO regression method is utilized to select 14 genes (as shown in Table 3). Next, the identified gene subset is passed through the BRSA to extract the most significant genes. The SVM was selected as the best classifier among KNN and RF as classification models, with an average classification accuracy of 87.22 % . Out of the four sigmoid transfer functions, S 4 proved the optimal choice, with a high average classification accuracy; moreover, the F-measure was introduced as a fitness function in BRSA. Finally, the performance of the proposed method was evaluated using COVID-19 gene expression data.
The effectiveness of the BRSA was compared with existing binary metaheuristic algorithms, which identified that the BRSA outperformed the others, with a higher accuracy. Evaluating the proposed method with a COVID-19 dataset yielded even better results, with a higher average classification accuracy, a higher average fitness value, and fewer features than the existing methods. Using BRSA, six significant genes were selected (BEX2, CHST13, DUSP21, IFIT5, SNHG9, and TRIM14), and the heatmap revealed that there were similarities between ACE2, IFIT5, and TRIM14. As ACE2 is a COVID-19-related gene, we could conclude that IFIT5 and TRIM14 are likely to be classified as COVID-19-related genes. However, the performance of the proposed method was limited when working with an unbalanced dataset.
As the importance of feature selection in machine learning continues to grow, there is a need for further research to improve its efficiency. This study lays a foundation for future research to enhance feature selection. Other supervised learning algorithms, such as logistic regression [44], naive Bayes [45], and decision trees [46], could be incorporated to improve performance. Additionally, combining the BRSA with various continuous metaheuristic algorithms and their binary counterparts could create a new hybrid algorithm to solve feature selection problems. The proposed method has potential applications in various real-world domains. To further improve the classification accuracy, state-of-the-art filter feature selection methods such as MRMR [47] and Relief [48] could be integrated with the current method. In addition, our study’s main contribution was identifying genes associated with COVID-19 through an analysis of the GSE149273 dataset with a modified binary optimization algorithm, and this work did not extensively delve into the generalizability aspect using various benchmark datasets. Hence, we will further validate and refine our new algorithm through comparisons with additional datasets in future work. Moreover, since most modern analyses are in fact performed using RNA seq [49], for data modeling, we may further modify our method to handle new challenges, e.g., discrete count-based expression, overdispersion, normalization, batch effects, and reference integration.

Author Contributions

G.K.: Methodology, Software; H.J.: Writing—Reviewing and Editing; J.W.: Writing—Reviewing and Editing; C.L.: Writing—Reviewing and Editing; Y.-G.W.: Writing—Reviewing and Editing. All authors have read and agreed to the published version of the manuscript.

Funding

This work was supported by an Australian Research Council project (grant number DP160104292), a Ministry of Education of Humanities and Social Science project (22YJC630083), a Chunhui Program Collaborative Scientific Research Project (202202004), and a 2022 Shanghai Chenguang Scholars Program (22CGA82).

Institutional Review Board Statement

Not applicable.

Informed Consent Statement

Not applicable.

Data Availability Statement

The source code will be available when the work is published.

Conflicts of Interest

The authors declare that they have no known competing financial interest or personal relationships that could have appeared to influence the work reported in this paper.

References

  1. Govindarajan, R.; Duraiyan, J.; Kaliyappan, K.; Palanisamy, M. Microarray and its applications. J. Pharm. Bioallied Sci. 2012, 4, S310. [Google Scholar] [PubMed]
  2. Bolón-Canedo, V.; Sánchez-Maroño, N.; Alonso-Betanzos, A. An ensemble of filters and classifiers for microarray data classification. Pattern Recognit. 2012, 45, 531–539. [Google Scholar] [CrossRef]
  3. Miao, M.; Wu, J.; Cai, F.; Wang, Y.G. A modified memetic algorithm with an application to gene selection in a sheep body weight study. Animals 2022, 12, 201. [Google Scholar] [CrossRef]
  4. Xiong, M.; Fang, X.; Zhao, J. Biomarker identification by feature wrappers. Genome Res. 2001, 11, 1878–1887. [Google Scholar] [CrossRef]
  5. Lai, C.; Reinders, M.J.; van’t Veer, L.J.; Wessels, L.F. A comparison of univariate and multivariate gene selection techniques for classification of cancer datasets. BMC Bioinform. 2006, 7, 235. [Google Scholar] [CrossRef] [PubMed]
  6. Sánchez-Maroño, N.; Alonso-Betanzos, A.; Tombilla-Sanromán, M. Filter methods for feature selection–a comparative study. In Proceedings of the International Conference on Intelligent Data Engineering and Automated Learning, Birmingham, UK, 16–19 December 2007; Springer: Berlin/Heidelberg, Germany, 2007; pp. 178–187. [Google Scholar]
  7. Maldonado, S.; Weber, R. A wrapper method for feature selection using support vector machines. Inf. Sci. 2009, 179, 2208–2217. [Google Scholar] [CrossRef]
  8. Hsu, H.H.; Hsieh, C.W.; Lu, M.D. Hybrid feature selection by combining filters and wrappers. Expert Syst. Appl. 2011, 38, 8144–8150. [Google Scholar] [CrossRef]
  9. Lal, T.N.; Chapelle, O.; Weston, J.; Elisseeff, A. Embedded methods. In Feature Extraction; Springer: Berlin/Heidelberg, Germany, 2006; pp. 137–165. [Google Scholar]
  10. Alomari, O.A.; Khader, A.T.; Al-Betar, M.A.; Awadallah, M.A. A novel gene selection method using modified MRMR and hybrid bat-inspired algorithm with β-hill climbing. Appl. Intell. 2018, 48, 4429–4447. [Google Scholar] [CrossRef]
  11. Gao, L.; Ye, M.; Lu, X.; Huang, D. Hybrid method based on information gain and support vector machine for gene selection in cancer classification. Genom. Proteom. Bioinform. 2017, 15, 389–395. [Google Scholar] [CrossRef]
  12. Almutiri, T.; Saeed, F. Chi square and support vector machine with recursive feature elimination for gene expression data classification. In Proceedings of the 2019 First International Conference of Intelligent Computing and Engineering (ICOICE), Hadhramout, Yemen, 15–16 December 2019; pp. 1–6. [Google Scholar]
  13. Katoch, S.; Chauhan, S.S.; Kumar, V. A review on genetic algorithm: Past, present, and future. Multimed. Tools Appl. 2021, 80, 8091–8126. [Google Scholar] [CrossRef]
  14. Mirjalili, S.; Lewis, A. The whale optimization algorithm. Adv. Eng. Softw. 2016, 95, 51–67. [Google Scholar] [CrossRef]
  15. Dorigo, M.; Birattari, M.; Stutzle, T. Ant colony optimization. IEEE Comput. Intell. Mag. 2006, 1, 28–39. [Google Scholar] [CrossRef]
  16. Taşgetiren, M.F.; Liang, Y.C. A binary particle swarm optimization algorithm for lot sizing problem. J. Econ. Soc. Res. 2003, 5, 1–20. [Google Scholar]
  17. Emary, E.; Zawbaa, H.M.; Hassanien, A.E. Binary grey wolf optimization approaches for feature selection. Neurocomputing 2016, 172, 371–381. [Google Scholar] [CrossRef]
  18. Mafarja, M.M.; Eleyan, D.; Jaber, I.; Hammouri, A.; Mirjalili, S. Binary dragonfly algorithm for feature selection. In Proceedings of the 2017 International Conference on New Trends in Computing Sciences (ICTCS), Amman, Jordan, 11–13 October 2017; pp. 12–17. [Google Scholar]
  19. Hambali, M.A.; Oladele, T.O.; Adewole, K.S. Microarray cancer feature selection: Review, challenges and research directions. Int. J. Cogn. Comput. Eng. 2020, 1, 78–97. [Google Scholar] [CrossRef]
  20. Shukla, A.K.; Tripathi, D. Identification of potential biomarkers on microarray data using distributed gene selection approach. Math. Biosci. 2019, 315, 108230. [Google Scholar] [CrossRef]
  21. Mafarja, M.; Mirjalili, S. Whale optimization approaches for wrapper feature selection. Appl. Soft Comput. 2018, 62, 441–453. [Google Scholar] [CrossRef]
  22. Al-Betar, M.A.; Alomari, O.A.; Abu-Romman, S.M. A TRIZ-inspired bat algorithm for gene selection in cancer classification. Genomics 2020, 112, 114–126. [Google Scholar] [CrossRef]
  23. Tabakhi, S.; Moradi, P. Relevance–redundancy feature selection based on ant colony optimization. Pattern Recognit. 2015, 48, 2798–2811. [Google Scholar] [CrossRef]
  24. Mirjalili, S.; Mirjalili, S.M.; Lewis, A. Grey wolf optimizer. Adv. Eng. Softw. 2014, 69, 46–61. [Google Scholar] [CrossRef]
  25. Abualigah, L.; Abd Elaziz, M.; Sumari, P.; Geem, Z.W.; Gandomi, A.H. Reptile Search Algorithm (RSA): A nature-inspired meta-heuristic optimizer. Expert Syst. Appl. 2022, 191, 116158. [Google Scholar] [CrossRef]
  26. Yuan, Q.; Zhang, Y.; Dai, X.; Zhang, S. A Modified Reptile Search Algorithm for Numerical Optimization Problems. Comput. Intell. Neurosci. 2022, 2022, 9752003. [Google Scholar] [CrossRef] [PubMed]
  27. Wang, Y.G.; Wu, J.; Hu, Z.H.; McLachlan, G.J. A new algorithm for support vector regression with automatic selection of hyperparameters. Pattern Recognit. 2023, 133, 108989. [Google Scholar] [CrossRef]
  28. Speiser, J.L.; Miller, M.E.; Tooze, J.; Ip, E. A comparison of random forest variable selection methods for classification prediction modeling. Expert Syst. Appl. 2019, 134, 93–101. [Google Scholar] [CrossRef]
  29. Maleki, N.; Zeinali, Y.; Niaki, S.T.A. A k-NN method for lung cancer prognosis with the use of a genetic algorithm for feature selection. Expert Syst. Appl. 2021, 164, 113981. [Google Scholar] [CrossRef]
  30. Tibshirani, R. Regression shrinkage and selection via the lasso. J. R. Stat. Soc. Ser. B (Methodol.) 1996, 58, 267–288. [Google Scholar] [CrossRef]
  31. Homrighausen, D.; McDonald, D. The lasso, persistence, and cross-validation. In Proceedings of the International Conference on Machine Learning, Atlanta, GA, USA, 17–19 June 2013; pp. 1031–1039. [Google Scholar]
  32. Krstajic, D.; Buturovic, L.J.; Leahy, D.E.; Thomas, S. Cross-validation pitfalls when selecting and assessing regression and classification models. J. Cheminformatics 2014, 6, 10. [Google Scholar] [CrossRef]
  33. Haq, A.U.; Li, J.P.; Memon, M.H.; Nazir, S.; Sun, R. A hybrid intelligent system framework for the prediction of heart disease using machine learning algorithms. Mob. Inf. Syst. 2018, 2018, 3860146. [Google Scholar] [CrossRef]
  34. Lee, Y.; Lin, Y.; Wahba, G. Multicategory support vector machines: Theory and application to the classification of microarray data and satellite radiance data. J. Am. Stat. Assoc. 2004, 99, 67–81. [Google Scholar] [CrossRef]
  35. Pisner, D.A.; Schnyer, D.M. Support vector machine. In Machine Learning; Elsevier: Amsterdam, The Netherlands, 2020; pp. 101–121. [Google Scholar]
  36. Chang, C.C.; Lin, C.J. LIBSVM: A library for support vector machines. Acm Trans. Intell. Syst. Technol. (TIST) 2011, 2, 27. [Google Scholar] [CrossRef]
  37. Truong, T.K. Different transfer functions for binary particle swarm optimization with a new encoding scheme for discounted {0-1} knapsack problem. Math. Probl. Eng. 2021, 2021, 2864607. [Google Scholar] [CrossRef]
  38. Chang, E.H.; Willis, A.L.; Romanoski, C.E.; Cusanovich, D.A.; Pouladi, N.; Li, J.; Lussier, Y.A.; Martinez, F.D. Rhinovirus infections in individuals with asthma increase ACE2 expression and cytokine pathways implicated in COVID-19. Am. J. Respir. Crit. Care Med. 2020, 202, 753–755. [Google Scholar] [CrossRef] [PubMed]
  39. Demšar, J. Statistical comparisons of classifiers over multiple data sets. J. Mach. Learn. Res. 2006, 7, 1–30. [Google Scholar]
  40. Benavoli, A.; Corani, G.; Demšar, J.; Zaffalon, M. Time for a change: A tutorial for comparing multiple classifiers through Bayesian analysis. J. Mach. Learn. Res. 2017, 18, 2653–2688. [Google Scholar]
  41. Friedman, M. A comparison of alternative tests of significance for the problem of m rankings. Ann. Math. Stat. 1940, 11, 86–92. [Google Scholar] [CrossRef]
  42. Snouwaert, J.N.; Jania, L.A.; Nguyen, T.; Martinez, D.R.; Schäfer, A.; Catanzaro, N.J.; Gully, K.L.; Baric, R.S.; Heise, M.; Ferris, M.T.; et al. Human ACE2 expression, a major tropism determinant for SARS-CoV-2, is regulated by upstream and intragenic elements. PLoS Pathog. 2023, 19, e1011168. [Google Scholar] [CrossRef]
  43. Ren, W.; Zhu, Y.; Wang, Y.; Shi, H.; Yu, Y.; Hu, G.; Feng, F.; Zhao, X.; Lan, J.; Wu, J.; et al. Comparative analysis reveals the species-specific genetic determinants of ACE2 required for SARS-CoV-2 entry. PLoS Pathog. 2021, 17, e1009392. [Google Scholar] [CrossRef]
  44. LaValley, M.P. Logistic regression. Circulation 2008, 117, 2395–2399. [Google Scholar] [CrossRef]
  45. Rish, I. An empirical study of the naive Bayes classifier. In Proceedings of the IJCAI 2001 Workshop on Empirical Methods In Artificial Intelligence, Seattle, WA, USA, 4–10 August 2001; Volume 3, pp. 41–46. [Google Scholar]
  46. Song, Y.Y.; Ying, L. Decision tree methods: Applications for classification and prediction. Shanghai Arch. Psychiatry 2015, 27, 130. [Google Scholar]
  47. Mundra, P.A.; Rajapakse, J.C. SVM-RFE with MRMR filter for gene selection. IEEE Trans. Nanobioscience 2009, 9, 31–37. [Google Scholar] [CrossRef]
  48. Urbanowicz, R.J.; Meeker, M.; La Cava, W.; Olson, R.S.; Moore, J.H. Relief-based feature selection: Introduction and review. J. Biomed. Inform. 2018, 85, 189–203. [Google Scholar] [CrossRef] [PubMed]
  49. Zhang, Z.H.; Jhaveri, D.J.; Marshall, V.M.; Bauer, D.C.; Edson, J.; Narayanan, R.K.; Robinson, G.J.; Lundberg, A.E.; Bartlett, P.F.; Wray, N.R.; et al. A comparative study of techniques for differential expression analysis on RNA-Seq data. PLoS ONE 2014, 9, e103207. [Google Scholar] [CrossRef] [PubMed]
Figure 1. Flow chart of RSA.
Covid 03 00093 g001
Figure 2. Graph of sigmoid transfer functions.
Covid 03 00093 g002
Figure 3. Flow chart of proposed BRSA.
Covid 03 00093 g003
Figure 4. Graph of cross-validation error.
Covid 03 00093 g004
Figure 5. Average classification accuracy of the three different classifiers.
Covid 03 00093 g005
Figure 6. Bar graph of average no. of selected features for the four different transfer functions.
Covid 03 00093 g006
Figure 7. Bar graph of the average accuracy and fitness function of the four different transfer functions.
Covid 03 00093 g007
Figure 8. Convergence graph of different transfer functions.
Covid 03 00093 g008
Figure 9. Heat map of the best subset of genes obtained using the LASSO method.
Covid 03 00093 g009
Table 1. Description of the four sigmoid transfer functions [37].
FunctionFormula
S 1 1 / ( 1 + exp ( x ) )
S 2 1 / ( 1 + exp ( x / 2 ) )
S 3 1 / ( 1 + exp ( x / 2 ) )
S 4 1 / ( 1 + exp ( x / 3 ) )
Table 2. Accuracy comparison.
Parameter NameAccuracy
l a m b d a m i n 0.988764
l a m b d a . 1 s e 0.9775281
Original logistic model0.9325843
Table 3. Extracted genes from the LASSO model.
NoGeneNoGene
1ANKRD338RAB34
2BEX29SLC7A6
3CHST1310SNHG9
4DNAJC3011TMEM229A
5DUSP2112TRIM14
6IFIT513VPS35
7X4.Mar14ZNF354A
Table 4. Mean and standard deviation of the classification accuracy of the three classifiers.
All Genes without BRSATop Genes with BRSA
KNNSVMRFKNNSVMRF
Mean0.655570.68890.733320.827770.872220.77776
STD0.116530.095150.125050.040980.045730.08282
Table 5. Performance of the evaluation matrices.
S 1 S 2 S 3 S 4
AccuracyAVG0.86110.85830.86670.8722
STD0.04940.05250.05220.0480
Best0.94440.94440.94440.9444
Worst0.77780.77780.77780.7778
F-measureAVG0.86960.86960.87570.8789
STD0.04720.04660.05040.0475
Best0.94740.94740.94740.9474
Worst0.77780.80000.77780.7778
PrecisionAVG0.82380.81540.82530.8444
STD0.07310.07390.07350.0773
Best0.90000.90000.90000.9000
Worst0.72730.72730.72730.7500
SensitivityAVG0.92780.92640.93200.9208
STD0.09030.07770.10050.0984
Best1.00001.00001.00001.0000
Worst0.77780.75000.75000.7500
SpecificityAVG0.80000.79450.80560.8278
STD0.11170.10980.10740.0986
Best1.00001.00001.00001.0000
Worst0.66670.66670.66670.6667
No. of selected featuresAVG6.65006.15006.25006.0500
STD1.72521.69441.77331.3169
Best3.00004.00004.00004.0000
Worst10.000011.00009.00009.0000
Table 6. Comparison of BRSA with the other algorithms based on evaluation matrices.
BRSABDABPSOBGWO1BGWO2
AccuracyAVG0.84720.82780.82500.78060.8194
STD0.04720.05950.09240.04590.0740
Best0.88890.94440.94440.88890.9444
Worst0.77780.72220.55560.72220.7222
F-measureAVG0.86240.82610.82550.75760.8091
STD0.03810.05990.08640.06220.0902
Best0.94740.94120.94740.87500.9474
Worst0.80000.71430.70000.70590.6154
PrecisionAVG0.79700.85560.83550.84590.8443
STD0.07720.11960.11260.07950.0909
Best1.00001.00001.00001.00001.0000
Worst0.69230.69230.53850.72730.7273
SensitivityAVG0.95000.82220.83890.70000.7945
STD0.06720.11620.14180.11460.1498
Best1.00001.00001.00001.00001.0000
Worst0.77780.55560.55560.55560.5556
SpecificityAVG0.74440.83340.81110.85560.8445
STD0.11460.14640.15750.09600.1045
Best1.00001.00001.00001.00001.0000
Worst0.55560.55560.66670.66670.6667
No. of selected featuresAVG6.20005.40006.95007.15006.8500
STD1.50791.56941.66941.59851.5985
Best4.00002444
Worst9810910
Table 7. Ranks of accuracy using the Friedman test.
AlgorithmFinal Rank
BRSA1
BDA3
BPSO2
BGWO15
BGWO24
Table 8. Ranks of fitness value using the Friedman test.
AlgorithmFinal Rank
BRSA1
BDA3
BPSO2
BGWO15
BGWO24
Table 9. Ranks of number of selected features using the Friedman test.
AlgorithmFinal Rank
BRSA2
BDA1
BPSO4
BGWO13
BGWO25
Table 10. Proposed prediction model for COVID-19 identification.
Gene IndexGene Name
Covid-19 GSE1492731637BEX2
3527CHST13
5239DUSP21
8554IFIT5
20839SNHG9
23214TRIM14
Disclaimer/Publisher’s Note: The statements, opinions and data contained in all publications are solely those of the individual author(s) and contributor(s) and not of MDPI and/or the editor(s). MDPI and/or the editor(s) disclaim responsibility for any injury to people or property resulting from any ideas, methods, instructions or products referred to in the content.