


Assessing COVID-19 Effects on Inflation, Unemployment, and GDP in Africa: What Do the Data Show via GIS and Spatial Statistics?


Abstract
1. Introduction
Study Background
2. Data Source and Methodology
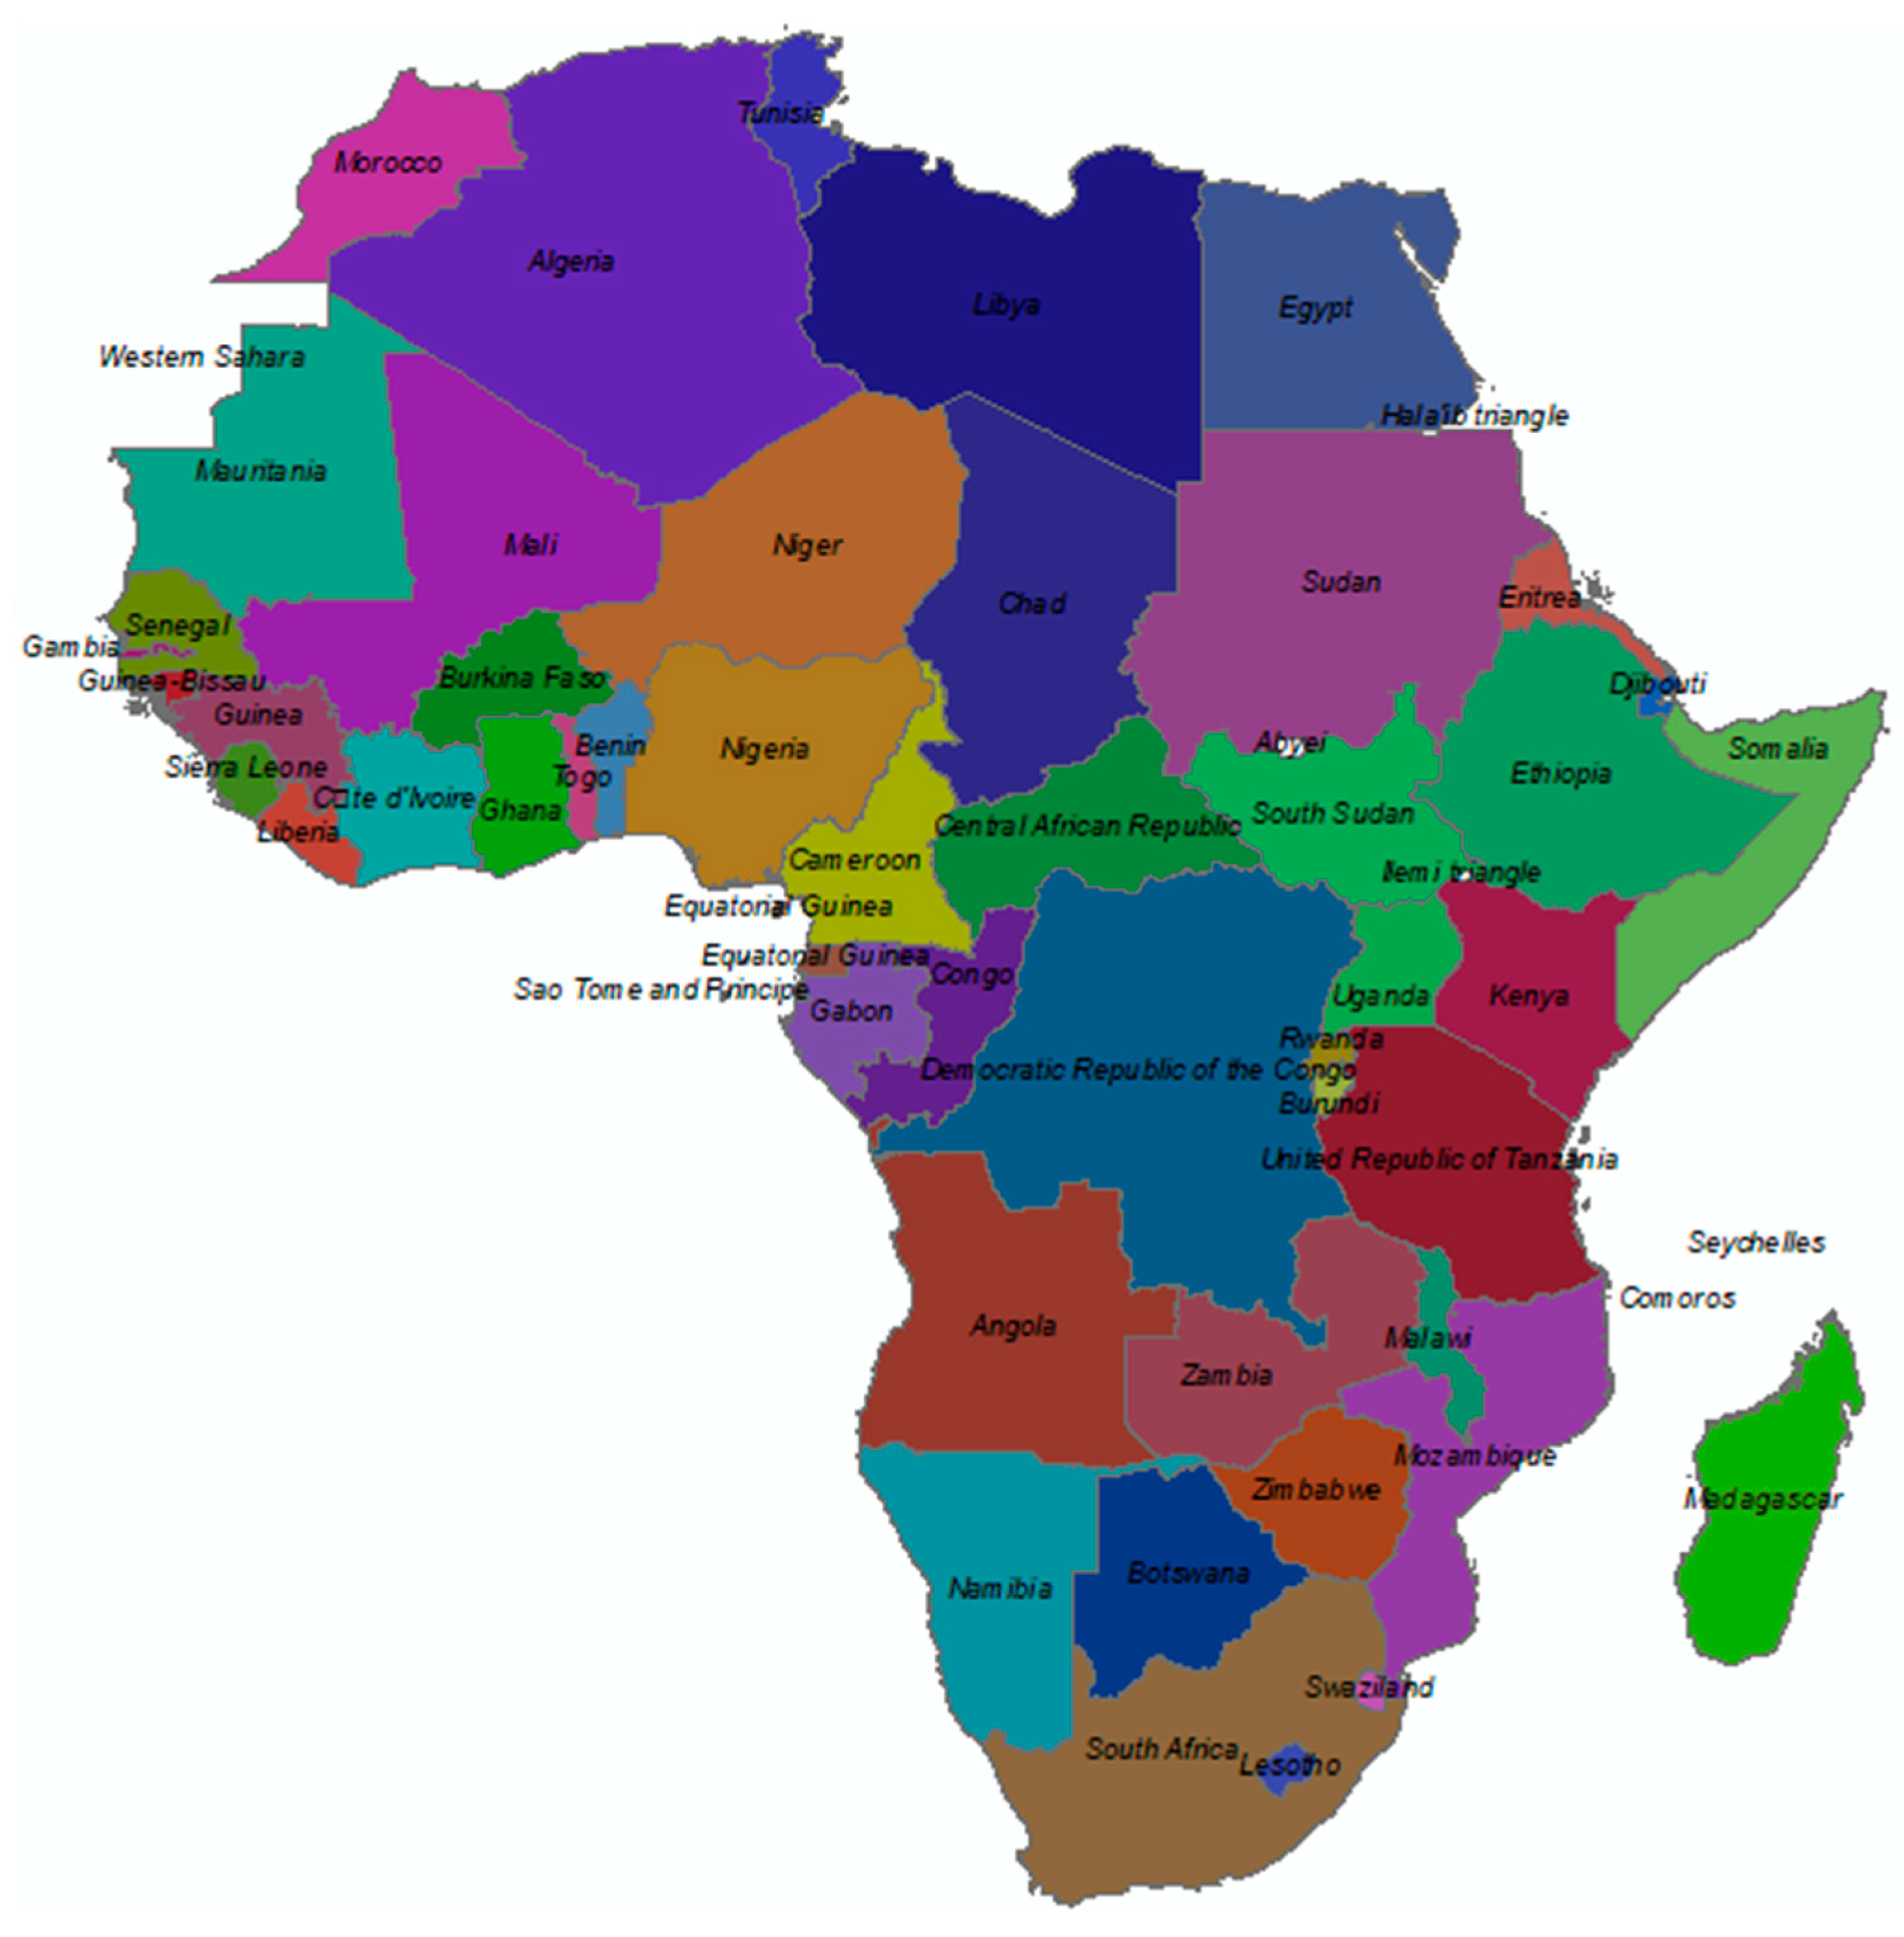
2.1. Study Area and Period
2.2. The Data
2.3. Variable Identification
2.4. Spatial Statistical Analysis
2.4.1. Concept of Spatial Autocorrelation/Dependence
2.4.2. Methods of Measuring Spatial Autocorrelation
Contiguity Spatial Weight Matrix
2.4.3. Test of Global and Local Spatial Autocorrelation
Moran’s I Correlation Analysis
Moran Scatter Plot
2.5. Spatial Statistical Methods of Analysis
3. Results and Discussion
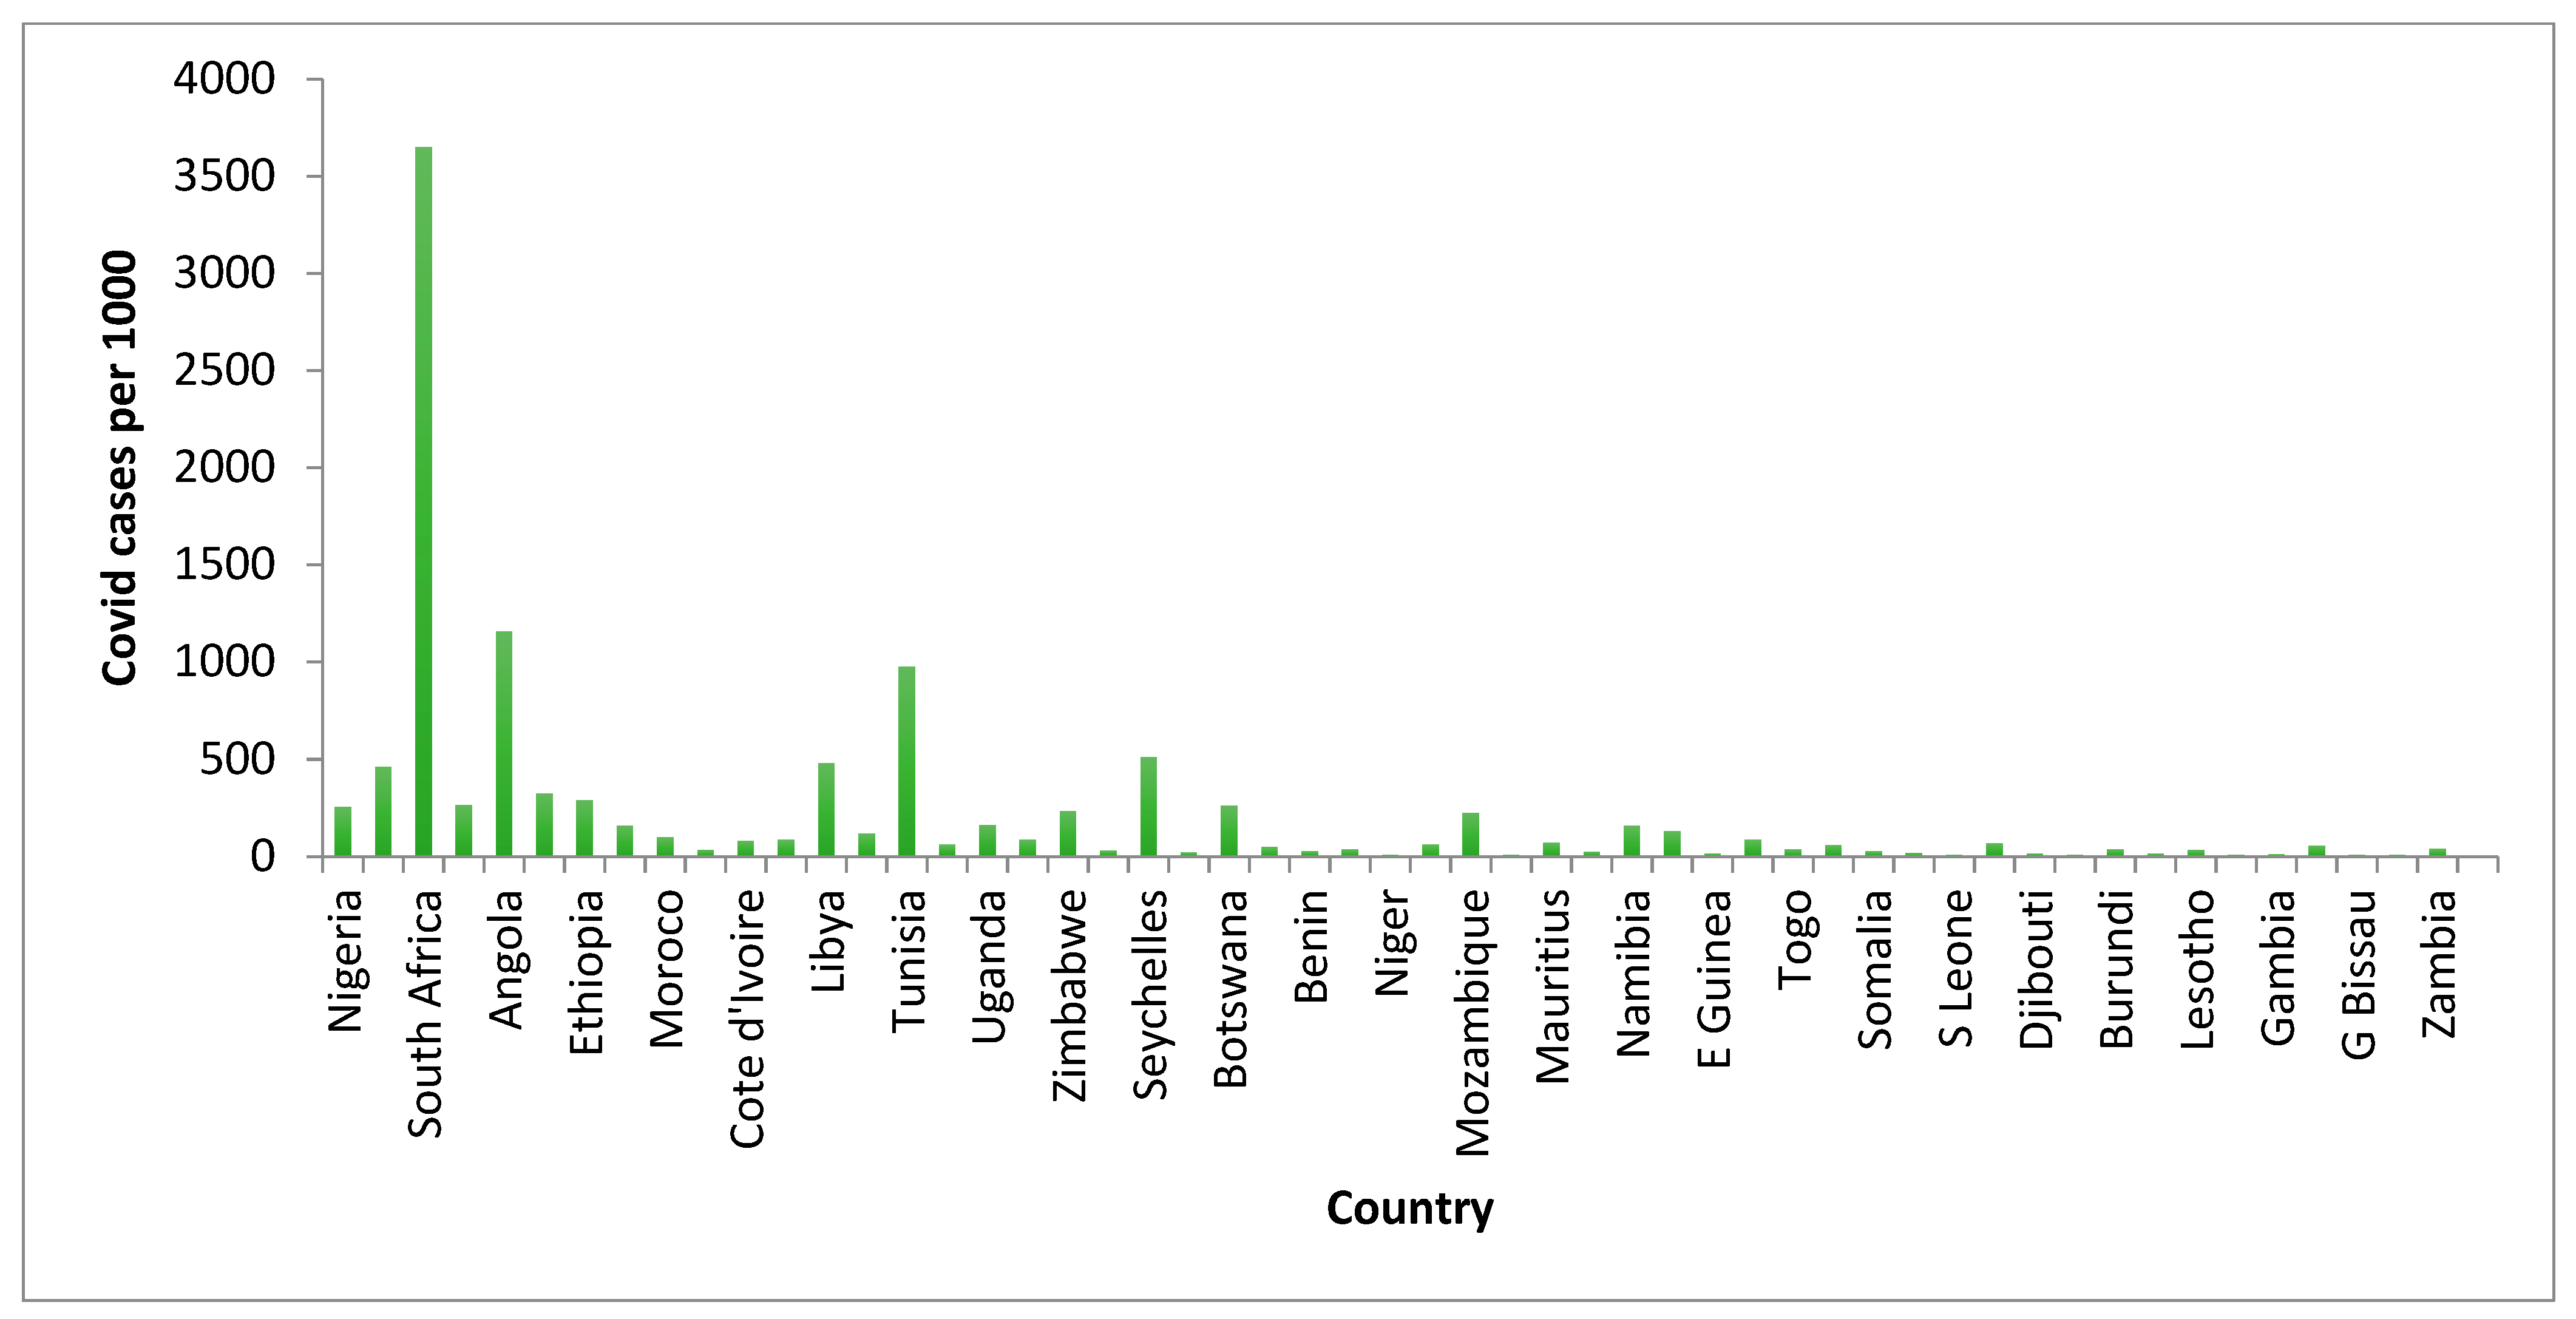
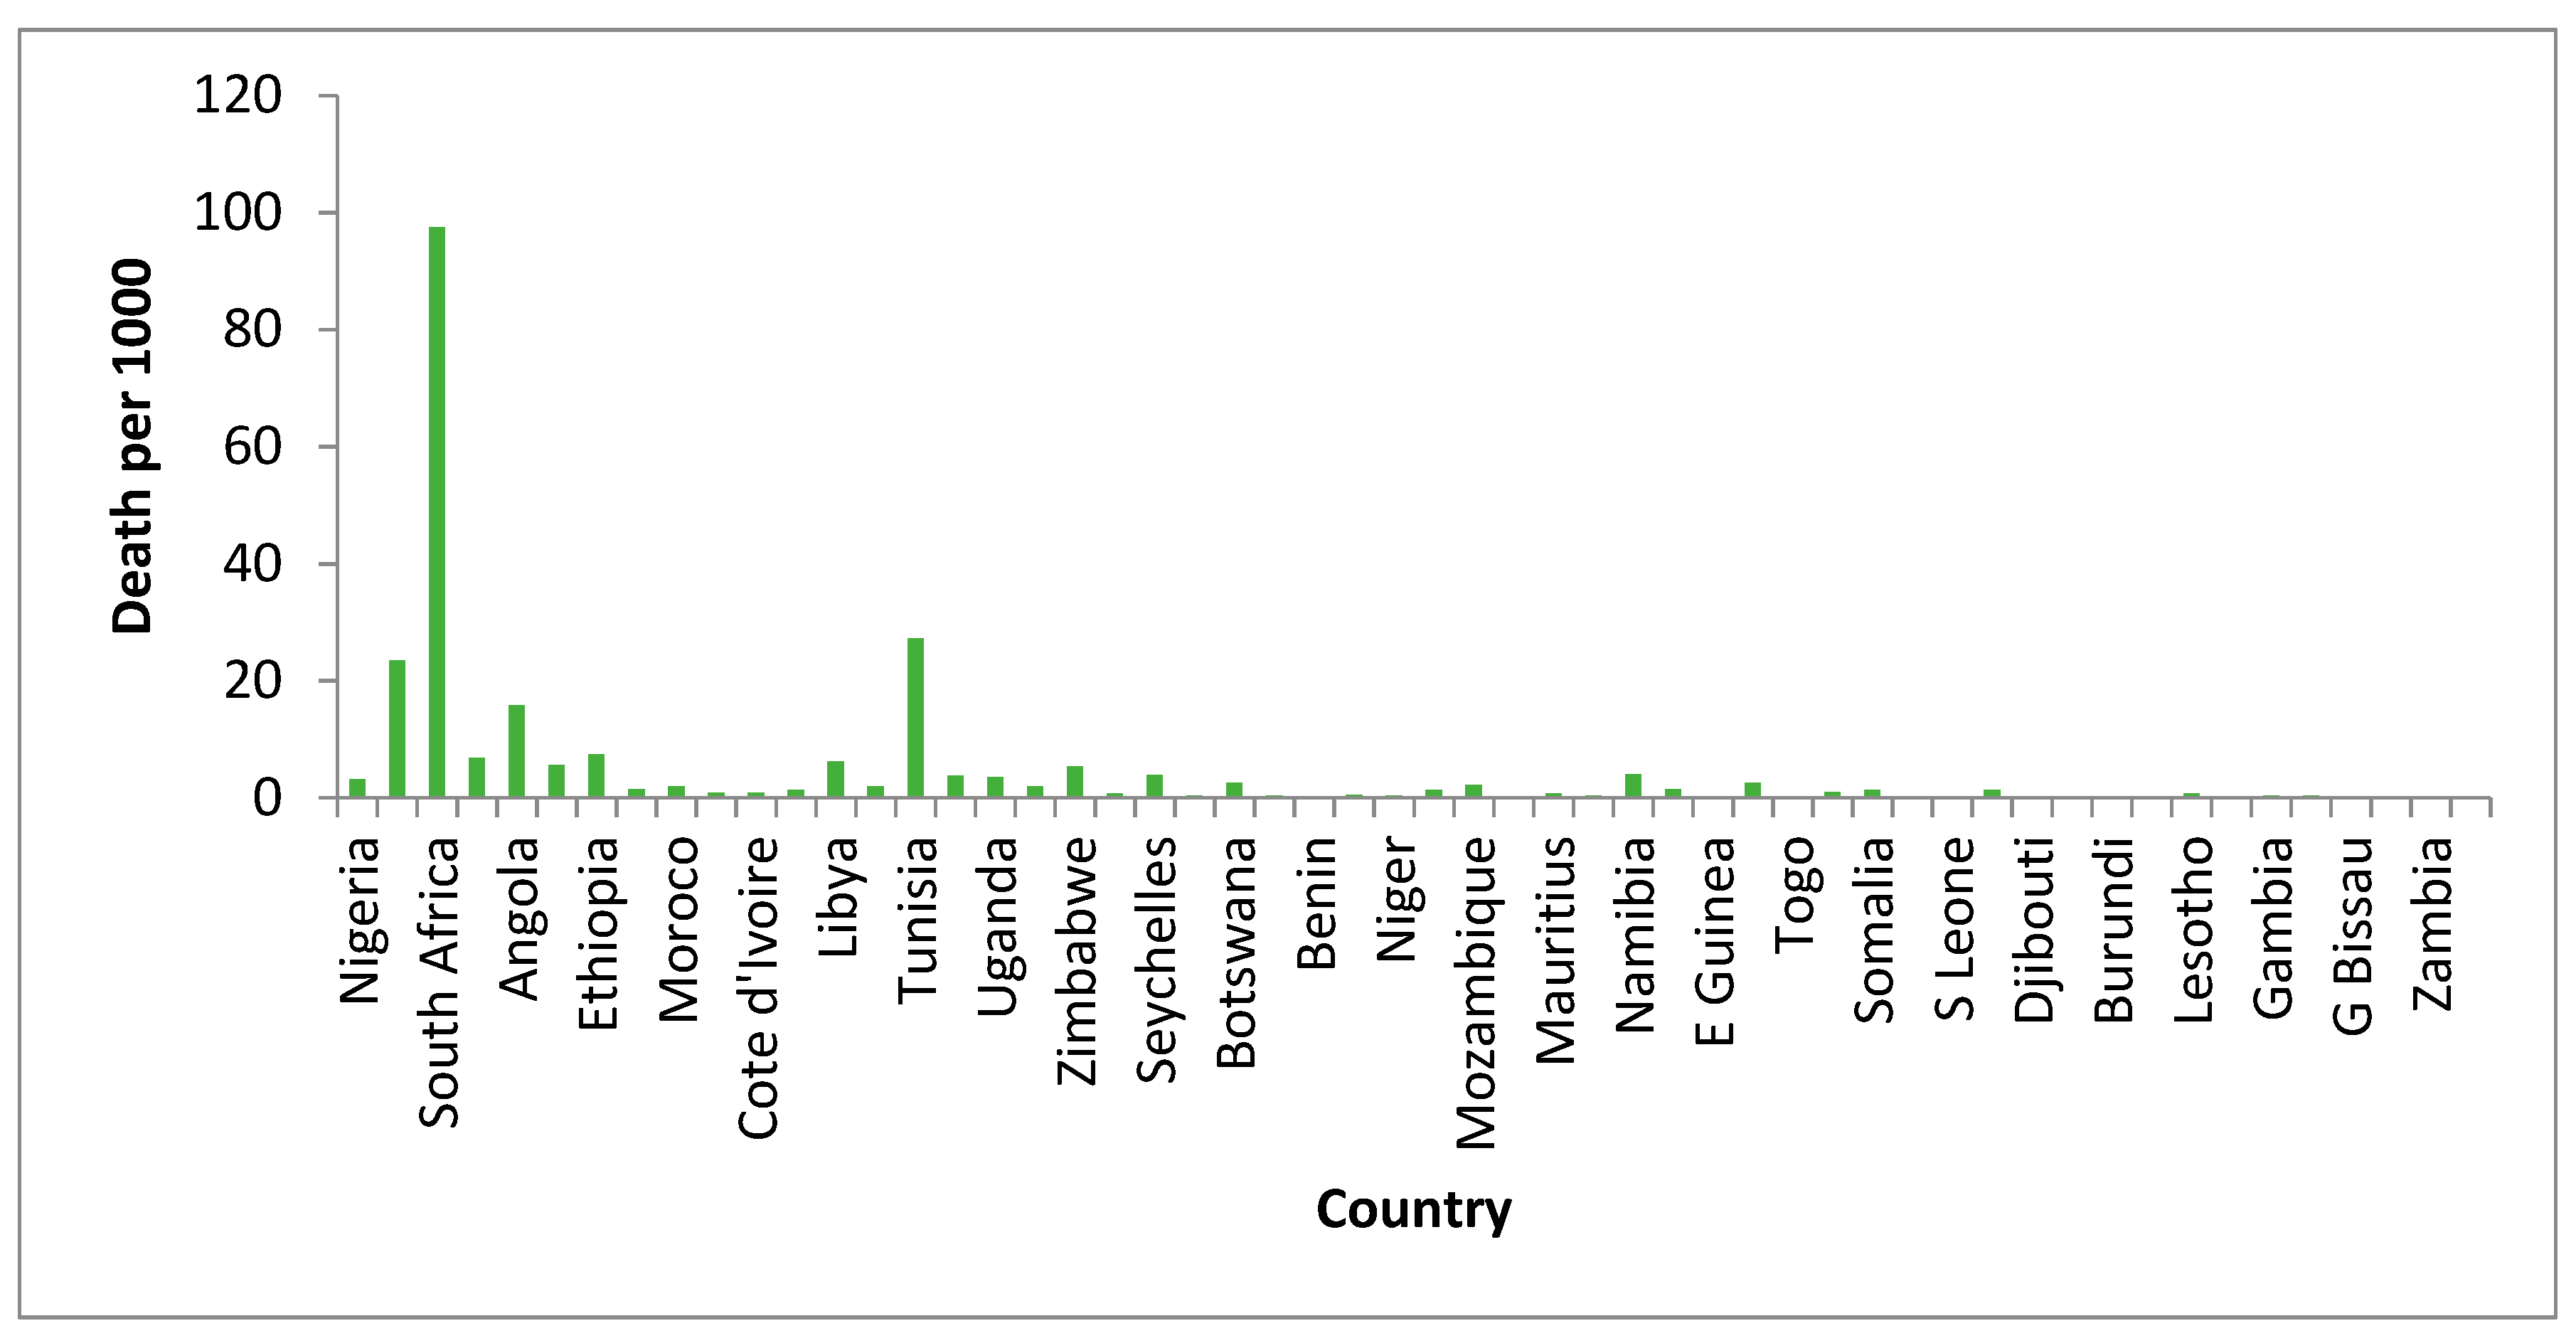
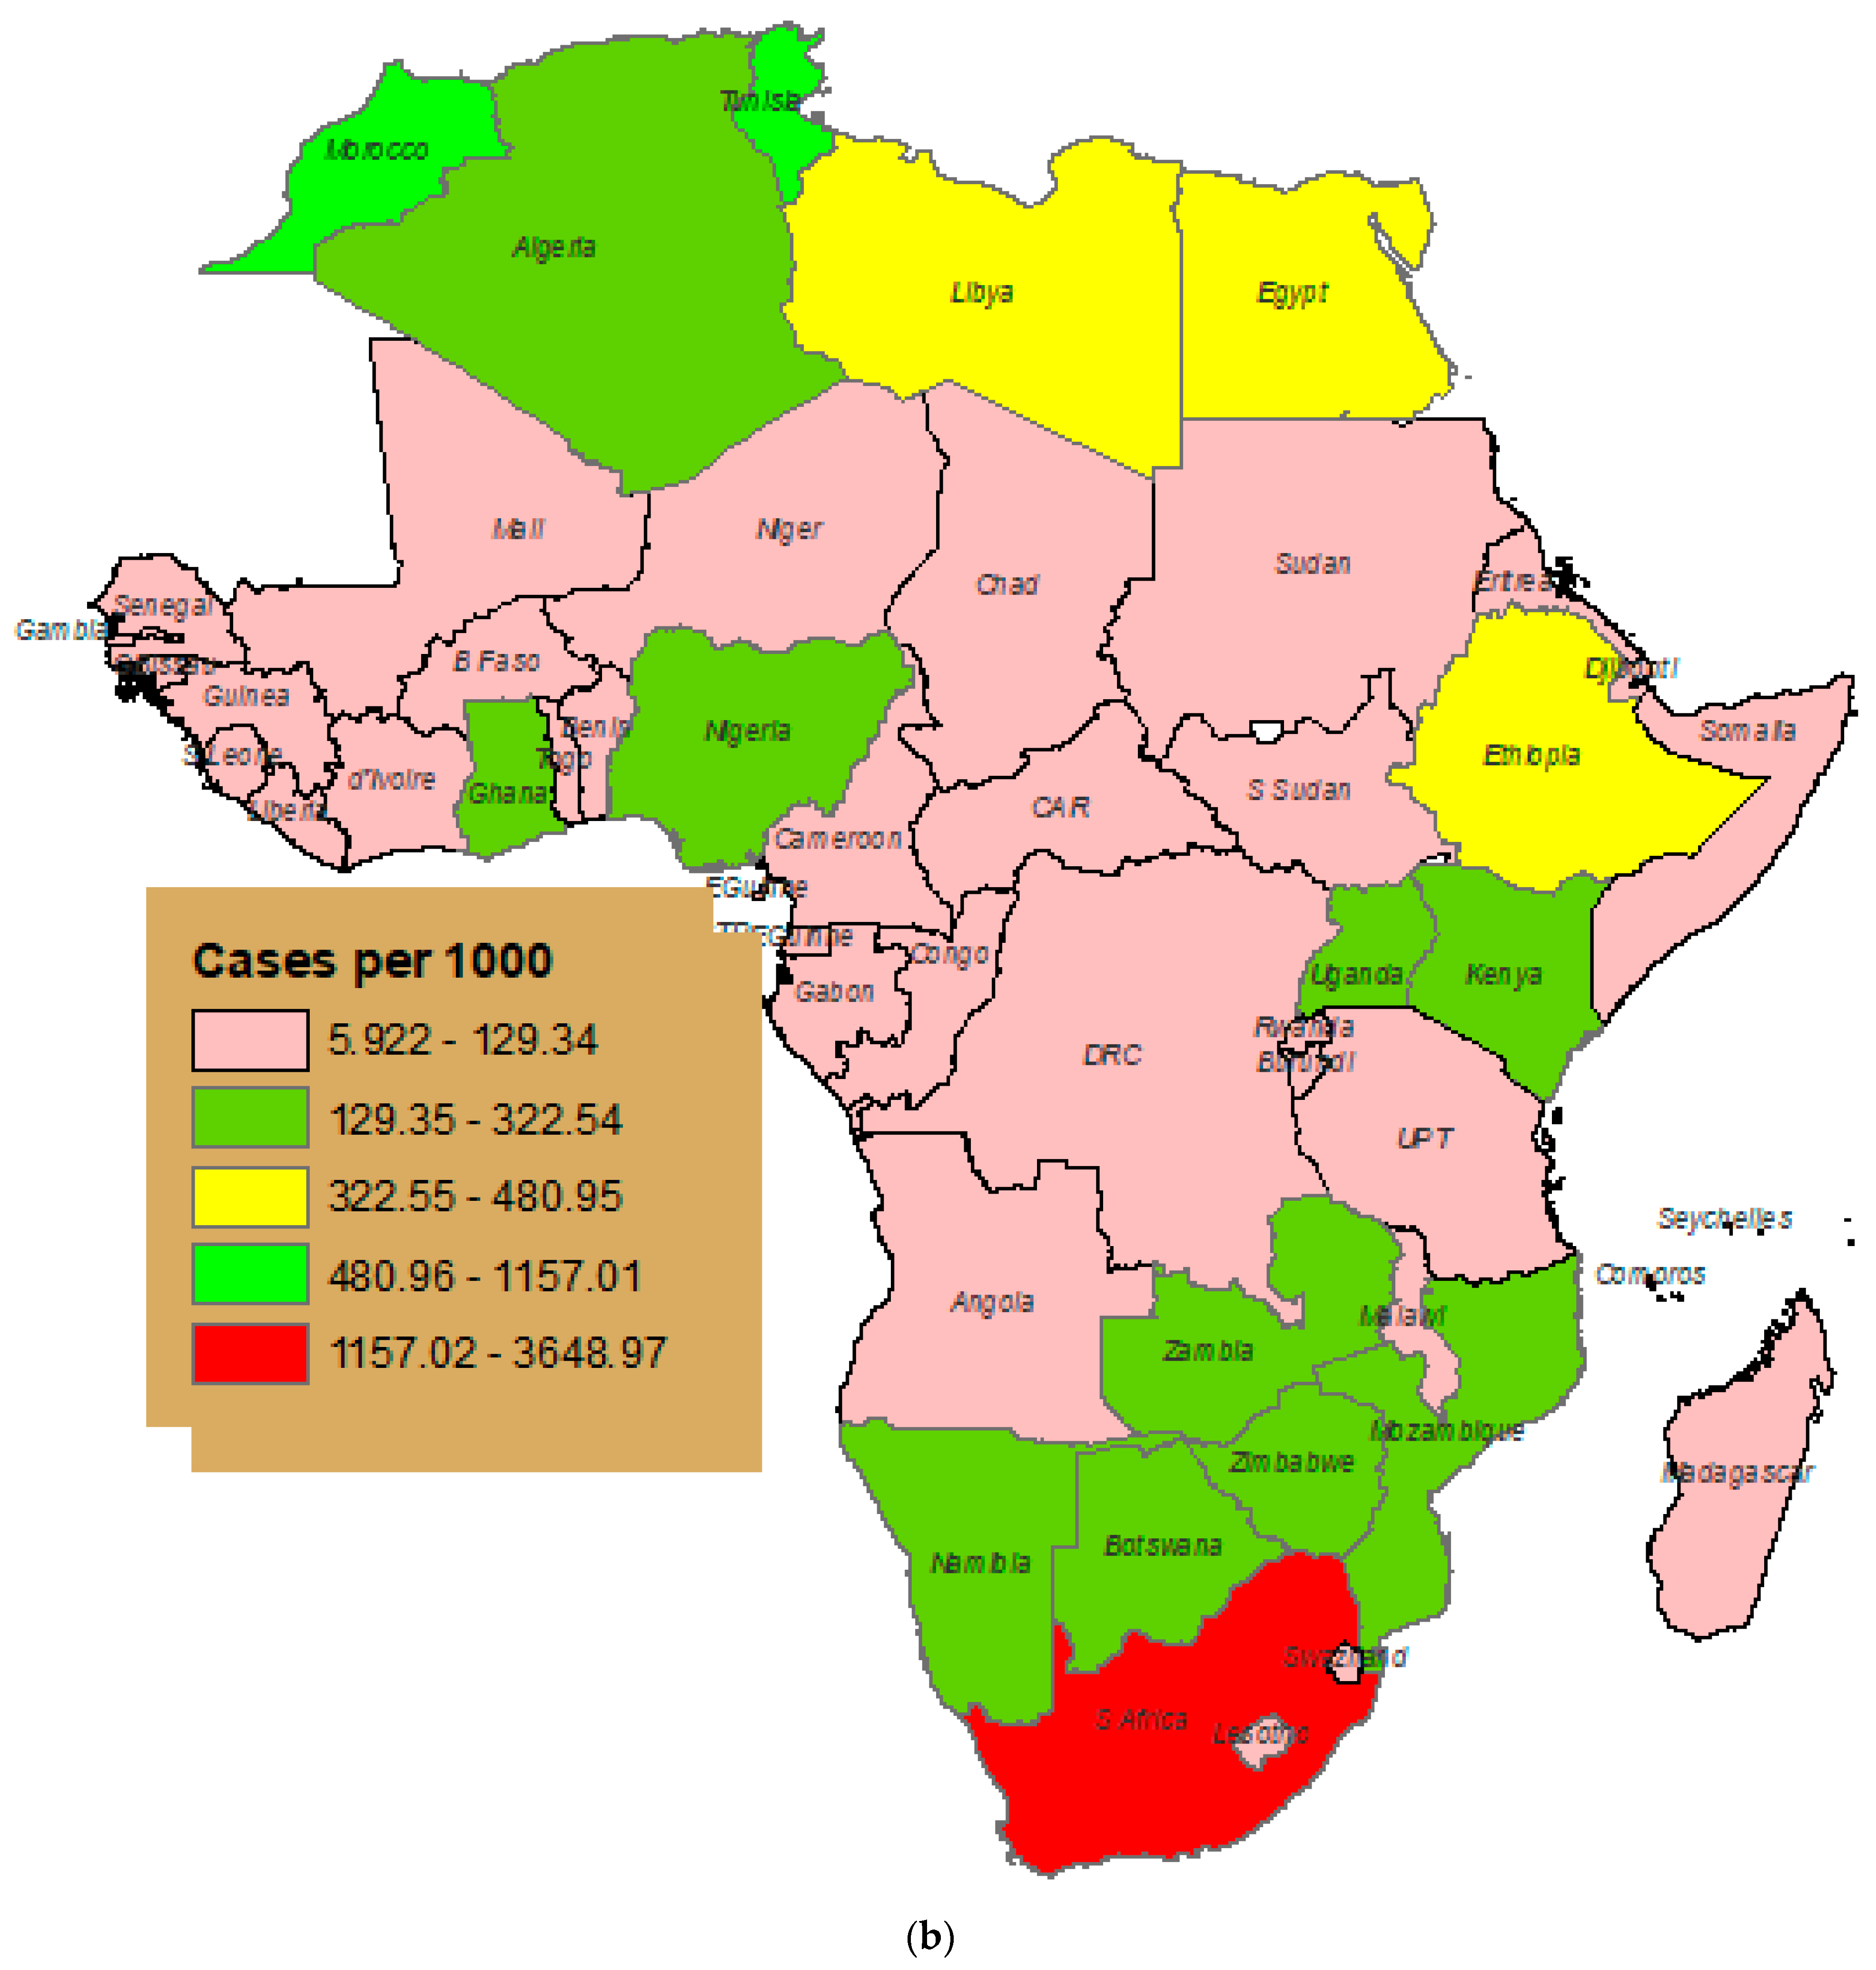
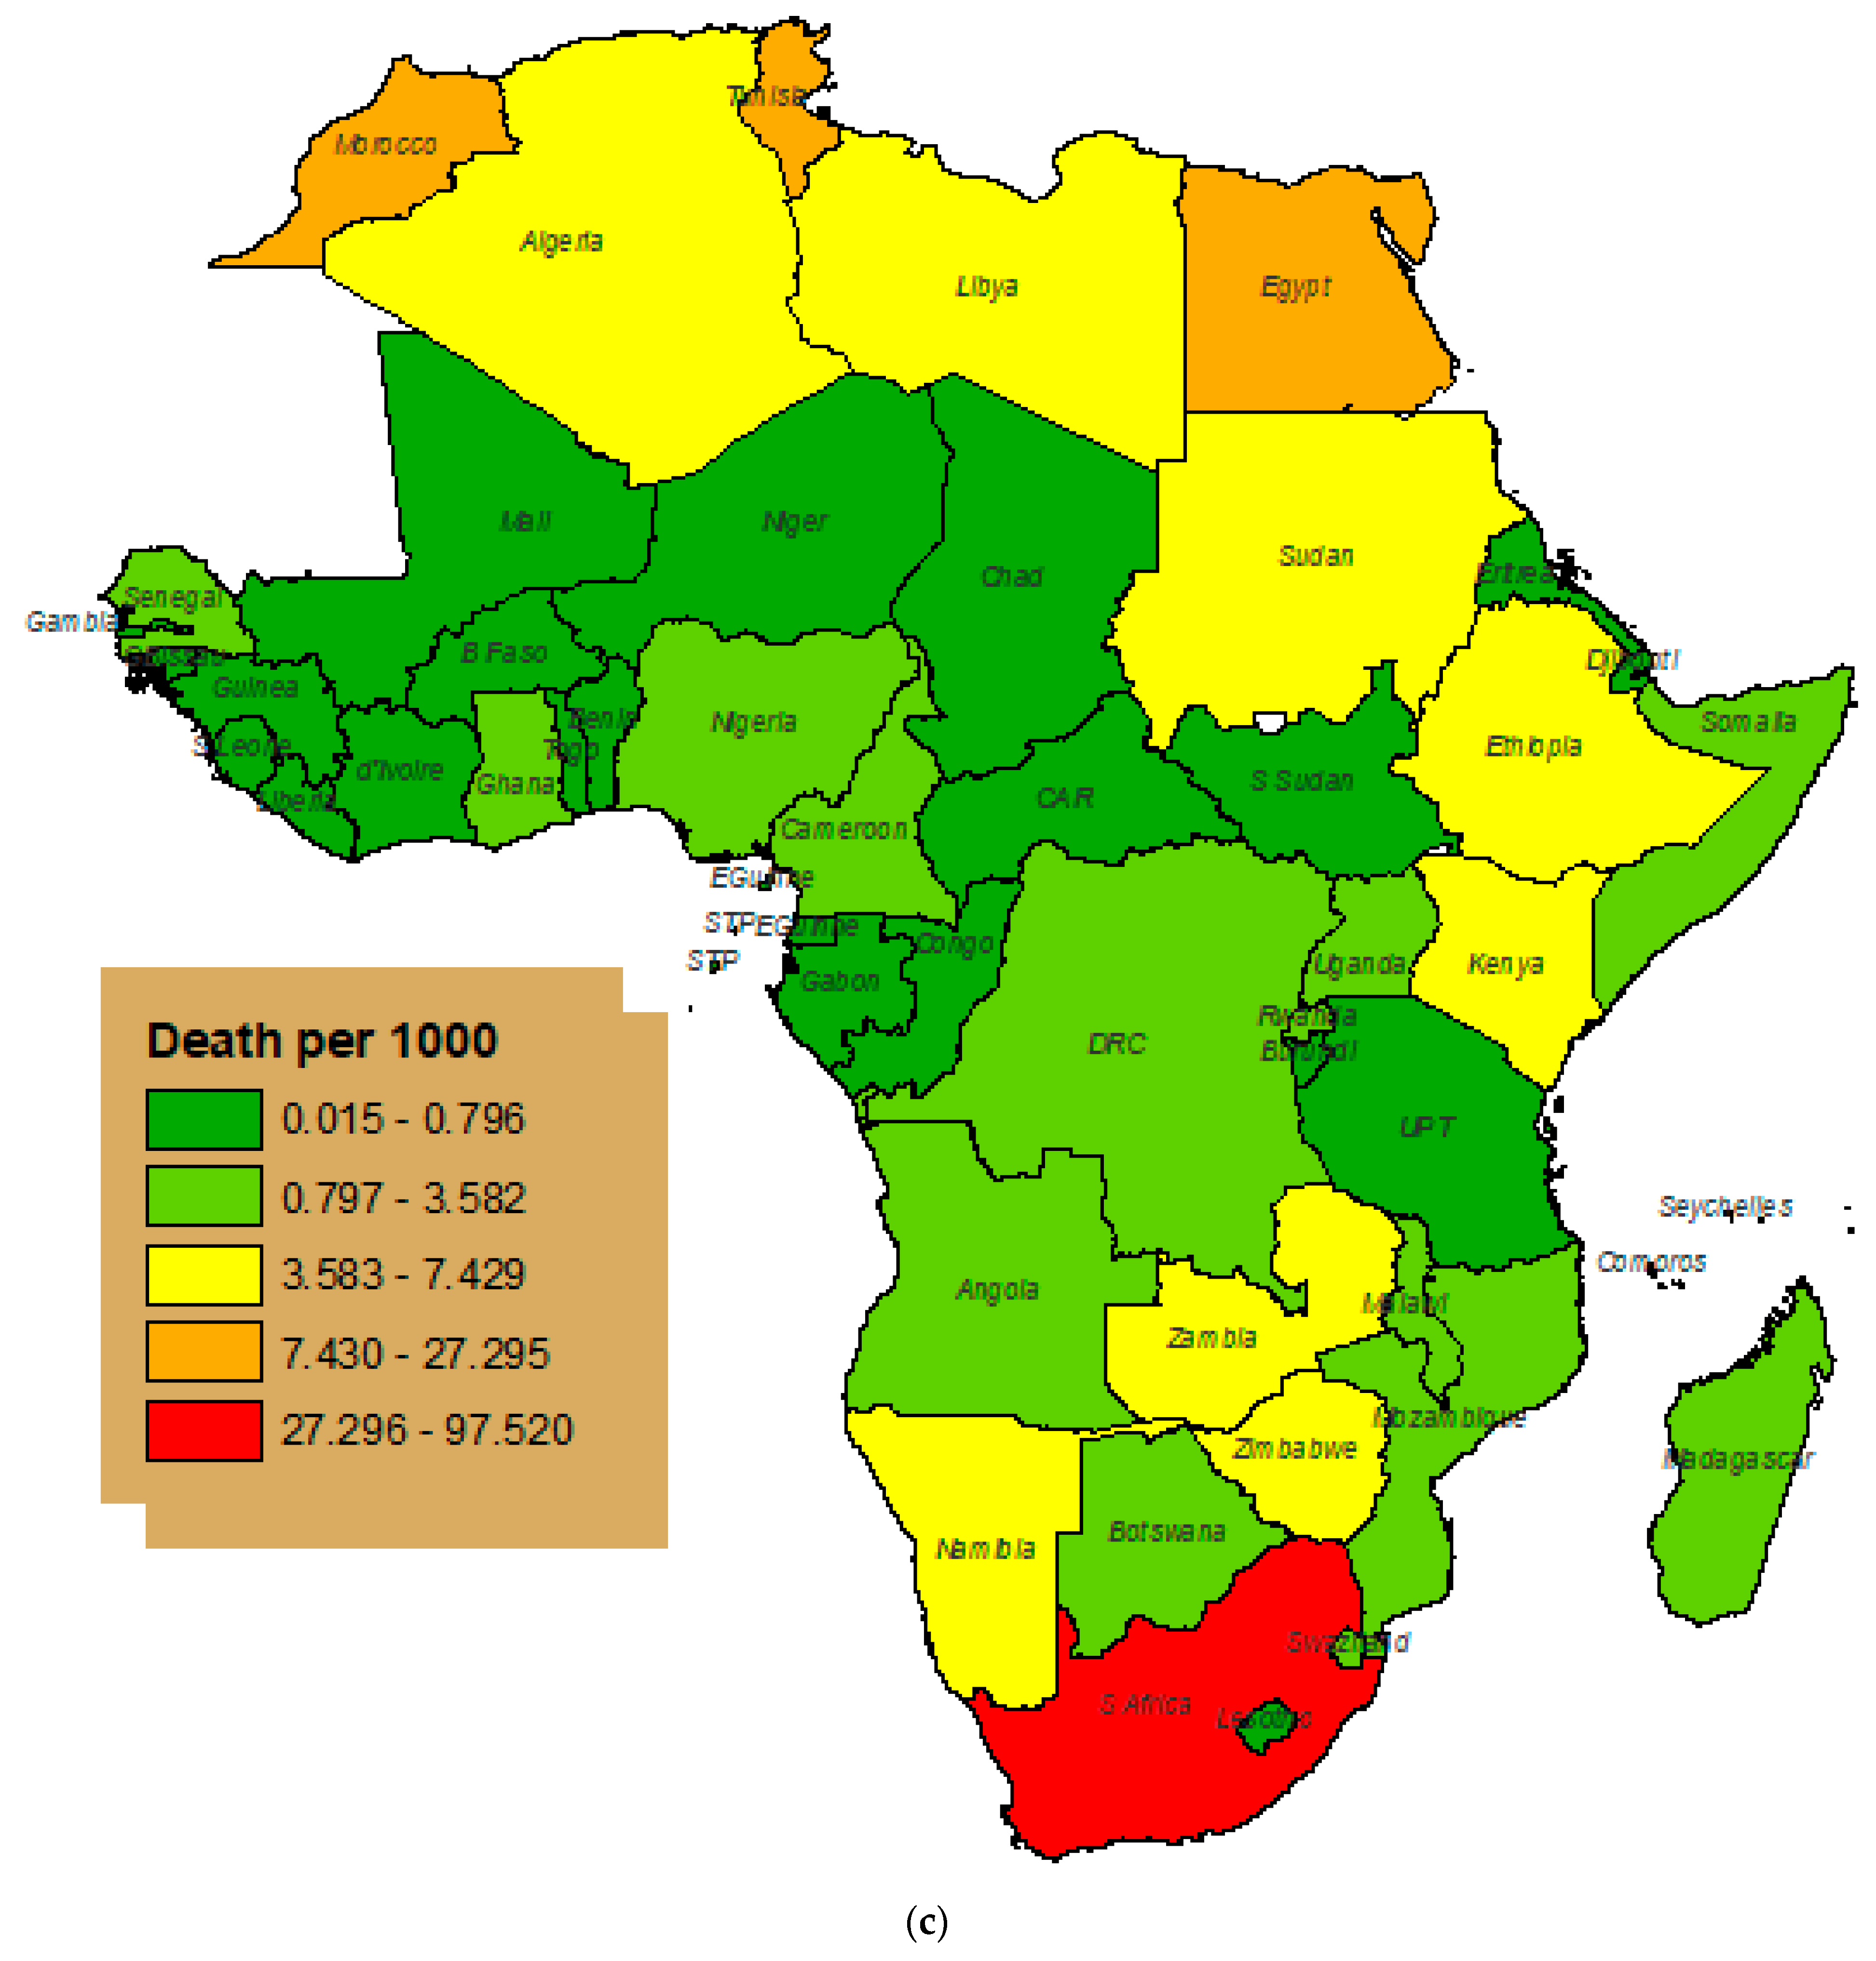
3.1. Descriptive Results
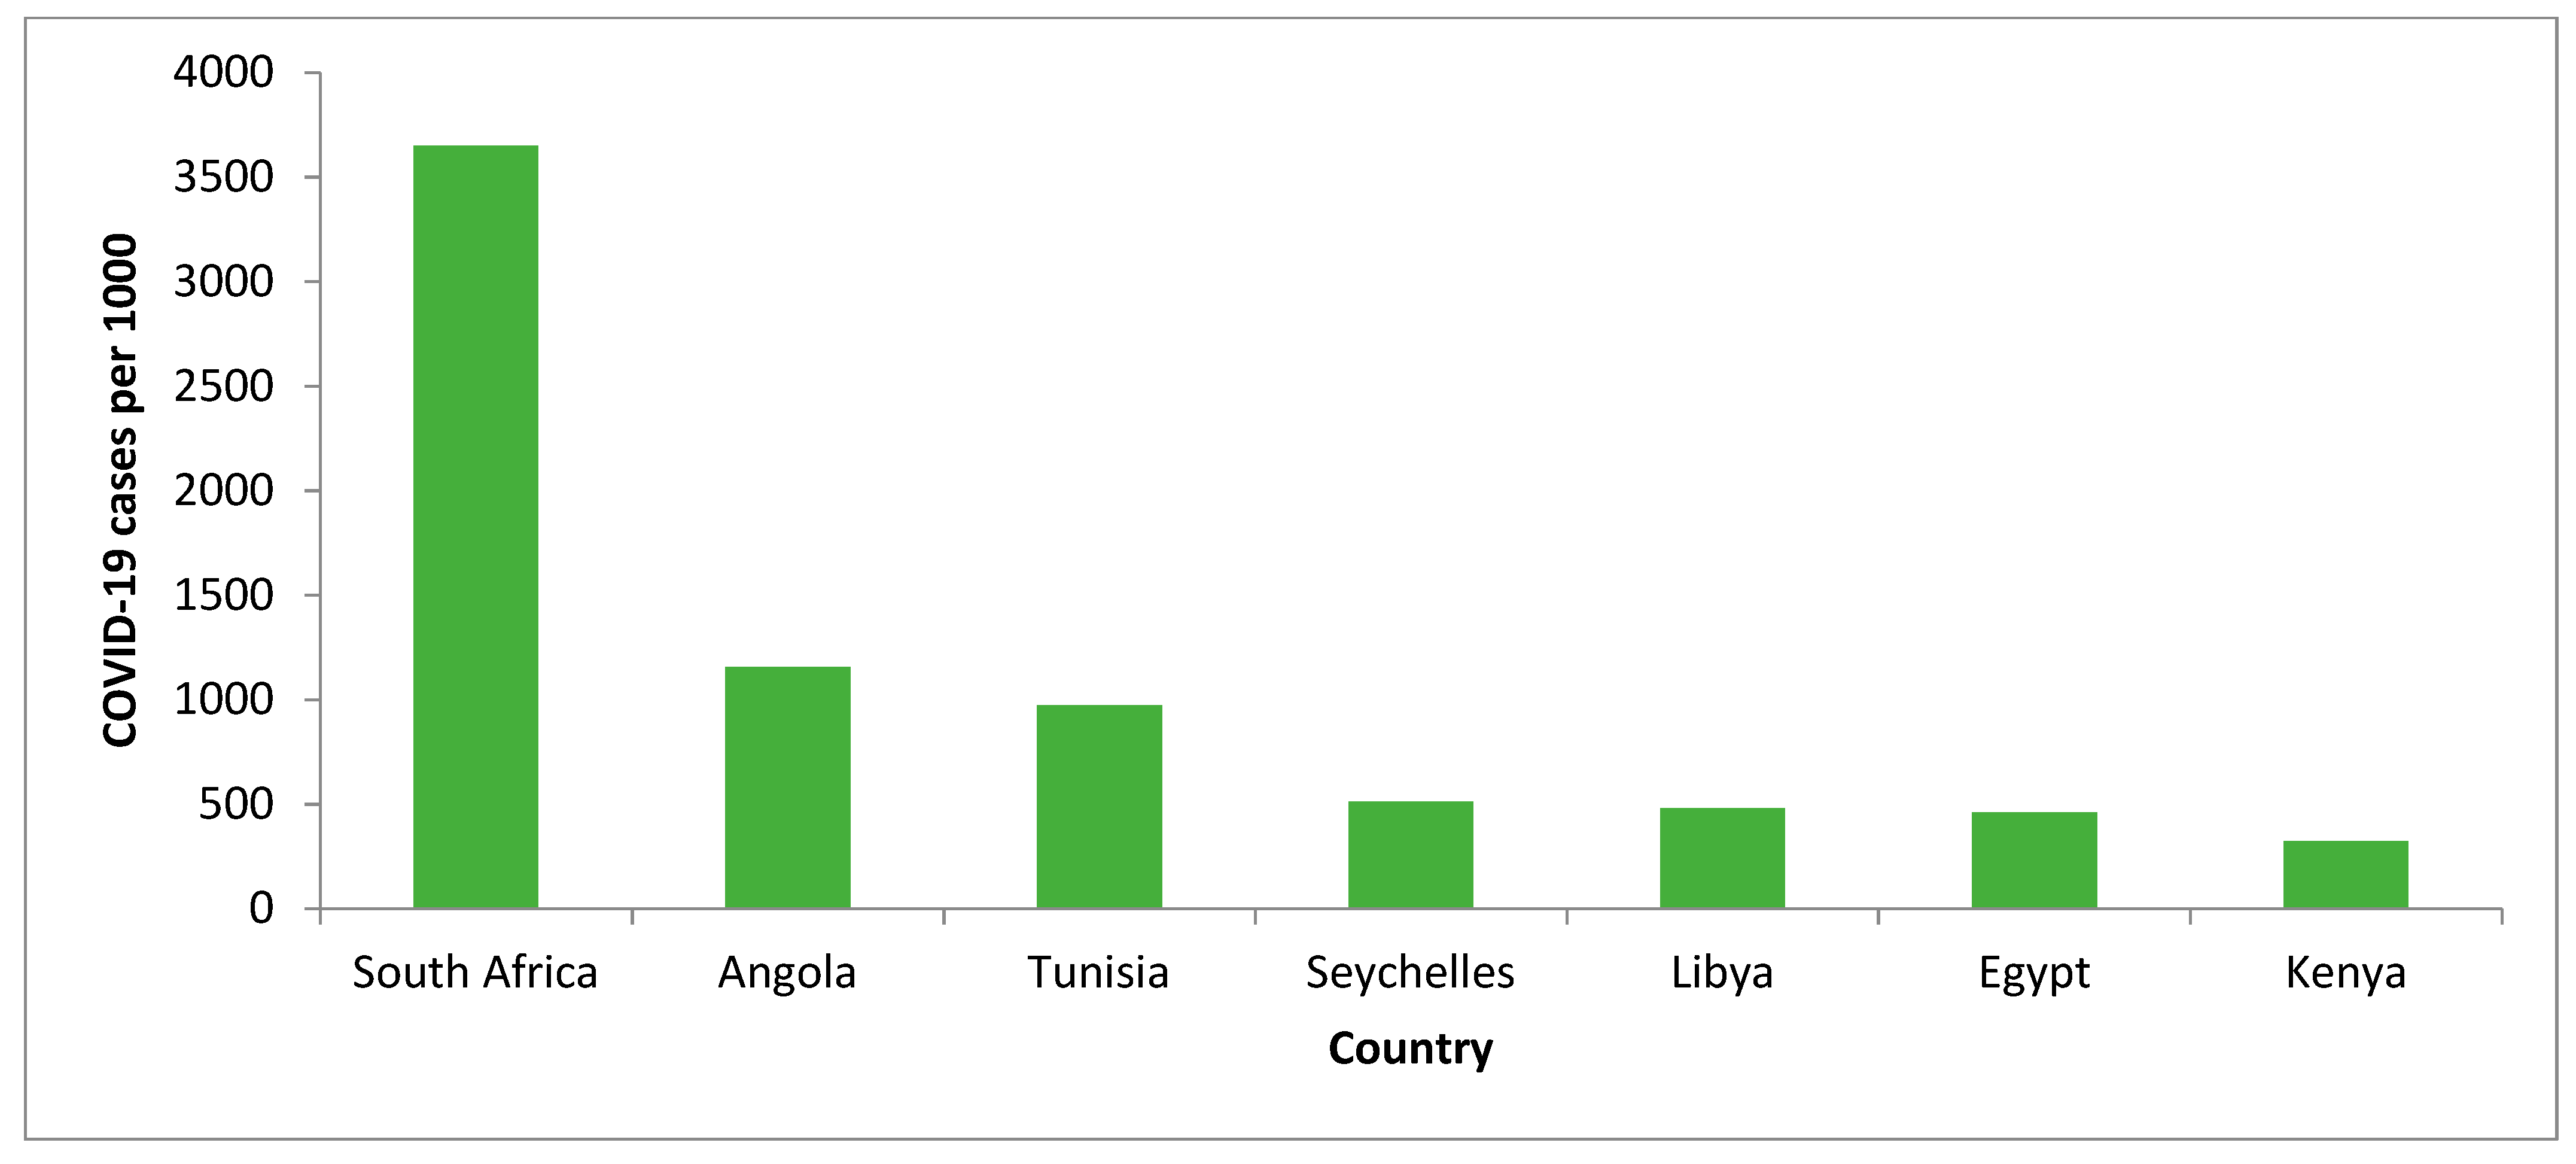
3.2. The Top Seven African Countries Affected by COVID-19
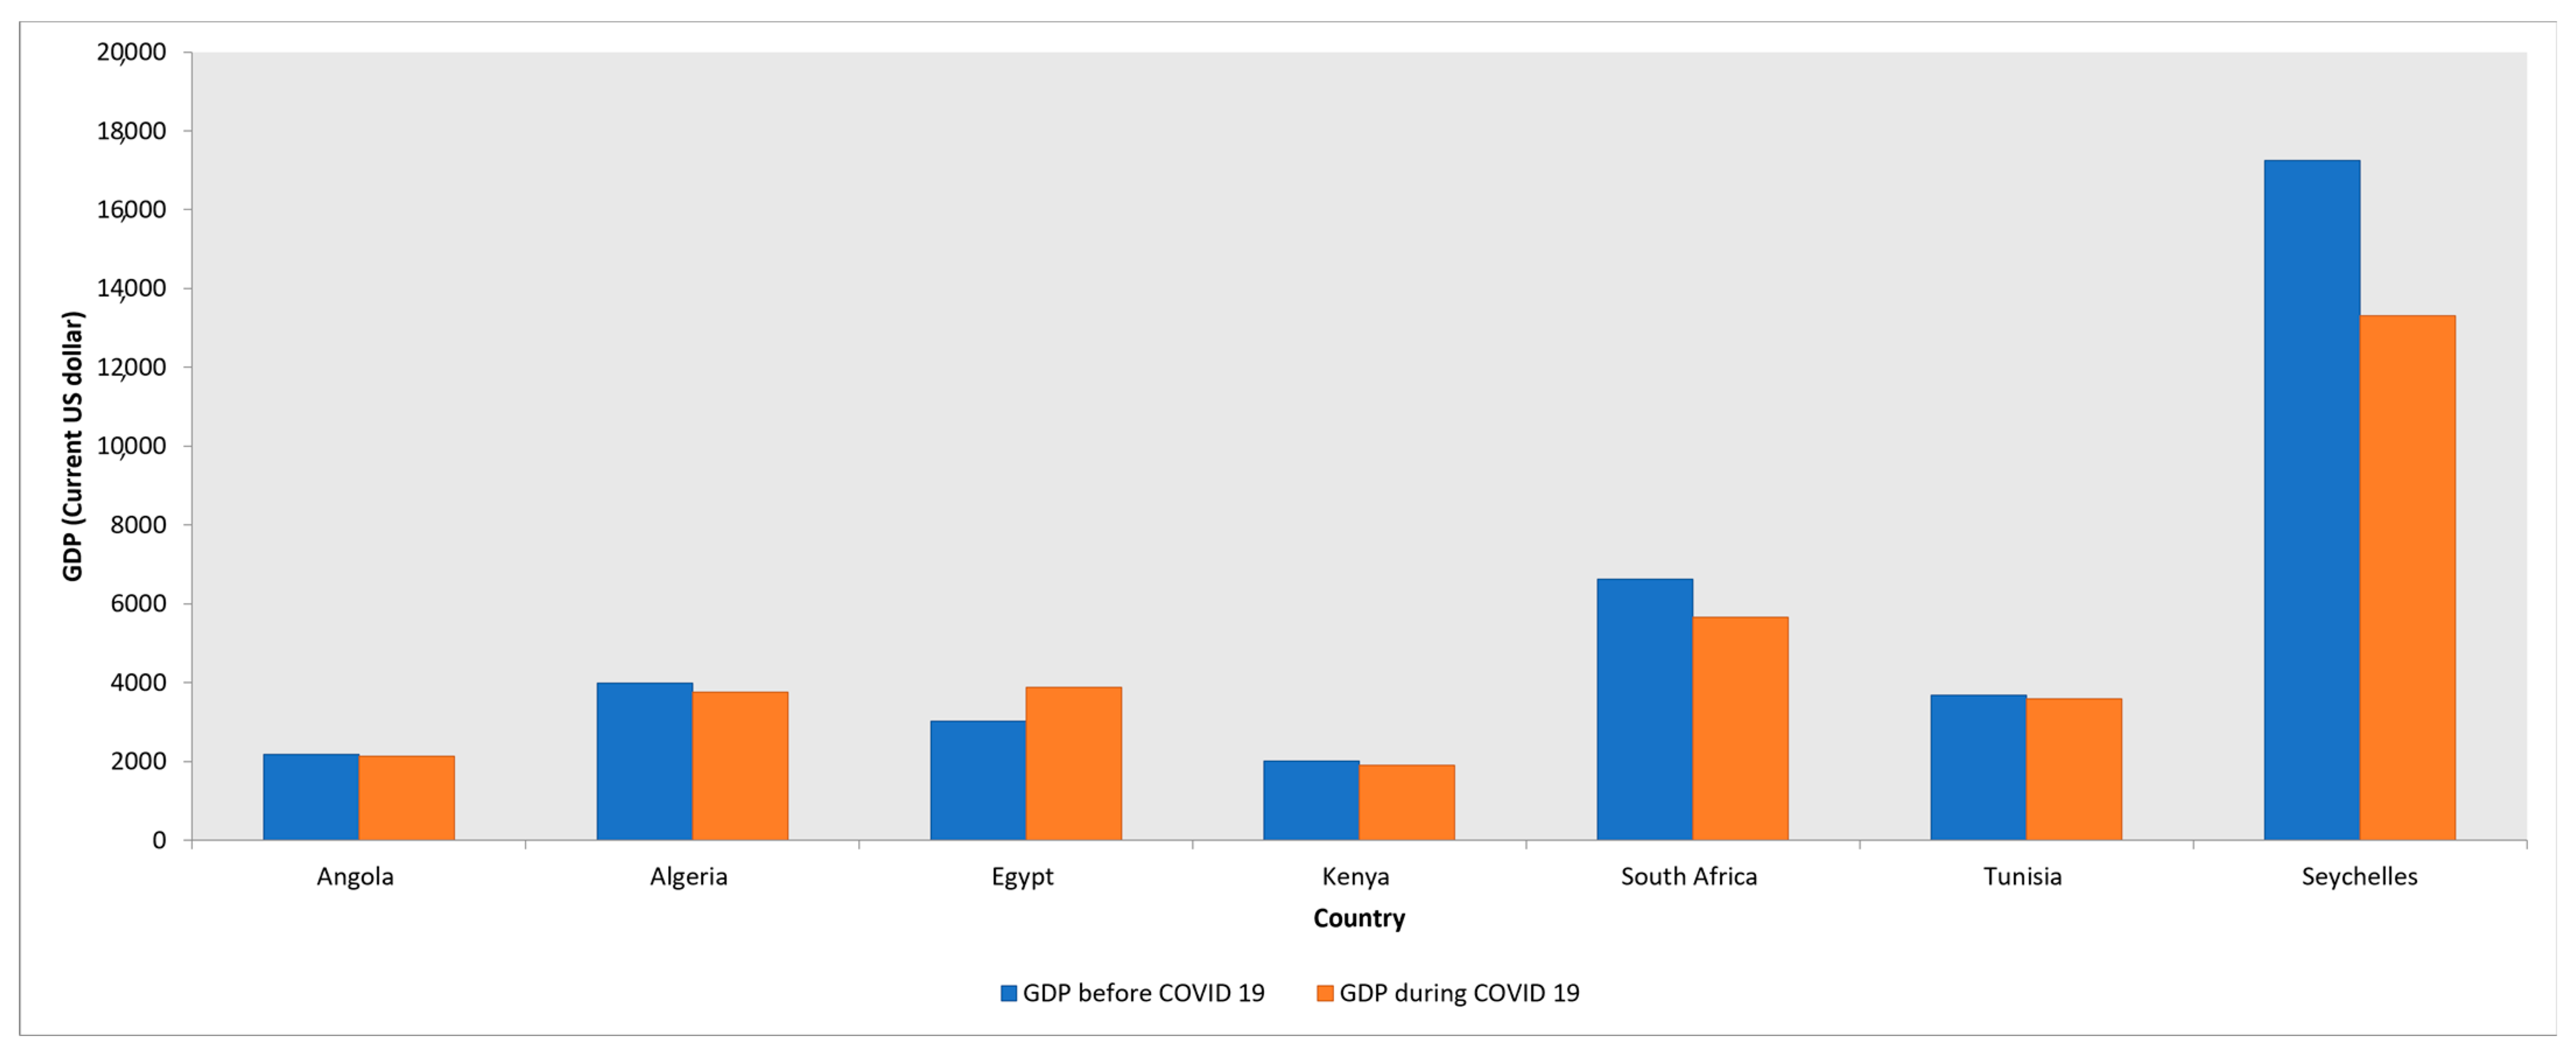
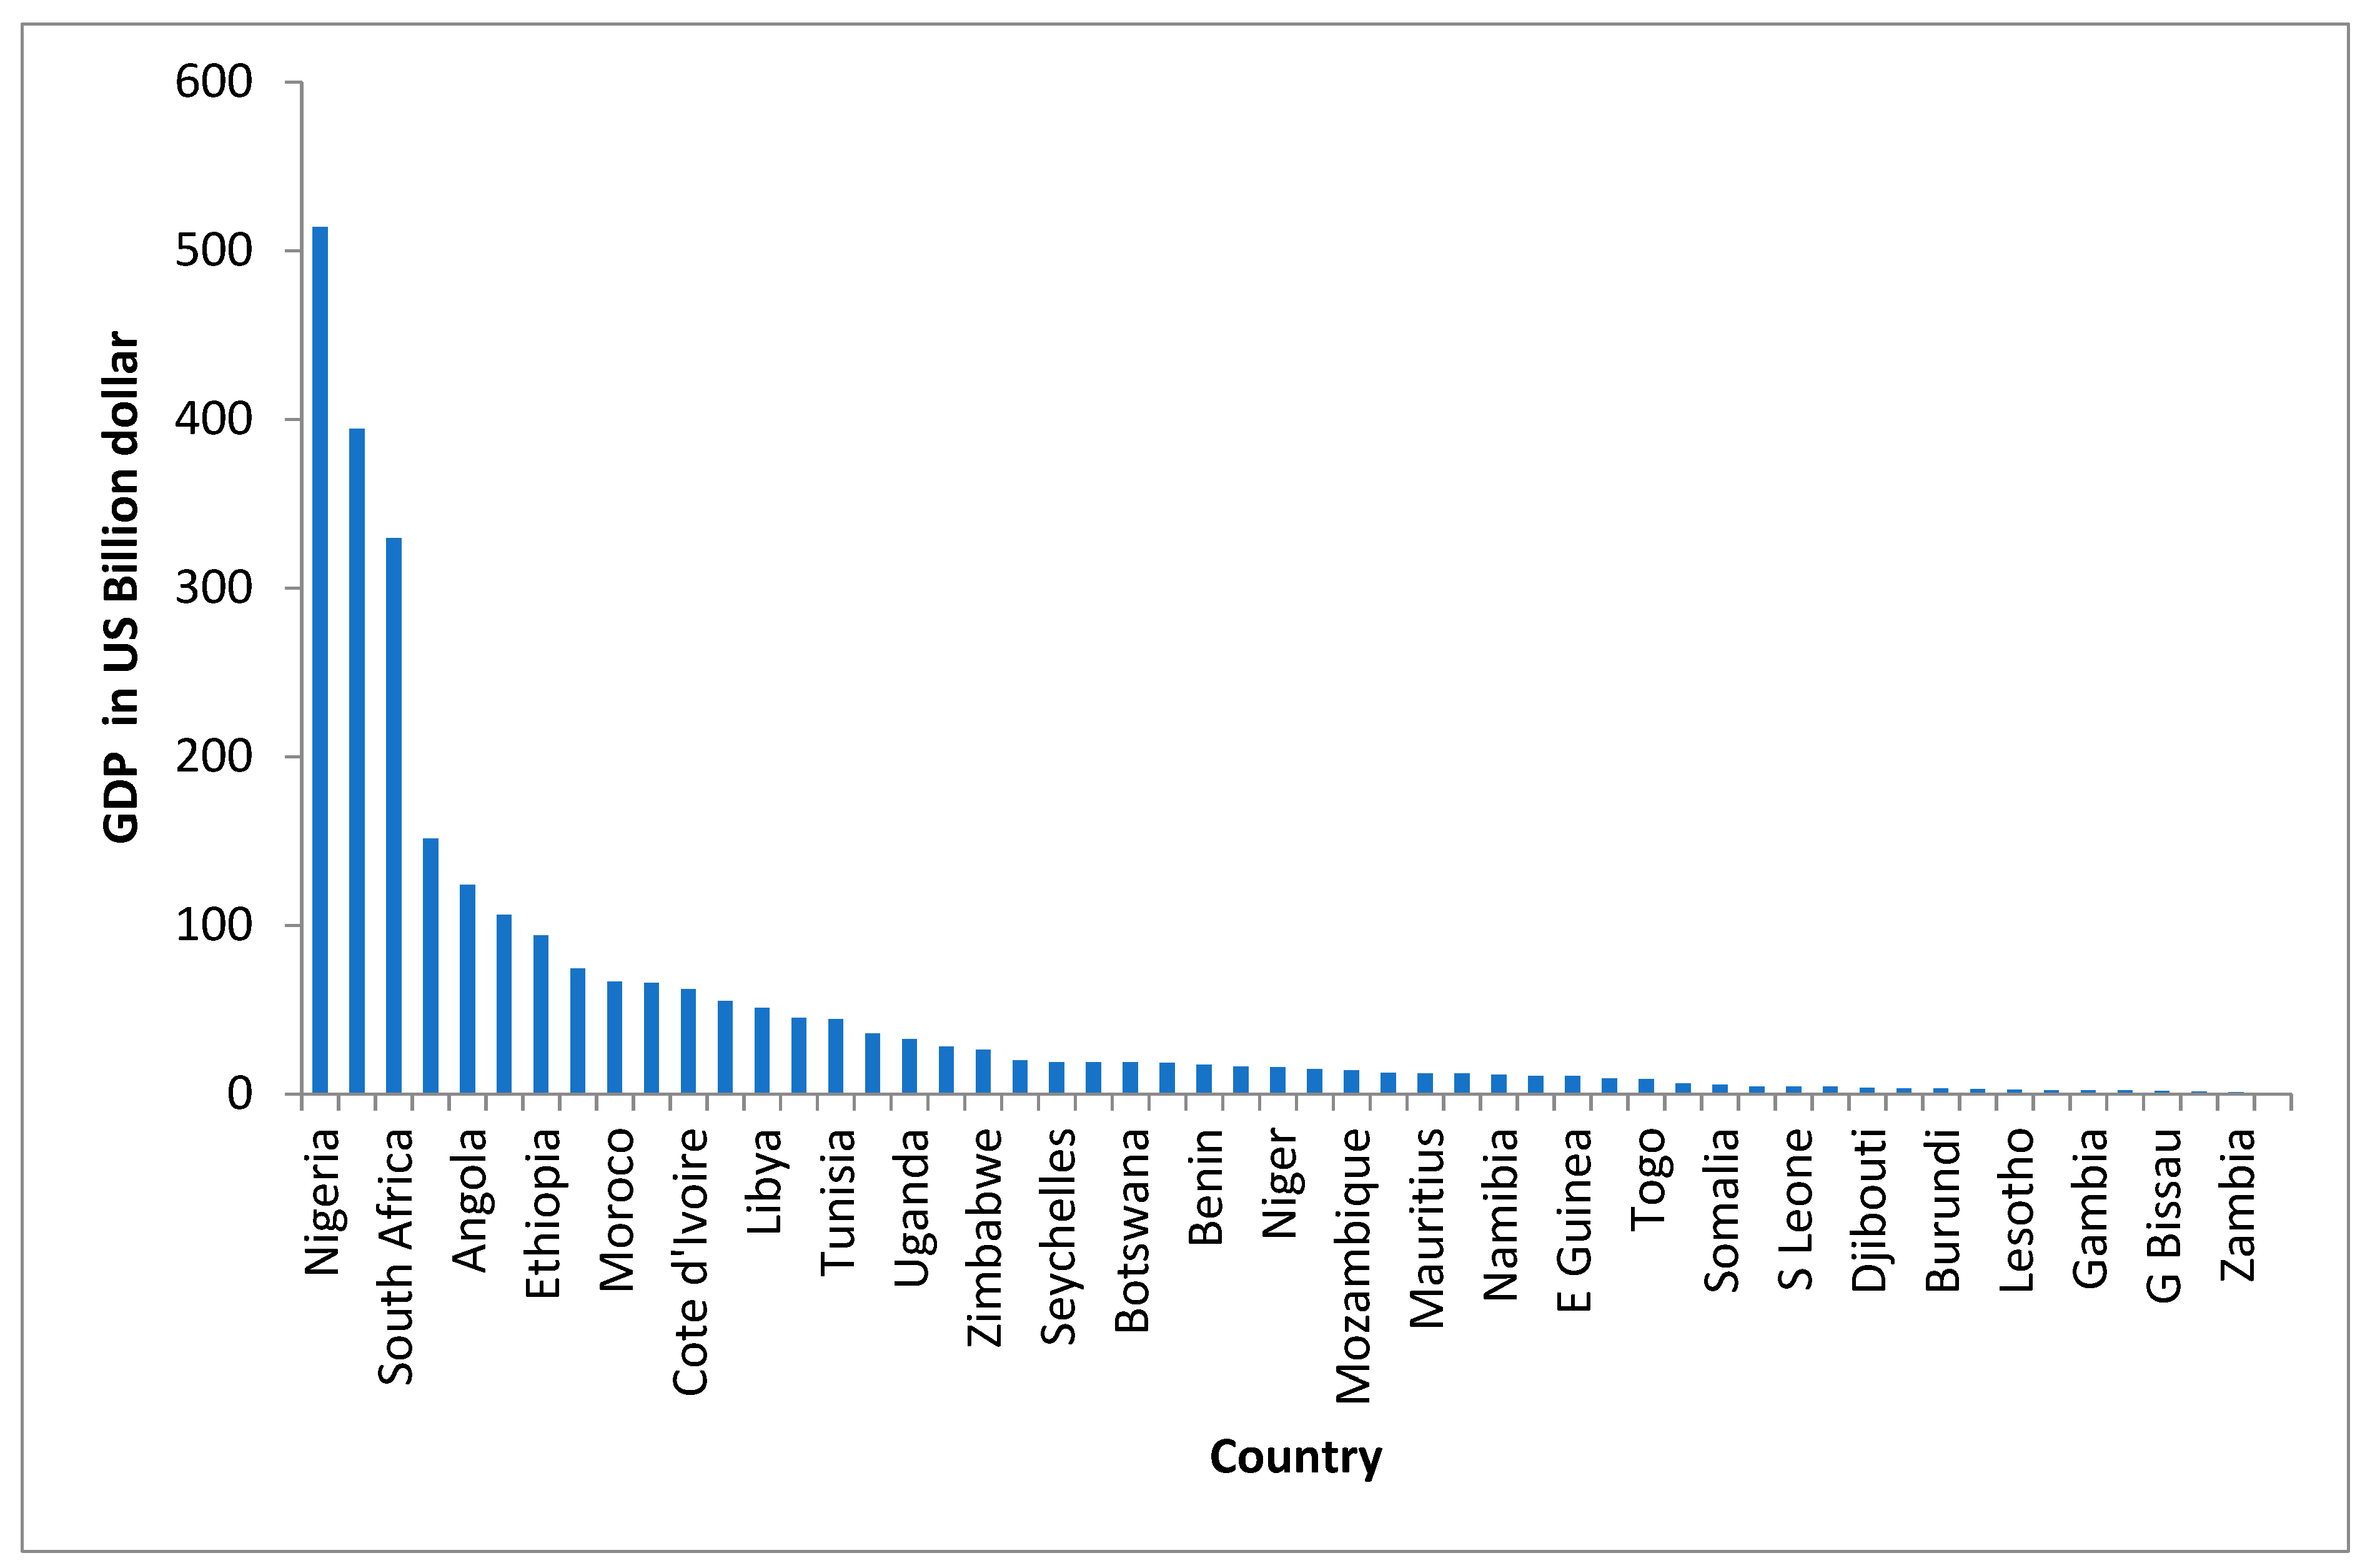
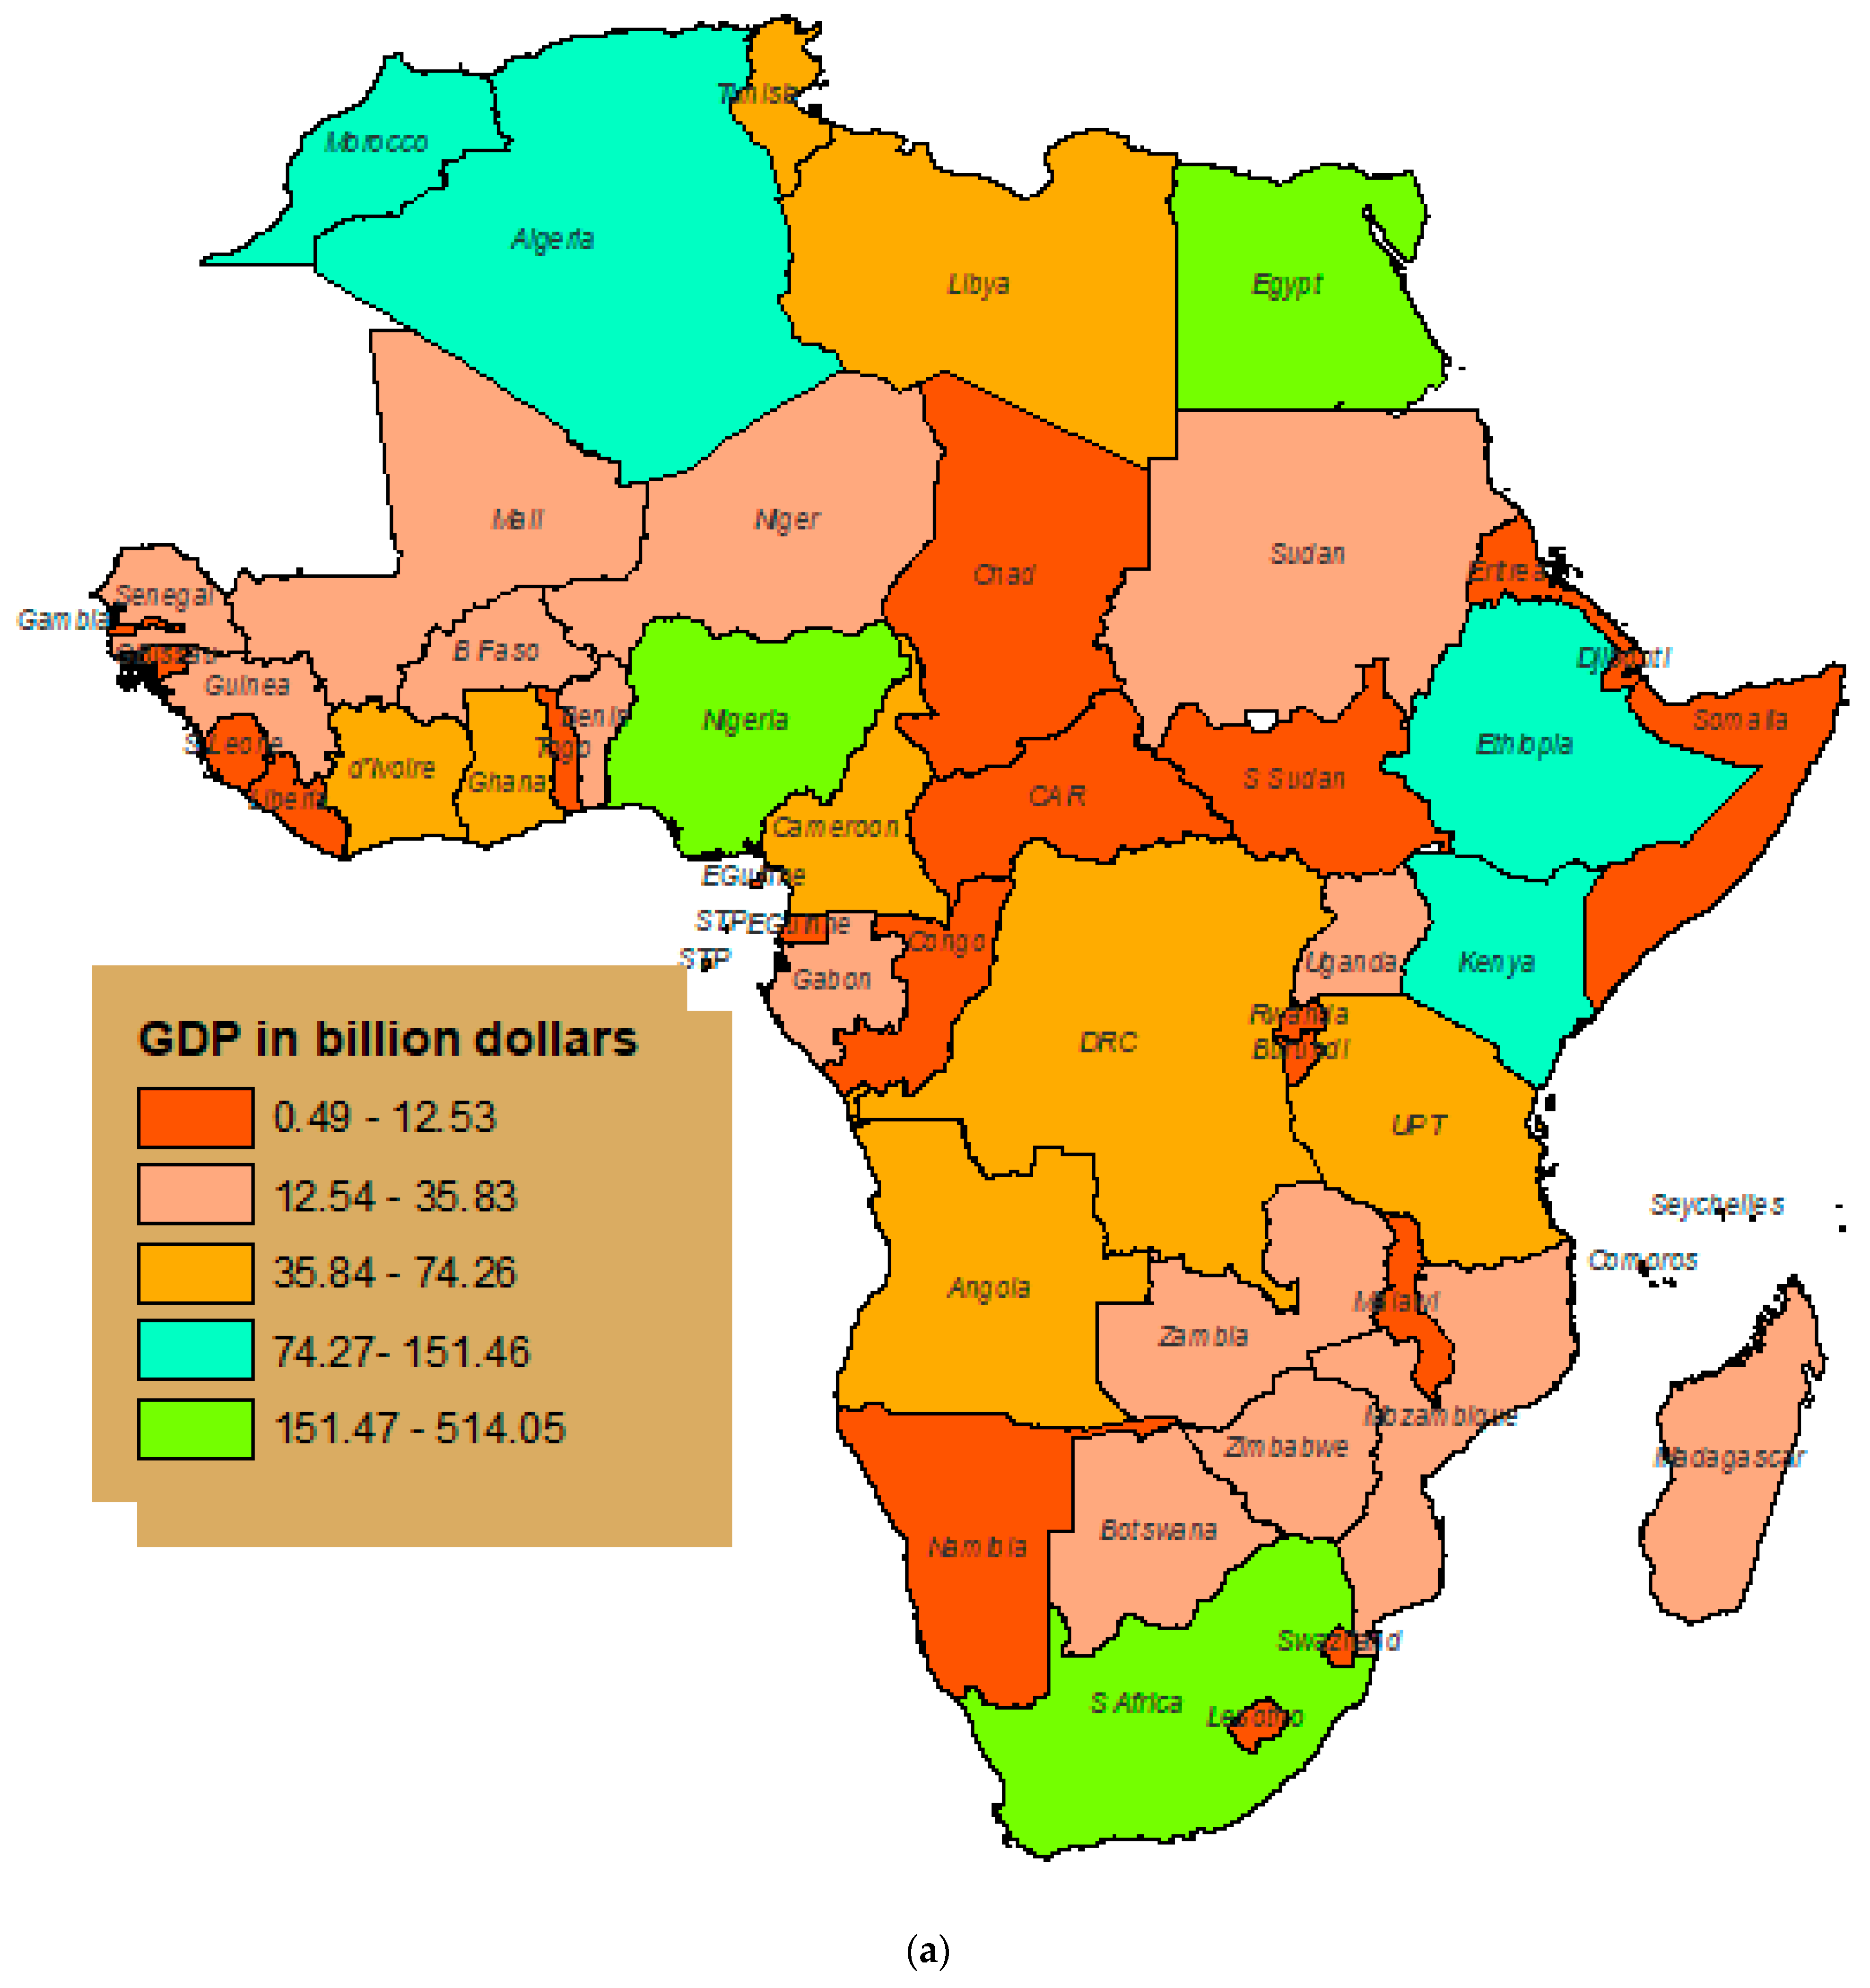
3.3. Death Rate and GDP before and after the Outbreak
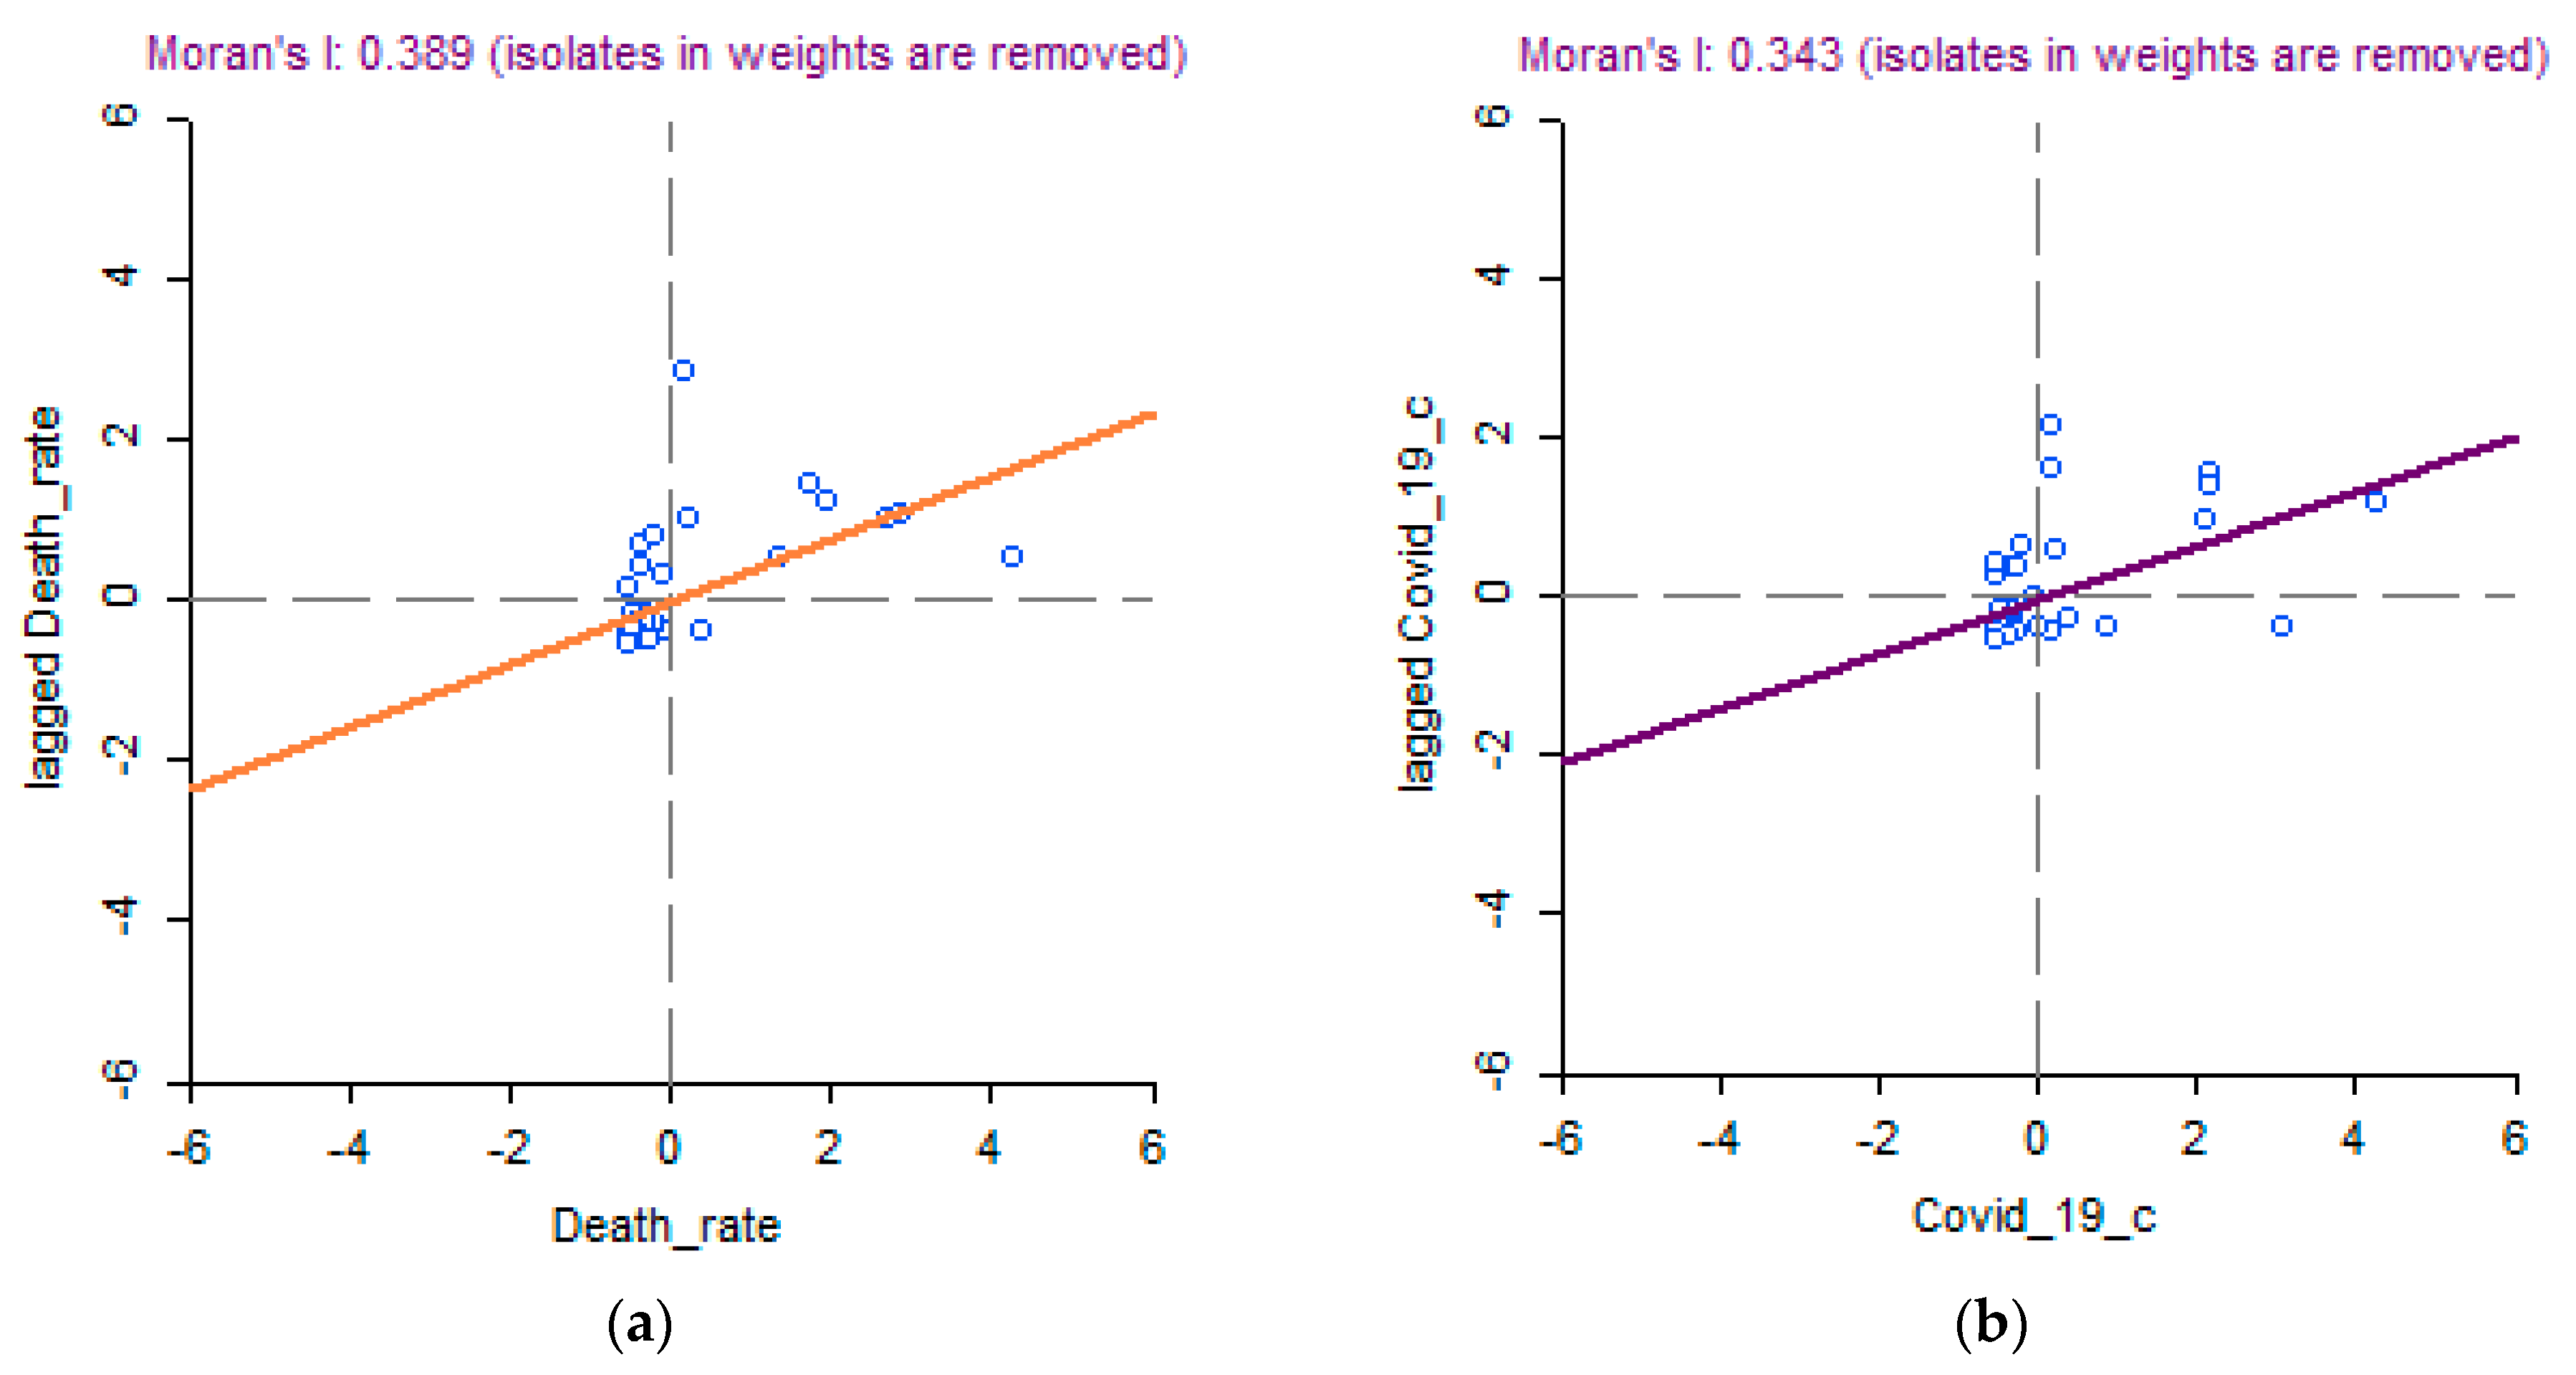
3.4. Testing for Spatial Autocorrelation
3.4.1. Tests of Spatial Autocorrelation Using Global Moran’s I
3.4.2. Result of Multivariate Analysis of Covariance Methods
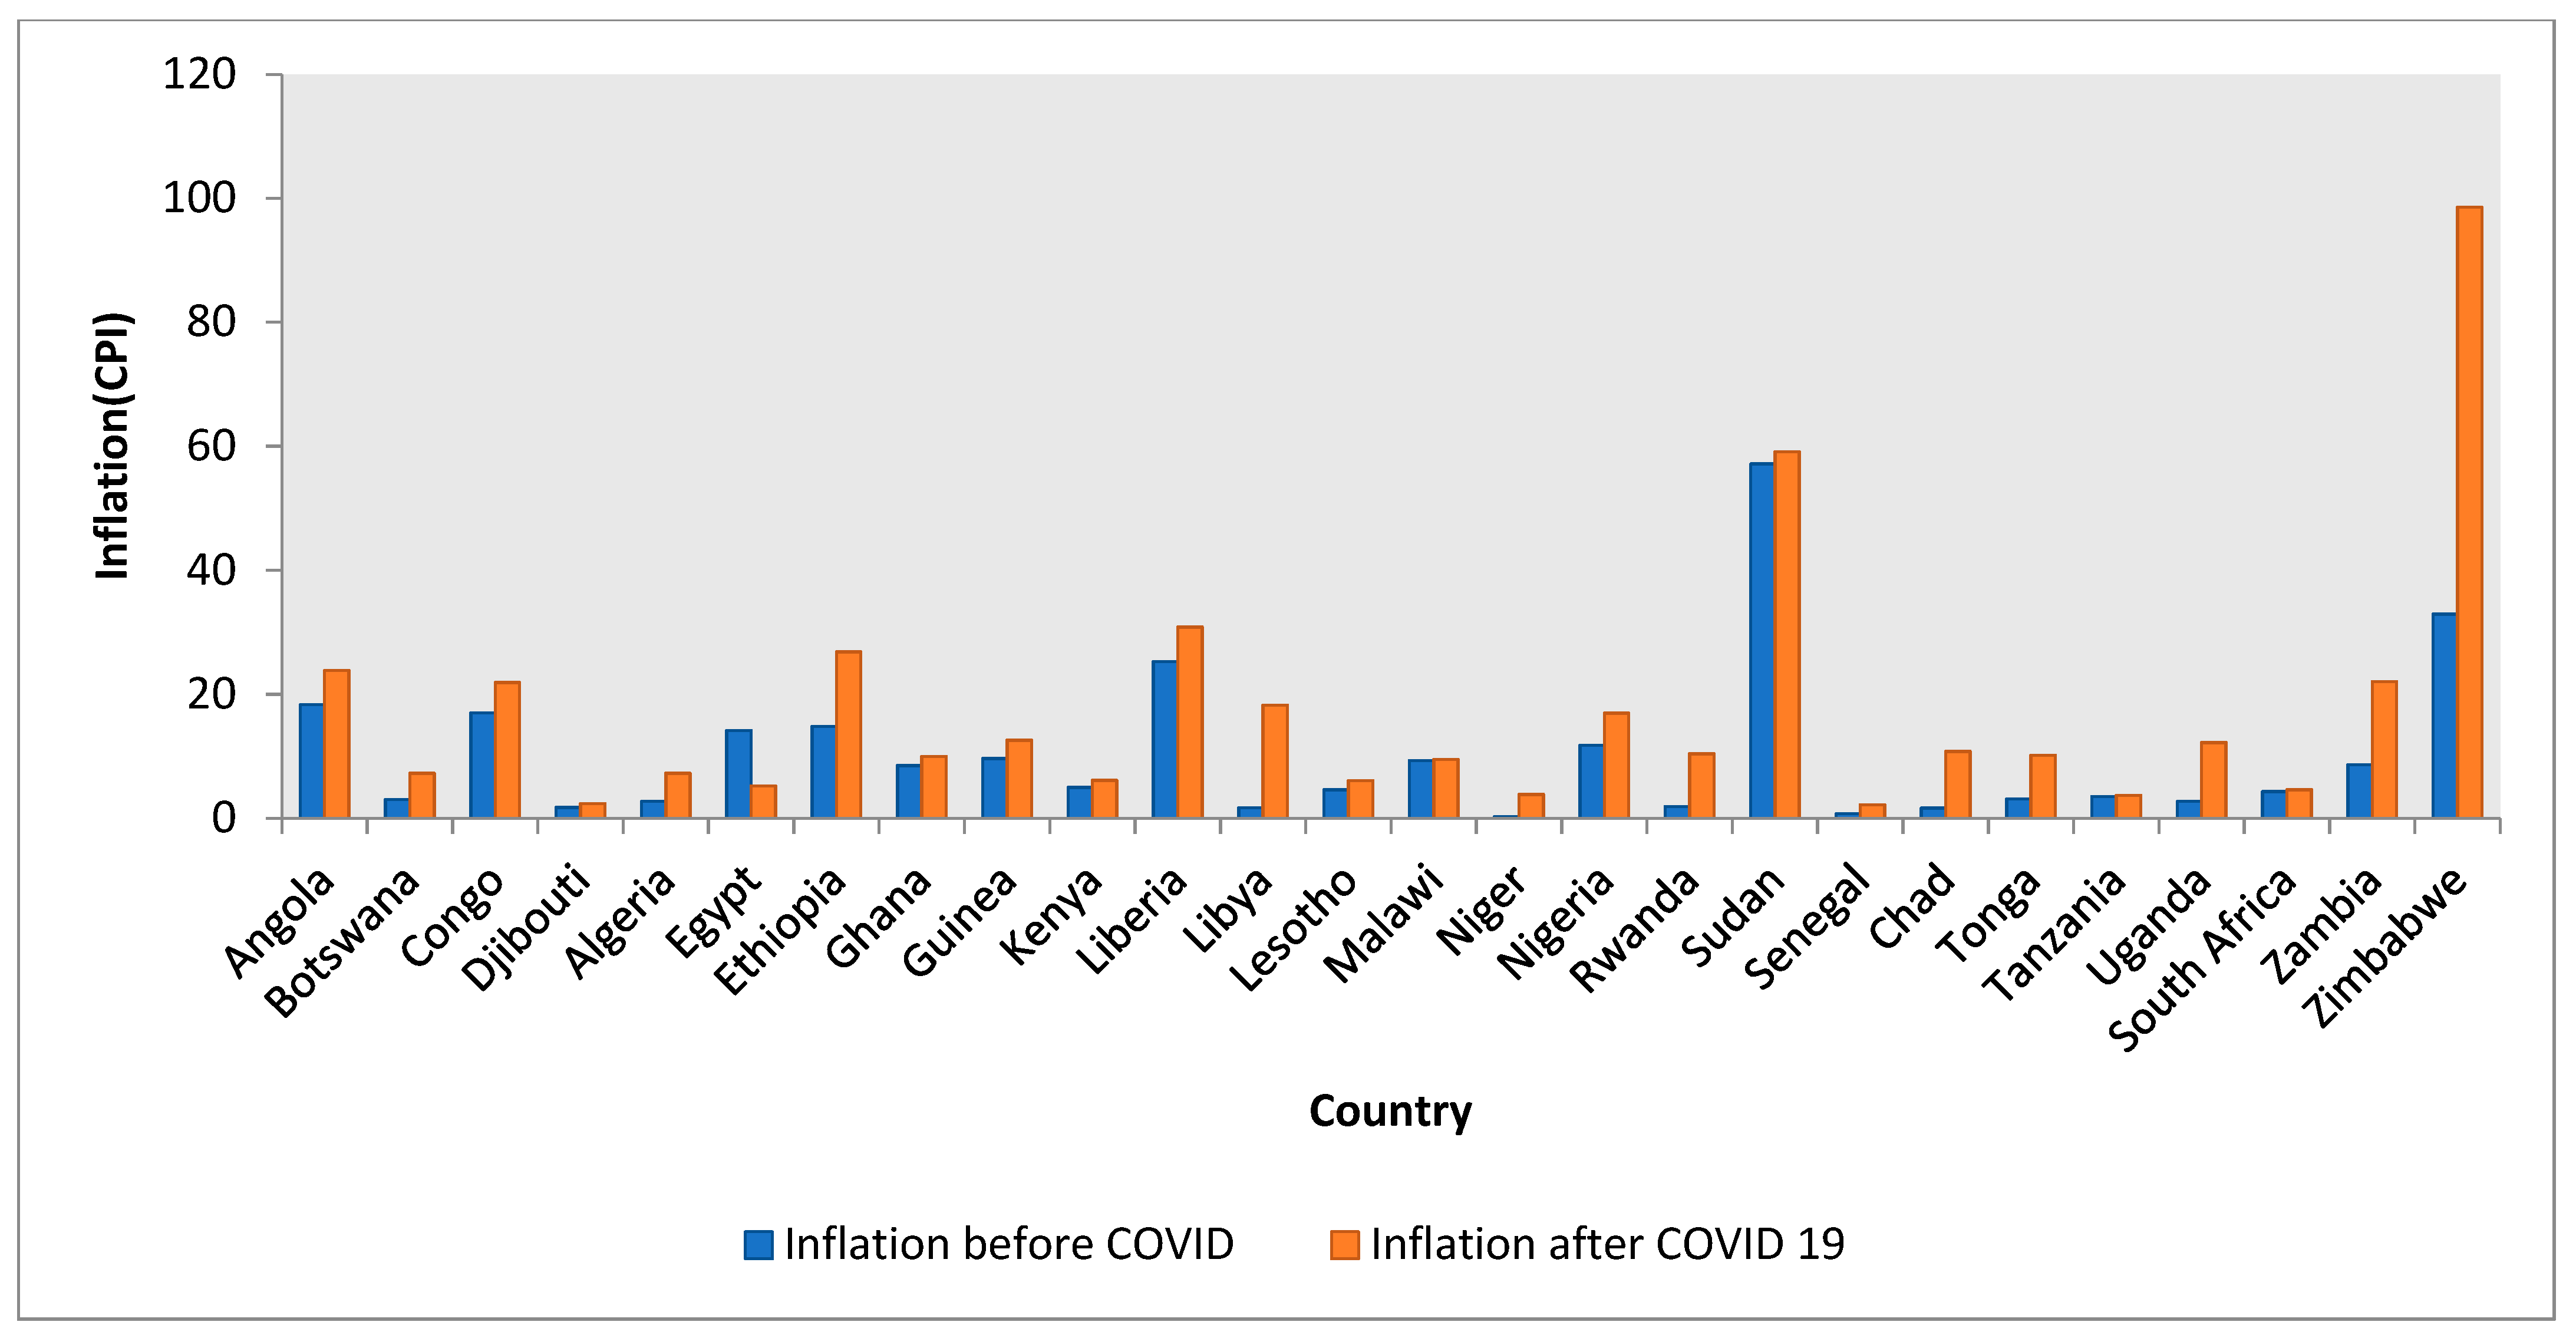
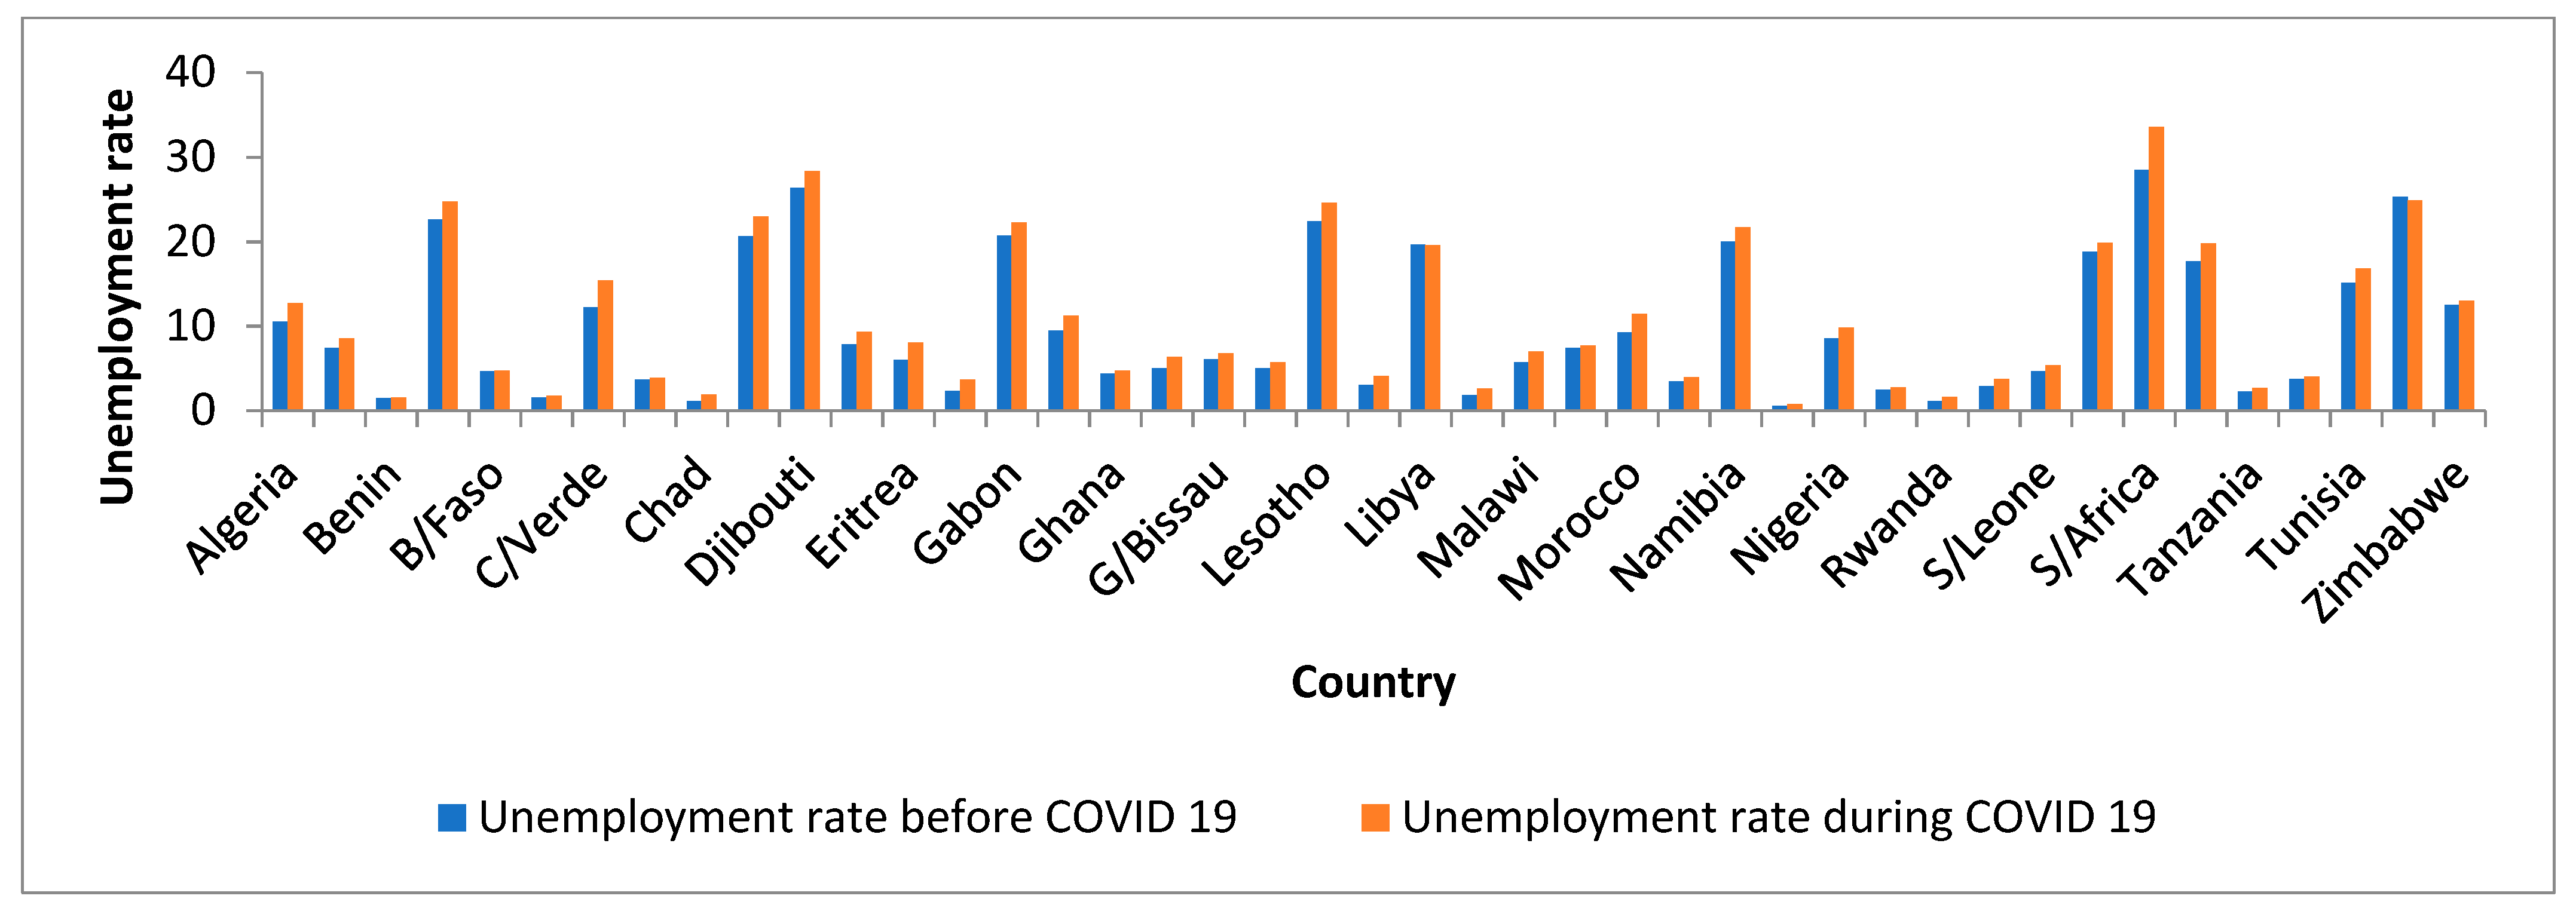
3.4.3. Inflation and Unemployment Rate (before and during COVID-19)
3.5. Result of Spatial Autoregressive Modeling
4. Conclusions
Author Contributions
Funding
Institutional Review Board Statement
Informed Consent Statement
Data Availability Statement
Acknowledgments
Conflicts of Interest
References
- Singh, K.; Agarwal, A. Impact of weather indicators on the COVID-19 outbreak: A Multi-state study in India. medRxiv 2020, 2020-06. [Google Scholar] [CrossRef]
- WHO. Naming the Coronavirus Disease (COVID-19) and the Virus That Causes It. 2019. Available online: https://www.who.int/emergencies/diseases/novelcoronavirus-2019/technical-guidance/naming-the-coronavirus-disease-(covid-2019)-and-the-virus-that-causes-it (accessed on 10 May 2023).
- Gupta, A.; Banerjee, S.; Das, S. Significance of geographical factors to the COVID-19 outbreak in India. Model. Earth Syst. Environ. 2020, 6, 2645–2653. [Google Scholar] [CrossRef] [PubMed]
- To, T.; Zhang, K.; Maguire, B.; Terebessy, E.; Fong, I.; Parikh, S.; Zhu, J. Correlation of Ambient temperature and COVID-19 incidence in Canada. Sci. Total Environ. 2020, 750, 141484. [Google Scholar] [CrossRef] [PubMed]
- Rashed, E.A.; Kodera, S.; Gomez-Tames, J.; Hirata, A. Influence of absolute humidity, temperature and population density on COVID-19 spread and decay durations: Multi-prefecture study in Japan. Int. J. Environ. Res. Public Health 2020, 17, 5354. [Google Scholar] [CrossRef]
- Azuma, K.; Kagi, N.; Kim, H.; Hayashi, M. Impact of climate and ambient air pollution on the epidemic growth during COVID-19 outbreak in Japan. Environ. Res. 2020, 190, 110042. [Google Scholar] [CrossRef]
- Menebo, M.M. Temperature and precipitation associate with COVID-19 new daily cases: A correlation study between weather and COVID-19 pandemic in Oslo, Norway. Sci. Total. Environ. 2020, 737, 139659. [Google Scholar] [CrossRef]
- Rendana, M. Impact of the wind conditions on COVID-19 pandemic: A new insight for direction of the spread of the virus. Urban Clim. 2020, 34, 100680. [Google Scholar] [CrossRef]
- Suhaimi, N.F.; Jalaludin, J.; Latif, M.T. Demystifying a possible relationship between COVID-19, air quality and meteorological factors: Evidence from Kuala Lumpur, Malaysia. Aerosol Air Qual. Res. 2020, 20, 1520–1529. [Google Scholar] [CrossRef]
- Wong, D.W.; Li, Y. Spreading of COVID-19: Density matters. PLoS ONE 2020, 15, e0242398. [Google Scholar] [CrossRef]
- Bhadra, A.; Mukherjee, A.; Sarkar, K. Impact of population density on COVID-19 infected and mortality rate in India. Model. Earth Syst. Environ. 2021, 7, 623–629. [Google Scholar] [CrossRef]
- Sun, Z.; Zhang, H.; Yang, Y.; Wan, H.; Wang, Y. Impacts of geographic factors and population density on the COVID-19 spreading under the lockdown policies of China. Sci. Total Environ. 2020, 746, 141347. [Google Scholar] [CrossRef] [PubMed]
- World Bank. Available online: https://data.worldbank.org/indicator/SH.XPD.CHEX.GD.ZS?Contextual=max&end=2017&locations=ZG-1W&start=2000 (accessed on 30 May 2020).
- Rodriguez-Morales, A.J.; Bonilla-Aldana, D.K.; Balbin-Ramon, G.J.; Rabaan, A.; Sah, R.; Paniz-Mondolfi, A.; Pagliano, P.; Esposito, S. History is repeating itself, a probable zoonotic spillover as a cause of an epidemic: The case of 2019 novel Coronavirus. Infez Med. 2020, 28, 3–5. [Google Scholar] [PubMed]
- Martellucci, C.A.; Sah, R.; Rabaan, A.A.; Dhama, K.; Casalone, C.; Arteaga-Livias, K.; Sawano, T.; Ozaki, A.; Bhandari, D.; Higuchi, A.; et al. Changes in the spatial distribution of COVID-19 incidence in Italy using GIS-based maps. Ann. Clin. Microbiol. Antimicrob. 2021, 19, 30. [Google Scholar] [CrossRef]
- Rodriguez-Morales, A.J.; MacGregor, K.; Kanagarajah, S.; Patel, D.; Schlagen-hauf, P. Going global—Travel and the 2019 novel coronavirus. Travel Med. Infect. Dis. 2020, 33, 101578. [Google Scholar] [CrossRef] [PubMed]
- Habte Tadesse Likassa. The impacts of covariates on spatial distribution of corona virus 2019 (COVID-19): What do the data show through ANCOVA and MANCOVA. EJMO 2020, 4, 141–148. [Google Scholar]
- Likassa, H.T.; Xain, W.; Tang, X.; Gobebo, G. Predictive models on COVID-19: What Africans should do? Infect. Dis. Model. 2021, 6, 302–312. [Google Scholar] [CrossRef]
- Nuwagira, E.; Muzoora, C. Is Sub-Saharan Africa prepared for COVID-19? Trop. Med. Health 2020, 48, 18. [Google Scholar] [CrossRef]
- Czernin, J.; Fanti, S.; Meyer, P.T.; Allen-Auerbach, M.; Hacker, M.; Sathekge, M.; Hicks, R.; Scott, A.M.; Hatazawa, J.; Yun, M.; et al. Imaging clinic operations in the times of COVID-19: Strategies, Precautions and Experiences. J. Nucl. Med. 2020, 61, 1–5. [Google Scholar] [CrossRef]
- Wang, Y.J.; Zhang, N.; Lv, H.L.; Zhou, Y.B. Preliminary Analysis on the Incidence Trend of Novel Coronavirus Pneumonia in Shanghai. Search.Bvsalud.Org. Available online: https://search.bvsalud.org/global-literature-on-novel-coronavirus2019-ncov/resource/en/covidwho-6040 (accessed on 10 May 2023).
- Snow, J. On the Mode of Communication of Cholera. 1855. Available online: http://www.ph.ucla.edu/epi/snow/snowbook.html (accessed on 10 May 2023).
- Boulos, M.N.K.; Geraghty, E.M. Geographical tracking and mapping of coronavirus disease COVID-19/severe acute respiratory syndrome coronavirus 2 (SARSCoV-2) epidemic and associated events around the world: How 21st century GIS technologies are supporting the global fight against outbreaks and epidemics. Int. J. Health Geogr. 2020, 19, 8. [Google Scholar]
- Mollalo, A.; Khodabandehloo, E. Zoonotic cutaneous leishmaniasis in northeastern Iran: A GIS-based spatio-temporal multi-criteria decision-making approach. Epidemiol. Infect. 2016, 144, 2217–2229. [Google Scholar] [CrossRef]
- Mollalo, A.; Alimohammadi, A.; Shirzadi, M.R.; Malek, M.R. Geographic information system-based analysis of the spatial and spatio-temporal distribution of zoonotic cutaneous leishmaniasis in Golestan Province, north-east of Iran. Zoonoses Public Health 2015, 62, 18–28. [Google Scholar] [CrossRef] [PubMed]
- Han, J.; Yin, J.; Wu, X.; Wang, D.; Li, C. Environment and COVID-19 incidence: A critical review. J. Environ. Sci. 2023, 124, 933–951. [Google Scholar] [CrossRef] [PubMed]
- Zhang, Y.; Rashid, A.; Guo, S.; Jing, Y.; Zeng, Q.; Li, Y.; Adyari, B.; Yang, J.; Tang, L.; Yu, C.P.; et al. Spatial autocorrelation and temporal variation of contaminants of emerging concern in a typical Spatial autocorrelation and temporal variation of contaminants of emerging concern in a typical urbanizing river. Water Res. 2022, 212, 118–120. [Google Scholar] [CrossRef] [PubMed]
- Anselin, L. Model Validation in Spatial Econometrics: A Review and Evaluation of Alternative Approaches. Int. Reg. Sci. Rev. 1988, 11, 279–316. [Google Scholar] [CrossRef]
- Cressie, N.A.C. Statistics for spatial data. In Wiley Series in Probability and Mathematical Statistics: Applied Probability and Statistics; John Wiley & Sons: Hoboken, NJ, USA, 1993. [Google Scholar]
- International Monetary Fund. World Economic Outlook Update; International Monetary Fund: Washington, DC, USA, 2021; p. 6. [Google Scholar]
- United Nations. Egypt COVID-19 Response and Recovery Interventions of the United Nations in Egypt; United Nations: Cairo, Egypt, 2020. [Google Scholar]
- Schober, P.; Boer, C.; Schwarte, L.A. Correlation coefficients: Appropriate use and interpretation. Anesth. Analg. 2018, 126, 1763–1768. [Google Scholar] [CrossRef]
- Anselin, L.; Le Gallo, J.; Jayet, H. Spatial Panel Econometrics. In The Econometrics of Panel Data: Fundamentals and Recent Developments in Theory and Practice; Mátyás, L., Sevestre, P., Eds.; Springer: Berlin/Heidelberg, Germany, 2008; pp. 625–660. [Google Scholar] [CrossRef]
- Anselin, L. Spatial econometrics. In Handbook of Spatial Analysis in the Social Sciences; Edward Elgar Publishing: Cheltenham, UK, 2022; pp. 101–122. [Google Scholar]
- Anselin, L. Spatial Econometrics: Methods and Models; Springer: New York, NY, USA, 1988. [Google Scholar]
- Anselin, L. The Moran Scatter Plot as an Exploratory Spatial Data Analysis Tool to Assess Local Instability in Spatial Association; Taylor & Francis Group: Oxford, NY, USA, 1996; pp. 111–125. [Google Scholar]
- Anselin, L. Lagrange Multiplier Test Diagnostics for Spatial Dependence and Spatial Heterogeneity. Geogr. Anal. 1988, 20, 1–17. [Google Scholar] [CrossRef]
- Martellucci, C.A.; Flacco, M.E.; Cappadona, R.; Bravi, F.; Mantovani, L.; Manzoli, L. SARS-CoV-2 pandemic: An overview. Adv. Biol. Regul. 2020, 77, 100736. [Google Scholar] [CrossRef]
- Diaye, M.A.; Ho, S.H.; Oueghlissi, R. ESG performance and economic growth: A panel co-integration analysis. Empirica 2021, 49, 99–122. [Google Scholar] [CrossRef]


| Category | Variables | Descriptions |
|---|---|---|
| Meteorological factors | Temperature | The yearly average temperature in degrees Celsius |
| Relative humidity | The daily average relative humidity in percentage | |
| Precipitation | Daily average wind speed in km/hr | |
| Population size | Population density for each country in Africa | |
| Inflation | Consumer price index | Global database |
| Unemployment rate | Unemployment rate based on the total labor force | Global database (unemployment data and total labor force) |
| Variables | Number of Countries | Mean |
|---|---|---|
| GDP per capita (USD) | 54 | 62.78 |
| Deaths per 1000 people | 54 | 4.154 |
| COVID-19 cases (per 1000 people) | 54 | 206.013 |
| Country | GDP in USD (before COVID-19: 2019) | GDP in USD (during COVID-19: 2021) | Percentage Decrease |
|---|---|---|---|
| Angola | 2177.8 | 2137.9 | −1.8 |
| Algeria | 3989.7 | 3765.0 | −5.6 |
| Egypt | 3019.1 | 3876.4 | 28.4 |
| Kenya | 2006.8 | 1909.3 | −4.9 |
| South Africa | 6624.8 | 5655.9 | −14.6 |
| Tunisia | 3691 | 3597 | −2.6 |
| Seychelles | 17,252 | 13,306.7 | −22.9 |
| Variable | Moran I Correlation under Normalization | |||||
|---|---|---|---|---|---|---|
| Coefficient | Observed | Expected | Std | Z Value | p-Value | |
| Death per 1000 people | Moran’s I statistic | 0.3895 | −0.0204 | −0.0397 | 6.088 | 0.01 |
| COVID-19 cases per 1000 people | Moran’s I statistic | 0.3432 | −0.0204 | 0.0993 | 3.6373 | 0.01 |
| Tests Between-Subjects Effects | ||||||
|---|---|---|---|---|---|---|
| Source | Dependent Variable | Type III Sum of Squares | DF | Mean Square | F | Sig. |
| Corrected | Confirmed | 725,709,352.30 | 5 | 145,141,870.50 | 7.514 | 0.000 |
| Model | Death | 88,008.786 | 5 | 17,601.757 | 21.241 | 0.000 |
| Intercept | Confirmed | 143,780,213.00 | 1 | 143,780,213.00 | 7.443 | 0.009 |
| Death | 15,338.553 | 1 | 15,338.553 | 18.51 | 0.000 | |
| Population density | Confirmed | 36,485,798.84 | 1 | 36,485,798.840 | 1.889 | 0.175 |
| Death | 8391.913 | 1 | 8391.913 | 10.127 | 0.002 | |
| Temperature | Confirmed | 258,922,007.10 | 1 | 258,922,007.10 | 13.40 | 0.001 |
| Death | 19,730.240 | 1 | 19,730.240 | 23.810 | 0.000 | |
| Precipitation | Confirmed | 40,568,504.63 | 1 | 40,568,504.63 | 2.100 | 0.153 |
| Death | 3227.607 | 1 | 3227.607 | 3.895 | 0.054 | |
| Humidity | Confirmed | 77,339,061.270 | 1 | 77,339,061.270 | 4.004 | 0.051 |
| Death | 1544.560 | 1 | 1544.560 | 1.864 | 0.178 | |
| Wind | Confirmed | 7,421,844.831 | 1 | 7,421,844.831 | 0.384 | 0.538 |
| Death | 4768.626 | 1 | 4768.626 | 5.755 | 0.020 | |
| Error | Confirmed | 102,381,7543.0 | 47 | 19,317,312.140 | ||
| Death | 43,918.572 | 47 | 828.652 | |||
| Total | Confirmed | 198,669,3983 | 54 | |||
| Death | 174,588.504 | 54 | ||||
| Country | Inflation before COVID-19 | Inflation after COVID-19 |
|---|---|---|
| Angola | 18.35 | 23.85 |
| Benin | −0.05 | 5.92 |
| Burkina Faso | −0.64 | 3.85 |
| Botswana | 3.03 | 7.24 |
| Central African | 2.15 | 3.34 |
| Côte d’Ivoire | 0.62 | 4.09 |
| Cameroon | 1.76 | 2.27 |
| Congo | 16.99 | 21.89 |
| Congo, Rep. | 1.68 | 1.97 |
| Djibouti | 1.73 | 2.35 |
| Algeria | 2.73 | 7.23 |
| Egypt | 14.14 | 5.21 |
| Ethiopia | 14.83 | 26.84 |
| Gabon | 3.40 | 5.13 |
| Ghana | 8.51 | 9.97 |
| Guinea | 9.65 | 12.60 |
| Gambia | 6.82 | 7.37 |
| Guinea-Bissau | 0.84 | 3.25 |
| Equatorial Guinea | 1.15 | 12.10 |
| Kenya | 4.95 | 6.11 |
| Liberia | 25.26 | 30.86 |
| Libya | 1.68 | 18.24 |
| Sri Lanka | 3.22 | 7.01 |
| Lesotho | 4.60 | 6.05 |
| Madagascar | 6.46 | 5.40 |
| Mozambique | 3.35 | 5.69 |
| Malawi | 9.30 | 9.47 |
| Namibia | 4.00 | 3.62 |
| Niger | 0.25 | 3.84 |
| Nigeria | 11.75 | 16.95 |
| Rwanda | 1.89 | 10.39 |
| Sudan | 57.14 | 59.09 |
| Senegal | 0.74 | 2.18 |
| Chad | 1.65 | 10.77 |
| Togo | 0.81 | 4.55 |
| Tonga | 3.10 | 10.15 |
| Tunisia | 7.00 | 15.71 |
| Tanzania | 3.48 | 3.69 |
| Uganda | 2.74 | 12.21 |
| South Africa | 4.32 | 4.61 |
| Zambia | 8.65 | 22.02 |
| Zimbabwe | 32.95 | 98.55 |
| Paired Samples Test | ||||||||
|---|---|---|---|---|---|---|---|---|
| Paired Differences | t | df | Sig. (2-Tailed) | |||||
| Mean | Std. Deviation | Std. Error Mean | 95% Confidence Interval of the Difference | |||||
| Lower | Upper | |||||||
| Inflation before and during the outbreak of COVID-19 | −5.39643 | 10.52967 | 1.62476 | −8.67770 | −2.11515 | −3.321 | 41 | 0.002 |
Disclaimer/Publisher’s Note: The statements, opinions and data contained in all publications are solely those of the individual author(s) and contributor(s) and not of MDPI and/or the editor(s). MDPI and/or the editor(s) disclaim responsibility for any injury to people or property resulting from any ideas, methods, instructions or products referred to in the content. |
© 2023 by the authors. Licensee MDPI, Basel, Switzerland. This article is an open access article distributed under the terms and conditions of the Creative Commons Attribution (CC BY) license (https://creativecommons.org/licenses/by/4.0/).
Share and Cite
Gotu, B.; Tadesse, H. Assessing COVID-19 Effects on Inflation, Unemployment, and GDP in Africa: What Do the Data Show via GIS and Spatial Statistics? COVID 2023, 3, 956-974. https://doi.org/10.3390/covid3070069
Gotu B, Tadesse H. Assessing COVID-19 Effects on Inflation, Unemployment, and GDP in Africa: What Do the Data Show via GIS and Spatial Statistics? COVID. 2023; 3(7):956-974. https://doi.org/10.3390/covid3070069
Chicago/Turabian StyleGotu, Butte, and Habte Tadesse. 2023. "Assessing COVID-19 Effects on Inflation, Unemployment, and GDP in Africa: What Do the Data Show via GIS and Spatial Statistics?" COVID 3, no. 7: 956-974. https://doi.org/10.3390/covid3070069
APA StyleGotu, B., & Tadesse, H. (2023). Assessing COVID-19 Effects on Inflation, Unemployment, and GDP in Africa: What Do the Data Show via GIS and Spatial Statistics? COVID, 3(7), 956-974. https://doi.org/10.3390/covid3070069