Article

SARS-CoV-2 Contacts’ Symptom Development and Secondary Attack Rate: A Retrospective Analysis of a Contact-Tracing Cohort in Catalonia

by
Meritxell Mallafré-Larrosa
1,
Mercè Herrero Garcia
1,*,
Sergi Mendoza-Funes
1,
Èrica Martínez-Solanas
1,
Glòria Patsi-Bosch
1,
Jacobo Mendioroz Peña
1 and
Pilar Ciruela Navas
1,2 on behalf of the Epidemiological Surveillance Network of Catalonia
1
Sub-Directorate General of Surveillance and Response to Public Health Emergencies, Public Health Agency of Catalonia, Roc Boronat 81-95, 08005 Barcelona, Spain
2
CIBER Epidemiologia y Salud Pública (CIBERESP), Instituto de Salud Carlos III, 28029 Madrid, Spain
*
Author to whom correspondence should be addressed.
COVID 2023, 3(4), 428-439; https://doi.org/10.3390/covid3040032
Submission received: 20 February 2023 / Revised: 20 March 2023 / Accepted: 21 March 2023 / Published: 24 March 2023

Abstract

:
Contact tracing outcome indicators, such as symptom development (SD) and secondary attack rate (SAR) among close contacts (CCs), are key to understanding SARS-CoV-2 transmission. This study analyses SD and SAR and estimates the incubation period (IP) from a cohort of 47,729 CCs from 17,679 SARS-CoV-2 cases diagnosed in Catalonia (Spain) from May to August 2020. Globally, 19.4% of the CCs reported symptoms, especially adult women living in urban areas. SAR was 24.5%, notably higher among infants (37.6%), and 45.9% of secondary cases (SCs) were asymptomatic. Household CCs had 98% (OR: 1.98, 95% CI: 1.81–2.18) and 138% (2.38, 2.19–2.58) increased risk of SD and becoming SCs compared to social settings. The IP was 3.42 days, being 4.10 days among social CCs, and only 15.4% and 4.8% of SCs developed symptoms after days 7 and 10 of quarantine, respectively. These results, notably the higher SAR among asymptomatic children, highlight the importance of diligent monitoring to inform SARS-CoV-2 control strategies.

1. Introduction

Effectively implemented test–trace–isolate programs against the SARS-CoV-2 pandemic can reduce the need for more restrictive, widespread control measures. Such programs include extensive testing to identify cases in the community; public health agencies to trace the close contacts (CCs) of these cases; and supported isolation of index cases and assisted quarantine to their CCs for the period of time that they could be, or become, infectious [1]. Contact tracing (CT) has a fundamental role in cutting transmission chains to mitigate or suppress such a highly infectious disease [2]. Therefore, a strong public health response was built under these principles after the first COVID-19 wave in Europe.
In Spain, the first confirmed case of SARS-CoV-2 was identified on 31 January 2020 [3]; with a clear situation of community transmission, the national government declared a state of alarm entailing a strict lockdown on 14 March. The strategy led to an inflection of the epidemic curve, and the lockdown lasted up until 11 May. In the Spanish region of Catalonia, the decline in cases continued until mid-June; a second wave started throughout July [4], provoking the implementation of new cluster-tailored confinements and mobility restrictions. Following international recommendations [5], a COVID-19-specific CT platform was put in place on 20 May with contact tracers deployed at all levels, including a central call centre, primary health centres, hospitals, and schools. Catalonia’s CT system was scaled up over time, reaching 916 tracers (2.5 contact tracers per 20,000 population) in August, but this was still far from the optimal 5 contact tracers per 20,000 inhabitants, following the Germany model [6].
CT outcome indicators, namely the symptom development (SD) and secondary attack rate (SAR) among CCs, are key to understanding SARS-CoV-2 transmission and guide the CT program towards better performance and effectivity, potentially targeting individuals or groups in the population at higher risk for worse outcomes. In order to prevent onward transmission, initial estimates based on the SARS-CoV-2 incubation period concluded that CCs should quarantine for 14 days since the last exposure with the index case [3,7]. In 2020, during the summer’s second wave, which was beyond the CT programme’s capacity, many European public health institutions (i.e., France) adapted quarantine periods to more feasible lengths that could reduce the socioeconomic impact [8].
Published SAR estimates showed the importance of stratifying this indicator given setting-specific transmission risks [9], with emerging evidence that infection risk among household CCs could be up to six times higher than in other settings [1]. Moreover, guiding CC testing policy using SD had to be re-considered, given the unclear role of asymptomatic transmission, which could account for up to 50% of subsequent infections [10]. In this context, close contact universal PCR testing was approved in Catalonia on 7 August 2020, following test market availability, and it was progressively implemented over the following months. Therefore, all contacts were tested regardless of the presence of symptoms.
There is a clear lack of real-field data on SARS-CoV-2 transmission dynamics and CC outcomes from 2020 in Catalonia. This information is crucial to guide future public health measures, their adaptation throughout the pandemic, and harmonisation across regions and countries. To that end, this study analyses a cohort of CT-identified CCs with the aim to investigate COVID-19-like SD and assess the SAR, considering different demographic and epidemiological characteristics. Additionally, the incubation period among secondary cases (SCs) is estimated, in order to evaluate the pertinence of the CC quarantine length.

2. Methods

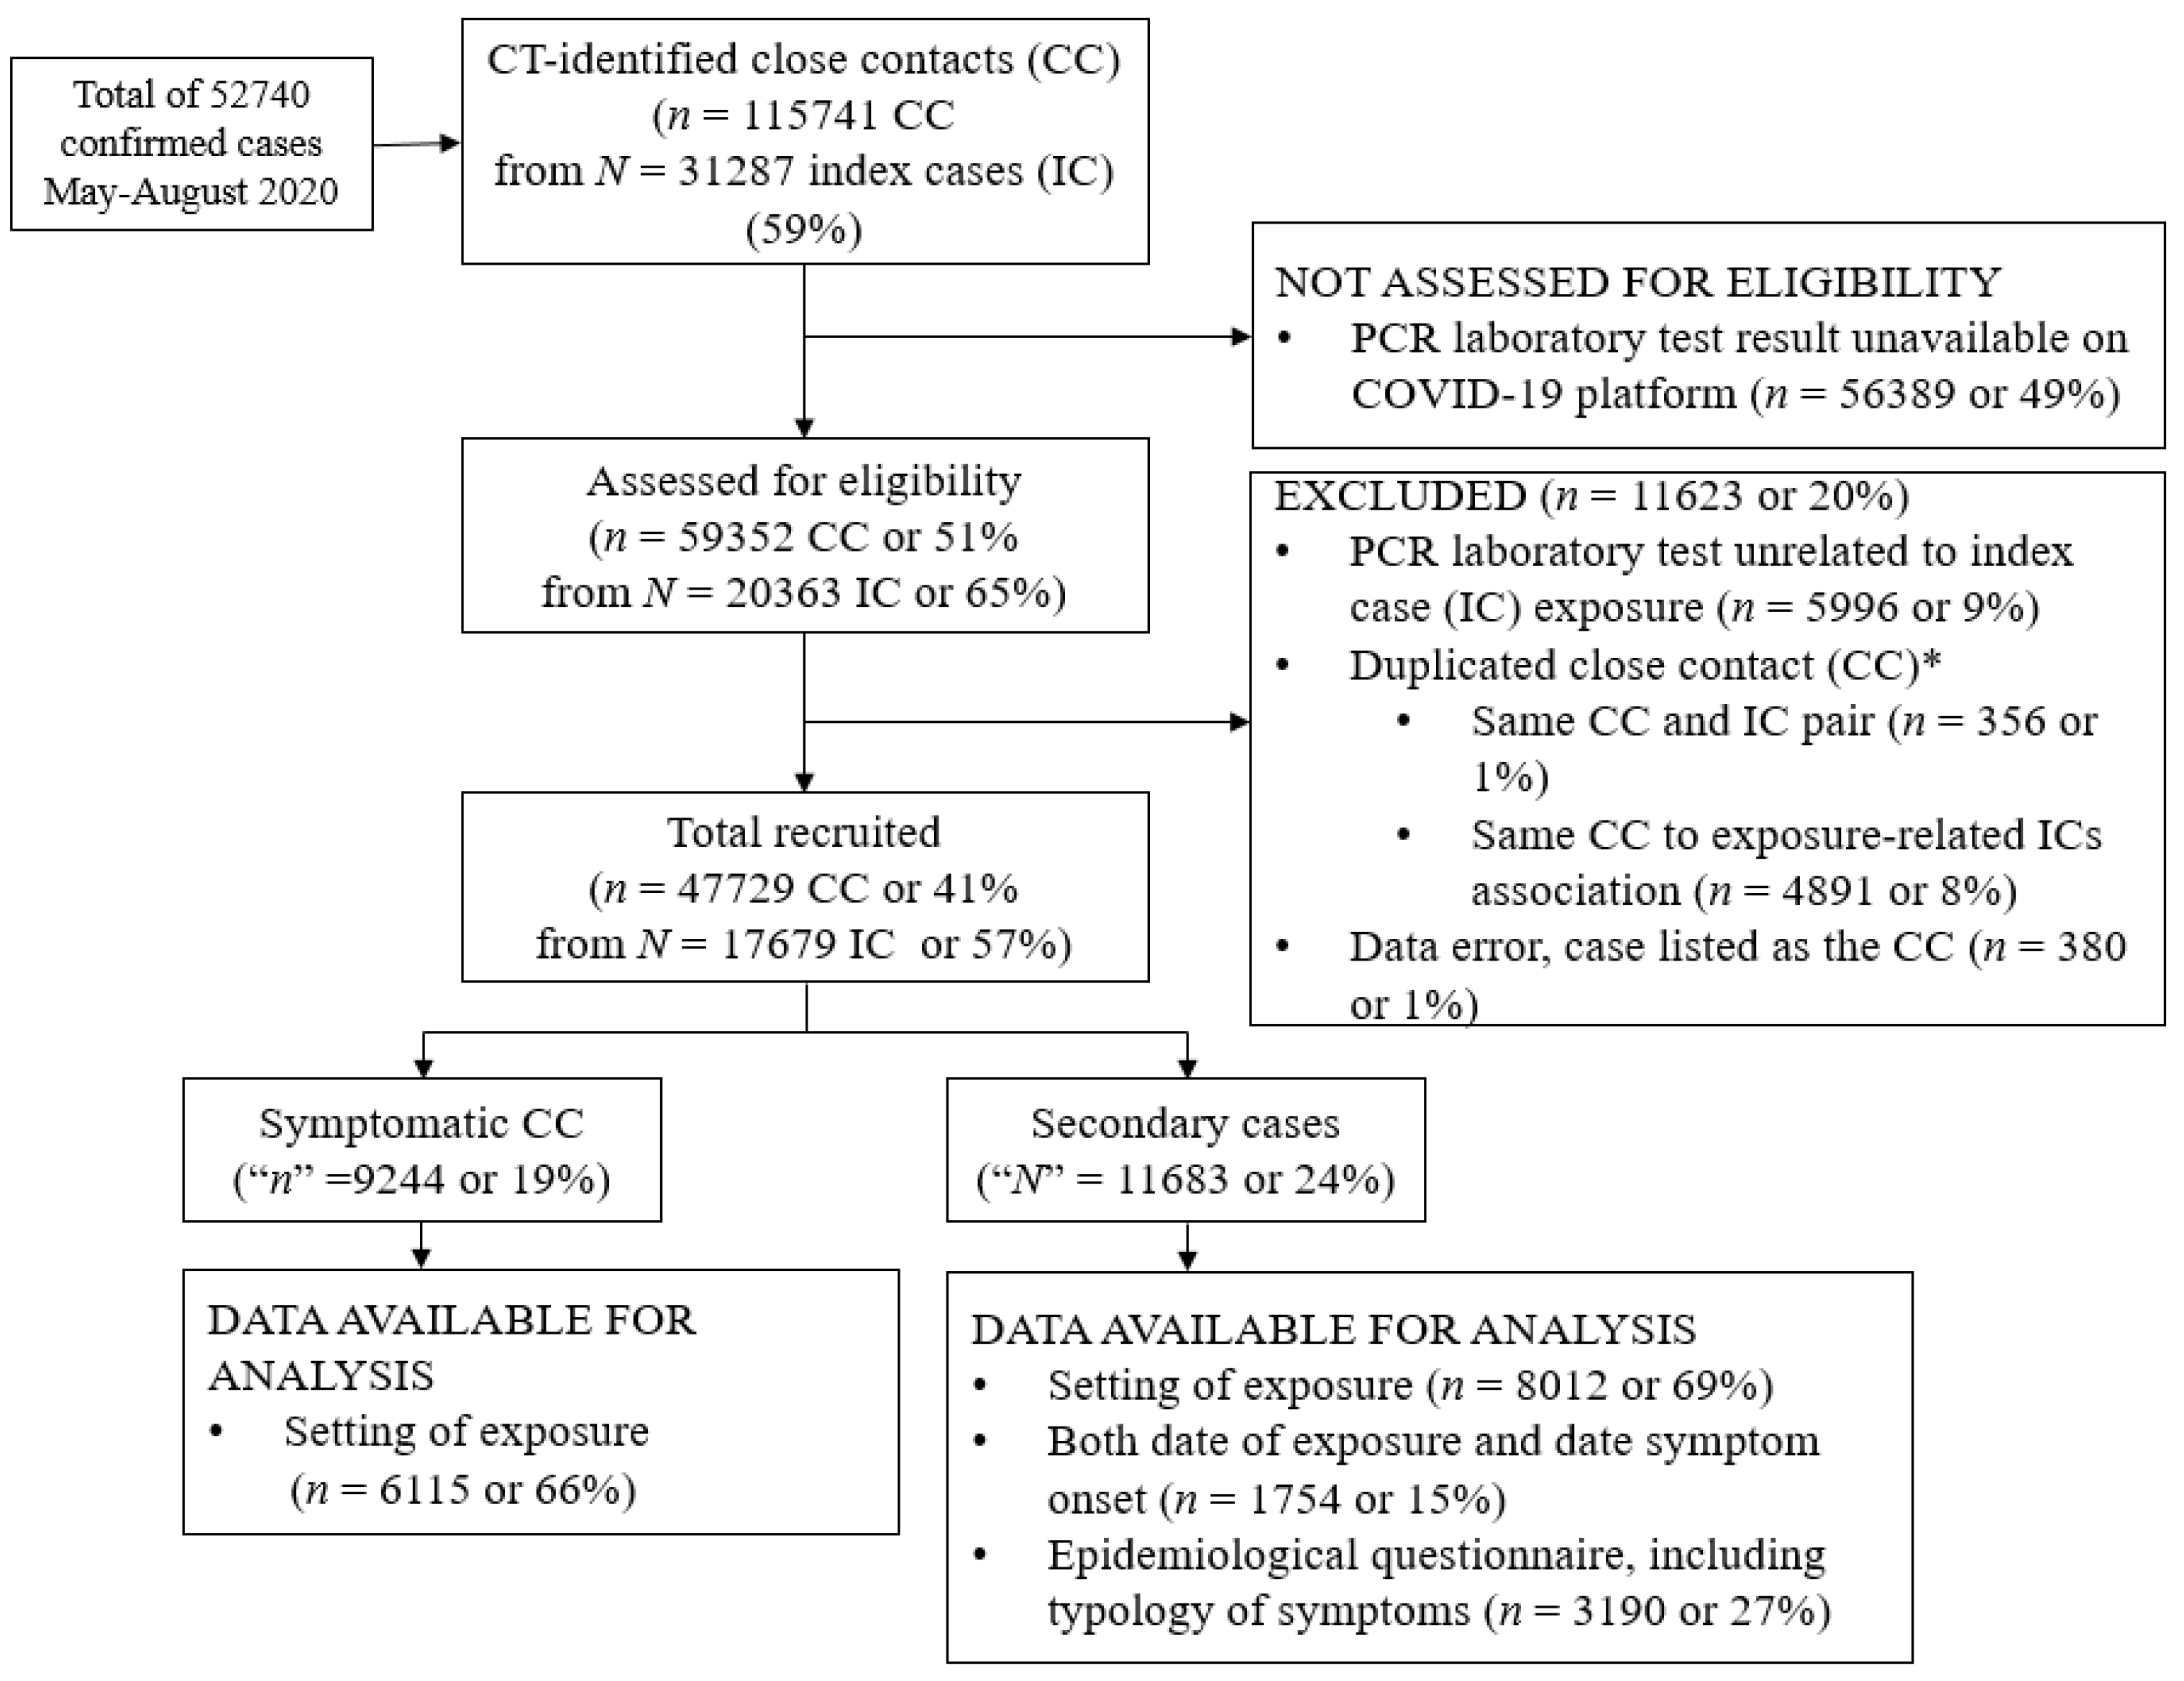
2.1. Study Design and Population

We conducted a retrospective-ascertained study of CCs from confirmed SARS-CoV-2 cases managed in Catalonia between 20 May 2020 and 31 August 2020. Contacts stored in the CT database were included from 48 h prior to the first diagnosed case (on 20 May 2021) and followed up until 14 days after the last exposure to the index case (until 14 September 2020) [11]. Several exclusion criteria were defined to further determine the cohort, namely CCs without any SARS-CoV-2 Polymerase Chain Reaction (PCR) test available. Moreover, temporal filters were applied to ensure the CC PCR results were associated with the index case exposure of the study and duplicated or erroneous CCs were excluded. Figure 1 shows a summary of the population selection.
This study followed the STROBE reporting guideline [12], and all methods in the study were carried out in accordance with the Helsinki guidelines and declaration or any other relevant guidelines [13,14]. Information was collected using case interviewers and contact tracers at all surveillance system levels according to the COVID-19 protocol from the Public Health Agency of Catalonia [12].

2.2. Case Ascertainment and COVID-19 CT Program

A confirmed case met the criteria of COVID-19 notification if tested positive using PCR, regardless of whether symptomatic or asymptomatic. Case detailed information was collected as part of the “Case epidemiological interview” COVID-19 protocol [15], including a listing of CCs and its exposure setting starting 48 h prior to case symptom onset (extended up to 14 days in case of local outbreak declaration) until the date of case isolation. If the case was asymptomatic, the period started 48 h prior to the date of microbiological sample collection.
A CC was defined as an individual who had face-to-face contact with a confirmed case for more than 15 min within less than a 2-m distance and did not wear appropriate personal protection equipment [15]. All CCs were notified with a telephonic call at “day 0” in which 14-day quarantine instructions were provided, starting from their last exposure to the index case and ending with at least 72 h without symptoms. The information collected in this initial call, as described in our protocol “Contacts epidemiological interview” [15], included, among others, the settings of exposure and COVID-19-like symptoms (described below). CCs were monitored with a follow-up call on days 7 and 14 of quarantine, and a PCR test for COVID-19 was performed (24–48 h after index case diagnostic or exposure) only when any COVID-19-like symptoms were detected. Starting on 7 August, the protocol was updated to perform PCR on all CCs regardless of symptoms (CC universal PCR) [11].
Once a CC was identified as a confirmed case, that contact was excluded from the CT follow-up system (calls on days 0–7–14), and then, the case investigators team would call the case for an interview instead of the contact tracers team.
Strict General Data Protection Regulation (GDPR) compliance was ensured concerning the database storage system and solely the CT workforce was granted access. Anonymized data were used to perform all the analyses.

2.3. Close Contacts’ Assessed Outcomes

SD and the SAR were analysed as part of the monitoring and evaluation of the CT program. SD was collected using the COVID-19 CT platform. The symptoms suggestive of COVID-19 included ageusia, anosmia, fever, cough, odynophagia, chill, dyspnoea, vomiting, diarrhoea, and cephalea. The SAR, defined as the proportion of confirmed infections among all traced CCs, was calculated by dividing the number of exposed CCs who tested positive by the total number of exposed CCs to an index case. The incubation period was estimated as the time difference from the date of last exposure with the index case up until the date of CC symptom onset (expressed in days). Same-date registries were computed as day zero, and only exposure dates prior to SD were accounted for. We restricted the analysis of the incubation period to those CCs that became cases with the date of symptom onset and date of last exposure available and that were registered in August (as the setting of exposure was only collected in this month). Moreover, only positive values were considered, that is, the date of symptom onset was the same or after the date of the last exposure to the index case.
The outcome analyses (SD and SAR) were stratified by sex, age, month, and setting of exposure (available for CCs registered in August, and classified as ‘household’, ‘social’, ‘non-household/non-social’, and ‘unknown settings of exposure). The ‘non-household/non-social setting included workplace, transport, school, and social care settings; while ‘unknown‘ included other settings not included in the described ones (such as long-term health facilities). Household CCs entailed individuals living in the same home regardless of familiar relations, while meeting sporadically was categorized as social. Moreover, CCs were classified according to the urban or rural environment, based on the number of inhabitants of their municipality being higher or lower than 10,000 [16,17]. An additional sub-analysis of the pre- and post-universal PCR policy instauration period (“before” and “after” August 7) was conducted to assess any differences in the abovementioned outcomes.

2.4. Statistical Methods

We performed descriptive statistics based on frequencies, for categorical variables, and mean and median values (including standard deviation (SD) and interquartile range (IQR), for continuous variables. Statistical differences between symptomatic CCs and SCs and demographic (age, sex), temporal (month), and territorial (based on the number of population) characteristics were tested using χ2, Fisher’s exact test, or the Kruskal–Wallis test at a 0.05 significance level. Logistic regression models were applied to assess the interrelation of the variables mentioned above (odds ratio (OR) and 95% Confidence Interval (CI)). All statistical analyses were performed using the R software (version 4.0.3).

2.5. Ethical Considerations

All data used in the analysis were collected during routine public health surveillance activities, as part of the legislated mandate of the Health Department of Catalonia, the competent authority for the surveillance of communicable diseases, which is officially authorized to receive, treat, and temporarily store personal data on cases of infectious disease. The need for ethical approval for the study and the need for informed consent both were waived by the ethical committee from the Public Health Agency of Catalonia, Institutional Review Board. All data were fully anonymized.

3. Results

Between May and 31 August 2020, 287 (59%) out of 52,740 SARS-CoV-2 infection-confirmed index cases (ICs) had their contacts identified, amounting to 115,741 CCs. After applying all inclusion and exclusion criteria, 47,729 CCs (41%) related to 17,679 IC (57%) were enrolled in the study (Figure 1).

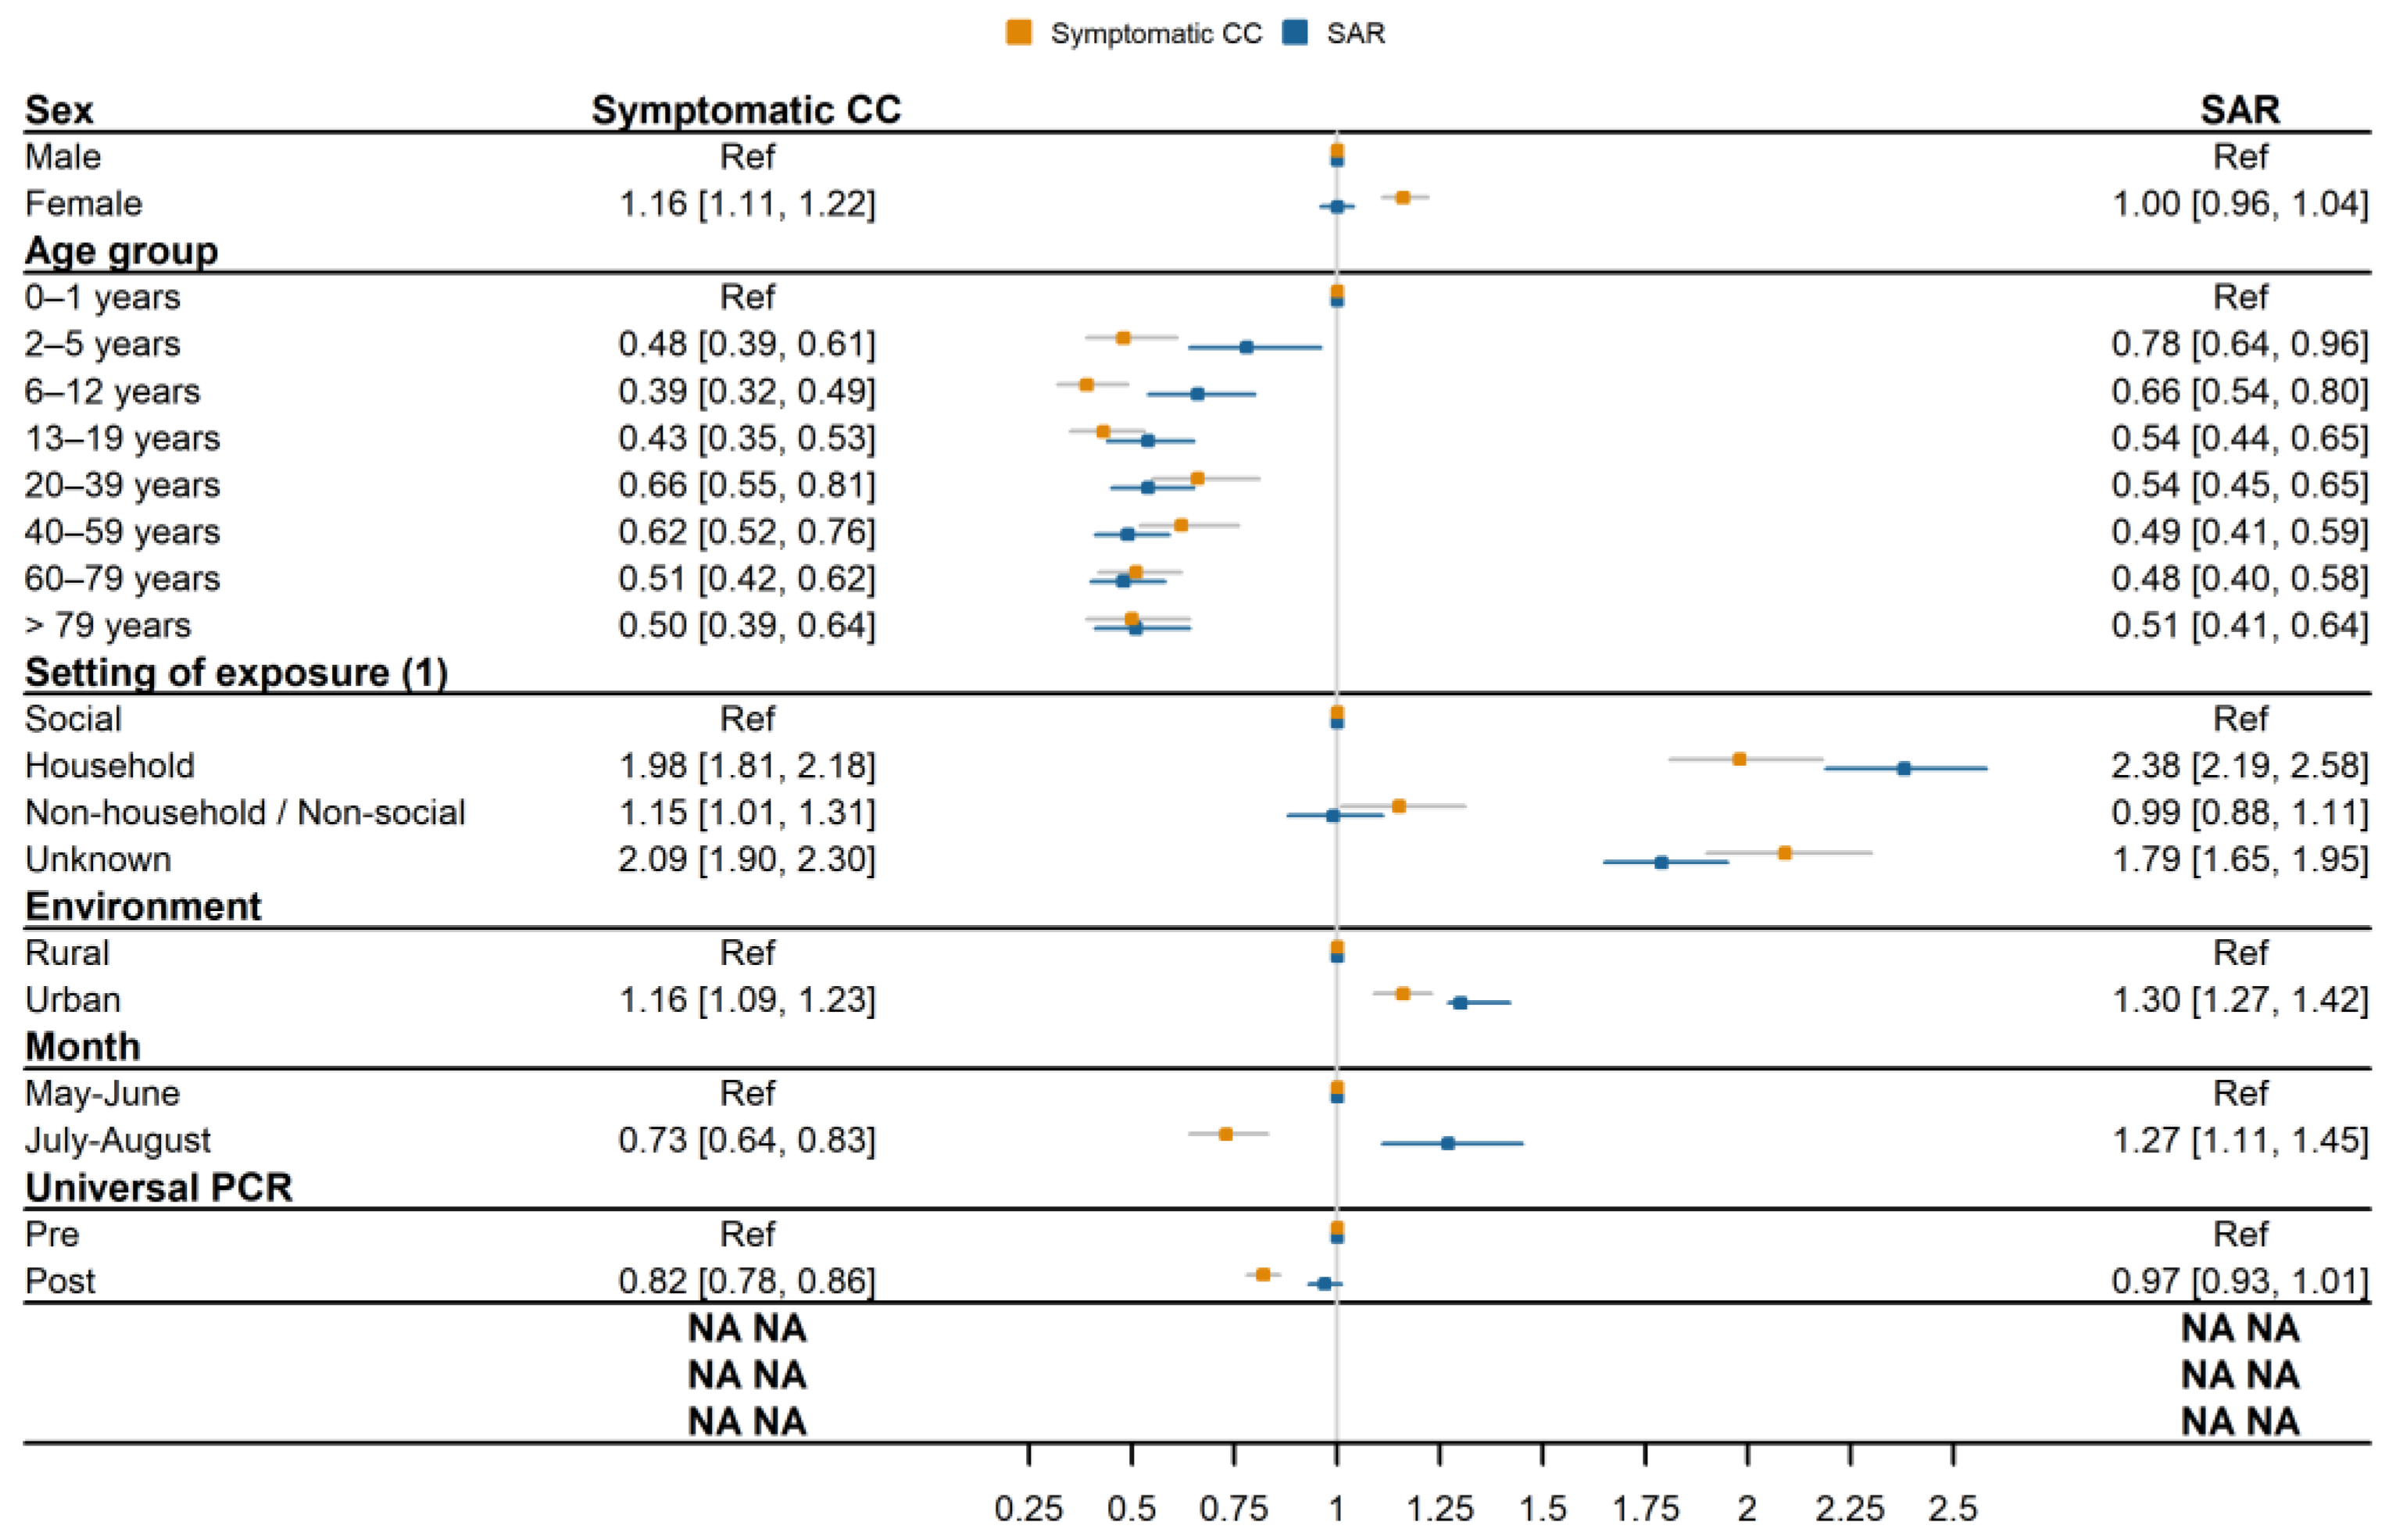
3.1. CC Demographic Characteristics by Outcome

Table 1 shows demographic characteristics of CCs by outcome, which is disaggregated into two periods: pre- and post-universal PCR. A total of 9244 (19.4%) CCs reported SD throughout the follow-up, 21.2% (4267) during the pre-universal PCR period, and 18.0% (4977) during the post-universal PCR period. We observed an overrepresentation of women (20.5% women vs. 18.1% men, p < 0.05) and 0–1-year-old children and adult-aged groups (20–39 years old) 29.4% and 21.6%, p < 0.05, respectively, reporting symptoms and increasing in the pre-universal PCR period (33.3% in children and 23% in adults 20–59 years). Statistical differences were observed depending on the setting of exposure, with an increased SD among household CCs (20.6%), when compared to non-household/non-social and social CCs (13.1% and 11.6%, respectively, p < 0.05). Most of the symptomatic CCs lived in an urban environment; however, those in rural areas reported fewer symptoms (19.6% in urban, 17.4% in rural, p < 0.05).
The overall SAR was 24.5%, which corresponds to 11,683 CC secondary cases (Table 1). Notably, the groups of infants (0–1 year, y) and toddlers (2–5 y) had the highest SAR (37.6% and 32.1%, respectively, p < 0.05). No statistical differences were observed by sex. The SAR varied greatly by the setting of exposure, ranging from 30.4% among households to 15.5% in social settings (p < 0.05). To be noted is the fact that households represent the majority of our sample (August sample distribution: 38.0% household, 16.1% social, 10.9% non-household/non-social, and 34.9% unknown. While considering pre- and post-universal PCR, there were almost no differences in SAR (a decrease of 0.6% in the post-universal PCR period, not statistically significant). Figure 2 reports the odds ratio (and 95% CI) of SD and SAR by demographic characteristics. Women were 16% more likely to become symptomatic (OR 1.16, 95% CI: 1.11–1.22), whereas they showed no differential risk of evolving into an SC (1.00, 0.96–1.04). Infants aged 0 and 1 years old had the highest risk of SD, as we found ORs below 1 in all categories of age. Similarly, we observed that infants were more susceptible to infection than toddlers (2–5 y; 0.78, 0.64–0.96) and elementary-school-aged children (6–12 y; 0.66, 0.54–0.80). When considering the setting of exposure, household CCs had 98% (1.98, 1.81–2.18) and 138% (2.38, 2.19–2.58) increased risk of becoming symptomatic and SCs, respectively, compared to social CCs. Moreover, CCs living in urban areas had a 16% (1.16, 1.09–1.23) and 30% (1.30, 1.27–1.42) increased risk of SD and SAR, respectively, when compared to rural settings. Moreover, rural-based CCs had a lower SAR compared to urban (19.9% vs. 25.0%, p < 0.05) (Table 1). Finally, those CCs notified during the pre-universal PCR period had an 18% decreased risk of SD (0.82, 0.78–0.86); however, no differences were assessed for the SAR (0.97, 0.93–1.01) (Supplementary Material Figures S1 and S2).

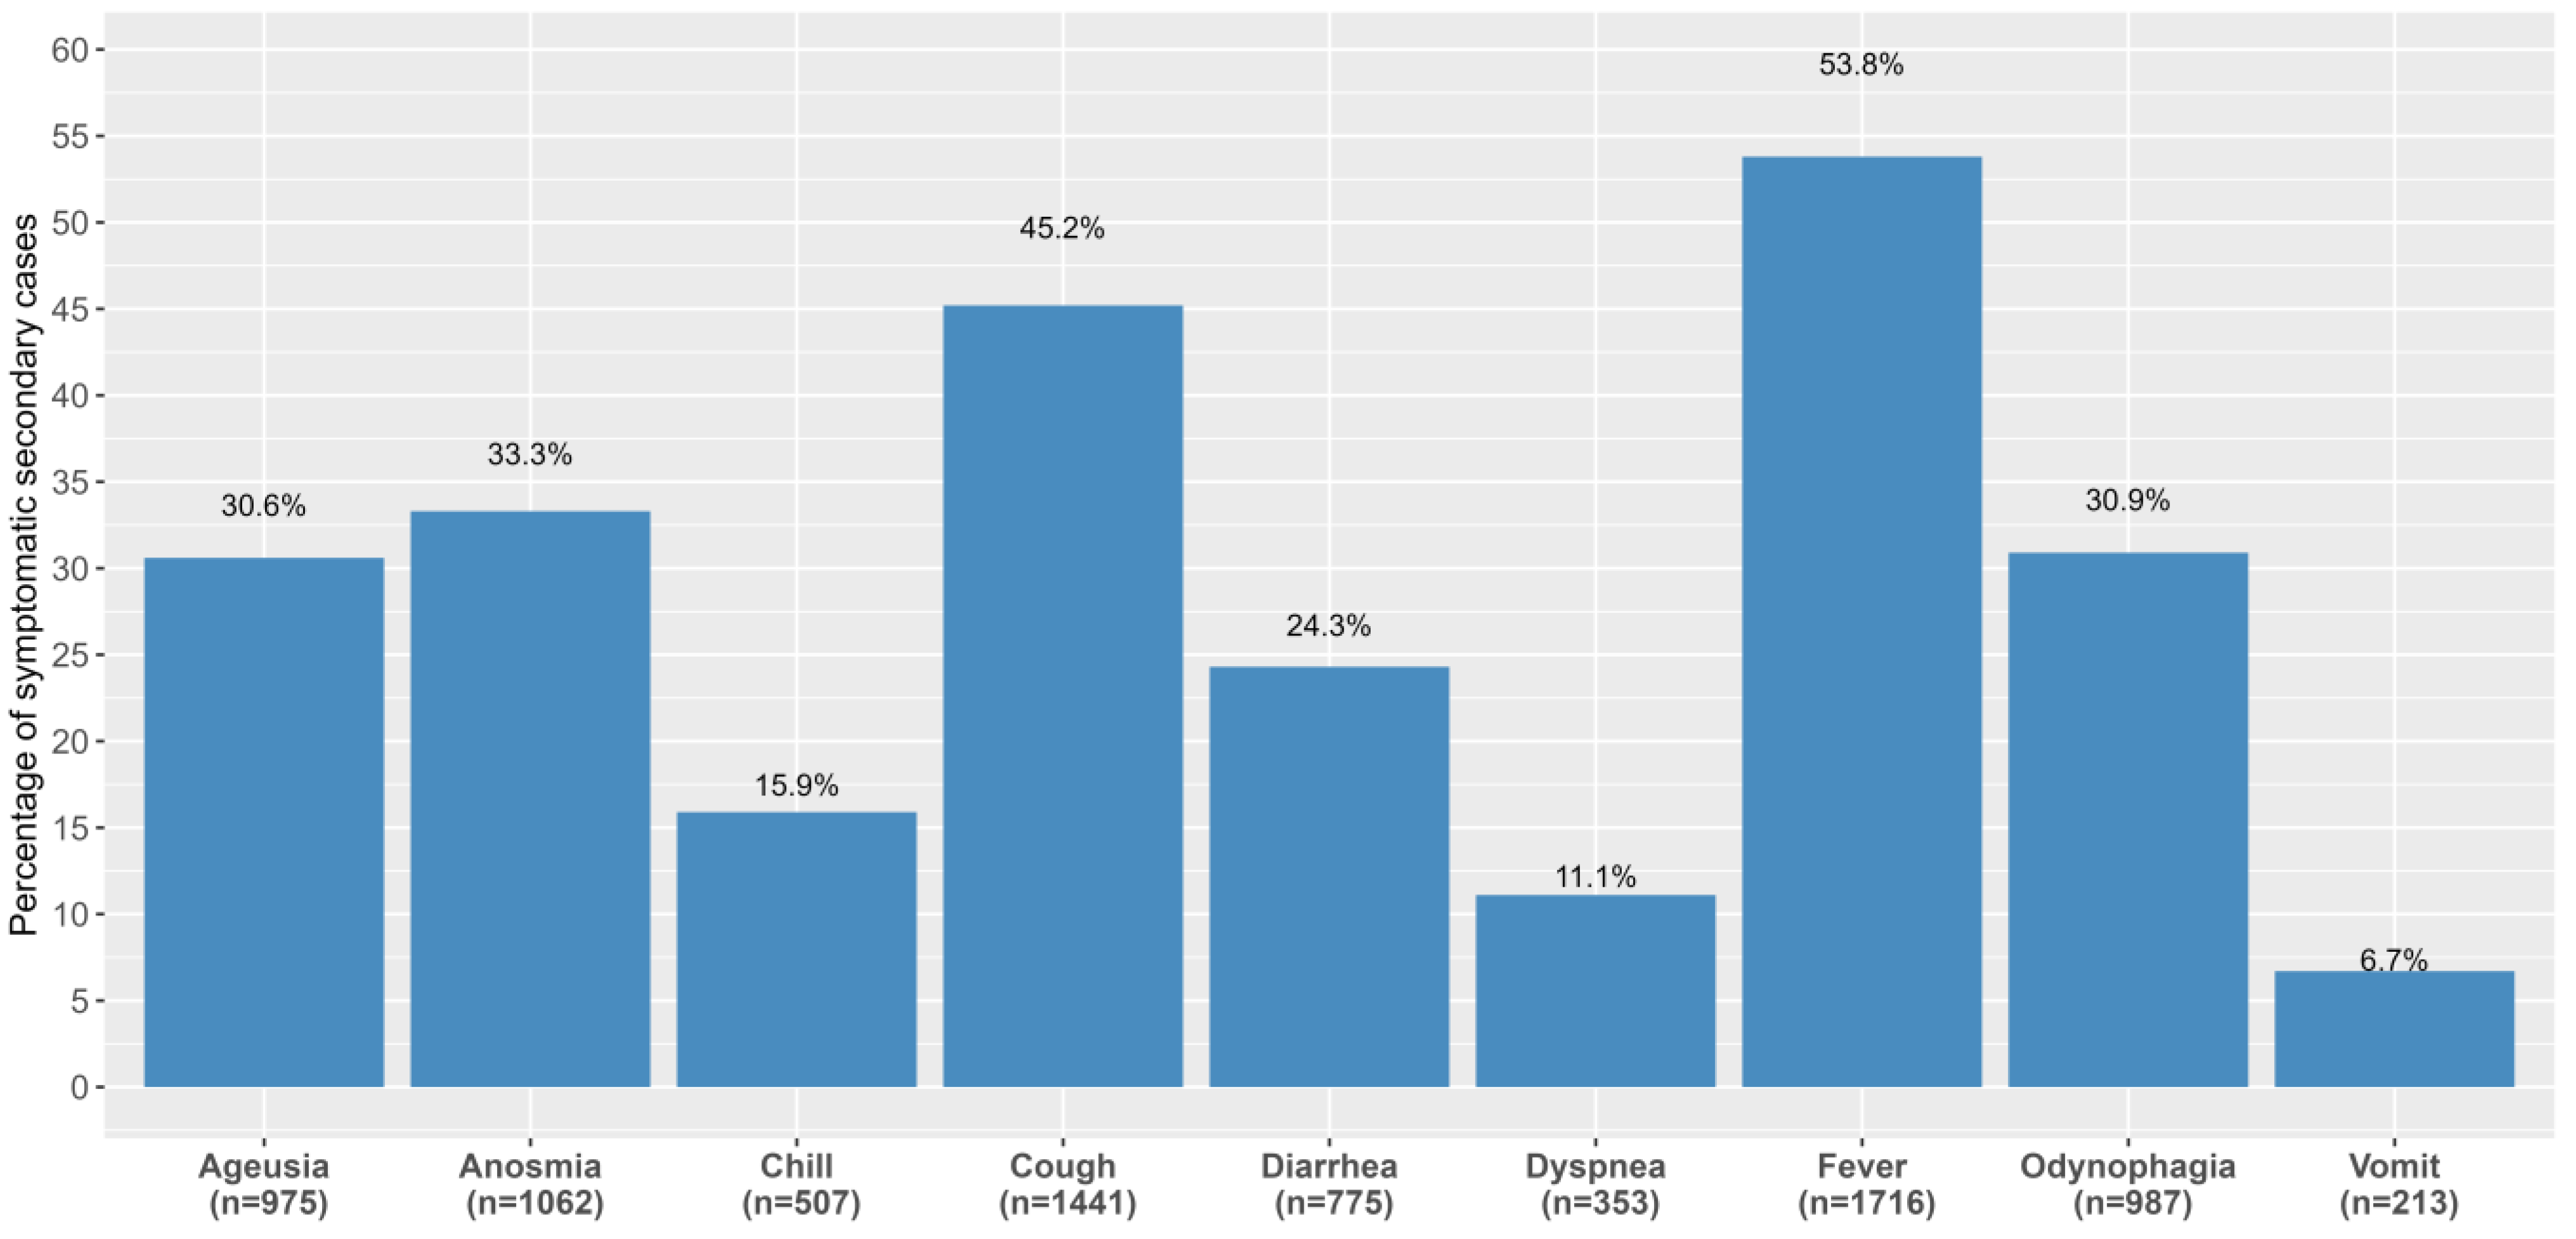
3.2. Symptom Development among Secondary Cases

When assessing the interrelation of the two investigated CC outcomes, over half of the SCs were symptomatic (6326, 54.1%) (Table 2). Conversely, 68.4% of suspected cases (i.e., symptomatic CCs) became confirmed (Supplementary Material Table S1). Male SCs were more likely to be asymptomatic when compared to women (47.9% vs. 44.0%, p < 0.05). Mid-childhood (62.5%) and adolescents (56.3%) SCs were more likely to be asymptomatic than adult age groups (average 42.2%). Household asymptomatic SCs were more prevalent compared to non-household/non-social CCs (50.1% vs. 42.3%, p < 0.05). Moreover, the proportion of symptomatic SCs slightly increased in the pre-universal PCR period (56.3%) compared with the post-universal PCR (52.6%), p < 0.05) (Supplementary Material Table S2).
Results from a subset of 3190 SCs with epidemiological interview data available showed that the most frequently reported symptoms were fever (53.8%), cough (45.2%), anosmia (33.3%), odynophagia (30.9%), and ageusia (30.6%) (Figure 3, Supplementary Material Table S3). We observed sex and age group differences regarding the typology of symptoms reported (Supplementary Material Table S3a,b). Sore throat, dyspnoea, vomiting, ageusia, and anosmia were slightly more frequent in women (p < 0.05). Additionally, over 60 years old SCs manifested lower respiratory symptoms (cough and dyspnoea, both p < 0.05) compared to younger generations, which in turn reported an increased proportion of upper respiratory symptoms (anosmia, ageusia, and odynophagia, all p < 0.05).

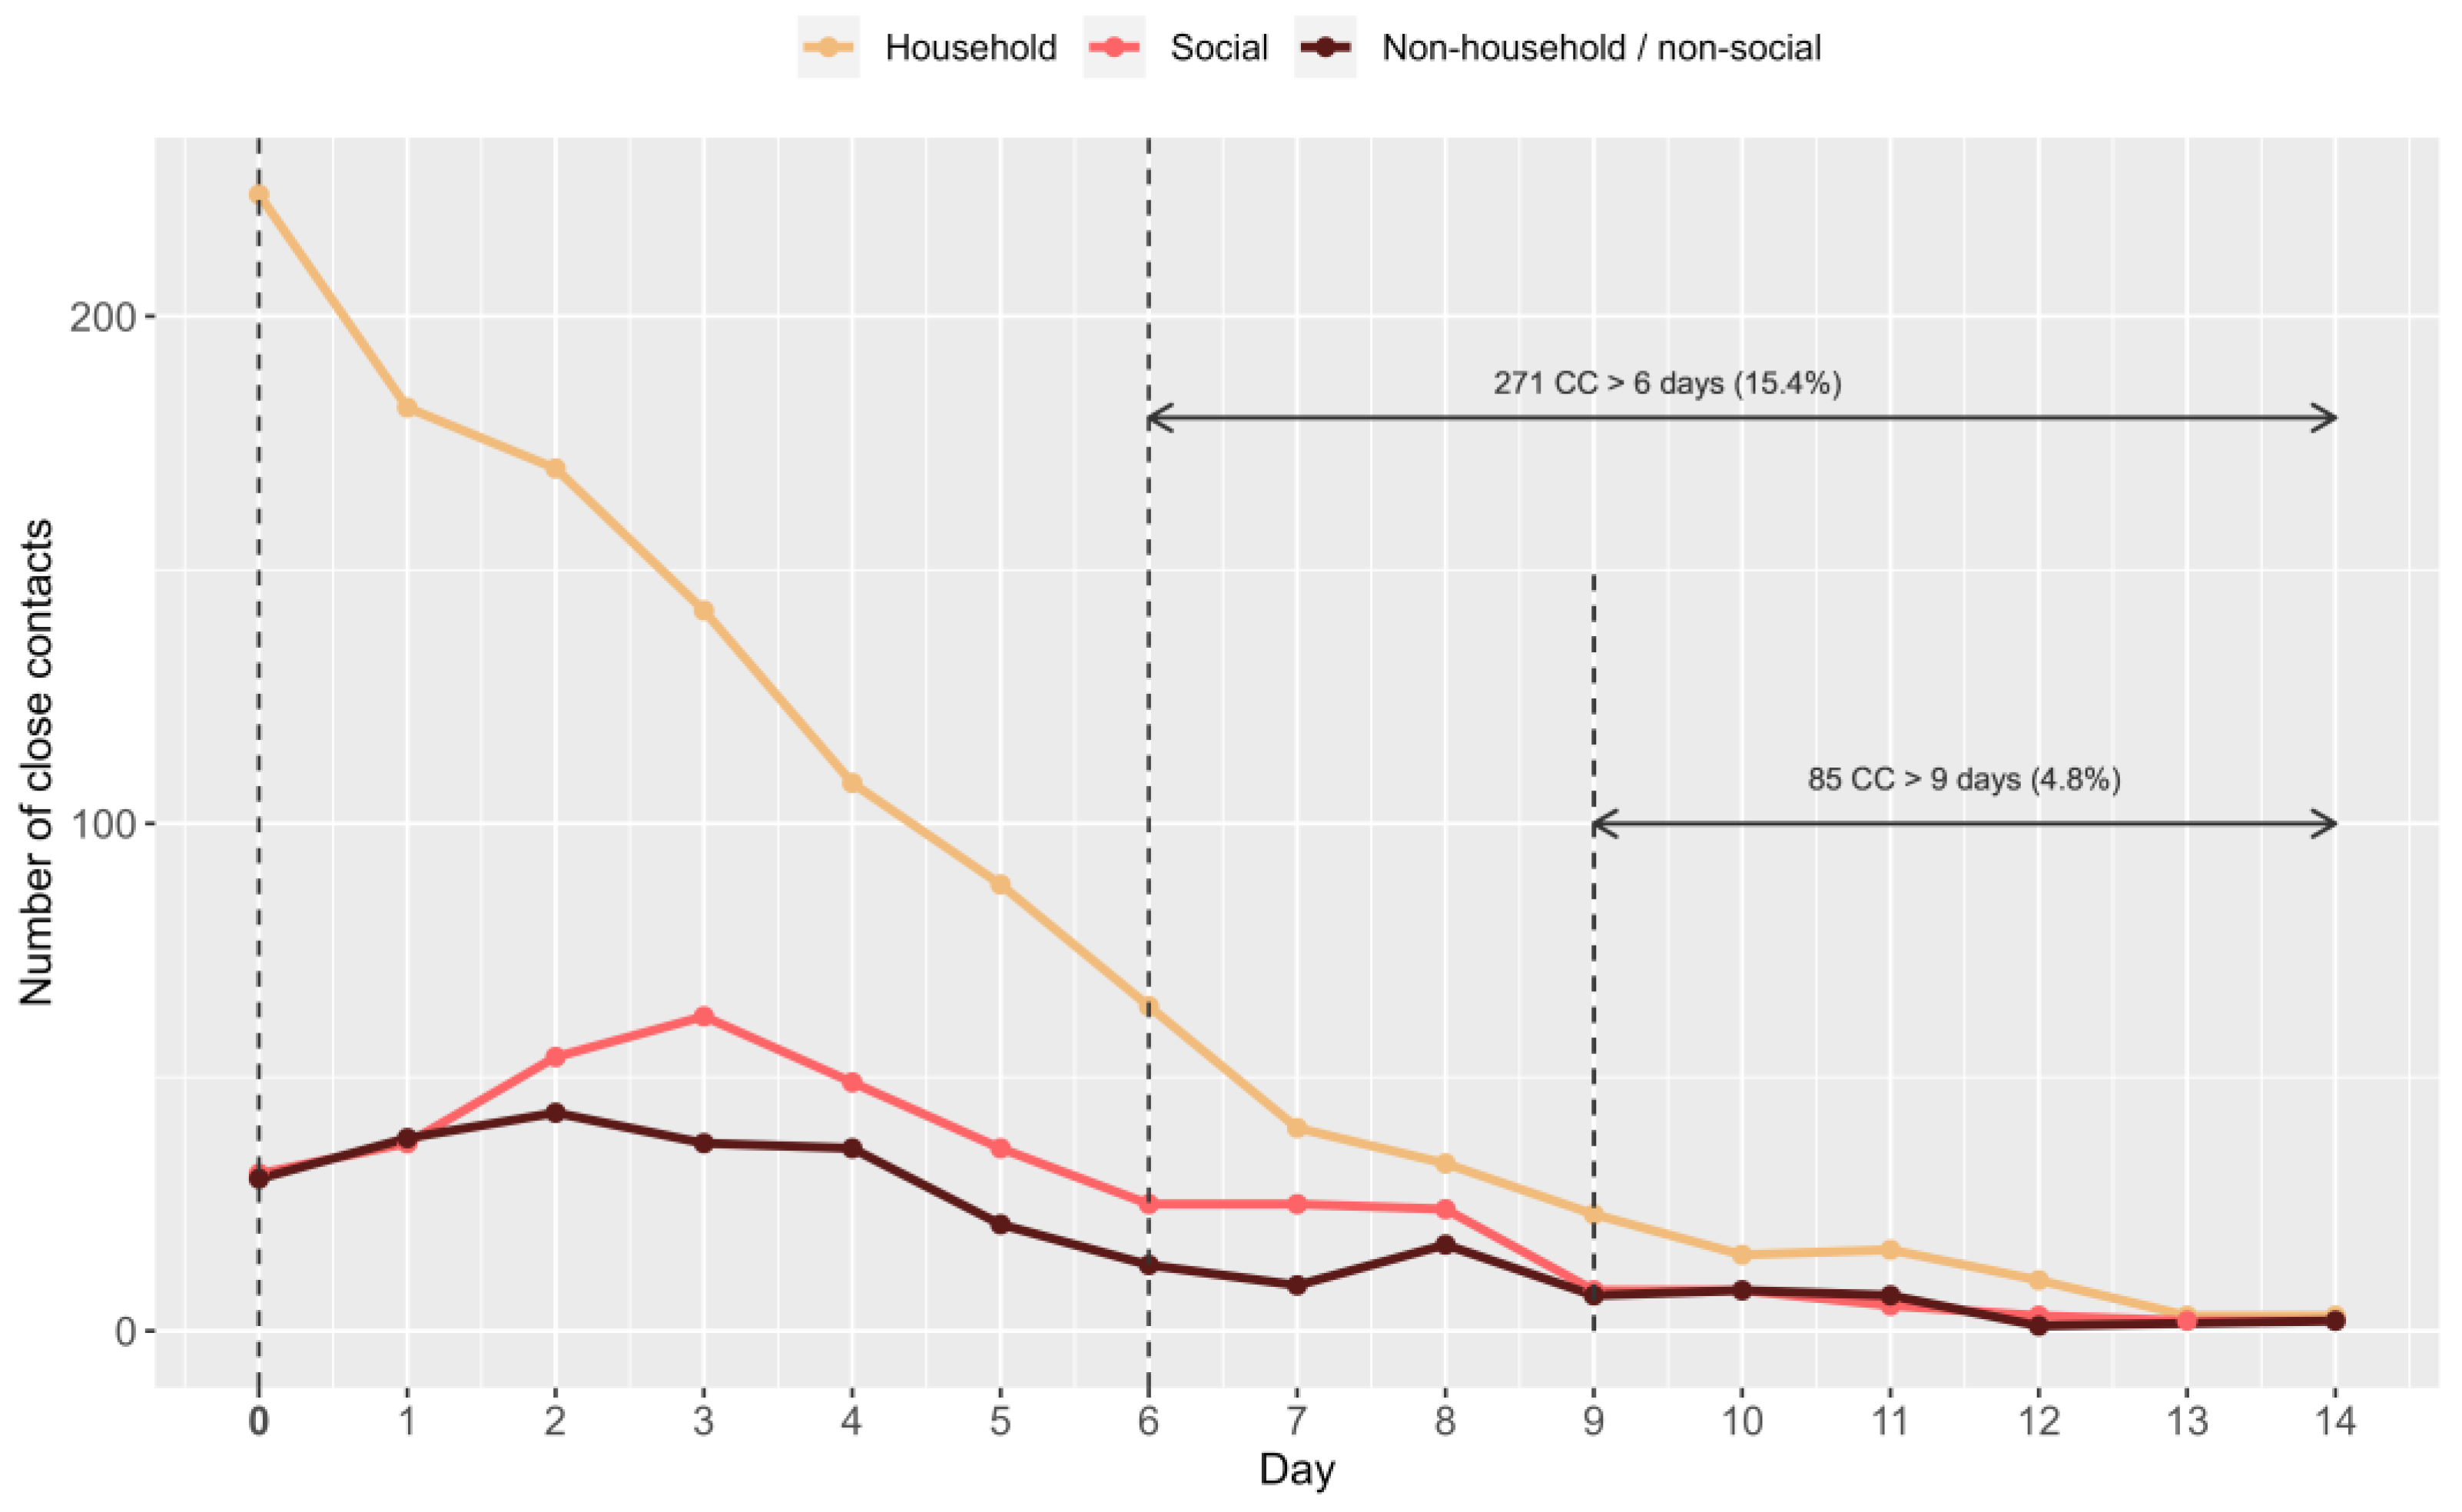
3.3. Incubation Period of Secondary Cases

In order to investigate SD temporality, the incubation period was investigated using a subset of 1761 SCs with the date of last exposure to the IC available and estimated at an average of 3.42 days (SD: 2.96, IQR: 1–5). Given the difficulty in assessing the last exposure in household CCs, separate estimates were calculated at 4.10 days (SD: 2.91, IQR: 2–6) among social CCs and 3.80 days (SD: 3.06, IQR: 1–5) for non-household/non-social CCs (Table 3).
We observed a progressive decrease in the percentage of symptomatic CCs throughout the 14-day quarantine, primarily up until 6 days from IC exposure (Figure 4). Nevertheless, 15.4% of SCs developed symptoms after day 6 and only 4.8% after day 10 of quarantine (Figure 4). Significant differences by the setting of exposure were observed (p < 0.05), and non-household CCs were more likely to SD after 9 days and onwards (household: 3.9% vs. social: 4.9%) (Table 3).

4. Discussion

The findings of this study provide insight into the epidemiology of COVID-19 in Europe based on comprehensive surveillance and CT data from the region of Catalonia, Spain. The analysis suggests the existence of a substantial variation in an individual’s likelihood of SD and SAR. We estimated an overall SAR of 24.5%, in line with similar previous CT-based cohorts [18,19], and slightly higher than other studies assuming untested contacts as negative [20], an approach we disregarded especially given the observed high rate of asymptomatic positivity. Significant differences were observed among the SAR according to the setting of exposure, ranging from 30.4% among households to 15.5% in social settings, and are above the results of other studies, such as the pooled 18.1% household-specific SAR from a recent metanalysis [9]. With a household-predominant cohort, our result is at the expense of settings with recognisably lower SAR, such as healthcare or nursing home settings [9], which are not addressed in this study.
Remarkably, we observed a higher SAR (>30%) in under 12-year-old CCs, driven by an increased risk of infection among infants (aged 0–1 year) when compared to toddlers and elementary-school-aged children, in line with results observed in China [20]. This is probably due to the difficulty of infant isolation from parents during the quarantine, and underpins the need to provide supported isolation to infected individuals and vulnerable groups such as children, making it clear social determinants of health must be included as part of pandemic research priorities [21,22]. Furthermore, our results highlight that young cohorts should be prioritised for vaccination safety and effectivity trials [23], especially with the fast-spreading transmission of the new delta variant in UK schools during the study period [24]. It should be noted that global vaccination equity is to be balanced out and taken into account when designing local interventions [25]. We also found higher SAR estimates in urban settings that validate previous results that population density directly affects SARS-CoV-2 incidence [19].
Despite the CT testing policy change on 7 August 2020, evolving into a universal PCR testing for all CCs regardless of symptoms, SAR estimates are similar before and after the change in that policy (24.8 and 24.2%, respectively). The reason could be that only 3 weeks of August of our data belong to the universal PCR period; therefore, differences due to this progressive policy implementation may not be reflected in our study. Nonetheless, the screening of asymptomatic people during cluster investigations is included in both periods, pre- and post-universal PCR. However, we did observe an effect in the higher proportion of asymptomatic SCs detected, probably related to the sustained increase in testing capacity over the months of July and August 2020 (43.7% pre-universal PCR vs. 47.4% post-universal PCR; Table 2). Detecting asymptomatic infections is a key element for epidemic control, as some studies suggest that up to 50% of subsequent infections would have originated from exposure to individuals without symptoms [10]. In a concurrent study, 36% of children (<18 years) who tested positive for SARS-CoV-2 reported no symptoms; moreover, the authors highlighted this is likely an underestimation of the true prevalence of asymptomatic SARS-CoV-2 infection, as those without symptoms are much less likely to seek testing [26]. Thus, we propose an all-encompassing testing policy that would provide the highest impact on young cohorts. Moreover, our results showed that CC testing based solely on symptom development is not a reliable strategy, given that over 30% of CCs reporting symptoms do not become SCs after testing and, conversely, 45.9% of detected SCs were asymptomatic.
The testing strategy is in itself related to the incubation period and, therefore, the quarantine length. We observed a low fraction of SCs developing symptoms between day 6 (7 days quarantine) and 9 (10 days quarantine), (15.4% and 4.8%, respectively). This result, when accompanied by timely testing around day 5 or 6 of quarantine, could support the shortening of quarantine lengths as modelled in a recent study [27]. A similar strategy was approved early in France on 11 September 2020, with a 7-day quarantine ending with a PCR test in the case that no symptoms were developed within that period [8]. In Catalonia, a 10-day quarantine was implemented in October 2020 (except for nursing homes and other specific situations following epidemiologists’ recommendations) [28]. Moreover, the differences in the estimated incubation period observed by the setting of exposure open the floor to discuss potentially differential lengths for household CCs. Testing upon entry to quarantine, a common practice in our setting, carries a risk of false negatives [18], as infected individuals who start quarantine very early in the incubation period of the disease may not be detected due to low viral load. Our results should be treated with caution, given the possible role played by new variants and their effects on the incubation period [29].
This study has several limitations. First, SD was self-declared and collected throughout CC follow-up and case investigation, and SCs were excluded from the CT system after diagnosis. Moreover, data related to symptom typology was only available for SCs and probably those hospitalised with severe clinical symptoms were unable to complete case investigation, and thus assess the specific symptom’s predictive value of SAR. Second, data on untested CCs, as well as associated CC comorbidities and settings of exposure before August 2020 were not available, and we could not test differences in the analysed outcomes. When describing settings of exposure, “unknown” was one of the options used because the COVID-19 CT platform was not ready to include other settings. To avoid bias, our cohort sample was processed so that CCs without testing results available after exposure to a confirmed case would not account for estimated outcomes. Third, the date of the last exposure to the IC is challenging to interpret in our most represented setting, the household, limiting a general extrapolation of the disease’s incubation period. To overcome this limitation, this metric was calculated separately for non-household CCs. Fourth, although no extensive socioeconomic factors could be explored in the cohort, we provided an approximation for the importance of environmental factors when assessing differences in urban and rural settings.

5. Conclusions

In summary, contact tracing is a critical component of an effective public health response to COVID-19 [30,31]. The results of this study suggest that increasing testing capacity towards universal CC PCR testing is fundamental to effective CT, and certain individual and environmental factors might have to be considered to design targeted strategies, especially among young and asymptomatic CC groups. Moreover, the results of this study indicate shorter quarantines, and potentially its stratification depending on special CC subsets, might be effective to reduce the negative socioeconomic impact of test–trace–isolate programs, although new variants may change this scenario.

Supplementary Materials

The following supporting information can be downloaded at: https://www.mdpi.com/article/10.3390/covid3040032/s1, Table S1. Symptom development and confirmation of COVID-19 case among close contacts (CC). Table S2. Demographic factors of symptom development among secondary cases reported at the time of case epidemiological interview before and after the Universal PCR strategy. Table S3. Typology of COVID-19 like symptoms among symptomatic secondary cases (SC) (a) Typology of COVID-19 like symptoms among symptomatic secondary cases by sex (b) Typology of COVID-19 like symptoms among symptomatic secondary cases by age group. Figure S1. Forest plot symptom development by pre and post universal PCR period. Figure S2. Forest plot secondary case by pre and post universal PCR period.

Author Contributions

Conceptualization, M.M.-L., M.H.G. and P.C.N.; formal analysis, È.M.-S.; methodology, S.M.-F. and È.M.-S.; resources, G.P.-B.; software, S.M.-F. and È.M.-S.; supervision, M.H.G. and P.C.N.; validation, M.H.G.; writing—original draft, M.M.-L.; writing—review and editing, M.H.G., G.P.-B., J.M.P., Epidemiological Surveillance Network of Catalonia and P.C.N. All authors have read and agreed to the published version of the manuscript.

Funding

This research received no external funding.

Institutional Review Board Statement

All methods in this study were carried out in accordance with the Helsinki guidelines and declaration or any other relevant guideline. The need for ethical approval for this study and the need for informed consent were both waived by the ethical committee from the Public Health Agency of Catalonia, Institutional Review Board (IRB). All data used in the analysis were collected during routine public health surveillance activities, as part of the legislated mandate of the Health Department of Catalonia, the competent authority for the surveillance of communicable diseases, which is officially authorized to receive, treat, and temporarily store personal data on cases of infectious disease. All data were fully anonymized. The Public Health Agency of Catalonia approved all experimental protocols as patients’ data are used in this study.

Informed Consent Statement

All study activities formed part of public surveillance were exempt from institutional board review from the Public Health Agency of Catalonia and did not require informed consent.

Data Availability Statement

All data relevant to the study are included in the article or uploaded as supplementary information. The datasets analysed during the study are not publicly available (as they are personal patient data) but are available from the corresponding author upon reasonable request.

Acknowledgments

The authors would like to thank all those who contributed to the surveillance and control of the COVID-19 pandemic in Catalonia: Central and regional Epidemiological Surveillance Services (XVEC/SUVEC), Microbiologists of the SNMC network, and all healthcare workers in the Catalan healthcare network. Epidemiological Surveillance Network of Catalonia: Barrabeig Fabregat, Irene; Bes Montalat, Nuria; Carmona Parcerisa, Gloria; Carol Torrades, Mònica; Cruells Gascón, Adrià; Ferras Prats, Joaquim; Godoy Garcia, Pere; Guadalupe Fernandez, Victor; Leon Garcia, Agata Raquel; Martinez Mateo, Ana Isabel; Minguell Verges, Sofia; Parron Bernabe, Ignacio; Pequeño Saco, Sandra; Rius Gibert, Cristina; Sala Farre Maria-Rosa.

Conflicts of Interest

The authors declare no conflict of interest.

References

  1. Grantz, K.H.; Lee, E.C.; McGowan, L.D.; Lee, K.H.; Metcalf, C.J.E.; Gurley, E.S.; Lessler, J. Maximizing and evaluating the impact of test-trace-isolate programs: A modeling study. PLoS Med. 2021, 18, e1003585. [Google Scholar] [CrossRef] [PubMed]
  2. Edmond, J.S. Pandemic Resilience: Getting it Done. A TTSI Technical Advice Handbook. In Massachusetts Testing, Tracing, and Supported Isolation Collaborative, v 2.0 ed.; Center for Ethics, Harvard Global Health Institute, Harvard University: Cambridge, MA, USA, 2020; p. 3. [Google Scholar]
  3. Working group for the surveillance and control of COVID-19 in Spain. The first wave of the COVID-19 pandemic in Spain: Characterisation of cases and risk factors for severe outcomes, as at 27 April 2020. Eurosurveillance 2020, 25, 2001431. [Google Scholar] [CrossRef]
  4. Subdirectorate General for Surveillance and Public Health Emergency Response-Public Health Agency of Catalonia (PHAC). Technical Summary Report of the COVID-19 Cases in Catalonia. 24 August (no. 23) 2020. (In Catalan). Available online: http://hdl.handle.net/11351/6395 (accessed on 3 July 2021).
  5. World Health Organization. Contact tracing in the context of COVID-19. Interim guidance. Pediatr. I Med. Rodz. 2020, 16, 33–39. Available online: http://www.pimr.pl/index.php/issues/2020-vol-16-no-1/contact-tracing-in-the-context-of-covid-19-interim-guidance-1721?aid=1465 (accessed on 7 July 2021). [CrossRef]
  6. Merkur, S.; Maresso, A.; Cylus, J.; Van Ginneken, E.; Lessof, S. Lessons from the first wave: The covid-19 health system response monitor. Eurohealth 2020, 26, 5. [Google Scholar]
  7. Lauer, S.A.; Grantz, K.H.; Bi, Q.; Jones, F.K.; Zheng, Q.; Meredith, H.R.; Azman, A.S.; Reich, N.G.; Lessler, J. The incubation period of coronavirus disease 2019 (COVID-19) from publicly reported confirmed cases: Estimation and application. Ann. Intern. Med. 2020, 172, 577–582. [Google Scholar] [CrossRef] [PubMed] [Green Version]
  8. Delfraissy, J.-F.; Duault, L.A.; Benamouzig, A.D.; Bouadma, S.L.; Cauchemez, R.S.; Chauvin, M.F.; de Sante Publique, M.; de Ville Arnaud Fontanet, M.; Grard, E.M.-A.; Hoang, M.A.M.; et al. Membres du Conseil Scientifique Associés à cet Avis: 3 Septembre 2020 Strategie et Modalites d’Isolement Partie I-les Prerequis Necessaires à la Construction des Scenarios avis 7 du Conseil Scientifique COVID-19. 2020. 19–19. Available online: https://solidarites-sante.gouv.fr/IMG/pdf/avis_conseil_scientifique_3_septembre_2020.pdf (accessed on 7 July 2021).
  9. Koh, W.C.; Naing, L.; Chaw, L.; Rosledzana, M.A.; Alikhan, M.F.; Jamaludin, S.A.; Amin, F.; Omar, A.; Shazli, A.; Griffith, M.; et al. What do we know about SARS-CoV-2 transmission? A systematic review and meta-analysis of the secondary attack rate and associated risk factors. PLoS ONE 2020, 15, e0240205. [Google Scholar] [CrossRef] [PubMed]
  10. Johansson, M.A.; Quandelacy, T.M.; Kada, S.; Prasad, P.V.; Steele, M.; Brooks, J.T.; Slayton, R.B.; Biggerstaff, M.; Butler, J.C. SARS-CoV-2 Transmission from People Without COVID-19 Symptoms. JAMA Netw. Open 2021, 4, e2035057. [Google Scholar] [CrossRef] [PubMed]
  11. Subdirectorate General for Surveillance and Public Health Emergency Response-Public Health Agency of Catalonia (PHAC). Acting Protocol against SARS-CoV-2 Infection Cases. 7 August Update. 2020. (In Catalan). Available online: https://salutpublica.gencat.cat/ca/detalls/Article/Actualitzacio-del-procediment-dactuacio-enfront-de-casos-dinfeccio-pel-nou-coronavirus-SARS-CoV-2 (accessed on 10 October 2021).
  12. von Elm, E.; Altman, D.G.; Egger, M.; Pocock, S.J.; Gøtzsche, P.C.; Vandenbroucke, J.P. The Strengthening the Reporting of Observational Studies in Epidemiology (STROBE) statement: Guidelines for reporting observational studies. Lancet 2007, 370, 1453–1457. [Google Scholar] [CrossRef] [PubMed] [Green Version]
  13. Rossetto, M.; Brand, É.M.; Hahn, G.V.; Oliveira, D.L.; Teixeira, L.B. Epidemiological profile of tuberculosis cases with HIV coinfection in Porto Alegre city, Brazil. Rev. Bras. Enferm. 2019, 72, 1211–1218. [Google Scholar] [CrossRef] [PubMed]
  14. WMA Declaration of Helsinki–Ethical Principles for Medical Research Involving Human Subjects–WMA–The World Medical Association. Available online: https://www.wma.net/policies-post/wma-declaration-of-helsinki-ethical-principles-for-medical-research-involving-human-subjects/ (accessed on 22 September 2022).
  15. Subdirectorate General for Surveillance and Public Health Emergency Response-Public Health Agency of Catalonia (PHAC). Acting Protocol against SARS-CoV-2 Infection Cases, 16 April Update; PHAC: Winnipeg, OT, Canada, 2020.
  16. Instituto Nacional Estadística (INE). Glosario de Conceptos Básicos. Available online: https://www.ine.es/DEFIne/?L=0 (accessed on 13 May 2021).
  17. Idescat. Short-Term Economic Indicators. Weekly Incidence of COVID-19. Available online: https://www.idescat.cat/indicadors/?lang=en&id=conj&n=14356 (accessed on 12 January 2022).
  18. Dong, X.C.; Li, J.M.; Bai, J.Y.; Liu, Z.Q.; Zhou, P.H.; Gao, L.; Li, X.Y.; Zhang, Y. Epidemiological characteristics of confirmed COVID-19 cases in Tianjin. Zhonghua Liu Xing Bing Xue Za Zhi 2020, 41, 638–641. [Google Scholar] [PubMed]
  19. Dawson, P.; Rabold, E.M.; Laws, R.L.; Conners, E.E.; Gharpure, R.; Yin, S.; Buono, S.A.; Dasu, T.; Bhattacharyya, S.; Westergaard, R.P.; et al. Loss of Taste and Smell as Distinguishing Symptoms of Coronavirus Disease 2019. Clin. Infect. Dis. 2021, 72, 682–685. [Google Scholar] [CrossRef] [PubMed]
  20. Li, F.; Li, Y.Y.; Liu, M.J.; Fang, L.Q.; Dean, N.E.; Wong, G.W.; Yang, X.B.; Longini, I.; Halloran, M.E.; Wang, H.J.; et al. Household transmission of SARS-CoV-2 and risk factors for susceptibility and infectivity in Wuhan: A retrospective observational study. Lancet Infect. Dis. 2021, 21, 617. [Google Scholar] [CrossRef] [PubMed]
  21. Abrams, E.M.; Szefler, S.J. COVID-19 and the impact of social determinants of health. Lancet Respir. Med. 2020, 8, 659–661. [Google Scholar] [CrossRef] [PubMed]
  22. Karmakar, M.; Lantz, P.M.; Tipirneni, R. Association of Social and Demographic Factors with COVID-19 Incidence and Death Rates in the US. JAMA Netw. Open 2021, 4, e2036462. [Google Scholar] [CrossRef] [PubMed]
  23. Callaway, E. COVID vaccines and kids: Five questions as trials begin. Nature 2021, 592, 670–671. [Google Scholar] [CrossRef] [PubMed]
  24. Torjesen, I. Covid-19: Delta variant is now UK’s most dominant strain and spreading through schools. BMJ 2021, 373, n1445. [Google Scholar] [CrossRef] [PubMed]
  25. UN News. COVID-19: Wealthy Nations Urged to Delay Youth Vaccines, Donate to Solidarity Scheme. Available online: https://news.un.org/en/story/2021/05/1091952 (accessed on 5 May 2021).
  26. King, J.A.; Whitten, T.A.; Bakal, J.A.; McAlister, F.A. Symptoms associated with a positive result for a swab for SARS-CoV-2 infection among children in Alberta. Can. Med. Assoc. J. 2021, 193, E1–E9. [Google Scholar] [CrossRef] [PubMed]
  27. Wells, C.R.; Townsend, J.P.; Pandey, A.; Moghadas, S.M.; Krieger, G.; Singer, B.; McDonald, R.H.; Fitzpatrick, M.C.; Galvani, A.P. Optimal COVID-19 quarantine and testing strategies. Nat. Commun. 2021, 12, 356. [Google Scholar] [CrossRef] [PubMed]
  28. Subdirectorate General for Surveillance and Public Health Emergency Response-Public Health Agency of Catalonia (PHAC). Acting Protocol against SARS-CoV-2 Infection Cases in the Re-Opening Phase. Follow-Up Indicators. 2020. Available online: http://hdl.handle.net/11351/4919 (accessed on 19 February 2023).
  29. Kissler, S.; Fauver, J.R.; Mack, C.; Tai, C.G.; Mallery, I.B.; Watkins, A.E.; Radhika, S.M.; Anderson, D.J.; Ho, D.D.; Grubaugh, N.D.; et al. Viral Dynamics of SARS-CoV-2 variants in vaccinated and unvaccinated persons. N. Engl. J. Med. 2021, 385, 2489–2491. [Google Scholar] [CrossRef] [PubMed]
  30. Centers for Disease Control and Prevention (CDC). Operational Considerations for Adapting a Contact Tracing Program to Respond to the COVID-19 Pandemic [Internet]. Centers for Disease Control and Preventive. 2020. Available online: https://www.cdc.gov/coronavirus/2019-ncov/global-covid-19/operational-considerations-contact-tracing.html (accessed on 27 January 2021).
  31. European Center for Disease Prevention and Control (ECDC). Monitoring and evaluation framework for COVID-19 response activities in the EU/EEA and the UK. Stockholm:. ECDC Tech. Rep. Available online: https://www.ecdc.europa.eu/en/publications-data/covid-19-monitoring-and-evaluation-framework-response-activities (accessed on 20 October 2022).
Figure 1. STROBE flowchart of close contacts (CCs) and its index case (IC) in Catalonia included in the analysis and the data available for analysis. * Duplicated close contact (CC): a) same CC and index case (IC) pair (n = 356): CC where the ID number was the same as the IC, meaning already secondary cases; b) same CC to exposure-related ICs association (n = 4891): same contact ID provided simultaneously by other index cases (often in household expositions).
Covid 03 00032 g001
Figure 2. Forest plot displaying associated odds ratio (OR) and 95% confidence intervals of symptomatic close contacts (CCs) and the secondary attack rate (SAR).
Covid 03 00032 g002
Figure 3. Typology of COVID-19-like symptoms developed among secondary cases (SCs). Note: SCs could report one or more symptoms; percentages are calculated from an overall 3190 sample of SCs.
Covid 03 00032 g003
Figure 4. Temporality of symptom onset from the close contact (CC) date of last date of exposure with the index case (IC) by setting of exposure.
Covid 03 00032 g004
Table 1. Demographic characteristics of symptomatic close contacts (CCs) and secondary cases before and after the Universal PCR strategy.
SYMPTOMATIC CCs SECONDARY CASES
TOTAL Before After p-Value TOTAL Before After p-Value
n% n% n% n% n% n%
TOTAL924419.4% 426721.2% 497718.0% <0.05 11,68324.5%499824.8%668524.2% 0.151
Sex
Males406018.1% 185019.8% 221016.9% <0.05 547924.5%229724.6%318224.3% 0.151
Females518420.5% 241722.3% 276719.1% 620424.5%270125.0%350324.1%
Age group (years)
0–115029.4% 7433.3% 7626.4% <0.05 19237.6%8739.2%10536.5% <0.05
2–530516.8% 15619.5% 14914.7% 58332.1%25632.0%32732.2%
6–1253414.0% 26016.1% 27412.5% 107928.4%44027.2%63929.2%
13–1970215.1% 31517.4% 38713.6% 113924.5%46025.5%67923.9%
20–39341621.6% 159323.2% 182320.4% 387924.5%170324.8%217624.3%
40–59295220.6% 135622.3% 159619.3% 326722.8%139622.9%187122.7%
60–7999517.5% 43118.9% 56416.5% 128322.5%54423.8%73921.7%
>7919017.2% 8217.9% 10816.7% 26123.6%11224.4%14923.1%
Setting of exposure *
Social61311.6% 631.6% 60711.5% <0.05 82315.5%421.1%81915.5% <0.05
Household257220.6% 2520.5% 254720.6% 379530.4%3629.5%375930.4%
Non-household/Non-social46913.1% 2326.1% 44612.7% 55315.4%2831.8%52515.0%
Unknown246121.5% 108421.7% 137721.4% 284124.8%125925.1%158224.5%
Environment ^
Urban809519.6% 365520.8% 444018.7% <0.05 10.32325.0%438625.0%593725.0% <0.05
Rural155217.4% 76221.1% 79014.8% 177519.9%75020.8%102519.3%
The p-value corresponds to the difference between the before and after periods. * Setting of exposure only for close contacts registered in August. ^ Urban and rural environments, based on the number of inhabitants of the municipality being higher or lower than 10,000.
Table 2. Demographic factors of symptom development among secondary cases reported at the time of case epidemiological interview.
Asymptomatic SymptomaticTOTALp-Value
n% n%
TOTAL535745.9% 632654.1%11,683-
Sex
Males262647.9% 285352.1%5479<0.05
Females273144.0% 347356.0%6204
Age group (years)
0–18544.3% 10755.7%192
2–534959.9% 23440.1%583
6–1267462.5% 40537.5%1079
13–1964156.3% 49843.7%1139<0.05
20–39164342.4% 223657.6%3879
40–59131440.2% 195359.8%3267
60–7953441.6% 74958.4%1283
>7911744.8% 14455.2%261
Setting of exposure *
Social38146.3% 44253.7%823<0.05
Household190350.1% 189249.9%3795
Non-household/Non-social23442.3% 31957.7%553
Unknown125444.1% 158755.9%2841
Month
May–June8030.1% 18669.9%266<0.05
July–August527746.2% 614053.8%11,417
* Setting of exposure only for close contacts registered in August.
Table 3. Incubation period (expressed in days) among secondary cases by the setting of exposure.
DaysHousehold Social Non-Household/Non-Social Totalp-Value
n% n% n%
0–482673.9% 23363.1% 18468.9% 124370.6%<0.05
5–615213.6% 6116.5% 3412.7% 24714.0%
7–8736.5% 4913.3% 269.7% 1488.4%
9232.1% 82.2% 72.6% 382.2%
>9473.9% 204.9% 186.0% 854.8%
TOTAL112163.7% 37121.0% 26915.2% 1761100%
Disclaimer/Publisher’s Note: The statements, opinions and data contained in all publications are solely those of the individual author(s) and contributor(s) and not of MDPI and/or the editor(s). MDPI and/or the editor(s) disclaim responsibility for any injury to people or property resulting from any ideas, methods, instructions or products referred to in the content.

