Article

The Impact of the COVID-19 Pandemic in The Netherlands on Primary Healthcare Use and Clinical Outcomes in Persons with Type 2 Diabetes

by
Jesse M. van den Berg
1,2,3,*,
Marieke T. Blom
2,3,
Karin M. A. Swart
1,2,3,
Jetty A. Overbeek
1,2,3,
S. Remmelzwaal
2,3,4,
Petra J. M. Elders
2,3 and
Ron M. C. Herings
1,3,4
1
PHARMO Institute for Drug Outcomes Research, 3528 AE Utrecht, The Netherlands
2
Department of General Practice, Amsterdam UMC Location Vrije Universiteit Amsterdam, 1081 HV Amsterdam, The Netherlands
3
Amsterdam Public Health Research Institute, Health Behaviors and Chronic Diseases, 1105 HV Amsterdam, The Netherlands
4
Department of Epidemiology and Data Science, Amsterdam UMC Location Vrije Universiteit Amsterdam, 1081 HV Amsterdam, The Netherlands
*
Author to whom correspondence should be addressed.
COVID 2023, 3(11), 1677-1687; https://doi.org/10.3390/covid3110115
Submission received: 23 October 2023 / Revised: 2 November 2023 / Accepted: 2 November 2023 / Published: 3 November 2023

Abstract

:
The COVID-19 pandemic has had a significant impact on healthcare systems worldwide, including the postponing or canceling of appointments and procedures for type 2 diabetes (T2D) care by general practitioners (GPs) in the Netherlands. The aim of this study was to investigate the impact of the COVID-19 pandemic on primary healthcare use and clinical measurements for people with T2D. Additionally, we aimed to determine if changes were observed among specific risk groups: (1) persons 70 years or older, or below 70 years, (2) patients who were meeting their HbA1c targets and those who were not, and (3) patients with high-risk and non-high-risk T2D. This retrospective cohort study among persons with T2D was conducted using data from the DIAbetes MANagement and Treatment (DIAMANT) data infrastructure, deriving data from electronic medical records of Dutch GPs. The study assessed GP visit counts, and counts and values of clinical measurements, including hemoglobin A1c (HbA1c), body mass index (BMI), low-density lipoprotein (LDL) cholesterol, and systolic blood pressure (SBP). Adjusted negative binomial (NB) regression and generalized estimating equations (GEE) models were used to estimate GP visit counts and population averages of clinical measurements, respectively, comparing 2019 (pre-pandemic) with 2020 (during the pandemic). Changes in specific groups were examined by stratifying outcomes for the aforementioned subgroups. The cohort consisted of 182,048 patients with T2D (47% female, mean age 69 ± 13 years) on 1 March 2019, of which 168,097 persons (92%) still contributed follow-up data in 2020. We observed an increase in total GP visits in 2020, with an adjusted rate ratio (RR) of 1.09 (95% CI 1.08–1.09). The frequency increased for office visits (RR 1.06; 1.06–1.07) and phone calls (RR 1.33; 1.31–1.35) but remained stable for home visits (RR 1.02; 0.99–1.04). On both population and individual levels, HbA1c values increased in 2020 by 1.65 (1.59–1.70) mmol/mol compared to 2019. Observed changes in 2020 for BMI, LDL, and SBP values were also statistically significant but small. Subgroup stratifications showed higher scores of all clinical measurements in younger persons (<70 years), those who met their HbA1c target, and non-high-risk T2D patients than their respective high-risk subgroups. During the first year of the COVID-19 pandemic in the Netherlands, changes in primary healthcare use were observed among persons with T2D, with an increase in GP office visits and phone calls and a decreased number of clinical measurements and GP home visits. HbA1c levels increased among patients with T2D in 2020. Further research is necessary to determine the impact of the COVID-19 pandemic on long-term clinical outcomes and (long-term) T2D complications.

1. Introduction

Coronavirus disease 2019 (COVID-19) caused a high rate of hospitalizations and deaths during the first pandemic wave. Furthermore, it had a major impact on standard healthcare delivery [1]. In the Netherlands, many crucial appointments, care, and surgical procedures were postponed or canceled. An estimated 34,000 to 50,000 healthy person-years were lost as a cause of the postponed appointments during the first COVID-19 wave [2].
In the Netherlands, type 2 diabetes (T2D) is one of the most prevalent chronic diseases, with an estimated prevalence of 6% [3,4]. The management of T2D in the Netherlands is mainly delivered in primary care settings [4]. After the initial diagnosis of T2D, three main aspects are part of the overall treatment plan: education, non-drug advice (smoking cessation, sufficient physical activity, weight control, and healthy diet), and, when the disease progresses, medication [5]. Patients with T2D have regular checkups (ranging between 1 and 4 times a year) with their general practitioner (GP), during which blood, urine, and physical examinations are to be performed, measuring systolic blood pressure (SBP), body mass index (BMI), Hemoglobin A1c (HbA1c), low-density lipoprotein (LDL) cholesterol, and serum creatinine [5]. As high glycemic levels, high blood pressure, and increased blood lipid levels are known to have a positive correlation with micro- and macrovascular complications, regular monitoring of cardiometabolic and glycemic parameters has shown to be important in decreasing the risk of both short- and long-term complications related to diabetes [6].
According to the Netherlands Institute for Health Services Research (Nivel), general practitioners (GPs) conducted in-person consultations with only a quarter of their patients during the period from 9 March to 24 May 2020. In particular, the number of consultations for patients with chronic conditions such as diabetes, COPD, and heart failure decreased [7]. Therefore, we hypothesized that the number of checkups for T2D monitoring decreased during the pandemic, especially during the first lockdown in the Netherlands. However, the short- and long-term impact of a decrease in T2D monitoring appointments in the Netherlands is unknown. Much is still unclear about the long-term effects of the pandemic on clinical outcomes in patients with T2D, such as possible changes in levels of HbA1c, BMI, SBP, and LDL. Furthermore, it is unclear which patient groups were most severely impacted and would consequently benefit from closer monitoring.
The objective of this study was to examine the impact of the COVID-19 pandemic on the management of T2D patients in primary care in the Netherlands, specifically on the frequency of primary care consultations and the frequency and values of T2D clinical measurements (HbA1c, BMI, SBP, LDL). Additionally, the study aimed to determine if any observed changes varied between certain groups: (1) persons 70 years or older or below 70 years, (2) patients who were meeting their HbA1c targets and those who were not, and (3) patients with high-risk T2D and non-high-risk T2D.

2. Methods

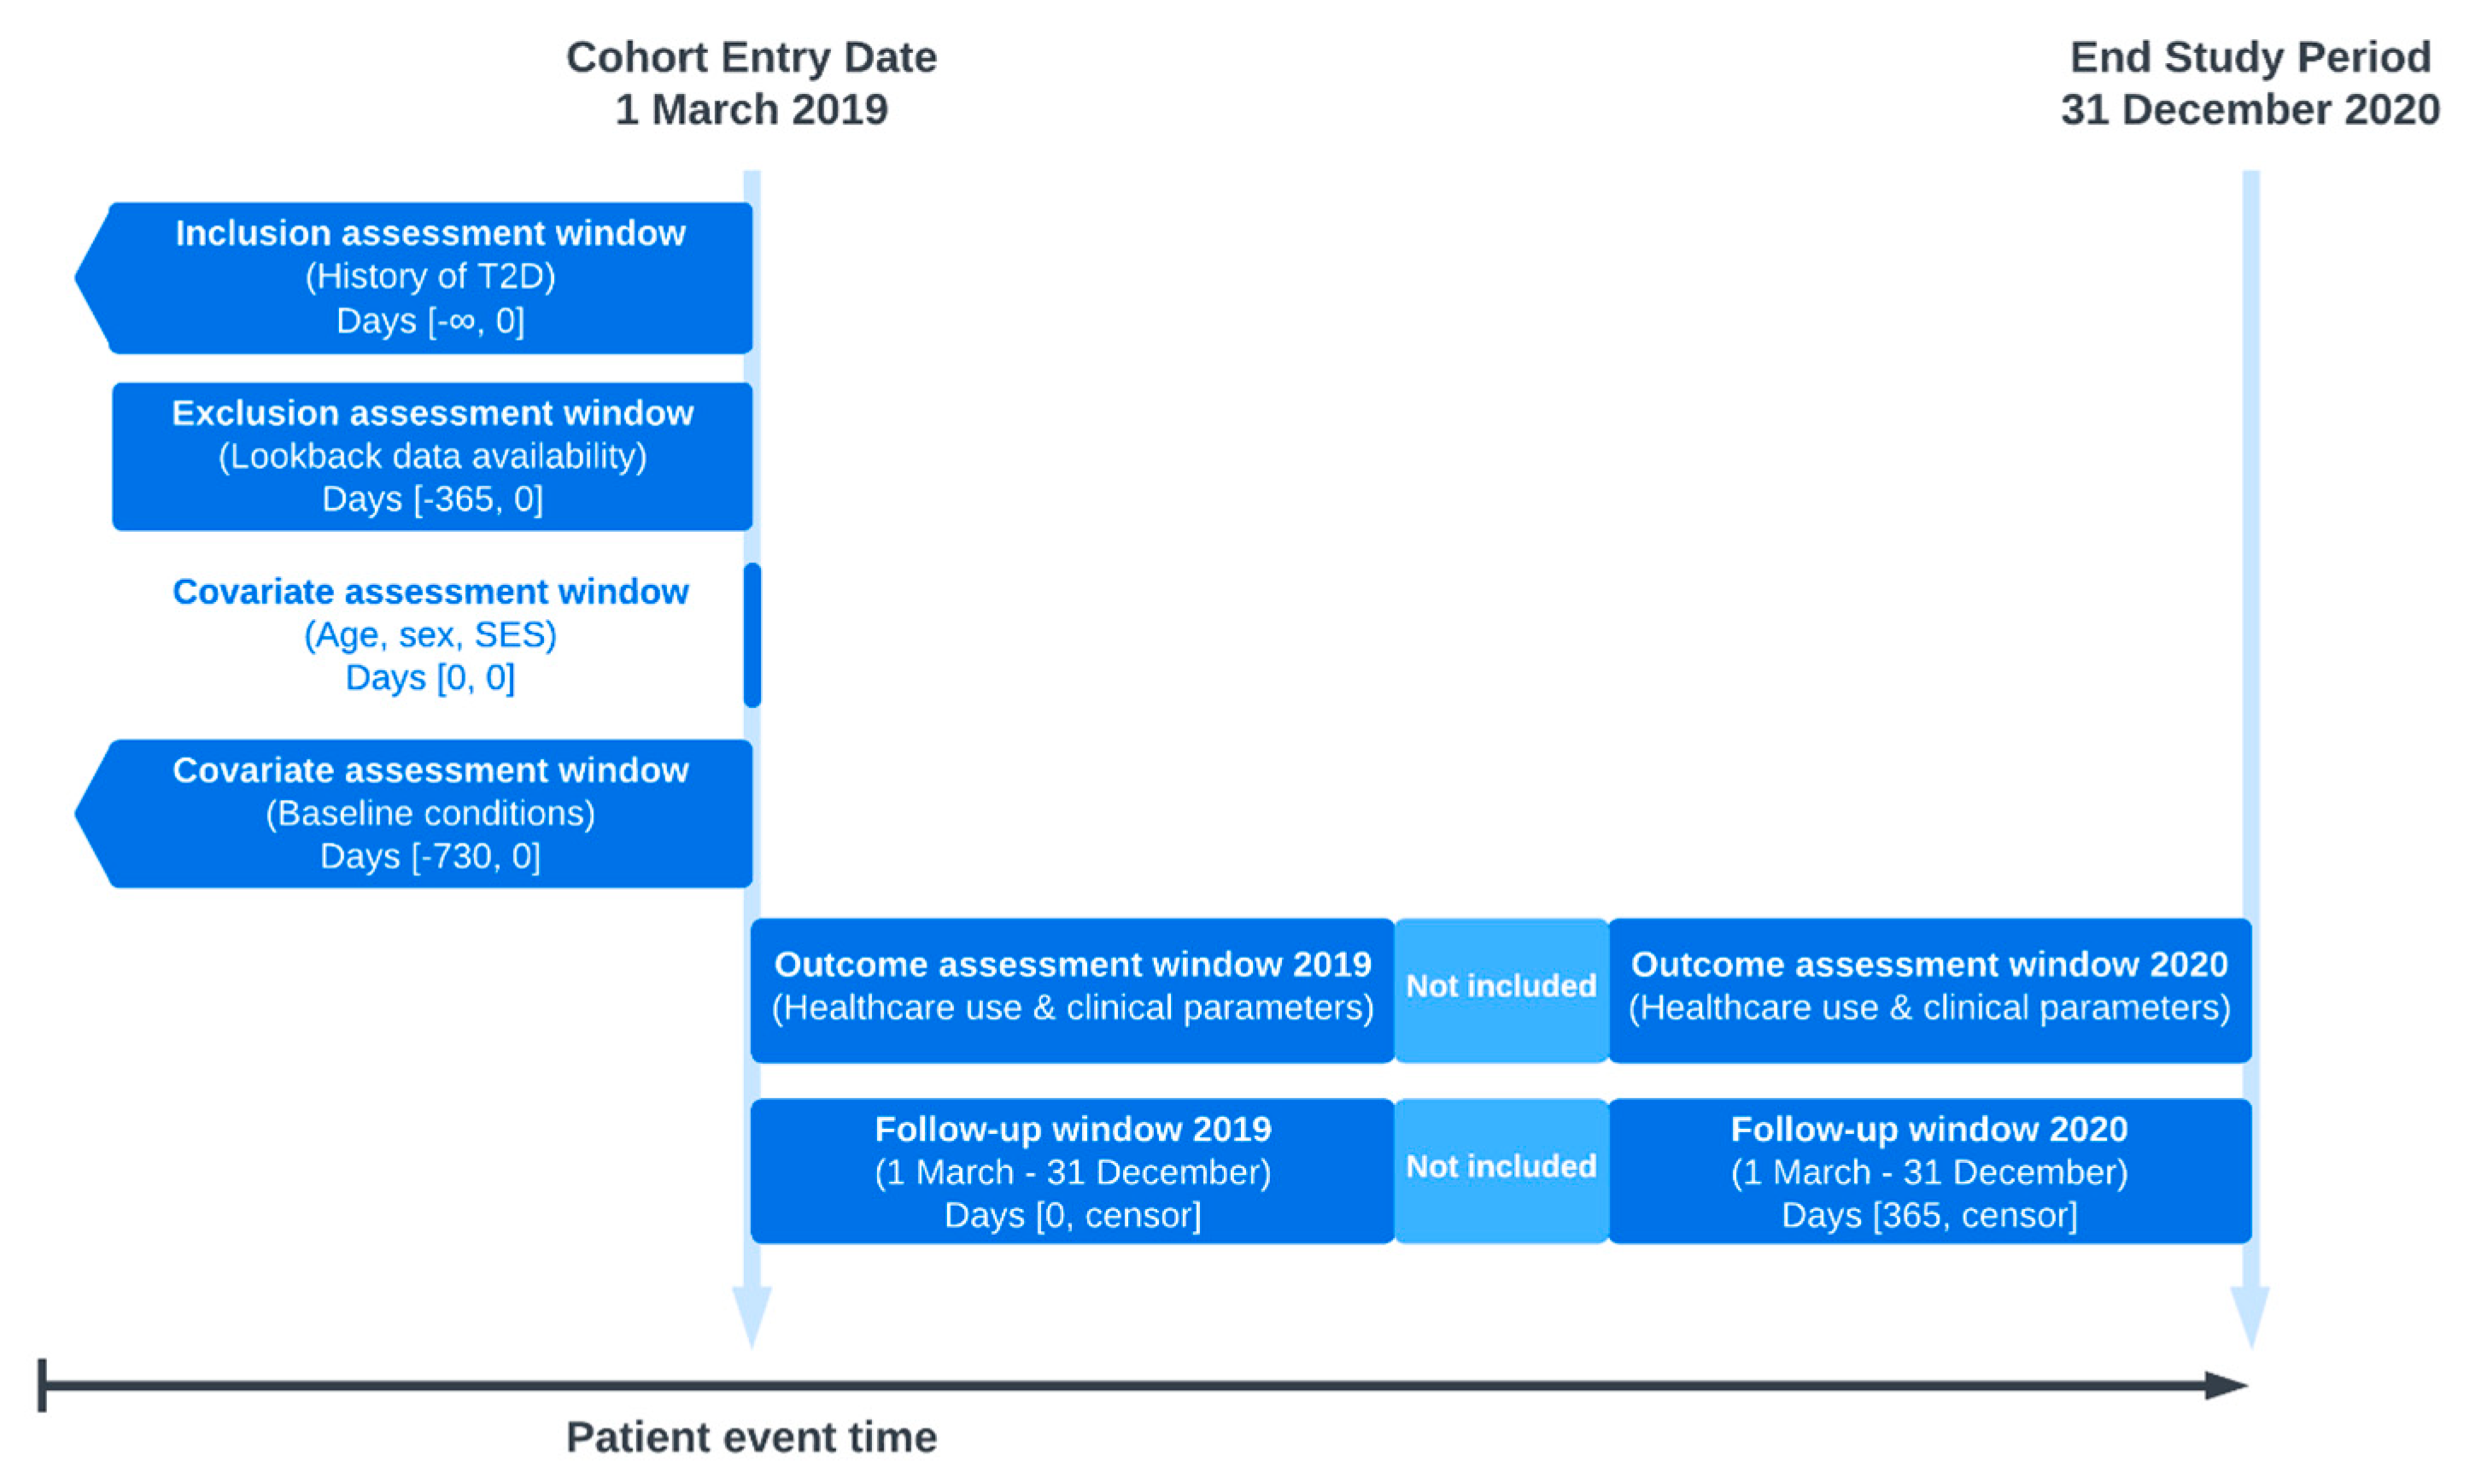
2.1. Study Design and Setting

We conducted a retrospective cohort study using the DIABetes MANagement and Treatment (DIAMANT) data infrastructure [3]. DIAMANT is a population-based, dynamic, prospective data infrastructure including persons with diabetes derived from electronic patient records registered by participating GPs. Records include information on diagnoses and symptoms, laboratory test results, referrals to specialists, and prescriptions. Diabetes is defined as a recorded diabetes diagnosis or a prescription of drugs used in diabetes. The cohort is part of the national infrastructure of “Stichting Informatievoorziening voor Zorg en Onderzoek” (STIZON) and is linked to other data sources. More information has been published elsewhere [8].

2.2. Study Population

We selected, from the DIAMANT Cohort [3], all patients with T2D, defined by International Classification of Primary Care (ICPC) code T90.02 or >1 non-insulin drug prescriptions used in diabetes within six months consecutively. We excluded patients with an end of follow-up before the cohort entry date (CED), which is set to 1 March 2019, those with less than one year of data before CED, those with a date of T2D diagnosis after CED, and GP practice contribution of data ending before the end of the study period (Supplementary Figure S1). For the secondary analyses, we divided the study population into three subgroups: (1) patients 70 years or older, or below 70 years at CED, (2) patients who were meeting their HbA1c targets at CED and those who were not, and (3) patients with high-risk T2D and non-high-risk T2D at CED. The HbA1c target levels are based on the Dutch GP guideline for diabetes management and are defined as follows: all patients aged <70 years or patients aged ≥70 years using no medication or only metformin: ≤53 mmol/mol (7.0%); patients aged ≥70 years using diabetes medication other than metformin: 54–58 mmol/mol (7.0–7.5%) for patients with diabetes for less than 10 years, and 54–64 mmol/mol (7.0–8.0%) for patients with diabetes for 10 or more years [5]. Patients with high-risk T2D are defined as patients with a history of cardiovascular disease, chronic kidney disease, or heart failure based on the same Dutch guideline [5]. Conversely, patients who did not meet these definitions were considered as patients with non-high-risk T2D.

2.3. Definitions

2.3.1. Study Period

We studied the impact of the COVID-19 pandemic by comparing selected outcomes in 2020 to those in 2019. For our primary analysis, we compared data from 1 March to 31 December 2020, with the corresponding timeframe in 2019, as illustrated in Figure 1. This time frame was chosen to compare outcomes after COVID-19 reached The Netherlands to the same period in 2019 when COVID-19 did not yet exist. For a sensitivity analysis, we compared data from 1 March to 30 June 2020, with the identical period in 2019, a span defined as the first lockdown period in the Netherlands by the National Institute for Public Health and the Environment [9].

2.3.2. Characteristics

Patient characteristics were defined on 1 March 2019 and included age, sex, socioeconomic status (SES), smoking status, and duration of T2D. This duration is defined as CED minus the date of diagnosis, which is based on either the T2D diagnosis code (ICPC T90.02), diabetes medication code (ATC A10), or T2D examination. Clinical characteristics were assessed closest to CED, with a maximum lookback period of 24 months, and include HbA1c, BMI, LDL, SBP, and estimated glomerular filtration rate (eGFR). The definitions of these variables are described in more detail in Table S1.

2.3.3. Outcomes

Primary outcomes encompassed both clinical measurements as well as health care use. Outcomes of clinical measurements included values of HbA1c, BMI, LDL, and systolic blood pressure measurements. Outcomes of health care use include (1) the number of visits to the general practitioner (office visits, home visits, phone calls, and e-mails) and (2) the number of performed measurements (HbA1c, BMI, LDL, SBP, and eGFR), both as counts per person-years.

2.4. Statistical Analysis

A descriptive analysis was conducted for baseline characteristics on 1 March 2019 for the total population, and for the population divided into subgroups as defined before. Patient characteristics were reported as absolute and relative frequencies for categorical variables and as means with standard deviation (SD) for continuous variables. The number of GP visits and the number of clinical measurements were calculated as averages of counts per person-years. To compare healthcare use and clinical measurements of 2020 with 2019, negative binomial (NB) regression models were used to calculate counts of GP visits, and generalized estimating equations (GEE) models were used to calculate population averages of the values of clinical outcomes, accounting for repeated measurements within persons. Both univariate and multivariate NB regression and GEE models were performed. In the multivariate models, we adjusted for sex, age, SES, T2D duration, baseline HbA1c, baseline BMI, baseline LDL, baseline SBP, baseline eGFR, baseline HbA1c on target, and high-risk T2D. Interaction effects with the study period were added to the models for age (70+ years or younger), HbA1c on target (yes or no), and high- or non-high-risk T2D. If interaction terms were statistically significant (i.e., p-value < 0.05), only then are the respective stratified results presented. Missing values were analyzed by Little’s MCAR test and assessing missingness patterns. The data were not missing completely at random; rather, they were assumed to be missing at random. Missing values were imputed using Multivariate Imputation by Chained Equations (MICE). We used Predictive Mean Matching (PMM) to generate complete datasets using a model that included the following variables: age, sex, SES, diabetes duration, baseline HbA1c, baseline BMI, baseline LDL, baseline SBP, and baseline eGFR. The data extractions were performed using SAS version 9.4 (SAS Institute Inc., Cary, NC, USA). The imputations, GEE models, and NB regression models were performed using R Studio, with the following packages: geepack, MASS, mice, naniar, and stats. A p-value less than 0.05 was considered statistically significant. Sensitivity analyses were performed in which we restricted the observation periods to the lockdown period in 2020 (i.e., 1 March to 30 June) and the same period in 2019.

3. Results

The cohort included 182,048 persons with T2D at baseline (i.e., 1 March 2019), of which 168,097 persons (92.3%) still contributed follow-up data from 1 March 2020 onwards (Supplementary Figure S1). At baseline, mean age was 69.0 (SD 13.1) years, and 47% of persons were female (Table 1). Baseline characteristics for the population are divided into subgroups (age < 70 or ≥ 70 years, HbA1c on or off target, and high- or non-high-risk T2D) are also presented.
The number of GP visits in 2020 and 2019 were determined. Primary healthcare use in 2019 and 2020 was comparable, considering the proportions of office visits and home visits (Table 2). There was a decrease in the number of clinical measurements in 2020 compared to 2019. Mean values of clinical measurements were higher in 2020 for HbA1c (55.4 vs. 54.2 mmol/mol) and systolic blood pressure (137.9 vs. 136.6 mmHg) compared to 2019. Comparisons of healthcare use and clinical measurements between the lockdown period in 2020 (i.e., 1 March to 30 June) and the same period in 2019 were comparable to the aforementioned results (Supplementary Table S2).
Counts of total GP visits were also divided into office visits, home visits, and phone calls and were analyzed using negative binomial (NB) regression models with offset for person time (Table 3). The adjusted rate ratio (RR) comparing total GP visits in 2020 to 2019 was 1.09 (95% confidence interval (CI) 1.08 to 1.09), indicating more total GP visits, and was higher in people aged 70 or older (1.10; 1.09 to 1.11) than persons aged below 70 (1.07; 1.06 to 1.08). Adjusted RR for office visits in 2020 was 1.06 (1.06 to 1.07) and was also higher in people aged 70 or older (1.08; 1.07 to 1.09) than in persons aged below 70 (1.04; 1.03 to 1.06). Adjusted RR for home visits in 2020 was not significant (1.02; 0.99 to 1.04) and was significantly lower for high-risk T2D patients (0.94; 0.90 to 0.99) than non-high-risk T2D patients (1.06; 1.05 to 1.07). Adjusted RR for phone calls in 2020 was 1.33 (1.31 to 1.35) and was higher for persons whose HbA1c was on target at baseline (1.36; 1.33 to 1.39) than persons not on target (1.28; 1.24 to 1.31). Results of the sensitivity analysis comparing healthcare use in only the lockdown period in 2020 (i.e., 1 March to 30 June) to the same period in 2019 show similar changes as the aforementioned results, only the decrease in home visits is more pronounced (Supplementary Table S3).
Generalized estimating equations (GEE) models were used to calculate population averages of HbA1c, BMI, LDL, and SBP (Table 4). The adjusted increase in HbA1c values in 2020 was 1.65 (1.59 to 1.70) mmol/mol. This increase differed in studied subgroups and was higher in non-high-risk (1.68; 1.62 to 1.74) than high-risk T2D patients (1.38; 1.21 to 1.55), also higher in patients younger than 70 years (1.84; 1.75–1.96) than 70 years or older (1.48; 1.42 to 1.55), and most substantially higher in persons who were on their HbA1c target prior to the pandemic, with an increase of 2.30 (2.24 to 2.36) mmol/mol, versus an increase of 0.37 (0.27 to 0.49) mmol/mol for those who were off target. Changes in BMI and LDL values were significant but small; adjusted decreases in 2020 were 0.07 (0.06 to 0.08) kg/m2 and 0.03 (0.03 to 0.03) mmol/L, respectively. These changes in BMI and LDL were more pronounced for persons in low-risk subgroups, but the differences between the groups were small. The adjusted increase in SBP values was 1.27 (1.18 to 1.36) mmHg. Again, increases differed between subgroups and were larger in low-risk T2D patients, in patients younger than 70 years, and in persons who met their HbA1c target prior to the pandemic. Results of the sensitivity analysis comparing clinical outcomes in only the lockdown period in 2020 (i.e., March 1 to June 30) to the same period in 2019 show similar changes as the aforementioned results (Supplementary Table S4). Of note, the increase in HbA1c was smaller (1.02; 0.93 to 1.11) but differed greatly between persons who met their HbA1c target prior to the pandemic (2.78; 2.69 to 2.87) and those who did not (−1.68; −1.84 to −1.52).

4. Discussion

4.1. Findings

Contrary to expectations, we did not find clear evidence for decreased primary healthcare use in persons with T2D during the first year of the COVID-19 pandemic. The results of our adjusted analyses show that the total number of general practitioner (GP) visits for persons with T2D increased in 2020 compared to 2019. Despite the lack of decrease in GP visits, the frequency of clinical T2D measures decreased in 2020, especially for SBP, BMI, and HbA1c. However, when analyzing the population averages of the values of these clinical measures, we found a consistent increase in HbA1c and SBP levels. These changes were more pronounced in the low-risk subgroups: patients younger than 70 years, patients who met their HbA1c targets prior to the pandemic, and patients with non-high-risk T2D.

4.2. Previous Studies

Several studies have reported that the COVID-19 pandemic has disrupted the delivery of diabetes care, both from the perspective of healthcare providers and diabetes care utilization. Two systematic reviews on this subject concluded that the pandemic impacted diabetes care utilization and delivery and that delivered care was delayed [10,11]. Included studies focused mostly on the first months of the COVID-19 pandemic. Most studies found a decrease in healthcare use in persons with T2D during the pandemic. Also, multiple studies reported a decrease in the number of checkups, including HbA1c, blood pressure, and BMI measurements [10,12]. These studies provide important insights into diabetes care use and delivery. While we also observed a decline in the frequency of clinical measurements in 2020, we did not find an overall decrease in GP visits in 2020.
The observed increase in HbA1c values on a population level as well as on an individual level has been previously reported in multiple studies [13,14,15]. In a systematic review investigating glycemic control in patients with diabetes, a meta-analysis showed an HbA1c increase of 0.14% (−0.13 to 0.40) in persons with T2D, based on eight studies [14]. This increase corresponds well with our estimated increase of 1.65 (1.59 to 1.70) mmol/mol in 2020. It is, however, still unclear whether glycemic levels will remain increased in the following years and, more importantly, what impact this increase may have on persons with T2D, especially regarding the incidence of complications.
A previous study in Germany reported that the COVID-19 pandemic had a strong impact on glucose-lowering drug use in patients with T2D in the period of March to July 2020 compared to the period of March to July 2019 and that public health interventions are urgently required to reduce the negative effects of COVID-19 on the care of patients with diabetes [16]. While this finding might be an explanation for the observed increase in HbA1c levels, there are multiple other possible reasons. First, changes in activity levels and dietary habits during the pandemic were reported by several studies [17,18]. These changes could, in turn, lead to both elevated HbA1c and BMI levels. Second, persons who are at an increased risk of worsening glycemic control, such as high-risk T2D patients, might have been more securely observed by their GP during the pandemic. This would then lead to a logical mean increase in HbA1c on a population level, as these high-risk persons may already have a higher HbA1c than persons who have not been measured during that time.

4.3. Interpretations and Implications for Clinic and Research

The changes in primary healthcare use observed in this study have some implications for health systems. The increase in GP office visits and phone calls, combined with the slight decrease in home visits, could suggest that the pandemic has accelerated the shift toward remote care. While this trend may have some benefits, such as increased convenience and reduced risk of transmission, it also raises concerns about the potential for unequal access to care, particularly for those who lack the necessary technology or digital skills. Healthcare systems will need to adapt to this changing landscape and ensure that remote care is accessible and equitable for all patients.
The noted decline in clinical measures among individuals with T2D during the COVID-19 pandemic signals concerns regarding the quality of diabetes care throughout this period, given that regular monitoring of clinical parameters is crucial for effective disease management. Increasing HbA1c levels are of particular concern as they indicate worsening of glycemic control, which may lead to an increased risk of microvascular and macrovascular complications. The findings suggest that alternative strategies may be needed to ensure continued access to diabetes monitoring in situations where healthcare services may be restricted, as was the case during the COVID-19 pandemic.
Our study revealed that, during the COVID-19 pandemic, higher values of clinical measures were observed in low-risk groups—including those under 70 years of age, individuals meeting their HbA1c targets, and those with non-high-risk T2D—compared to their respective high-risk counterparts. These findings were relatively unexpected, as it is plausible that reduced access to care options would increase inequalities in healthcare use and outcomes. Nevertheless, our results indicate that access to diabetes care was maintained relatively well, which is supported by only slight shifts in the number of consultations in 2020. In our study, we accounted for the possible influence of differences between high- and low-risk patients by both performing GEE models to account for changes within persons and by stratifying both counts of GP visits and HbA1c levels for high-risk and low-risk groups. Not much difference was observed in healthcare use between these risk groups, but in contrast, stratification showed that persons in low-risk groups had worse clinical outcomes than those in high-risk groups.

4.4. Strengths and Limitations

This study has several limitations that should be considered when interpreting the results. For example, the study did not evaluate the impact of delayed or canceled consultations on clinical outcomes or T2D complications. Future research could examine these outcomes in more detail. In addition, the study was limited to data from Dutch general practitioners, and these findings may not necessarily be generalizable to other healthcare settings or countries. Nevertheless, this study provides important insights into the impact of the pandemic on diabetes care and highlights the need for continued monitoring and intervention to ensure that diabetes care remains accessible and effective during a period in which access to healthcare may have been hampered. We investigated both healthcare use and clinical outcomes in a single study, which is important when considering the impact of the COVID-19 pandemic on general primary healthcare in persons with T2D. Importantly, next to accounting for healthcare use, the estimated changes of clinical measurement values hold true for both between persons and within persons. Furthermore, the use of the DIAMANT Cohort enabled us to investigate a large and representative sample of T2D patients from approximately a quarter of all GP practices from all over the Netherlands, with representative proportions of urbanity, rurality, and socioeconomic status [3].

4.5. Conclusions

Our study showed that, during the first year of the COVID-19 pandemic in the Netherlands, changes in primary healthcare utilization were observed among people with T2D, with an increase in GP office visits and telephone calls and a decrease in the frequency of clinical measurements. HbA1c levels significantly increased in patients with T2D in 2020, both within and between persons. Further research could focus on the occurrence of complications in relation to the HbA1c increases during this exceptional period of the COVID-19 pandemic.

Supplementary Materials

The following supporting information can be downloaded at https://www.mdpi.com/article/10.3390/covid3110115/s1, Figure S1. Patient selection flowchart. Cohort entry date (CED) is March 1, 2019; Table S1. Definitions of patient characteristics at the start of the cohort (March 1, 2019); Table S2. Sensitivity analysis. Overview of outcomes in the lockdown period (1 March until 30 June 2020) and the same period in 2019; Table S3. Sensitivity analysis. Negative binomial regression model of health care use in the lockdown period (March 1 until June 30, 2020) and the same period in 2019; Table S4. Sensitivity analysis. Generalized estimated equations (GEE) models of clinical outcomes in the lockdown period (March 1 until June 30, 2020) and the same period in 2019.

Author Contributions

Conceptualization and methodology: J.M.v.d.B., M.T.B., K.M.A.S. and J.A.O.; Formal analysis: J.M.v.d.B., K.M.A.S. and S.R.; Manuscript writing: J.M.v.d.B.; Manuscript revising: M.T.B., K.M.A.S., J.A.O., S.R., P.J.M.E. and R.M.C.H. All authors have read and agreed to the published version of the manuscript.

Funding

This research received no external funding.

Institutional Review Board Statement

The study was approved by the Institutional Review Board of Stichting Informatievoorziening voor Zorg en Onderzoek (STIZON, reference number CC2023-25, 1 November 2023).

Informed Consent Statement

Patient consent was waived as permitted by the Institutional Review Board.

Data Availability Statement

The datasets generated and analyzed during the current study are not publicly available but are available from the corresponding author on reasonable request and after approval of the Compliance Committee of Stichting Informatievoorziening voor Zorg en Onderzoek.

Acknowledgments

The authors would like to thank all the healthcare providers contributing information to the PHARMO Data Network.

Conflicts of Interest

Jesse M. van den Berg, Karin M.A. Swart, and Jetty A. Overbeek are employees, and Ron M.C. Herings is the scientific director of the PHARMO Institute for Drug Outcomes Research. This independent research institute performs financially supported studies for the government, related healthcare authorities, and several pharmaceutical companies. The other authors have declared no competing interest.

References

  1. Findling, M.G.; Blendon, R.J.; Benson, J.M. Delayed Care with Harmful Health Consequences-Reported Experiences from National Surveys During Coronavirus Disease 2019. JAMA Health Forum 2020, 1, e201463. [Google Scholar] [CrossRef] [PubMed]
  2. Van Giessen, A.; De Wit, A.; Van den Brink, C.; Degeling, K.; Deuning, C.; Eeuwijk, J.; van den Ende, C.; van Gestel, I.; Gijsen, R.; van Gils, P. Impact van de Eerste COVID-19 Golf op de Reguliere Zorg en Gezondheid: Inventarisatie van de Omvang van het Probleem en Eerste Schatting van Gezondheidseffecten. 2020. Available online: https://rivm.openrepository.com/handle/10029/624583 (accessed on 4 April 2023).
  3. Overbeek, J.A.; Swart, K.M.A.; van der Pal, E.Y.M.; Blom, M.T.; Beulens, J.W.J.; Nijpels, G.; Elders, P.J.M.; Herings, R.M.C. The DIAbetes MANagement and Treatment (DIAMANT) Cohort. Clin. Epidemiol. 2022, 14, 1453–1462. [Google Scholar] [CrossRef] [PubMed]
  4. Volksgezondheidenzorg.info. Diabetes Mellitus. Available online: https://www.vzinfo.nl/diabetes-mellitus (accessed on 6 April 2023).
  5. Barents, E.S.E.; Bilo, H.J.G.; Bouma, M.; Dankers, M.; De Rooij, A.; Hart, H.E.; Houweling, S.T.; IJzerman, R.G.; Janssen, P.G.H.; Kerssen, A.; et al. NHG-Standaard Diabetes Mellitus Type 2; Dutch College of General Practitioners (NHG): Utrecht, The Netherlands, 2018. [Google Scholar]
  6. Khare, J.; Jindal, S. Observational study on effect of lock down due to COVID 19 on HBA1c levels in patients with diabetes: Experience from Central India. Prim. Care Diabetes 2022, 16, 775–779. [Google Scholar] [CrossRef] [PubMed]
  7. Heins, M.; Hek, K.; Hooiveld, M.; Hendriksen, J.; Korevaar, J. Impact Coronapandemie op Zorgvraag bij Huisartsen (Factsheet A). 2020. Available online: https://www.nivel.nl/sites/default/files/bestanden/1003787.pdf (accessed on 4 April 2023).
  8. Kuiper, J.G.; Bakker, M.; Penning-van Beest, F.J.A.; Herings, R.M.C. Existing Data Sources for Clinical Epidemiology: The PHARMO Database Network. Clin. Epidemiol. 2020, 12, 415–422. [Google Scholar] [CrossRef] [PubMed]
  9. RIVM. Tijdlijn van Coronamaatregelen. 2020. Available online: https://www.rivm.nl/gedragsonderzoek/tijdlijn-van-coronamaatregelen-2020 (accessed on 7 April 2023).
  10. Amsah, N.; Md Isa, Z.; Ahmad, N.; Abdul Manaf, M.R. Impact of COVID-19 Pandemic on Healthcare Utilization among Patients with Type 2 Diabetes Mellitus: A Systematic Review. Int. J. Env. Res. Public Health 2023, 20, 4577. [Google Scholar] [CrossRef] [PubMed]
  11. Van Grondelle, S.E.; Van Bruggen, S.; Rauh, S.P.; Van der Zwan, M.; Cebrian, A.; Seidu, S.; Rutten, G.; Vos, H.M.M.; Numans, M.E.; Vos, R.C. The impact of the COVID-19 pandemic on diabetes care: The perspective of healthcare providers across Europe. Prim. Care Diabetes 2023, 17, 141–147. [Google Scholar] [CrossRef] [PubMed]
  12. Carr, M.J.; Wright, A.K.; Leelarathna, L.; Thabit, H.; Milne, N.; Kanumilli, N.; Ashcroft, D.M.; Rutter, M.K. Impact of COVID-19 restrictions on diabetes health checks and prescribing for people with type 2 diabetes: A UK-wide cohort study involving 618 161 people in primary care. BMJ Qual. Saf. 2022, 31, 503–514. [Google Scholar] [CrossRef] [PubMed]
  13. Chen, J.L.; Krupp, G.R.; Lo, J.Y. The COVID-19 Pandemic and Changes in Health Care Utilization among Patients with Type 2 Diabetes. Diabetes Care 2022, 45, e74–e76. [Google Scholar] [CrossRef] [PubMed]
  14. Eberle, C.; Stichling, S. Impact of COVID-19 lockdown on glycemic control in patients with type 1 and type 2 diabetes mellitus: A systematic review. Diabetol. Metab. Syndr. 2021, 13, 95. [Google Scholar] [CrossRef] [PubMed]
  15. Ohkuma, K.; Sawada, M.; Aihara, M.; Doi, S.; Sekine, R.; Usami, S.; Ohe, K.; Kubota, N.; Yamauchi, T. Impact of the COVID-19 pandemic on the glycemic control in people with diabetes mellitus: A retrospective cohort study. J. Diabetes Investig. 2023, 14, 985–993. [Google Scholar] [CrossRef] [PubMed]
  16. Jacob, L.; Rickwood, S.; Rathmann, W.; Kostev, K. Change in glucose-lowering medication regimens in individuals with type 2 diabetes mellitus during the COVID-19 pandemic in Germany. Diabetes Obes. Metab. 2021, 23, 910–915. [Google Scholar] [CrossRef] [PubMed]
  17. Ghosh, A.; Arora, B.; Gupta, R.; Anoop, S.; Misra, A. Effects of nationwide lockdown during COVID-19 epidemic on lifestyle and other medical issues of patients with type 2 diabetes in north India. Diabetes Metab. Syndr. 2020, 14, 917–920. [Google Scholar] [CrossRef] [PubMed]
  18. Ruiz-Roso, M.B.; Knott-Torcal, C.; Matilla-Escalante, D.C.; Garcimartin, A.; Sampedro-Nunez, M.A.; Davalos, A.; Marazuela, M. COVID-19 Lockdown and Changes of the Dietary Pattern and Physical Activity Habits in a Cohort of Patients with Type 2 Diabetes Mellitus. Nutrients 2020, 12, 2327. [Google Scholar] [CrossRef] [PubMed]
Figure 1. Study design diagram. The index date is 1 March 2019. Windows for assessment of inclusion, exclusion, covariates, and outcomes are presented. Baseline conditions included high-risk or non-high-risk populations, HbA1c on/off target, smoking status, and several other clinical parameters. Censoring occurred at the moment of death, end of follow-up, or end of the study period. T2D, type 2 diabetes; SES, socioeconomic status.
Covid 03 00115 g001
Table 1. Baseline characteristics of the study population on 1 March 2019.
Patient CharacteristicsTotal PopulationAge < 70Age ≥ 70HbA1c on TargetHbA1c off TargetNon-High-Risk T2DHigh-Risk T2D
N = 182,048N = 86,443N = 95,605N = 106,495N = 54,654N = 158,750N = 23,298
Age, mean (SD)69.0 (13.1)58.2 (9.6)78.8 (6.4)70.9 (11.8)67.7 (12.4)67.5 (12.8)78.9 (9.9)
Female, n (%)85,204 (46.8)37,741 (43.7)47,463 (49.6)51,592 (48.4)24,246 (44.4)73,945 (46.6)11,259 (48.3)
T2D duration, n (%)
  <2 years16,674 (9.2)11,265 (13.0)5409 (5.7)10,784 (10.1)4298 (7.8)15,705 (9.9)969 (4.2)
  2–4 years28,347 (15.6)18,190 (21.1)10,157 (10.6)16,787 (15.7)7143 (13.1)26,290 (16.6)2057 (8.8)
  5–9 years52,310 (28.7)27,137 (31.4)25,173 (26.3)30,732 (28.9)16,375 (30.0)46,998 (29.6)5312 (22.8)
  10+ years84,717 (46.5)29,851 (34.5)54,866 (57.4)48,192 (45.3)26,837 (49.1)69,757 (43.9)14,960 (64.2)
SES, n (%)
  Low64,102 (35.2)24,742 (28.6)26,273 (27.5)36,215 (34.0)20,504 (37.5)55,206 (34.8)8896 (38.2)
  Middle65,136 (35.8)31,126 (36.0)32,976 (34.5)38,706 (36.4)18,918 (34.6)56,794 (35.8)8342 (35.8)
  High51,015 (28.0)29,622 (34.3)35,514 (37.1)30,607 (28.7)14,634 (26.8)45,163 (28.4)5852 (25.1)
  Unknown1795 (1.0)953 (1.1)842 (0.9)967 (0.9)597 (1.1)1587 (1.0)208 (0.9)
Smoking, n (%)
  Current23,812 (13.1)15,096 (17.5)8716 (9.1)13,691 (12.8)8619 (15.8)21,173 (13.4)2639 (11.3)
  Former55,181 (30.3)22,704 (26.3)32,477 (34.0)35,553 (33.4)17,288 (31.6)47,497 (29.9)7684 (33.0)
  Never75,013 (41.2)32,339 (37.4)42,674 (44.6)46,494 (43.7)25,116 (46.0)65,229 (41.1)9714 (41.7)
  Unknown28,042 (15.4)16,304 (18.8)11,738 (12.3)10,757 (10.1)3640 (6.6)24,781 (15.6)3261 (14.0)
Clinical parameters, mean (SD)
HbA1c (mmol/mol)54.6 (13.8)55.7 (15.6)53.7 (12.0)47.4 (6.3)67.3 (13.4)54.4 (13.8)56.4 (14.0)
BMI (kg/m2)29.8 (5.4)30.0 (5.7)28.9 (5.0)29.5 (5.3)30.3 (5.5)29.8 (5.4)29.4 (5.4)
LDL (mmol/L)2.44 (0.92)2.55 (0.95)2.36 (0.90)2.45 (0.91)2.42 (0.93)2.47 (0.92)2.31 (0.93)
SBP (mmHg)137.4 (17.0)135.1 (16.4)139.5 (17.2)137.4 (16.9)137.5 (16.8)137.1 (16.6)139.9 (19.2)
eGFR (mL/min/1.73 m2)76.0 (21.0)87.7 (17.5)66.0 (18.3)74.1 (20.1)79.4 (21.2)81.0 (16.7)44.2 (16.8)
SD, standard deviation; T2D, type 2 diabetes; SES, socioeconomic status, HbA1c, Hemoglobin A1c; BMI, body mass index; LDL, low-density lipoprotein cholesterol; SBP, systolic blood pressure; eGFR, estimated glomerular filtration rate. HbA1c on target and high-risk T2D as defined in Supplementary Table S1.
Table 2. Overview of outcomes in 2020 (March 1 until December 31) and the same period in 2019.
2019
(N = 182,048)
2020
(N = 168,097)
GP visit counts, %
Office visits020.9%19.9%
17.2%8.2%
>171.9%71.9%
Home visits085.3%85.2%
16.3%6.8%
>18.4%8.0%
Phone calls072.3%68.3%
112.1%12.8%
>115.6%18.9%
E-mails098.0%98.4%
11.6%1.2%
>10.4%0.4%
Clinical measurement counts, %
HbA1c027.3%32.4%
123.6%25.3%
>149.1%42.3%
BMI028.7%38.4%
118.9%24.9%
>152.4%36.7%
LDL037.5%44.9%
151.6%43.7%
>110.9%11.4%
SBP023.3%34.0%
116.4%24.1%
>160.3%41.9%
eGFR030.4%36.7%
147.2%42.6%
>122.4%20.7%
Clinical measurement values, mean (SD)
HbA1c (mmol/mol)54.2 (11.8)55.4 (12.3)
BMI (kg/m2)29.6 (5.3)29.5 (5.2)
LDL (mmol/L)2.45 (0.89)2.41 (0.88)
SBP (mmHg)136.6 (14.5)137.9 (15.0)
eGFR (mL/min/1.73m2)74.5 (20.7)74.1 (20.9)
GP visit counts and clinical measurement counts (0, 1, or >1) are counts per observation period in years. GP, general practitioner; HbA1c, Hemoglobin A1c; BMI, body mass index; LDL, low-density lipoprotein cholesterol; SBP, systolic blood pressure; eGFR, estimated glomerular filtration rate.
Table 3. Estimated associations by negative binomial regression models of healthcare use in 2020 (1 March until 31 December) and the same period in 2019.
Total GP VisitsGP Office VisitsGP Home VisitsGP Phone Calls
2020 vs. 2019, rate ratios (95% CI)
Univariate1.09 (1.08; 1.10) **1.07 (1.06; 1.08) **0.93 (0.91; 0.96) **1.33 (1.31; 1.35) **
Multivariate1.09 (1.08; 1.09) **1.06 (1.06; 1.07) **1.02 (0.99; 1.04) NS1.33 (1.31; 1.35) **
Stratified models
Age < 701.07 (1.06; 1.08) **1.04 (1.03; 1.06) **N.A.N.A.
Age ≥ 701.10 (1.09; 1.11) **1.08 (1.07; 1.09) **N.A.N.A.
HbA1c on targetN.A.N.A.N.A.1.36 (1.33; 1.39) **
HbA1c not on targetN.A.N.A.N.A.1.28 (1.24; 1.31) **
Non-high-risk T2DN.A.N.A.1.06 (1.05; 1.07) **N.A.
High-risk T2DN.A.N.A.0.94 (0.90; 0.99) *N.A.
Estimates are rate ratios of visit counts, comparing 2020 to 2019. Multivariate models were adjusted for sex, age, socioeconomic status, diabetes duration, baseline HbA1c, baseline BMI, baseline LDL, baseline SBP, baseline eGFR, HbA1c on/off target, and (non-)high-risk T2D. If interaction terms were significant, the stratified adjusted estimates are presented accordingly; otherwise, N.A. is stated. GP, general practitioner; HbA1c, hemoglobin A1c; BMI, body mass index; LDL, low-density lipoprotein cholesterol; SBP, systolic blood pressure. ** p-value of < 0.001; * p-value of < 0.05; NS p-value of ≥ 0.05.
Table 4. Estimated differences by generalized estimated equations (GEE) models of clinical outcomes in 2020 (March 1 until December 31) compared to the same period in 2019.
HbA1c (mmol/mol)BMI (kg/m2)LDL (mmol/L)SBP (mmHg)
2020 vs. 2019, estimate (95% CI)
Univariate1.66 (1.60; 1.72) **−0.07 (−0.08; −0.06) **−0.03 (−0.03; −0.02) **1.25 (1.16; 1.34) **
Multivariate1.65 (1.59; 1.70) **−0.07 (−0.08; −0.06) **−0.03 (−0.03; −0.03) **1.27 (1.18; 1.36) **
Stratified models
Age < 701.84 (1.75; 1.93) **−0.01 (−0.03; −0.00) *−0.03 (−0.04; −0.02) **1.58 (1.46; 1.71) **
Age ≥ 701.48 (1.42; 1.55) **−0.12 (−0.13; −0.11) **−0.03 (−0.04; −0.02) **1.01 (0.88; 1.13) **
HbA1c on target2.30 (2.24; 2.36) **−0.04 (−0.05; −0.03) **N.A.1.37 (1.26; 1.48) **
HbA1c not on target0.37 (0.27; 0.49) **−0.14 (−0.15; −0.12) **N.A.1.06 (0.91; 1.21) **
Non-high-risk T2D1.68 (1.62; 1.74) **−0.06 (−0.07; −0.05) **−0.03 (−0.03; −0.02) **1.37 (1.28; 1.47) **
High-risk T2D1.38 (1.21; 1.55) **−0.15 (−0.18; −0.12) **−0.04 (−0.06; −0.03) **0.48 (0.19; 0.77) **
Estimates are differences in population averages of the clinical measurement values, comparing 2020 to 2019. Multivariate models were adjusted for sex, age, socioeconomic status, diabetes duration, baseline HbA1c, baseline BMI, baseline LDL, baseline SBP, baseline eGFR, HbA1c on/off target, and (non-)high-risk T2D. If interaction terms were significant, the stratified adjusted estimates are presented accordingly; otherwise, N.A. is stated. HbA1c, hemoglobin A1c; BMI, body mass index; LDL, low-density lipoprotein cholesterol; SBP, systolic blood pressure. ** p-value of < 0.01; * p-value of < 0.05.
Disclaimer/Publisher’s Note: The statements, opinions and data contained in all publications are solely those of the individual author(s) and contributor(s) and not of MDPI and/or the editor(s). MDPI and/or the editor(s) disclaim responsibility for any injury to people or property resulting from any ideas, methods, instructions or products referred to in the content.

