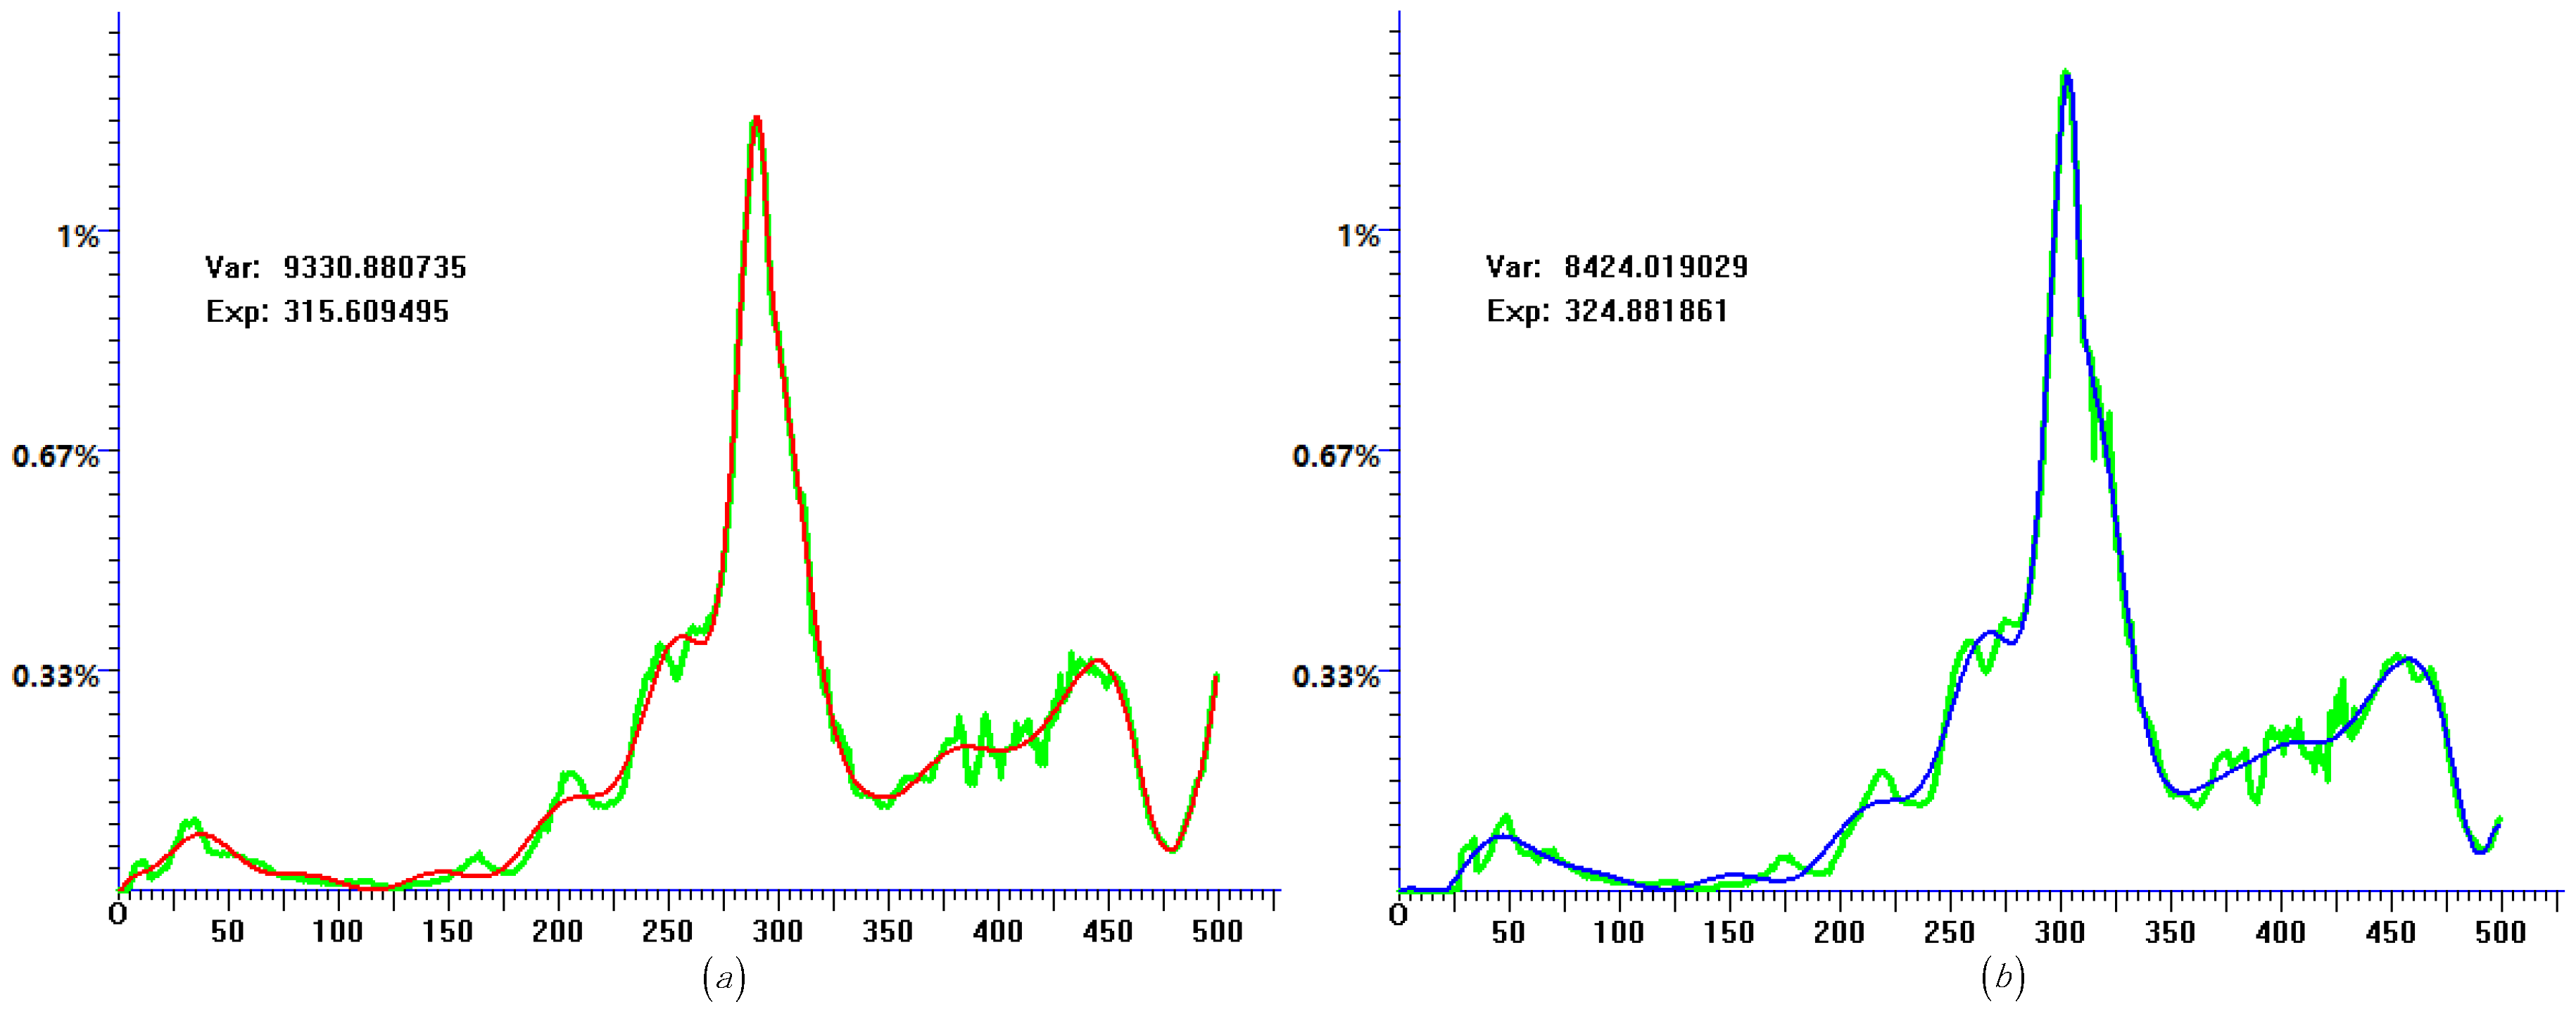
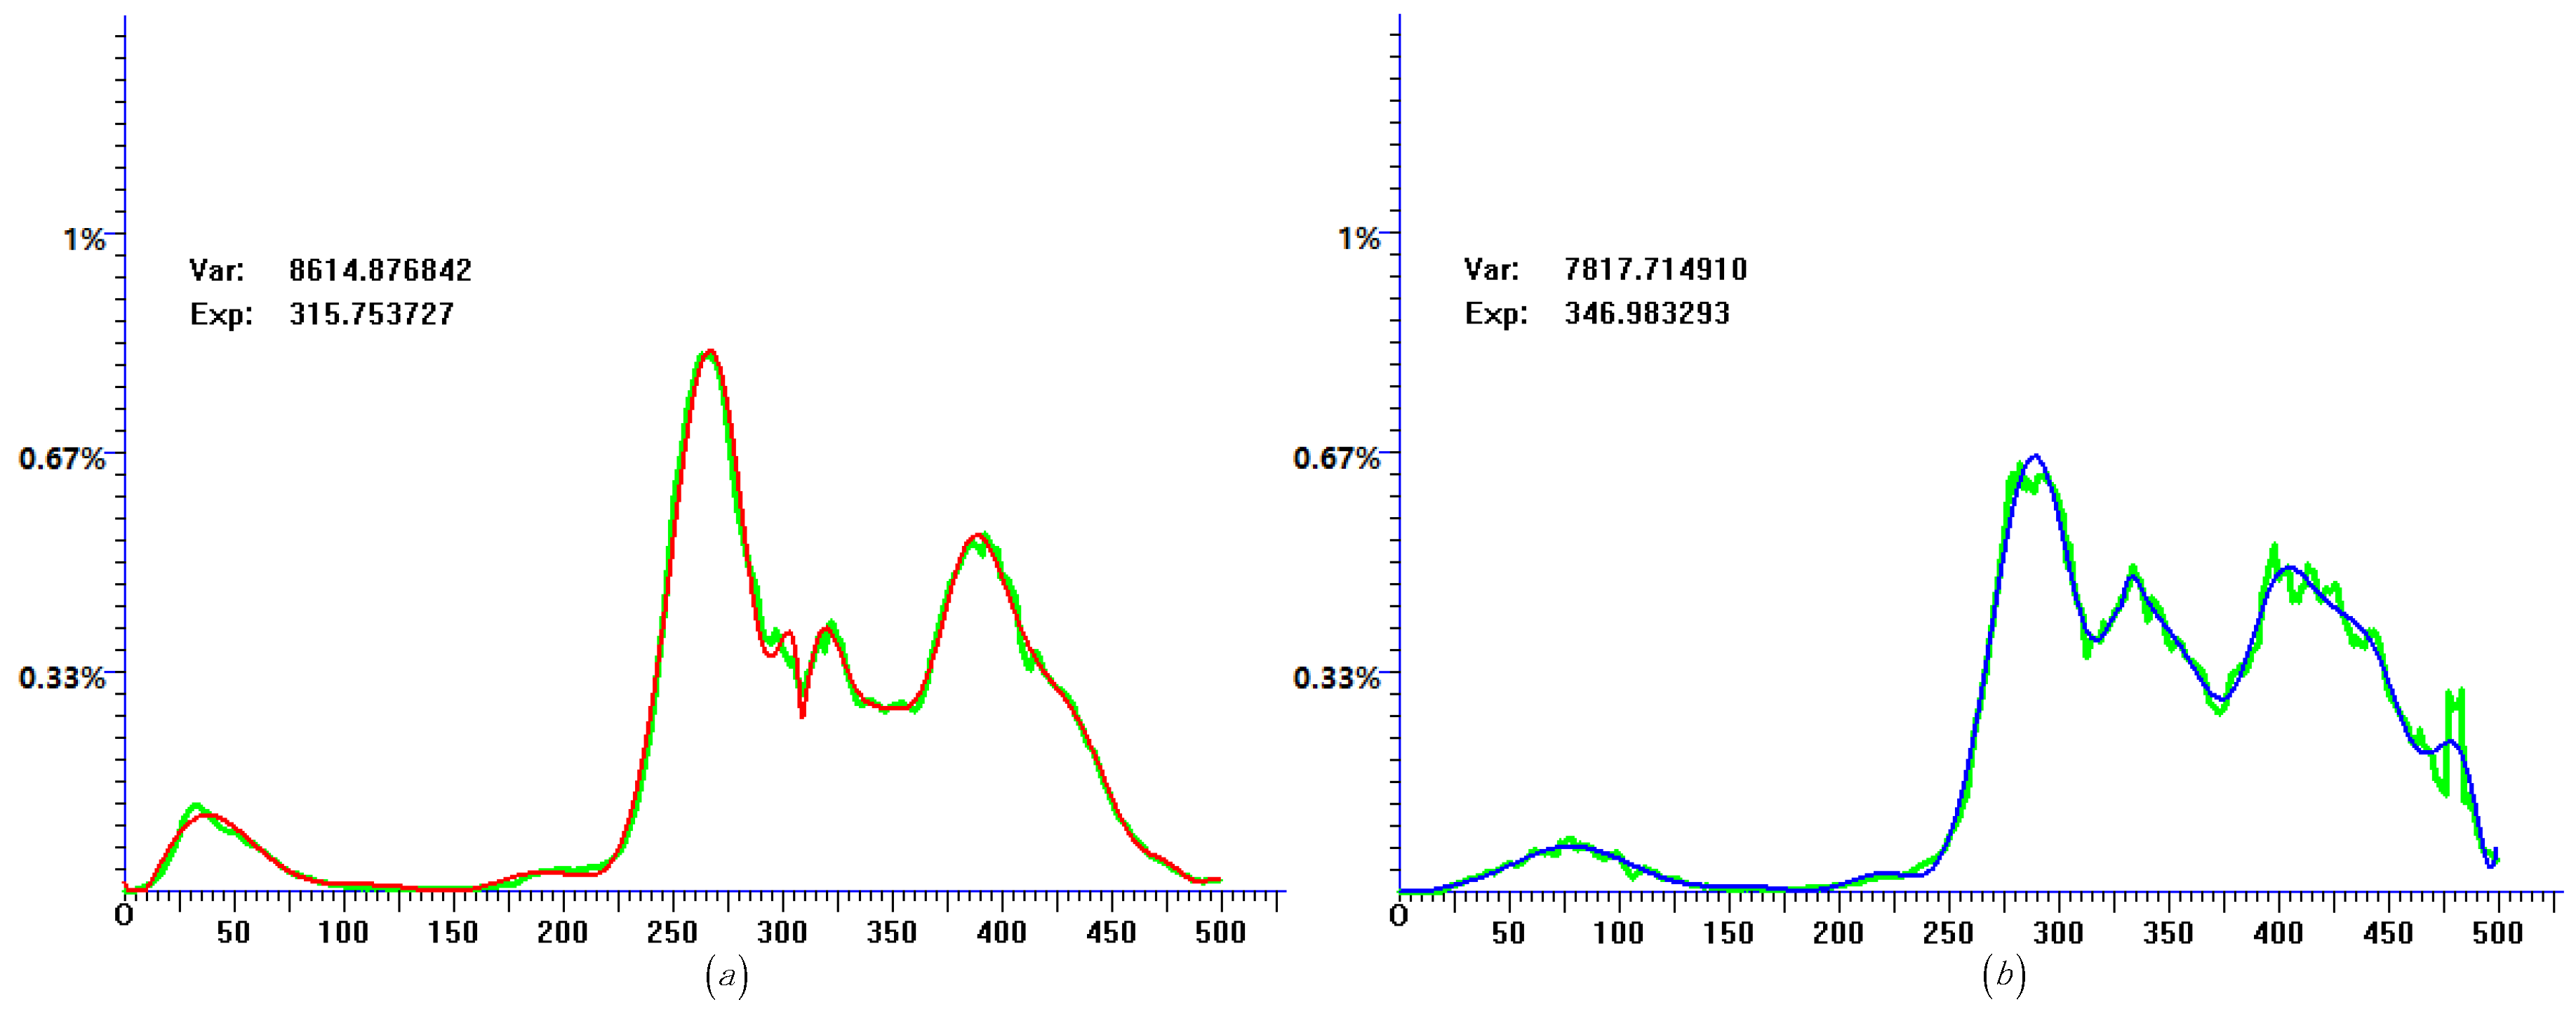
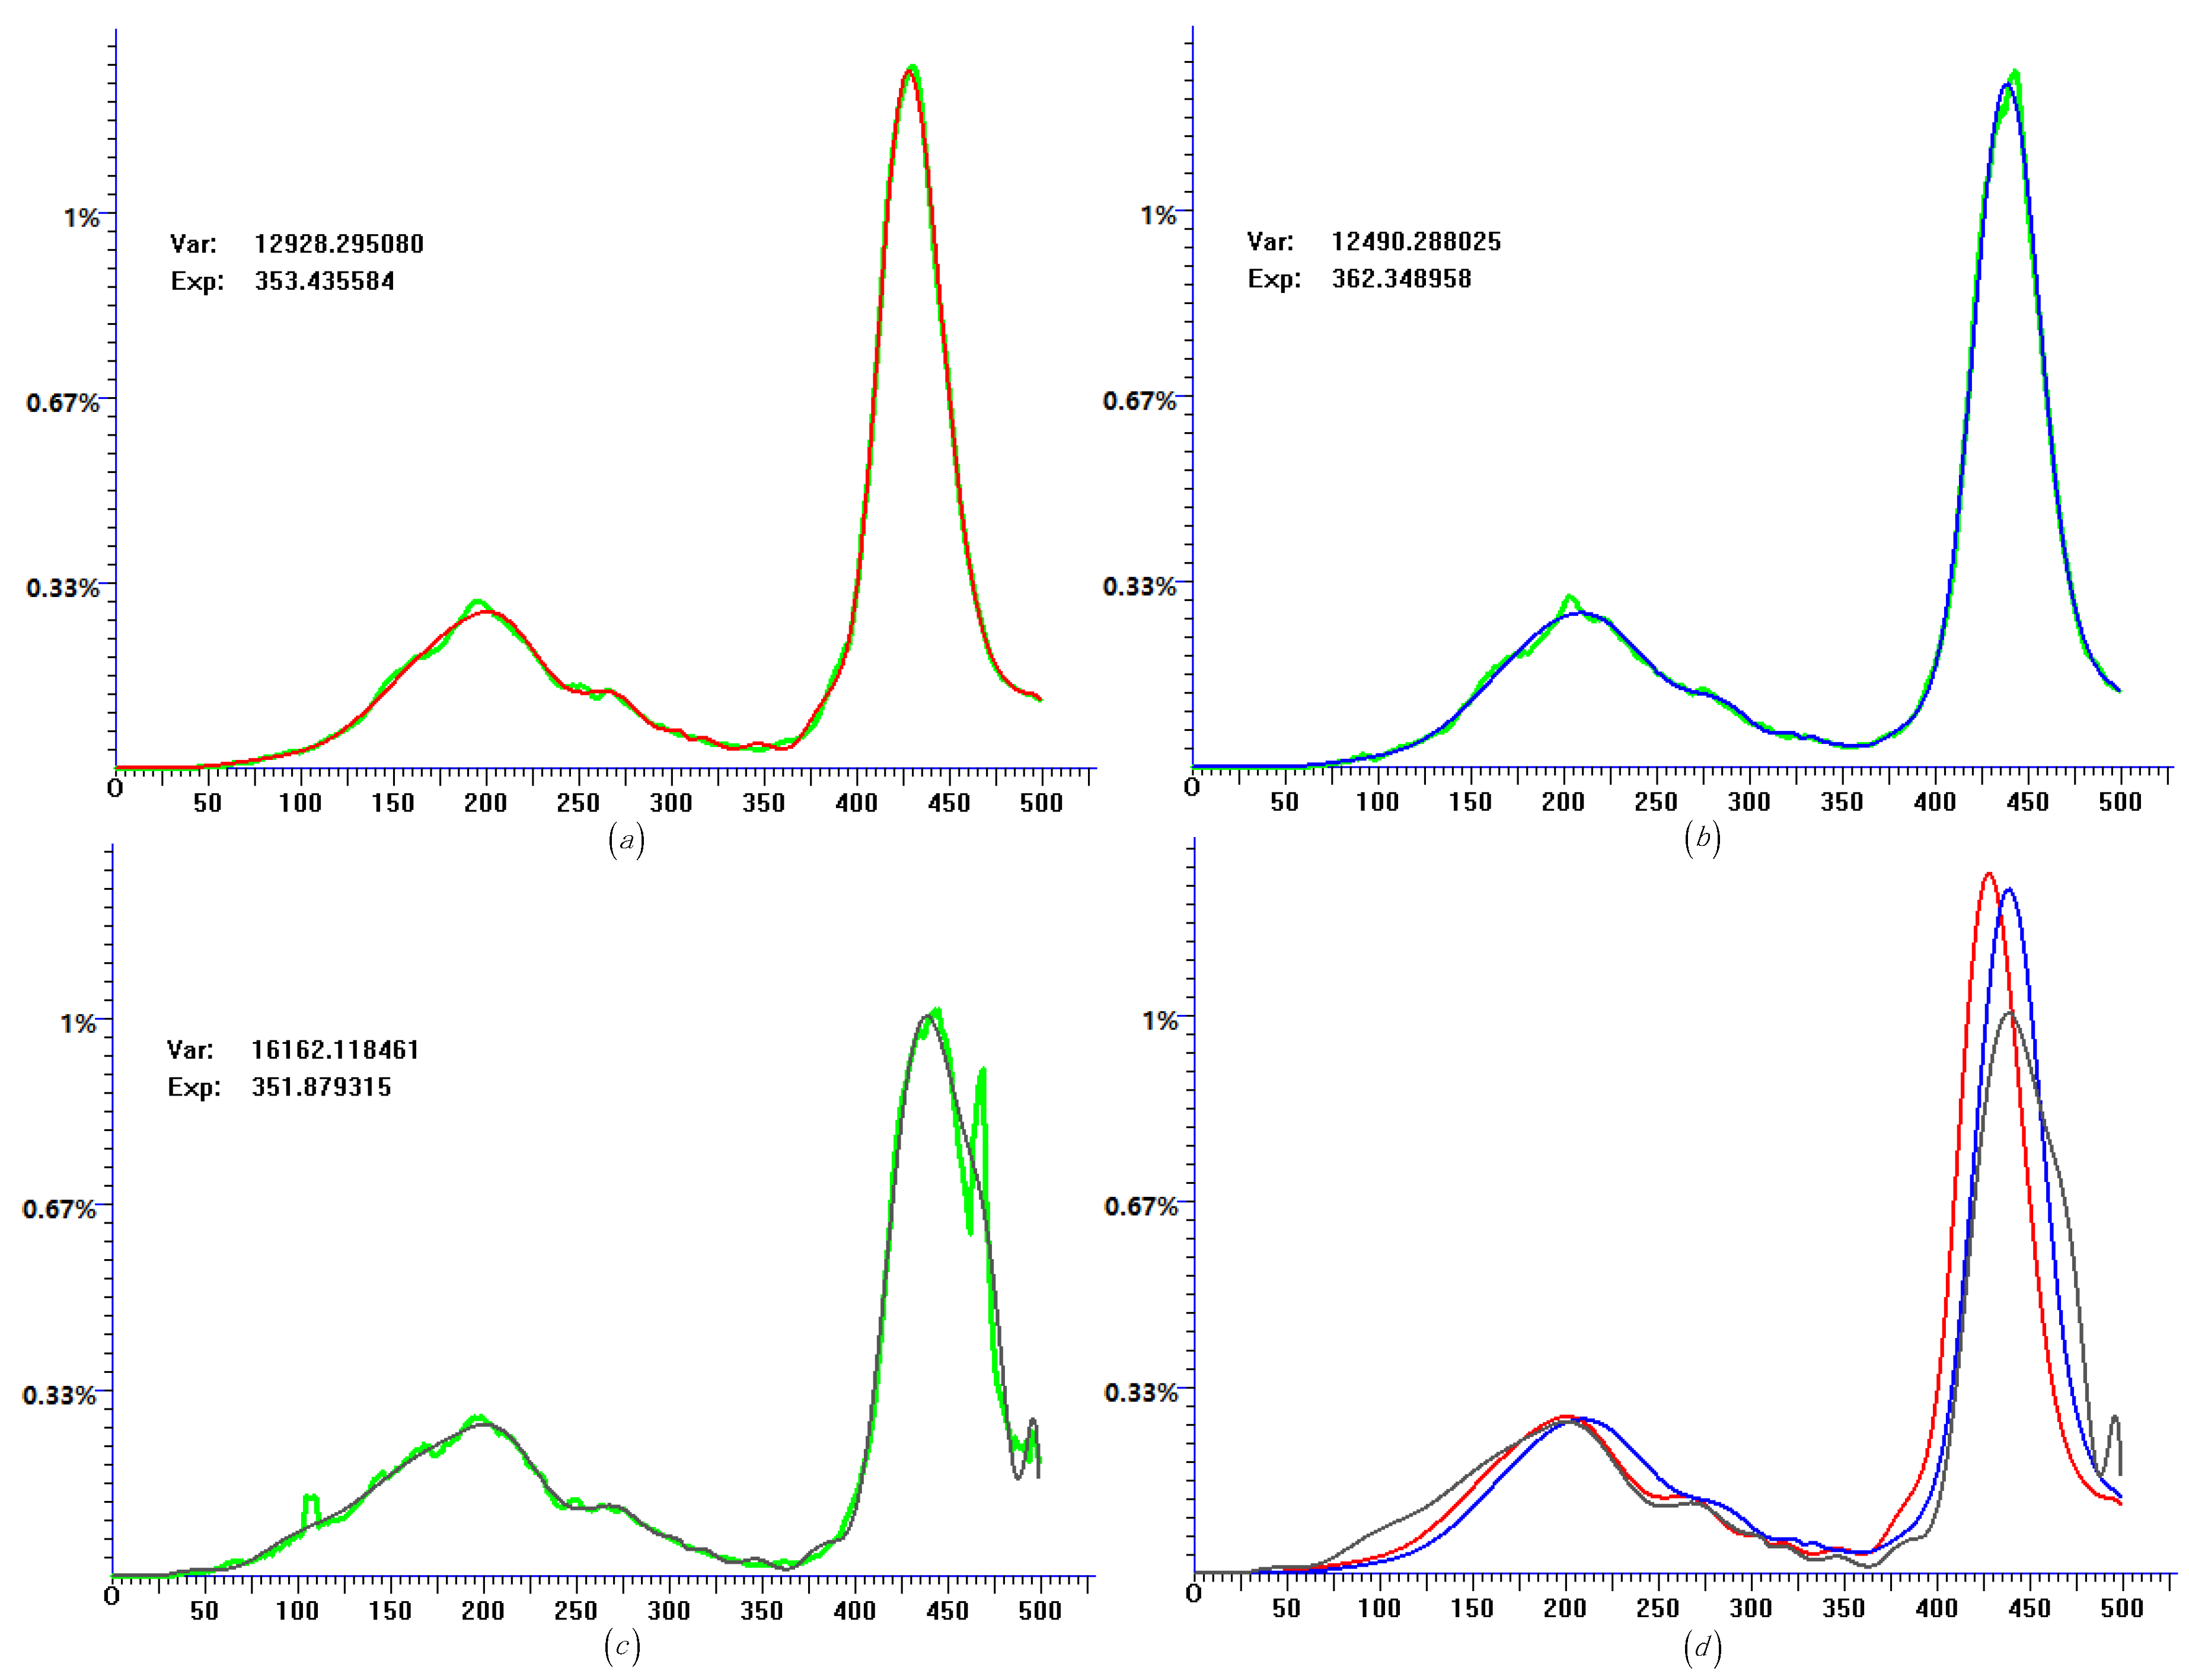
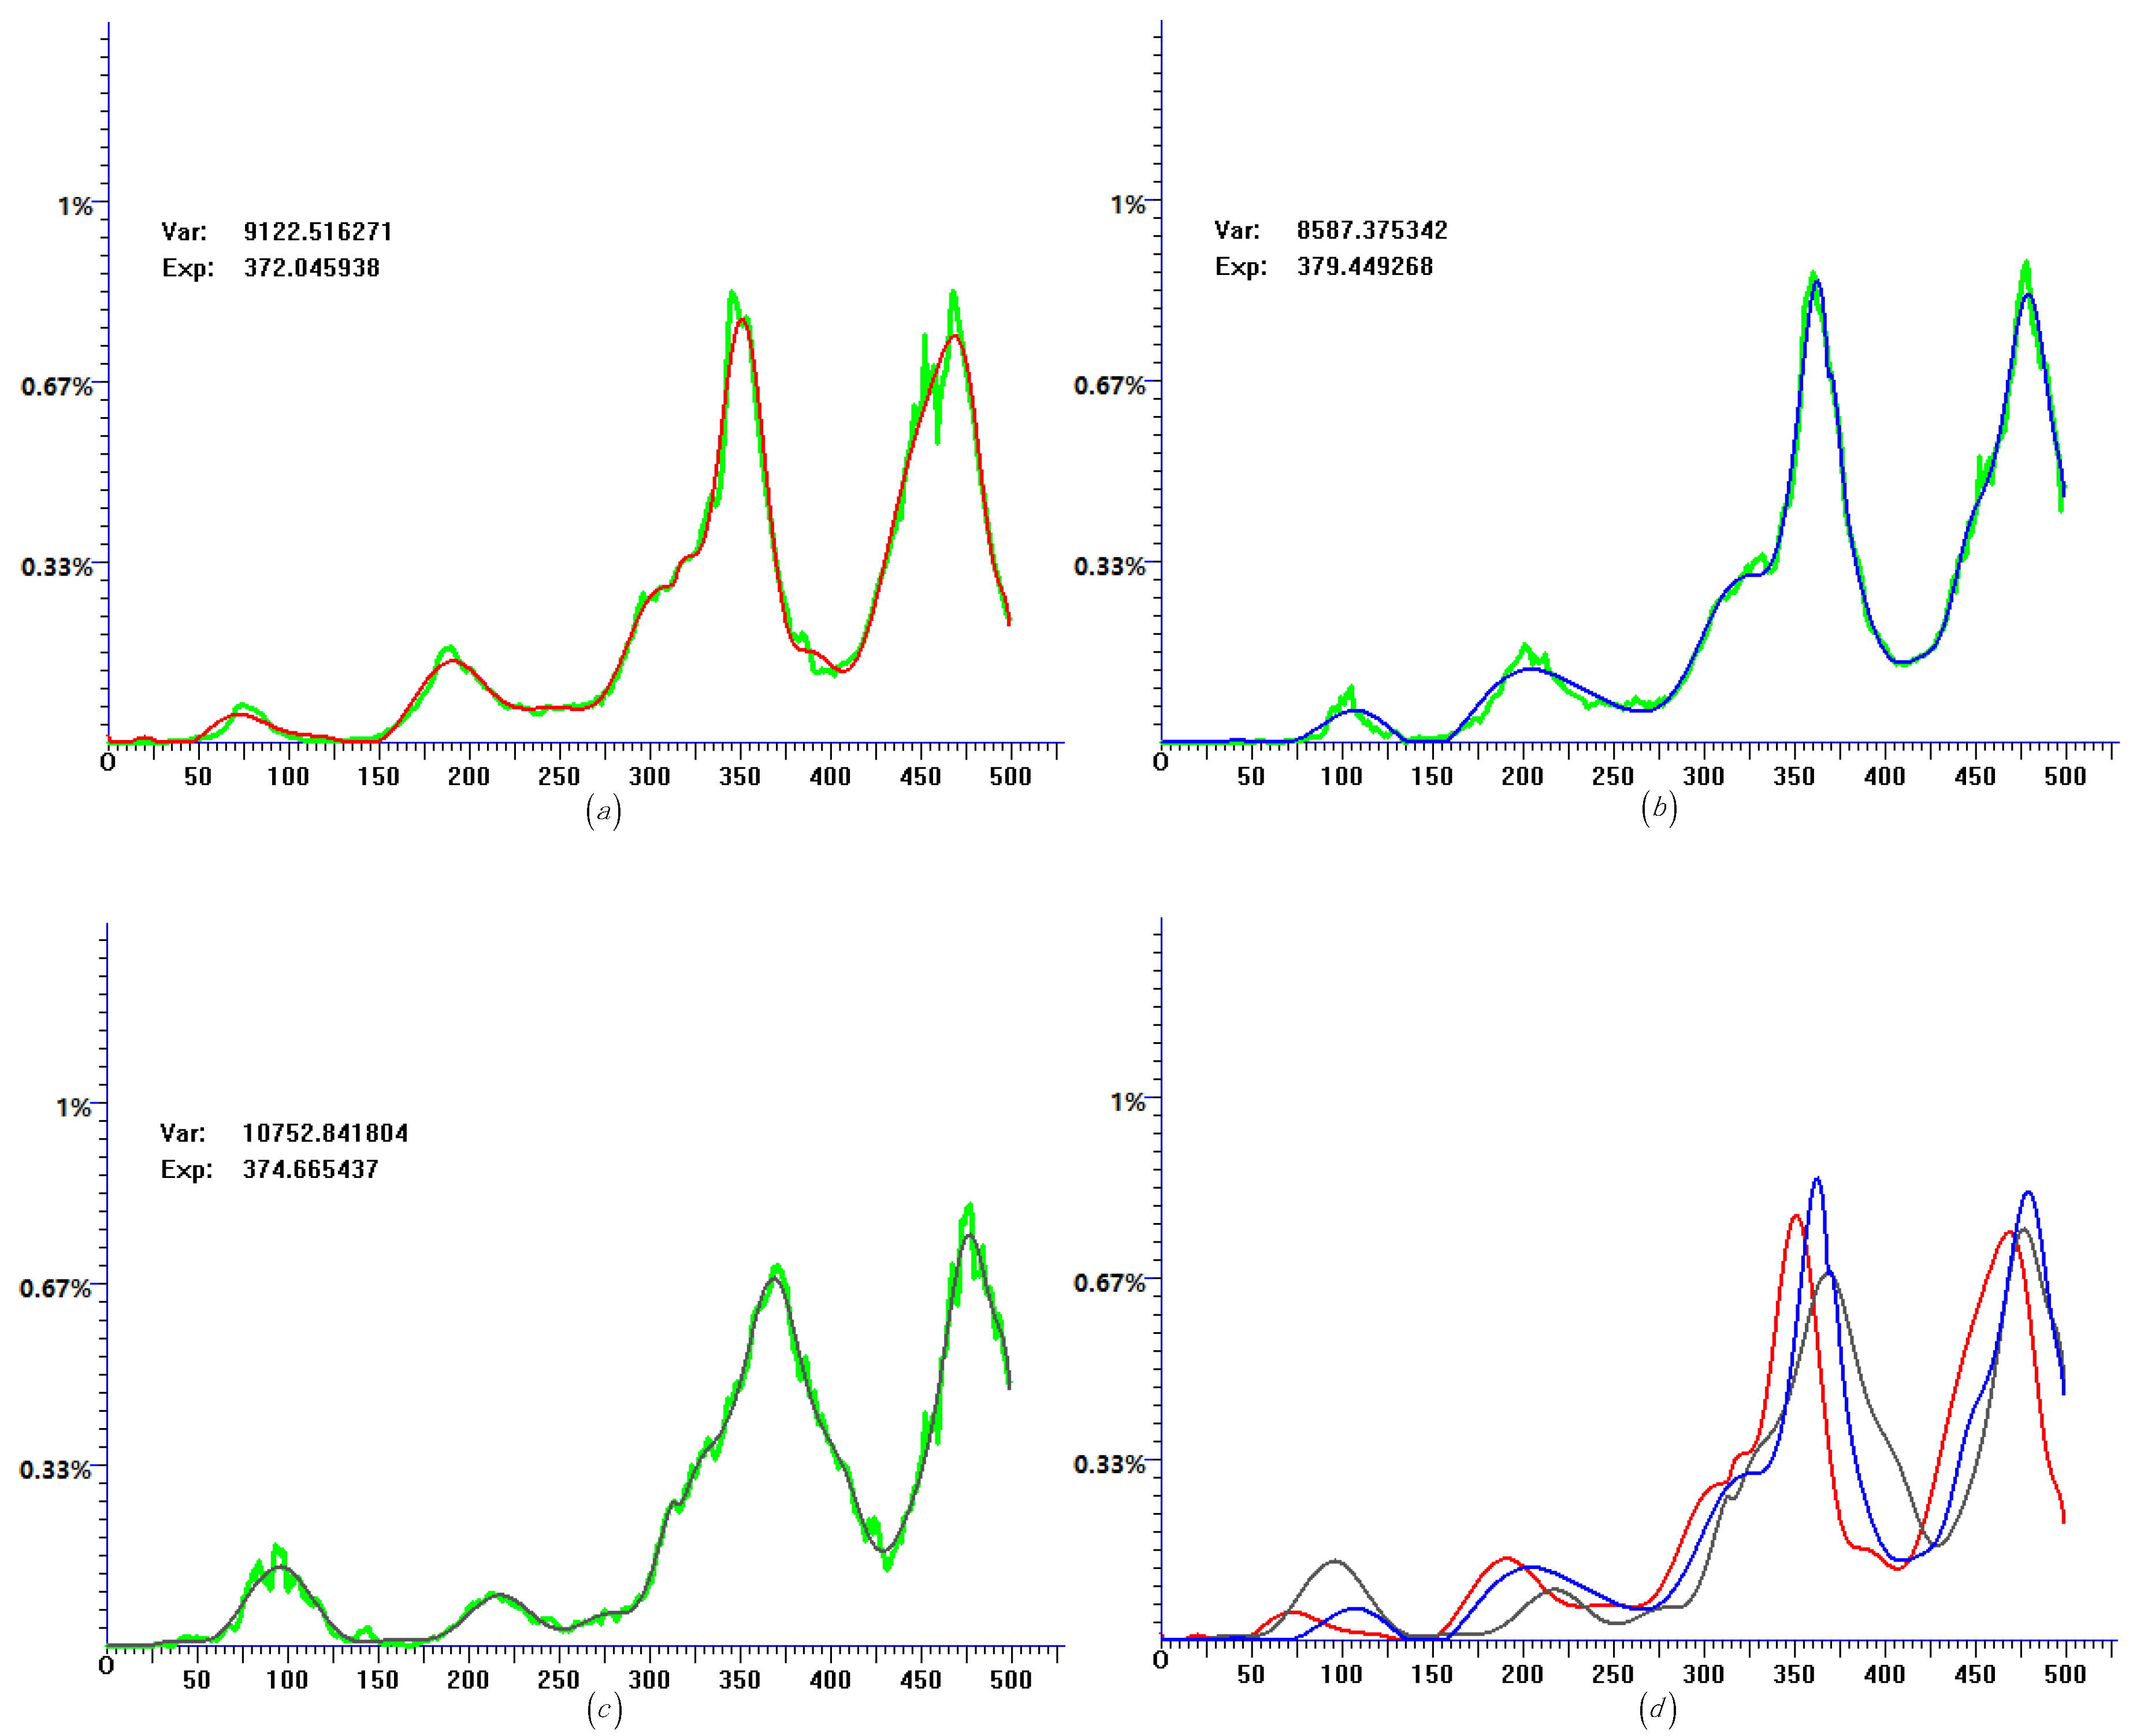
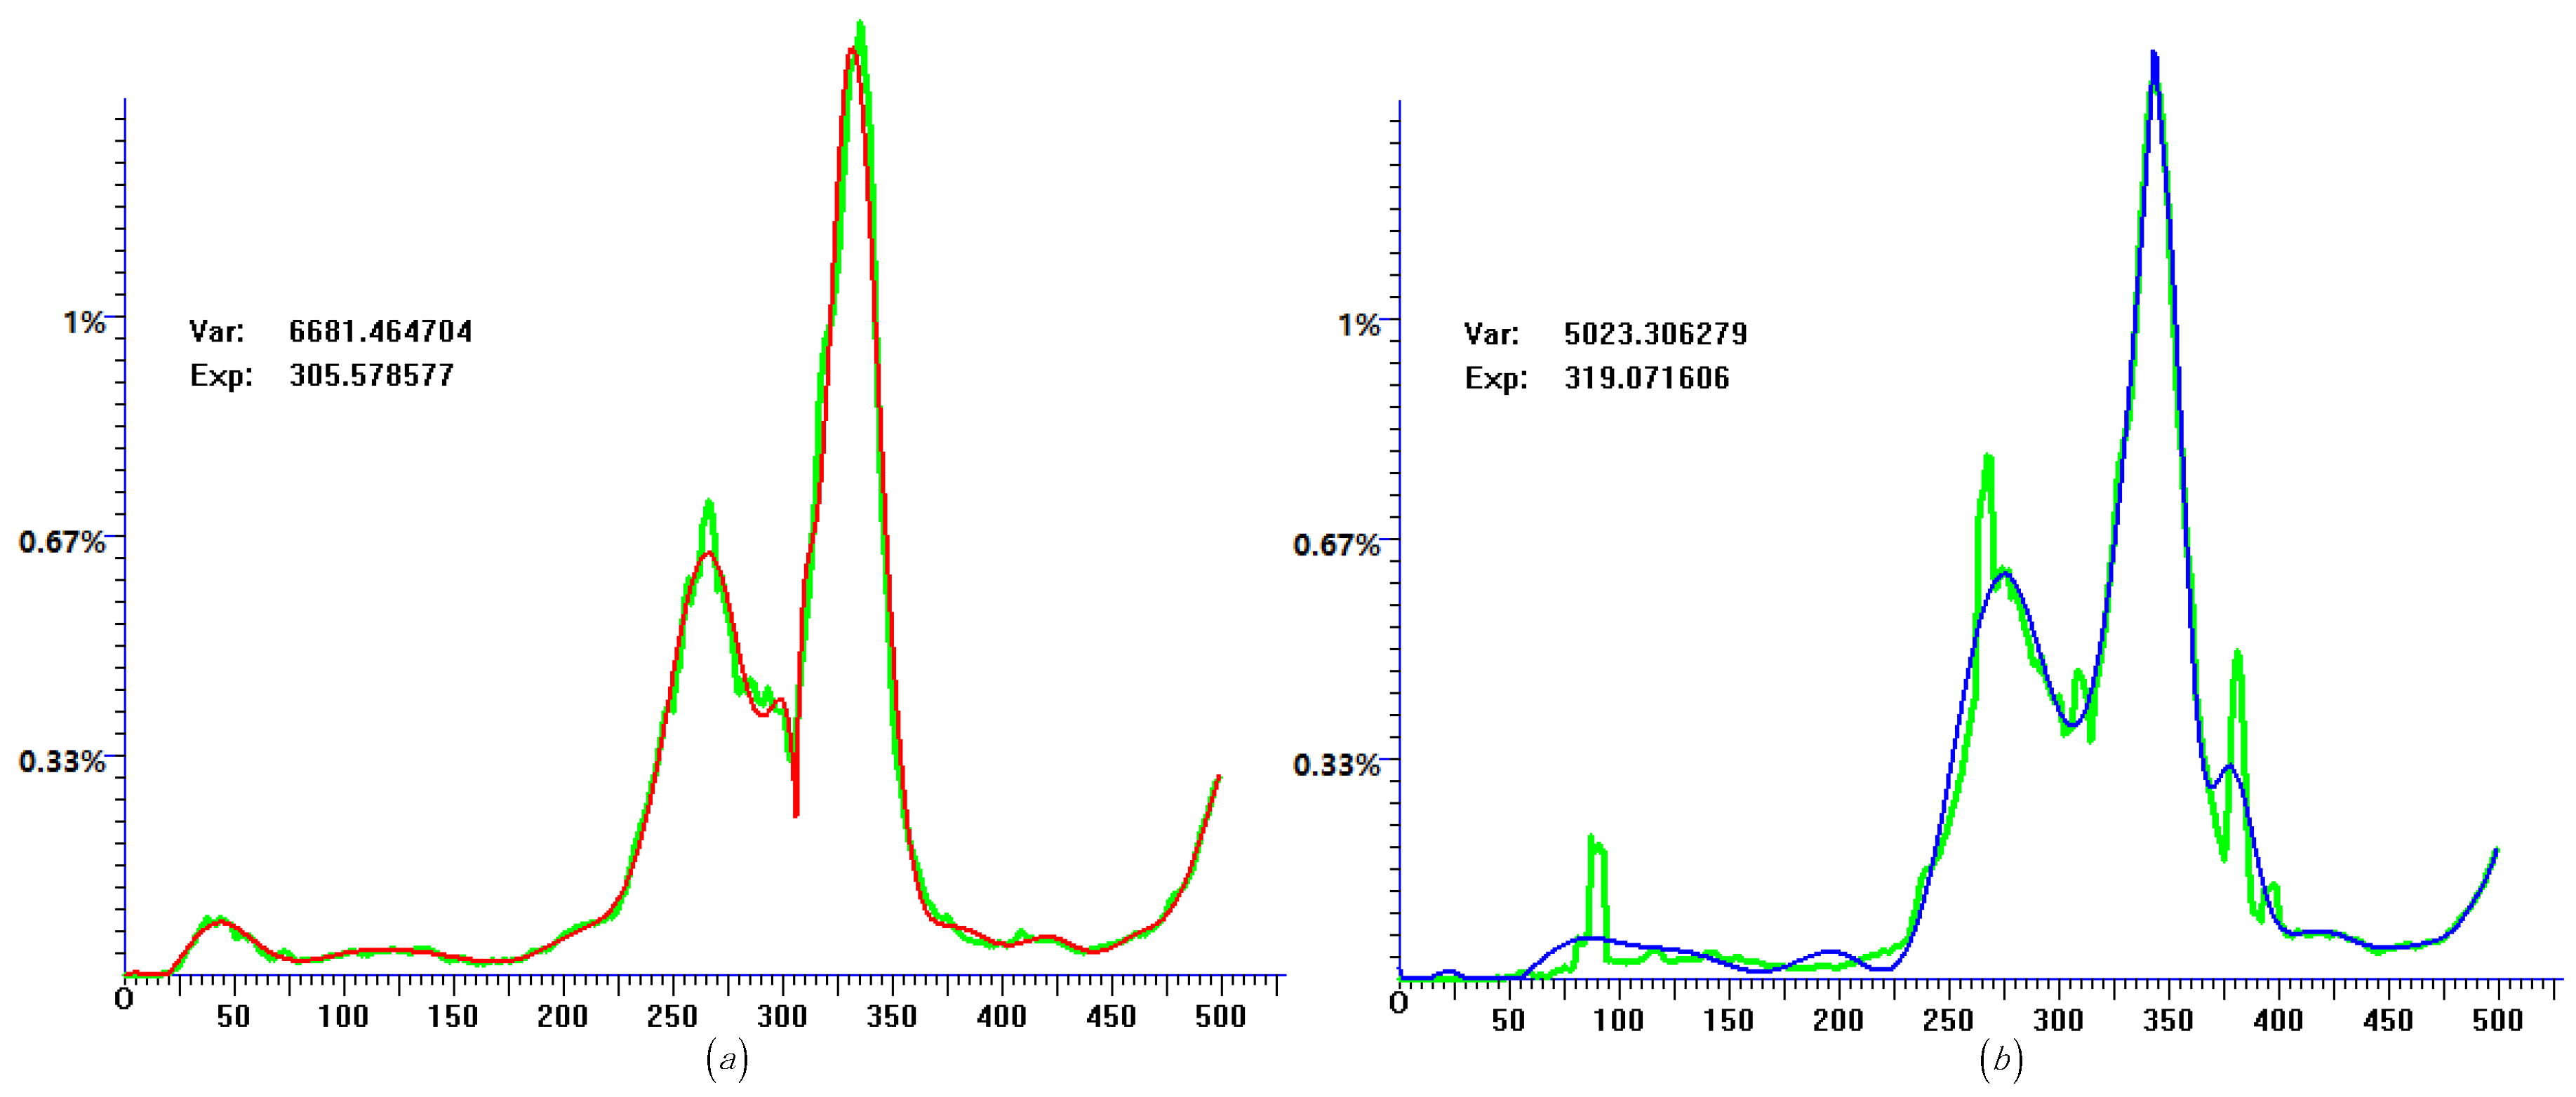
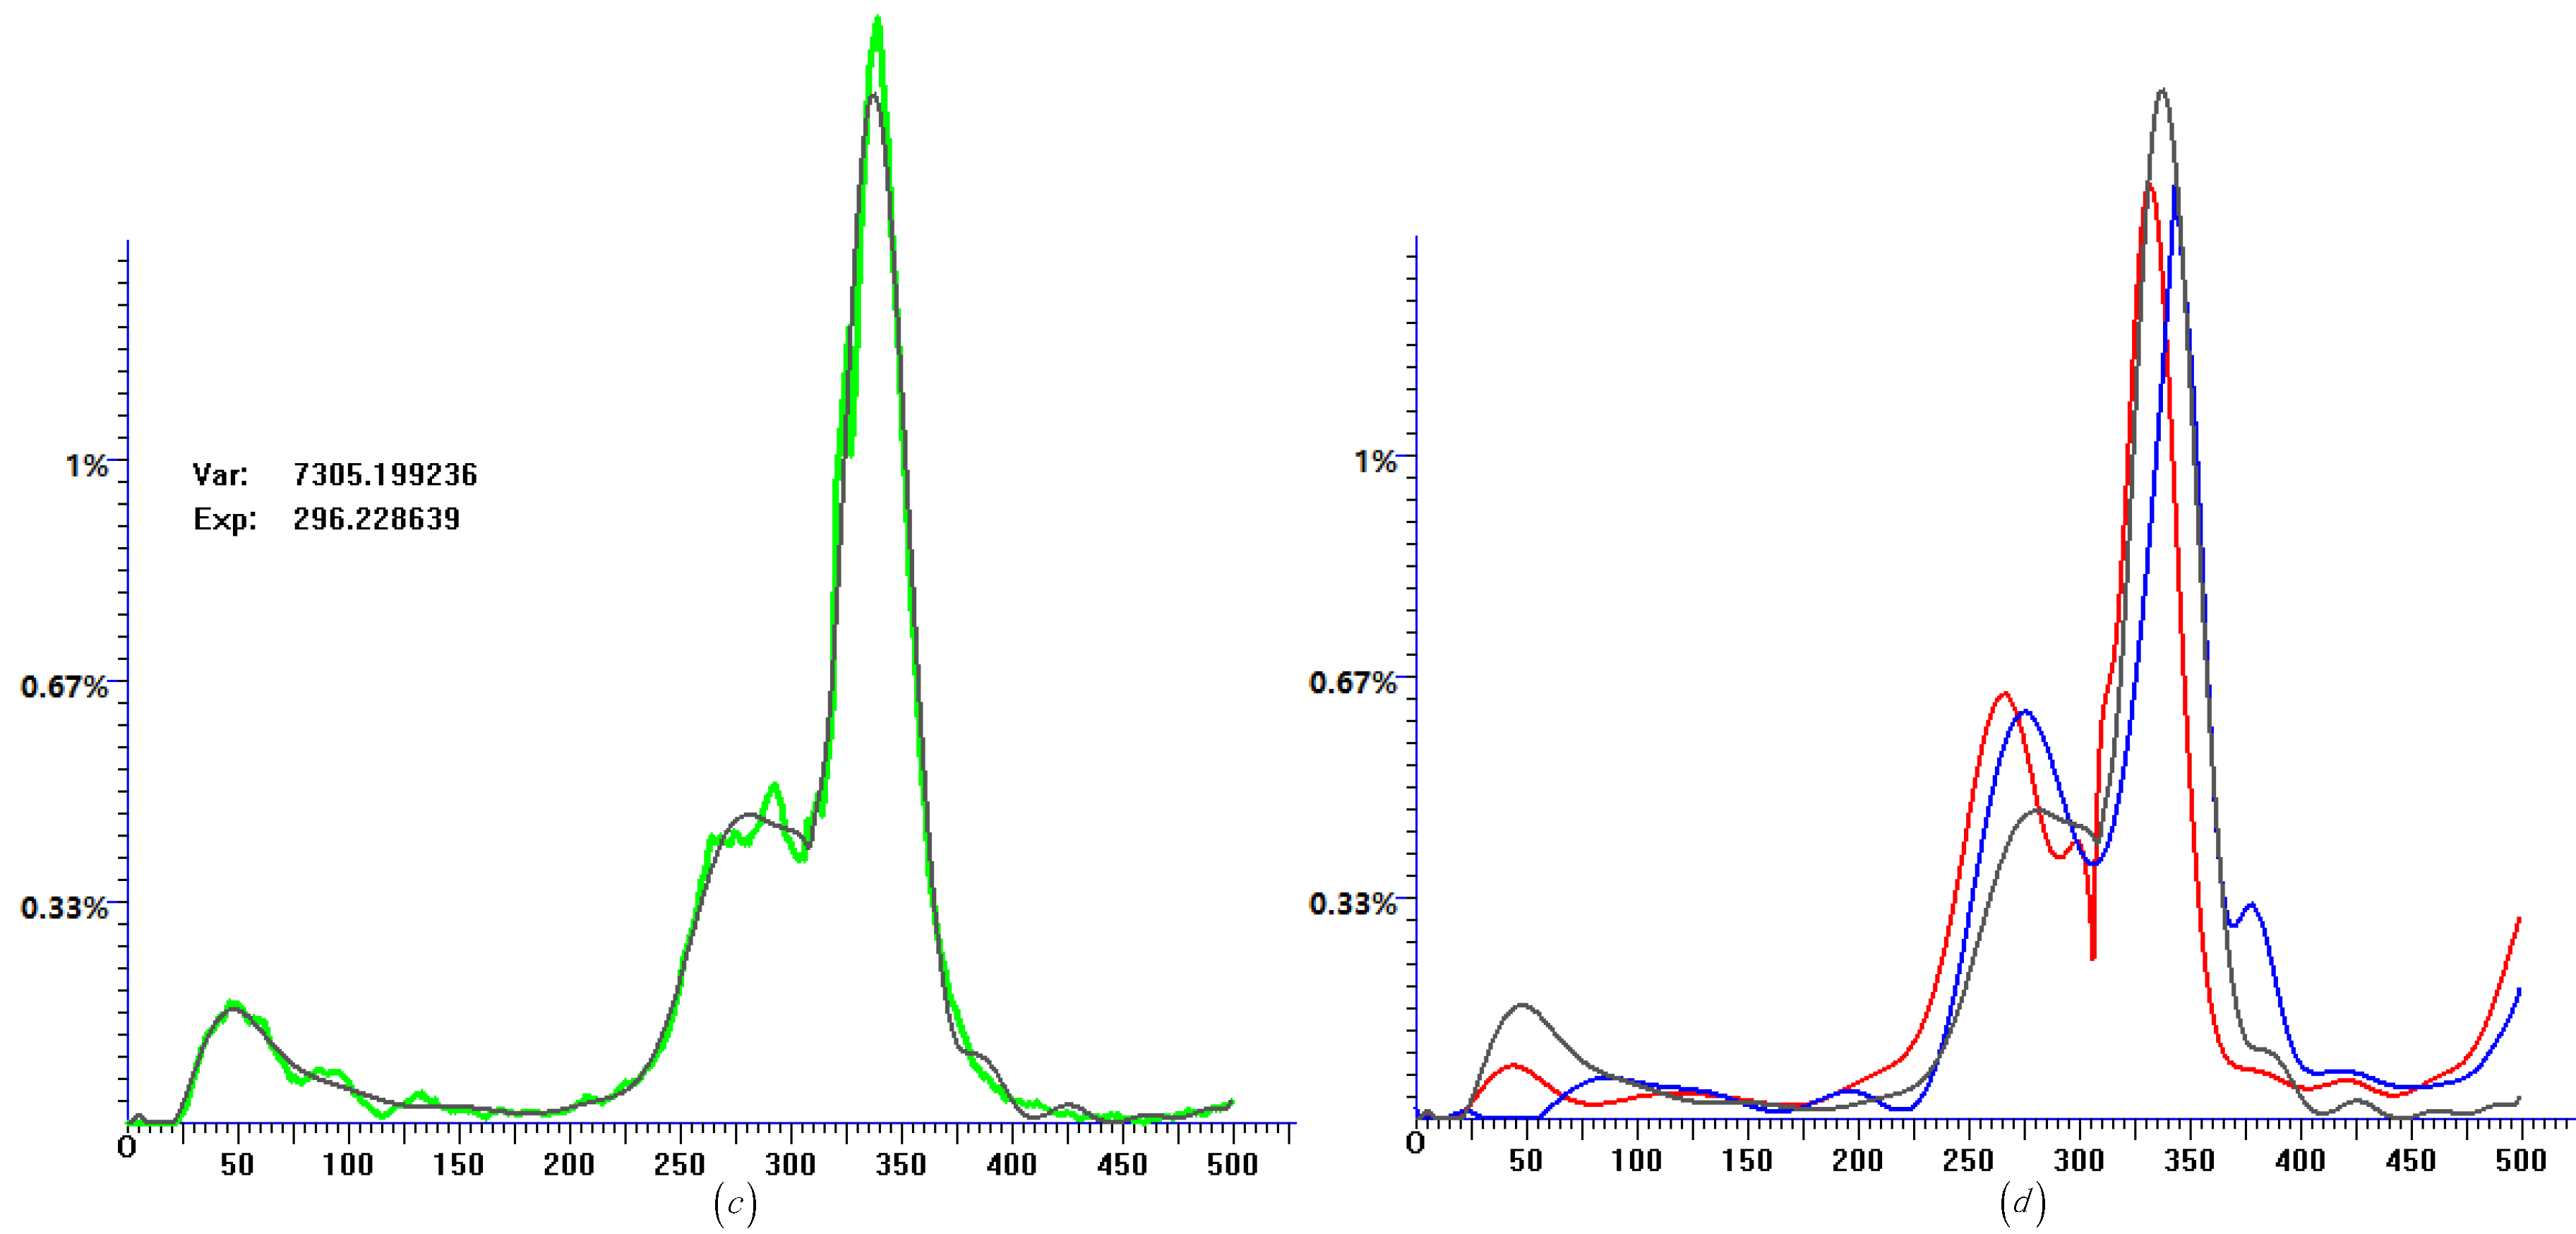
Figure 1.
Histogram data and quasi-distribution fitting of Austria. (a) Histogram data of daily confirmed cases and the corresponding quasi-distribution fitting. (b) Histogram data of daily recovery cases and the corresponding quasi-distribution fitting. (c) Histogram data of daily fatality cases and the corresponding quasi-distribution fitting. (d) Quasi-distribution fitting results of daily confirmed cases (red), daily recovery cases (blue), and daily fatality cases (black) show in the same coordinate.
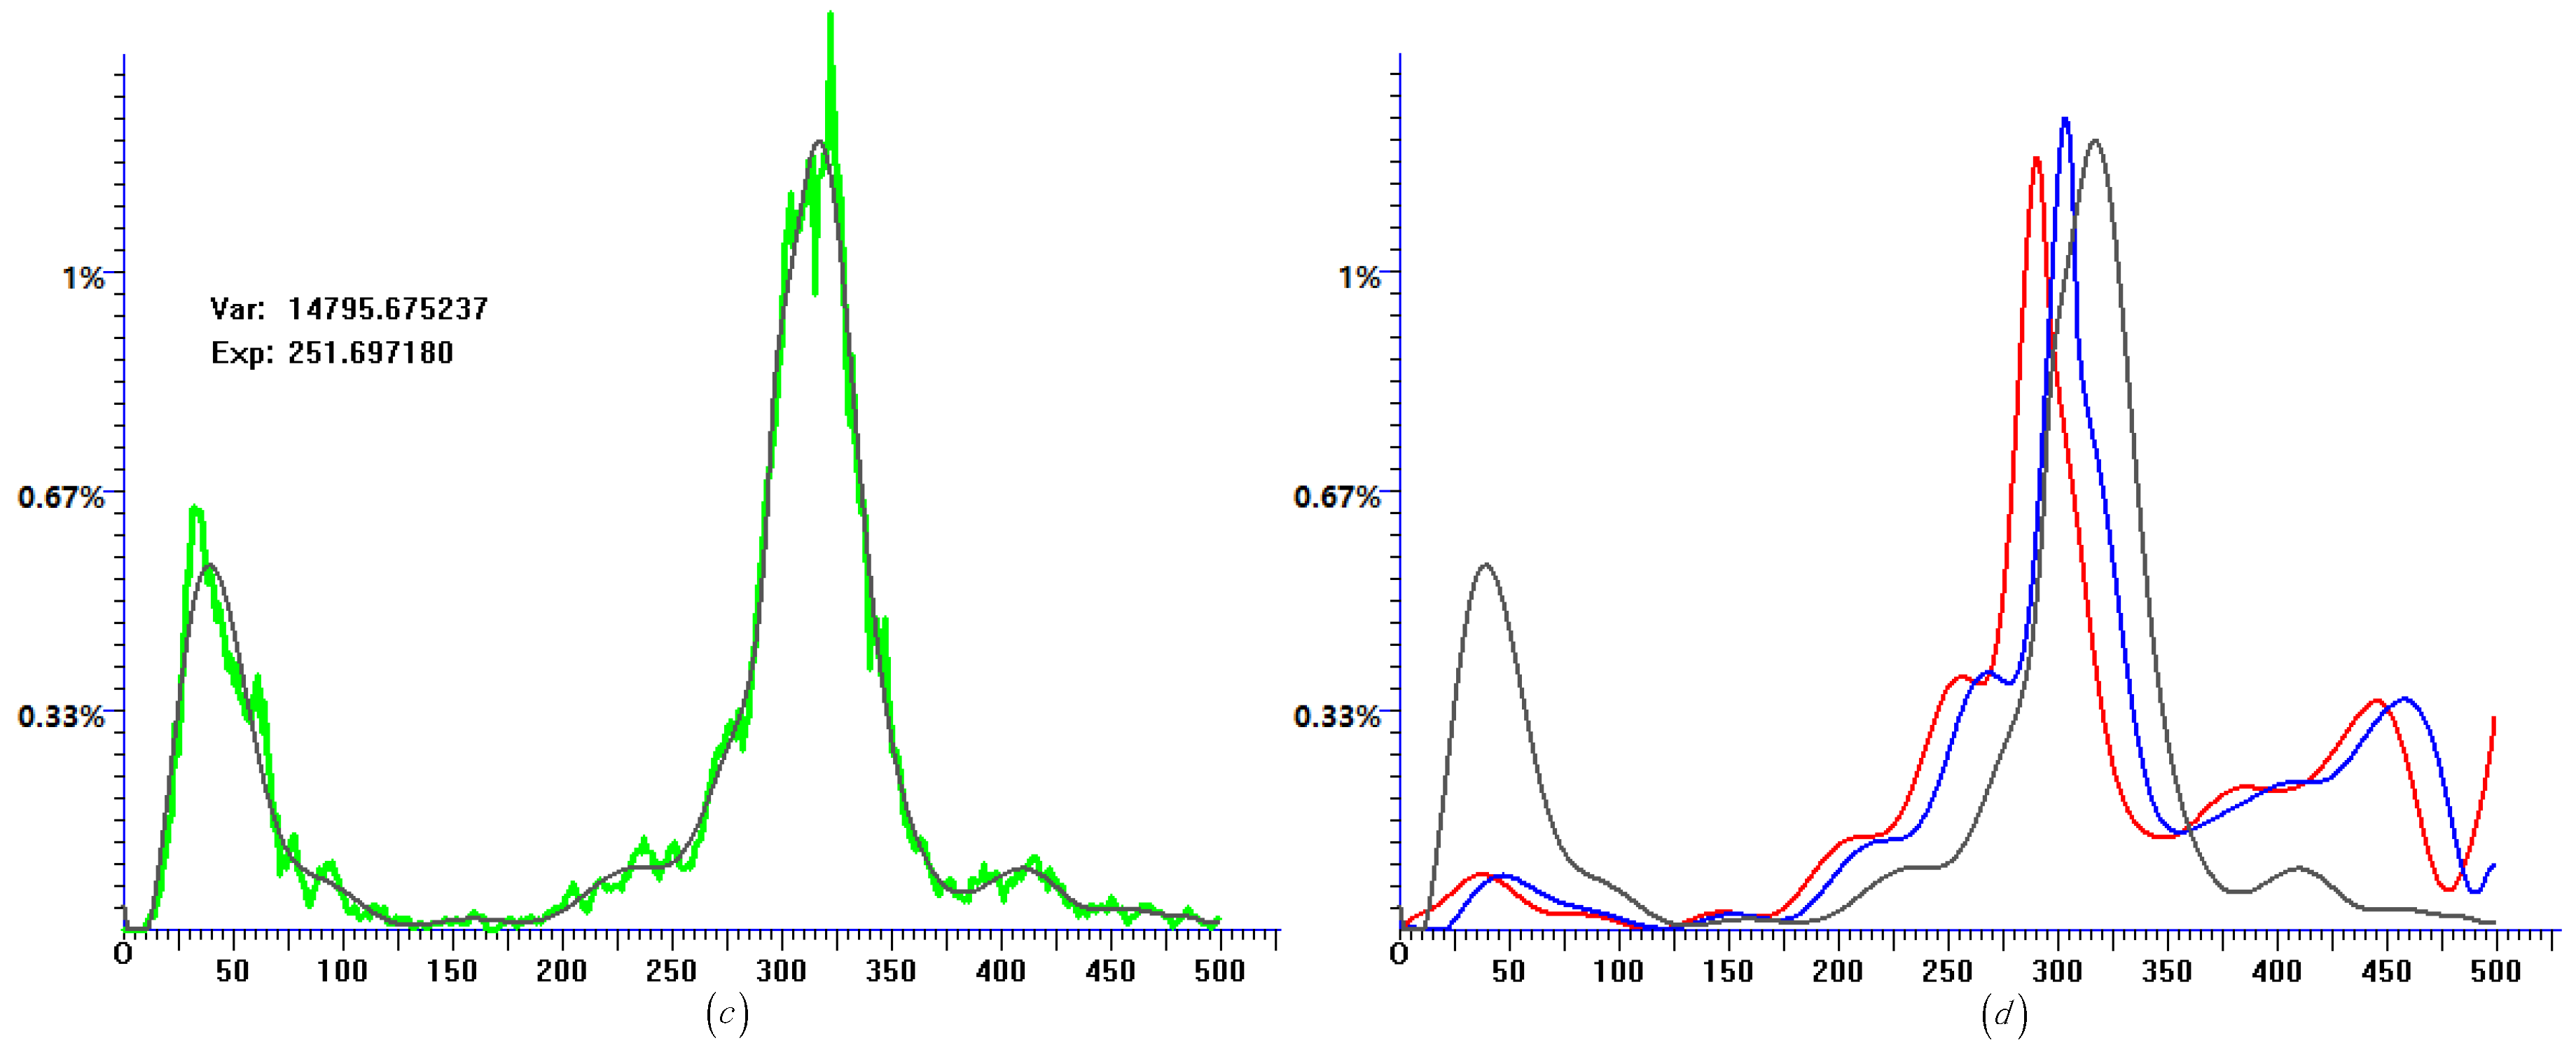
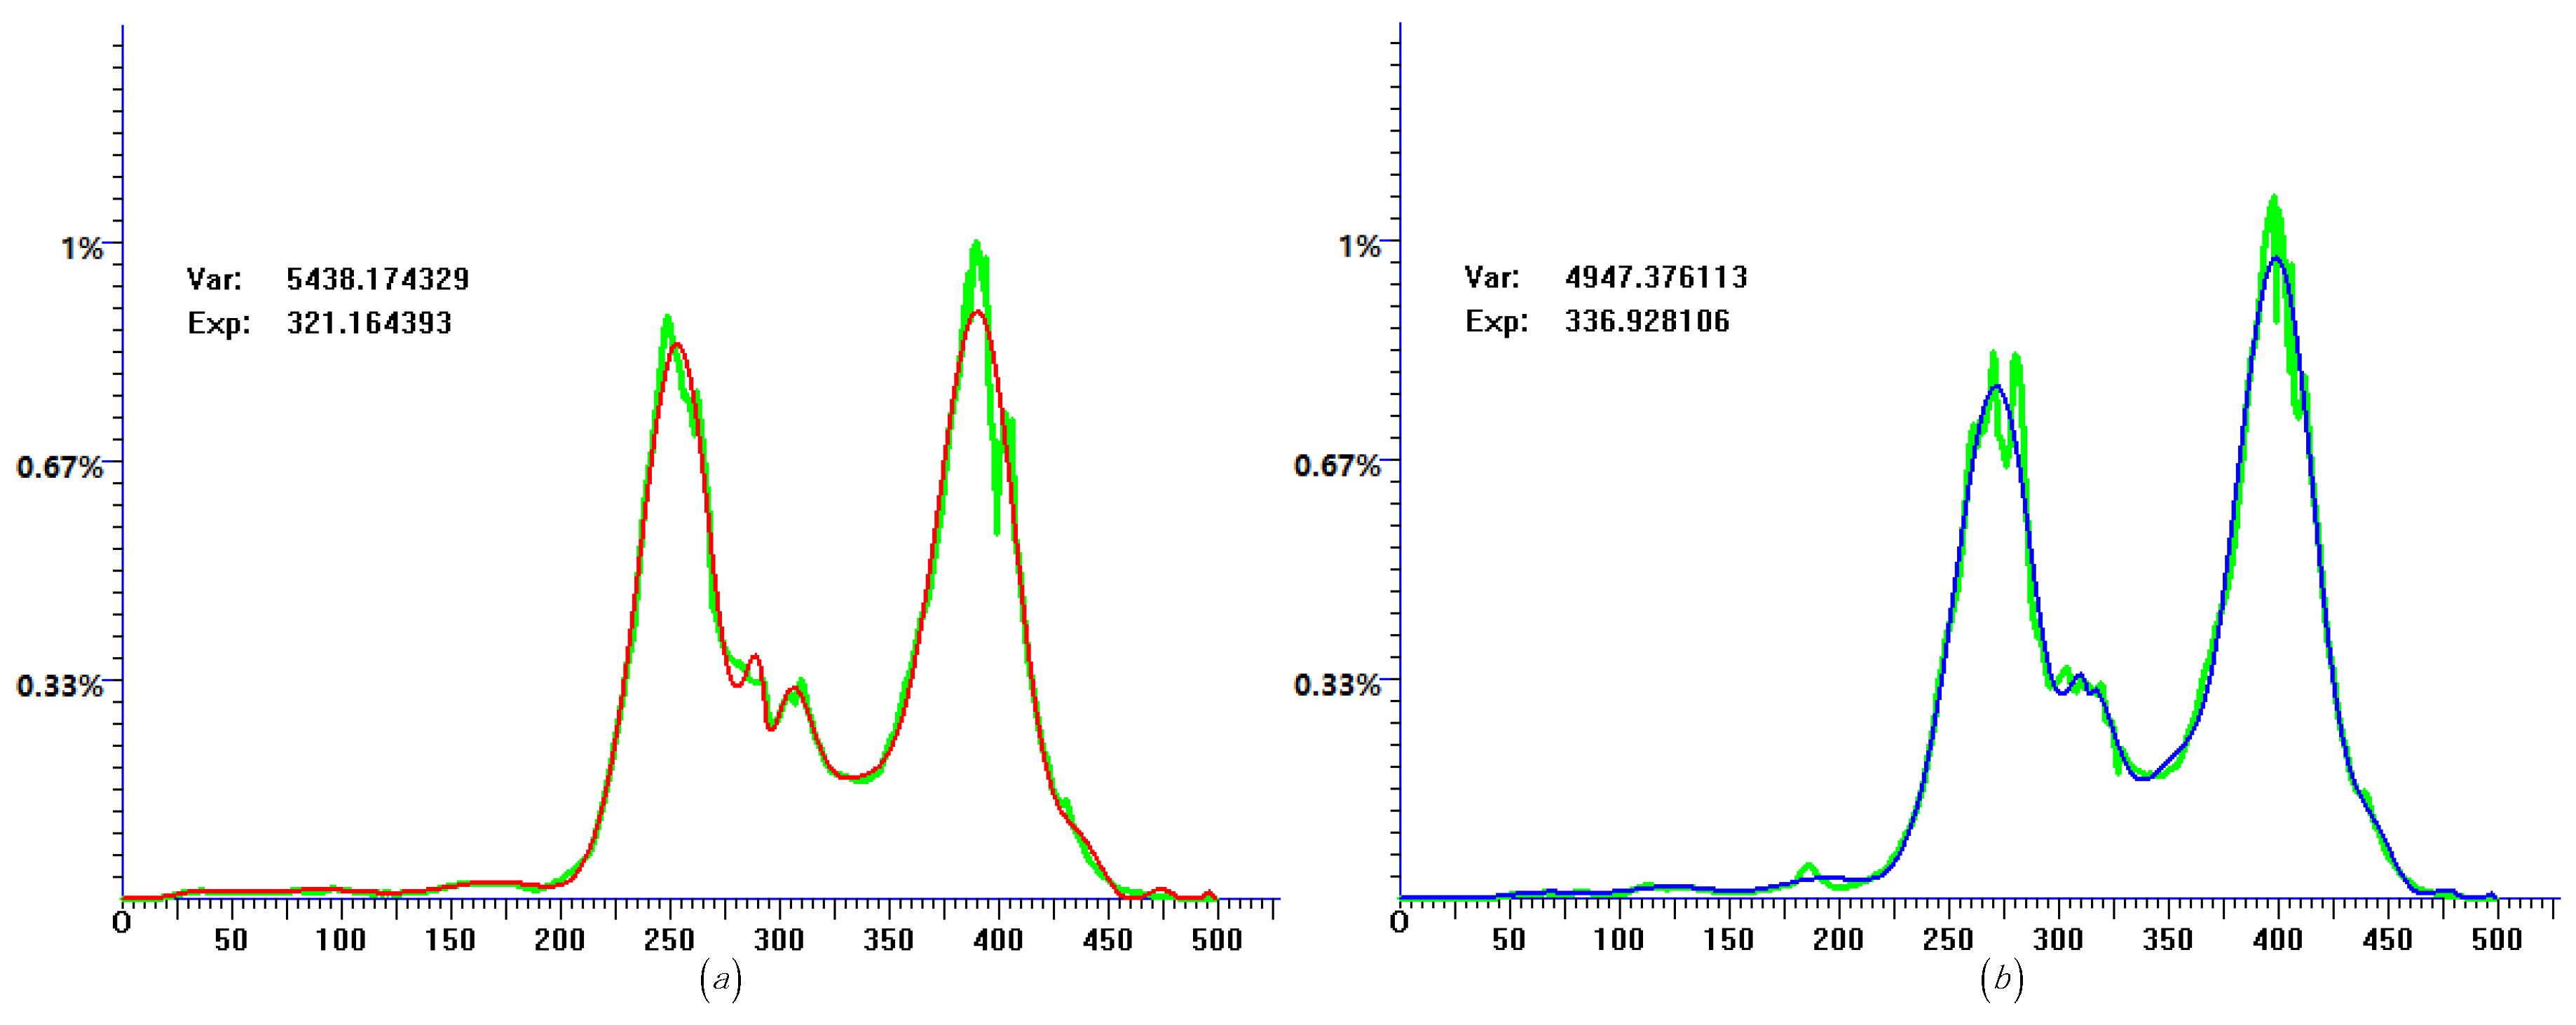
Figure 2.
Histogram data and quasi-distribution fitting of Brazil. (a) Histogram data of daily confirmed cases and the corresponding quasi-distribution fitting. (b) Histogram data of daily recovery cases and the corresponding quasi-distribution fitting. (c) Histogram data of daily fatality cases and the corresponding quasi-distribution fitting. (d) Quasi-distribution fitting results of daily confirmed cases (red), daily recovery cases (blue), and daily fatality cases (black) show in the same coordinate.
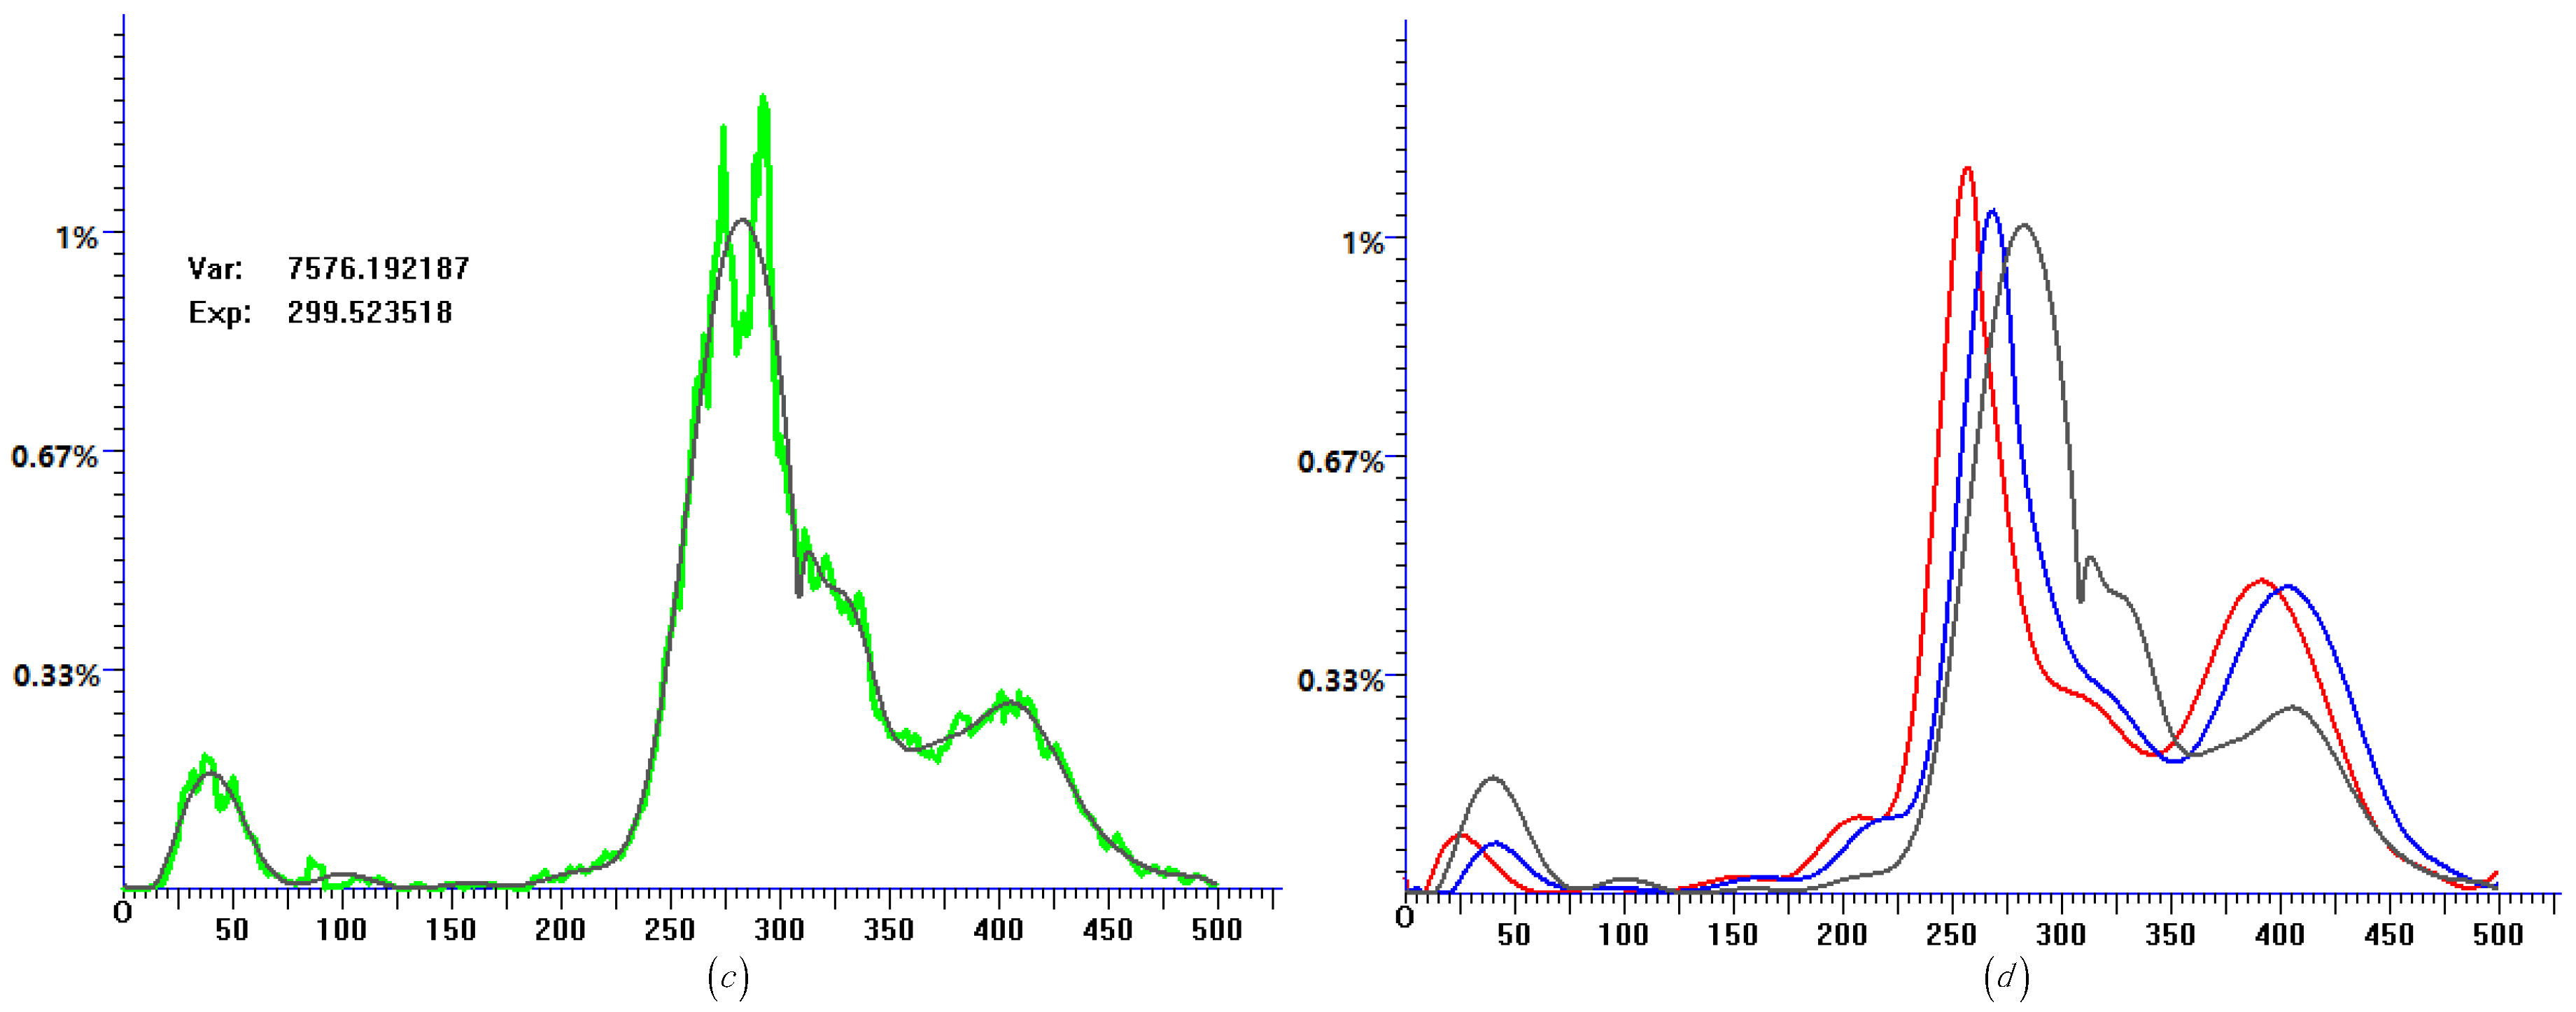
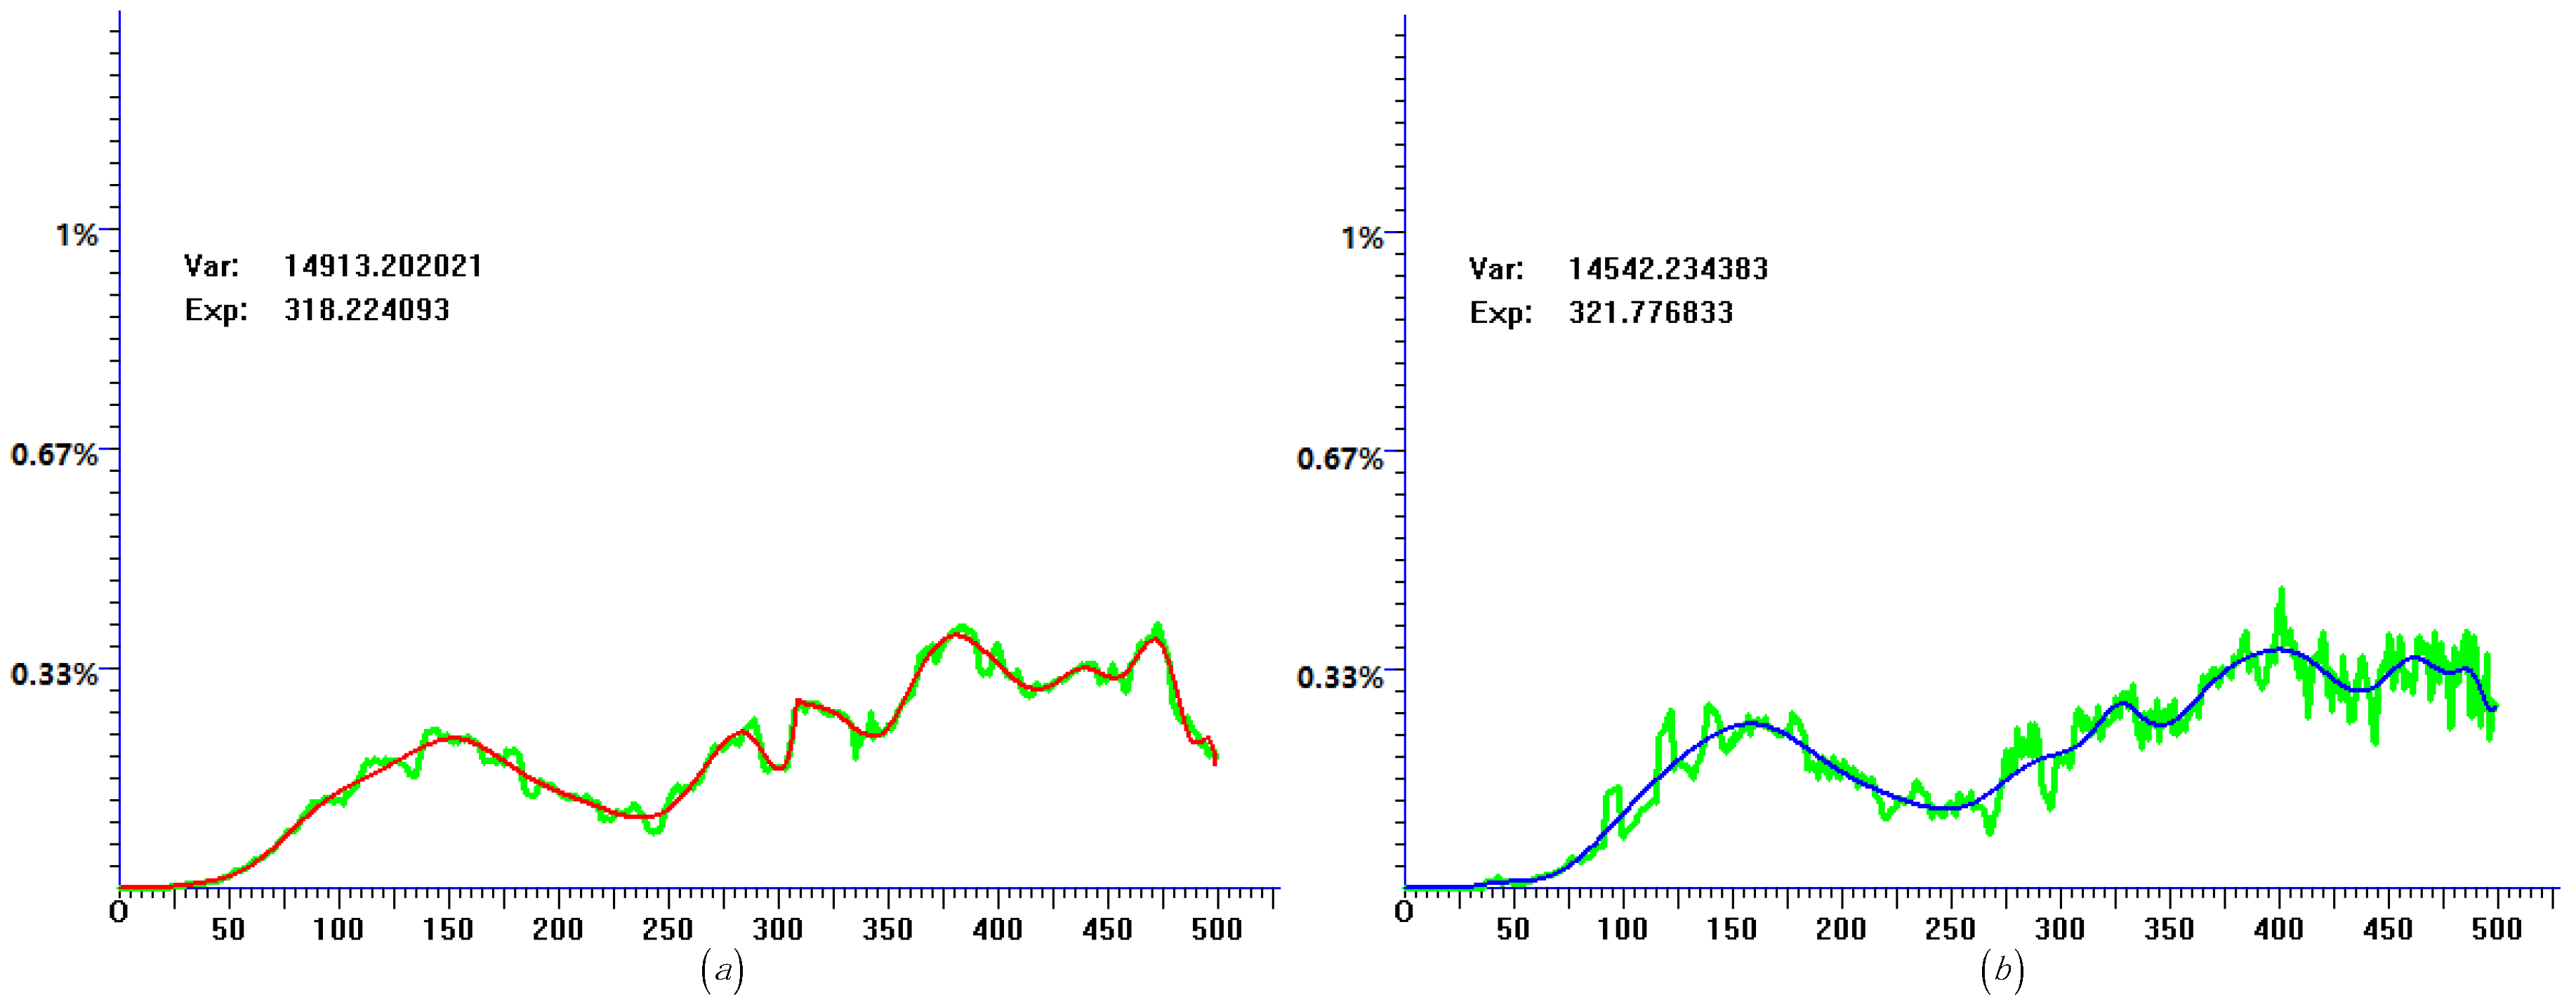
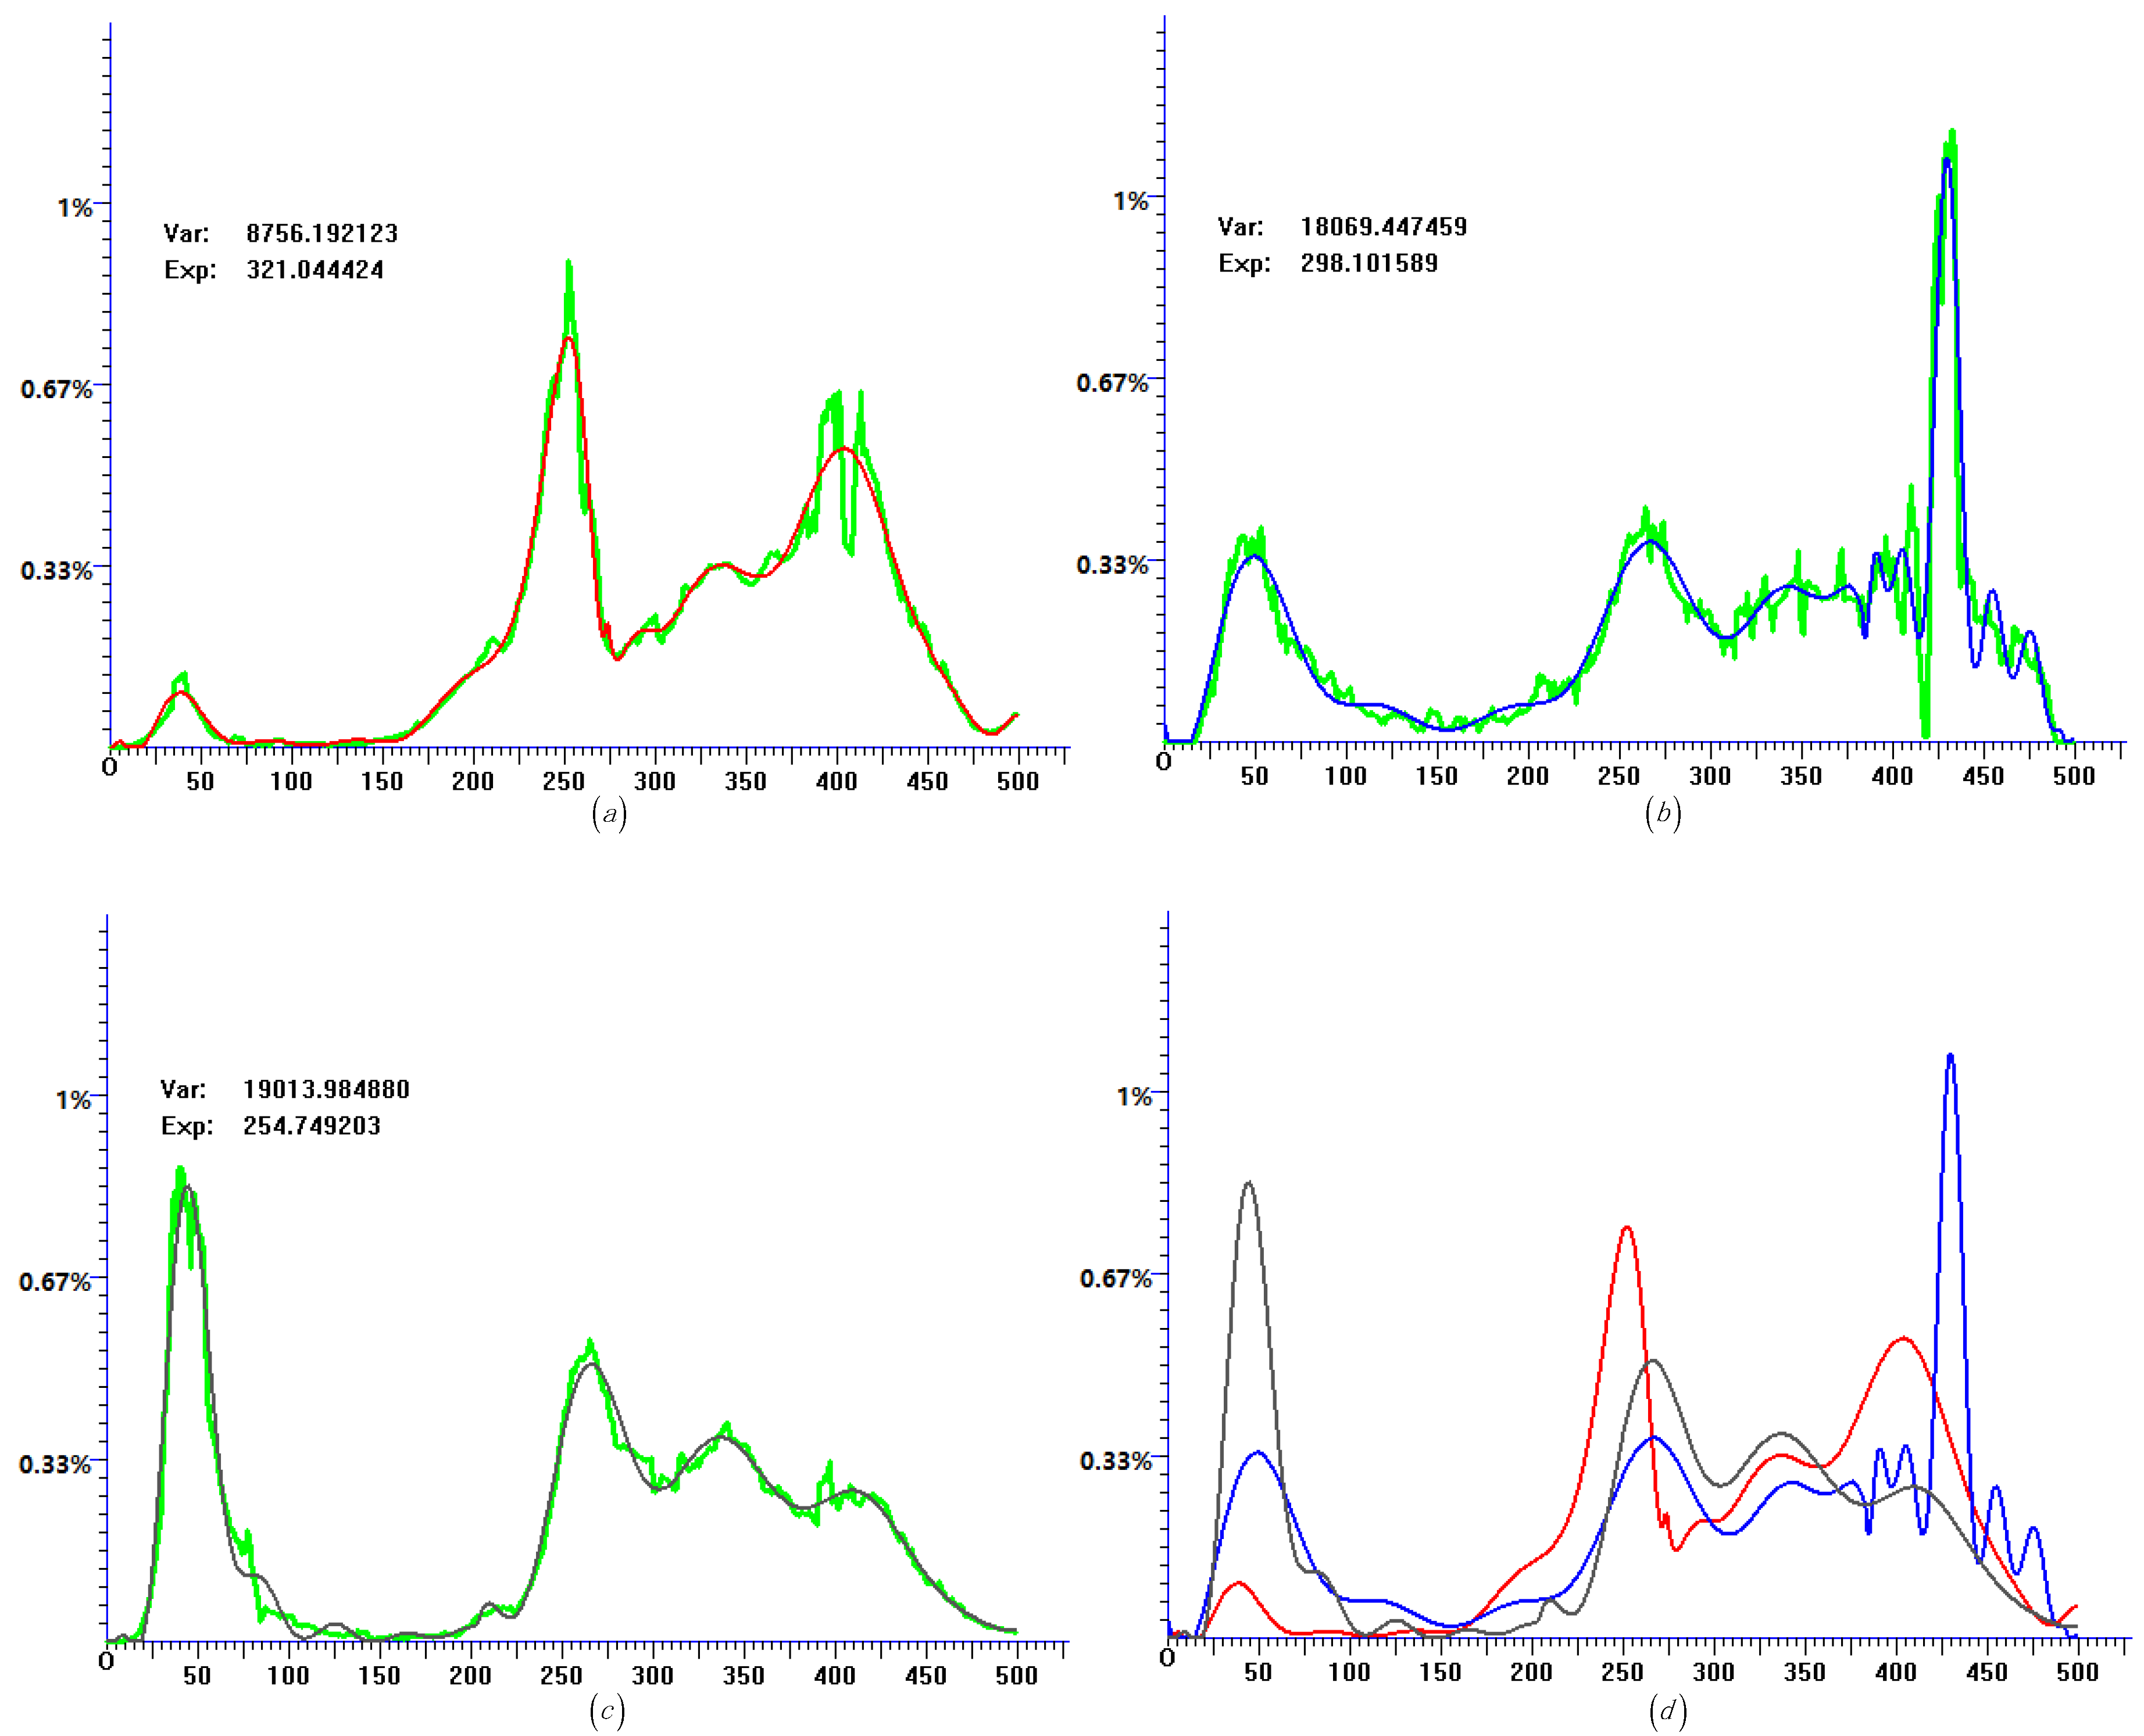
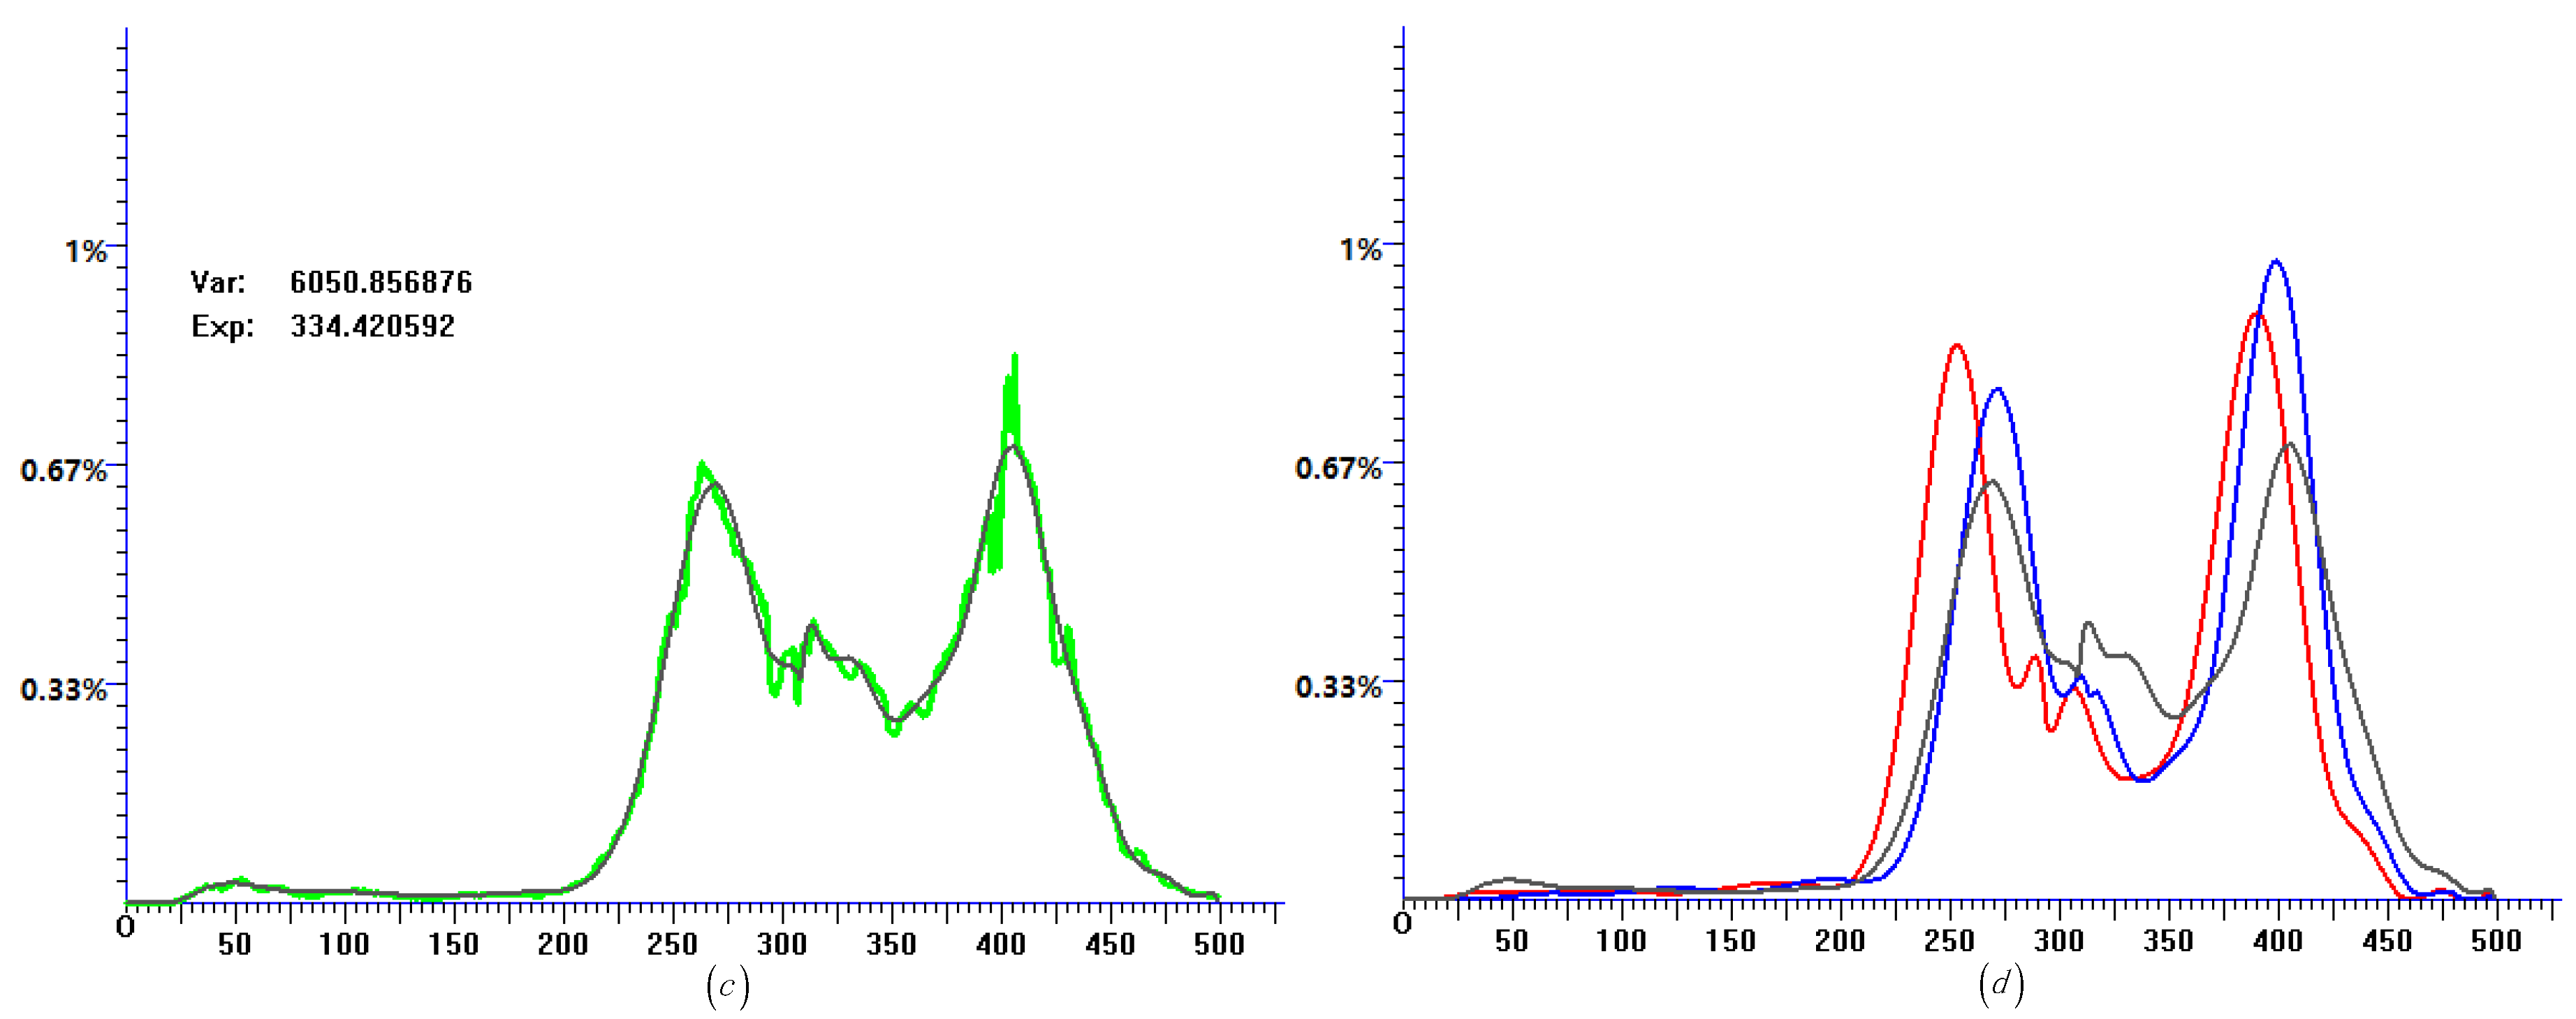
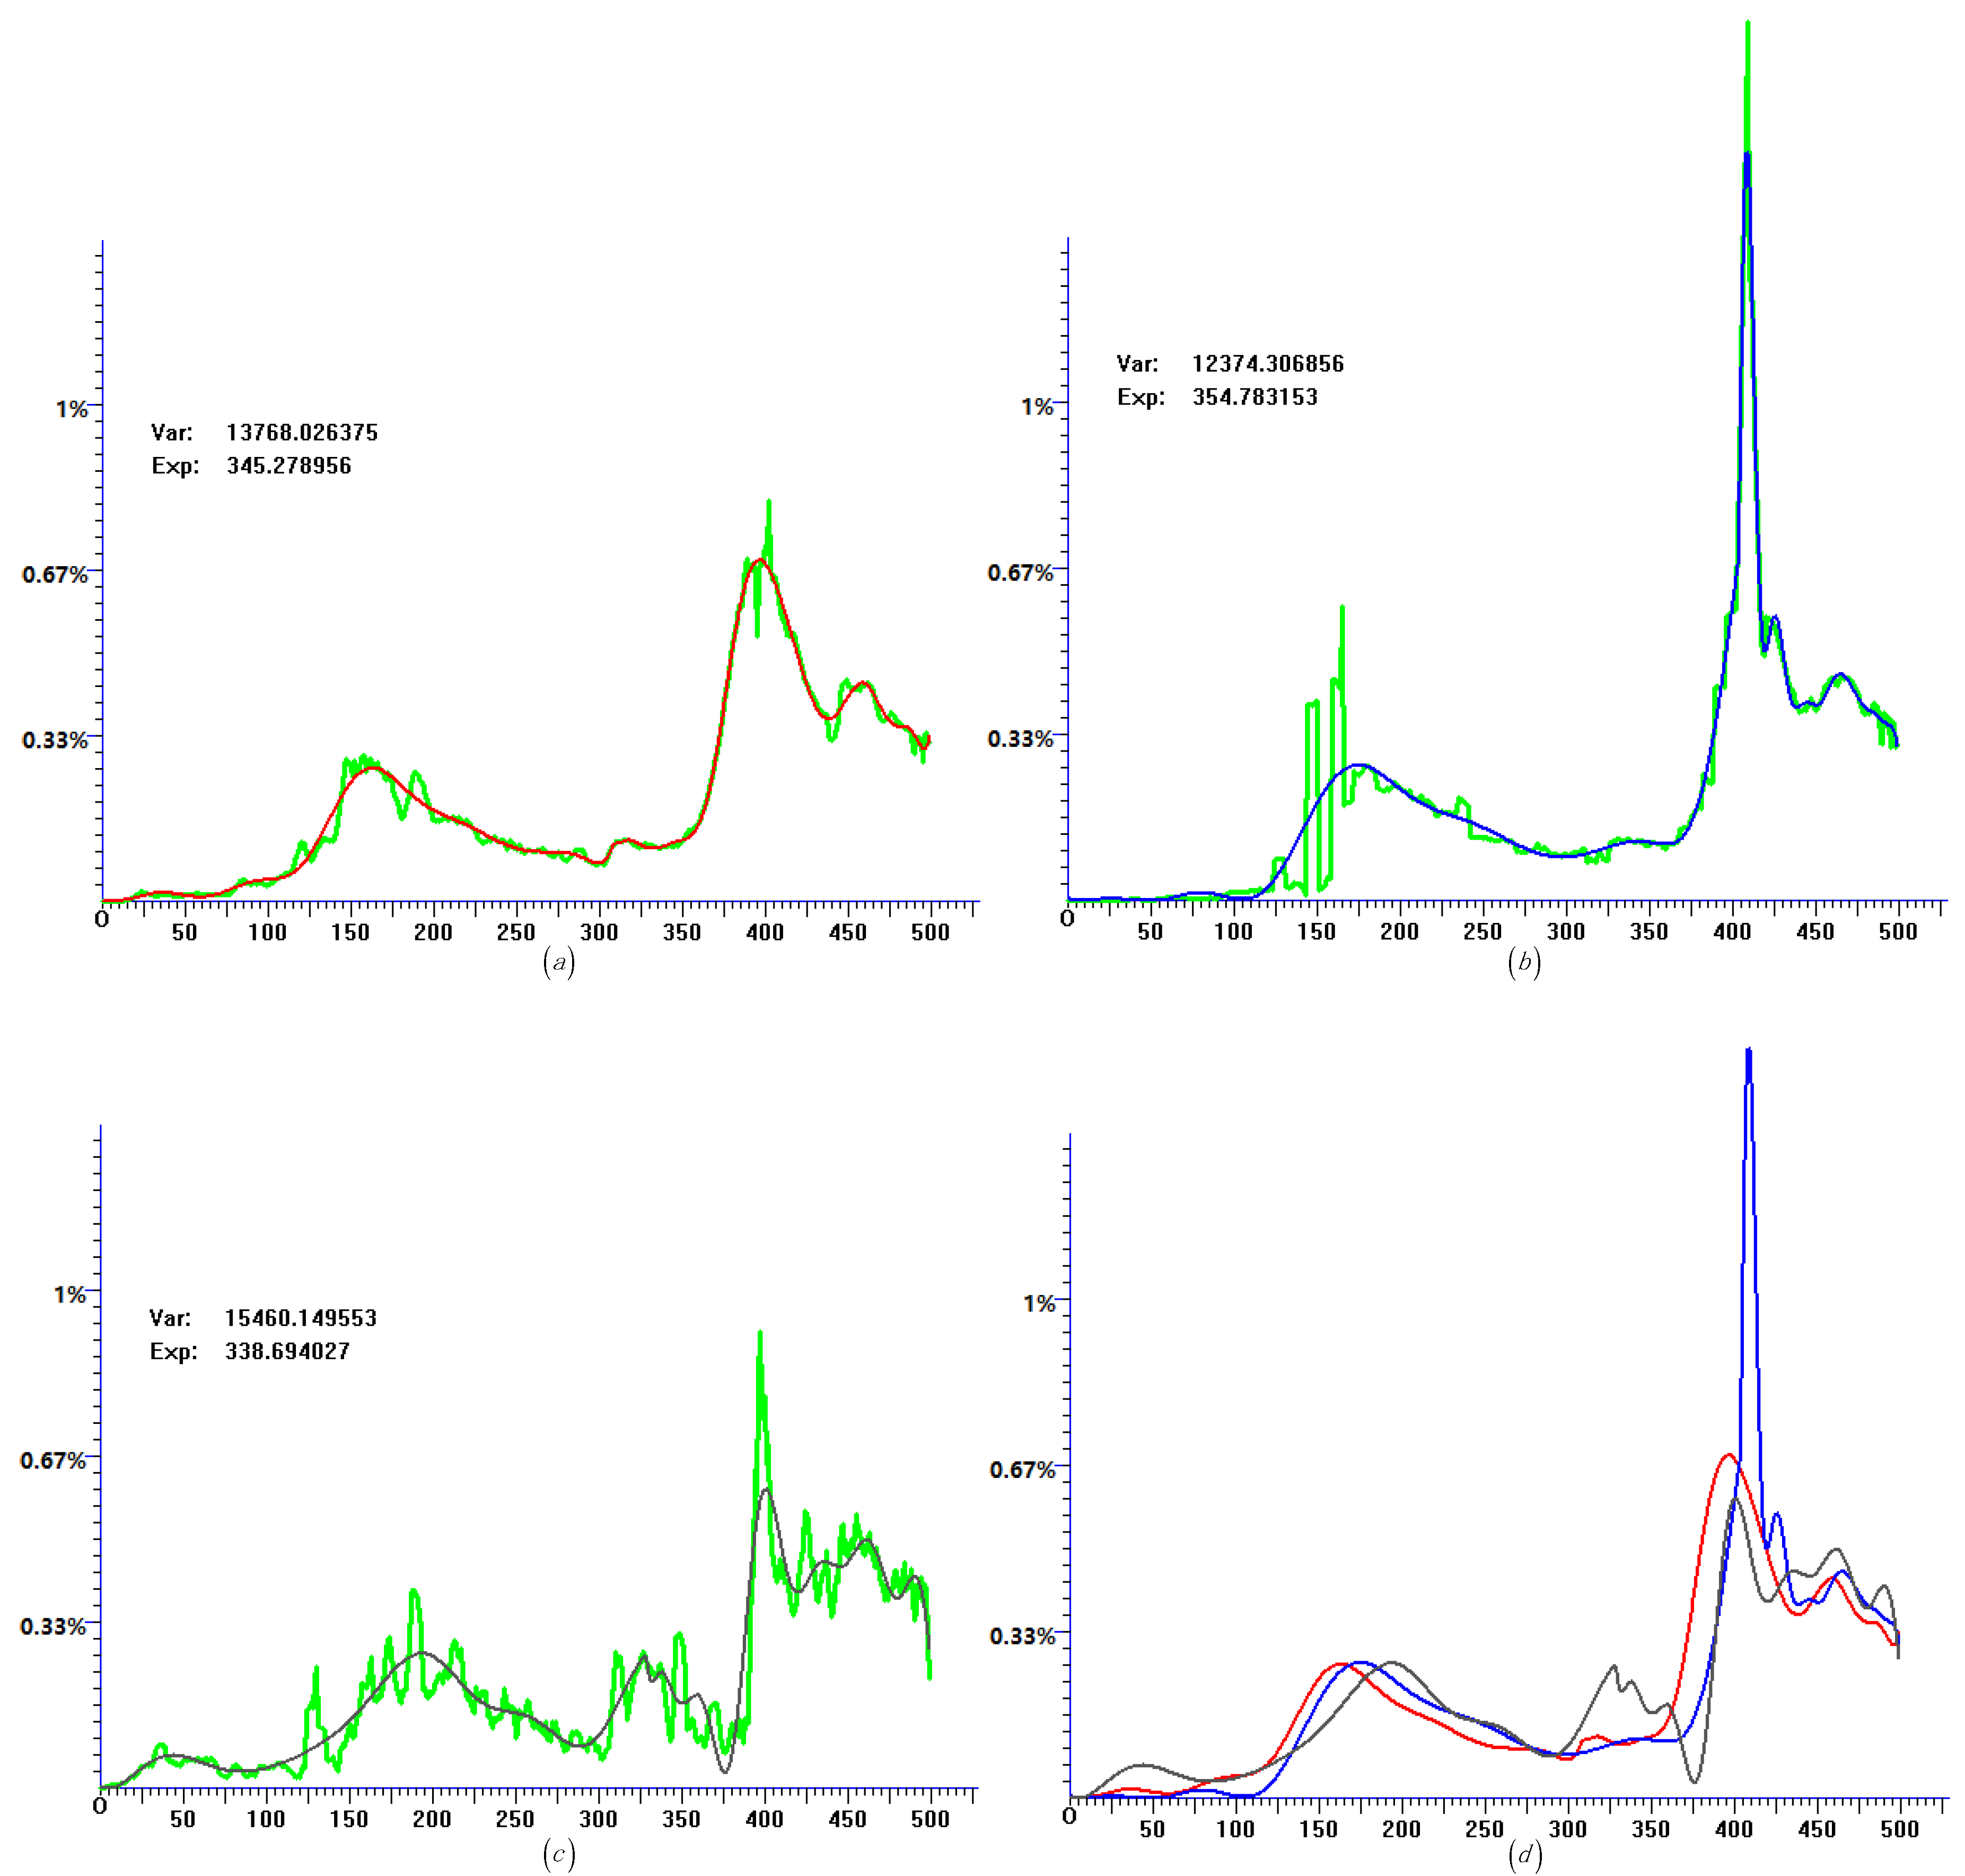
Figure 3.
Histogram data and quasi-distribution fitting of Canada. (a) Histogram data of daily confirmed cases and the corresponding quasi-distribution fitting. (b) Histogram data of daily recovery cases and the corresponding quasi-distribution fitting. (c) Histogram data of daily fatality cases and the corresponding quasi-distribution fitting. (d) Quasi-distribution fitting results of daily confirmed cases (red), daily recovery cases (blue), and daily fatality cases (black) show in the same coordinate.
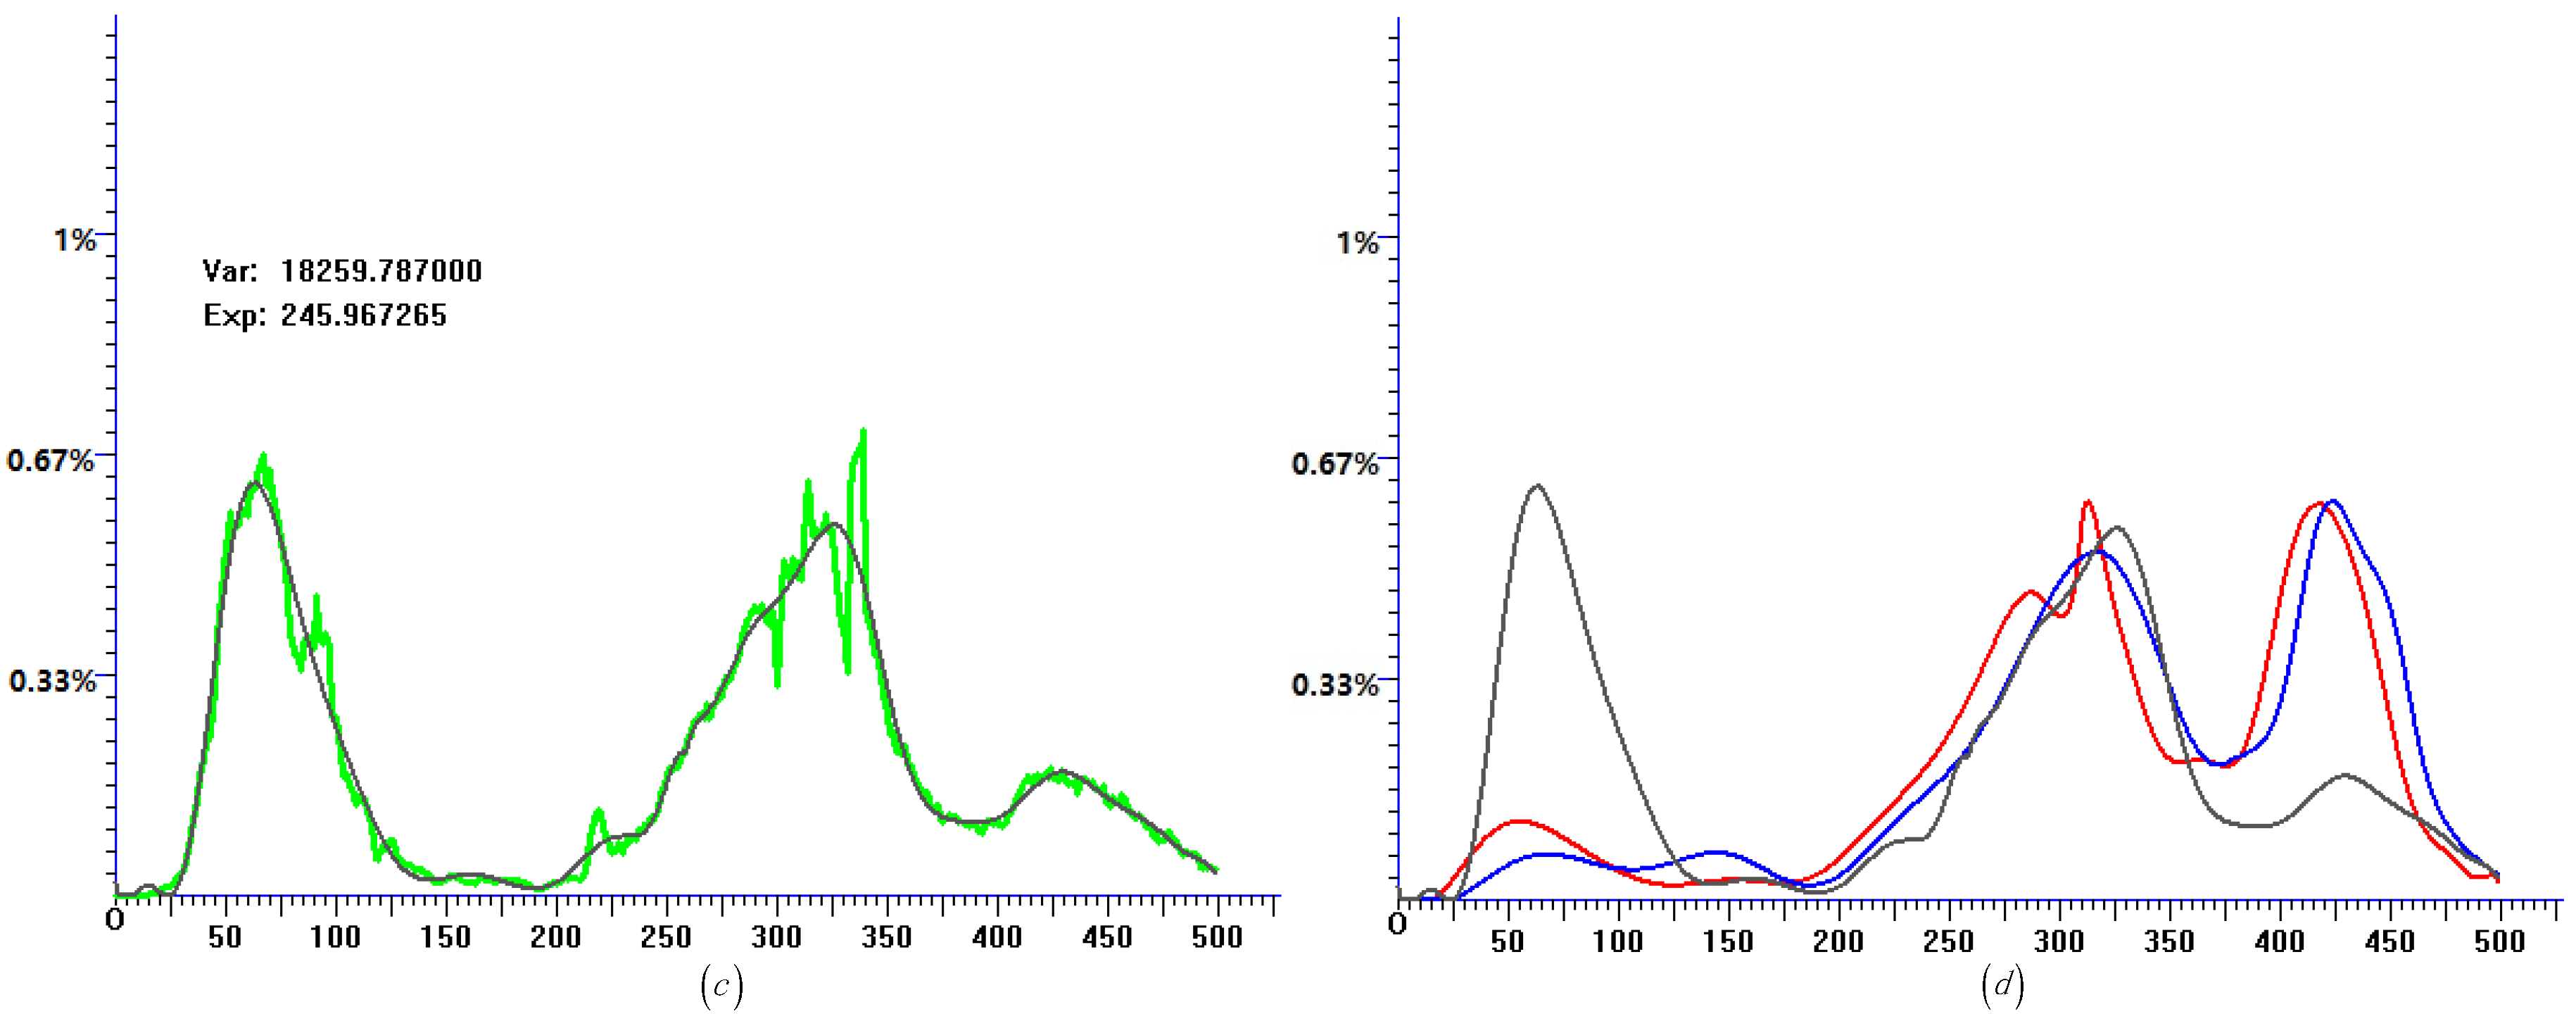
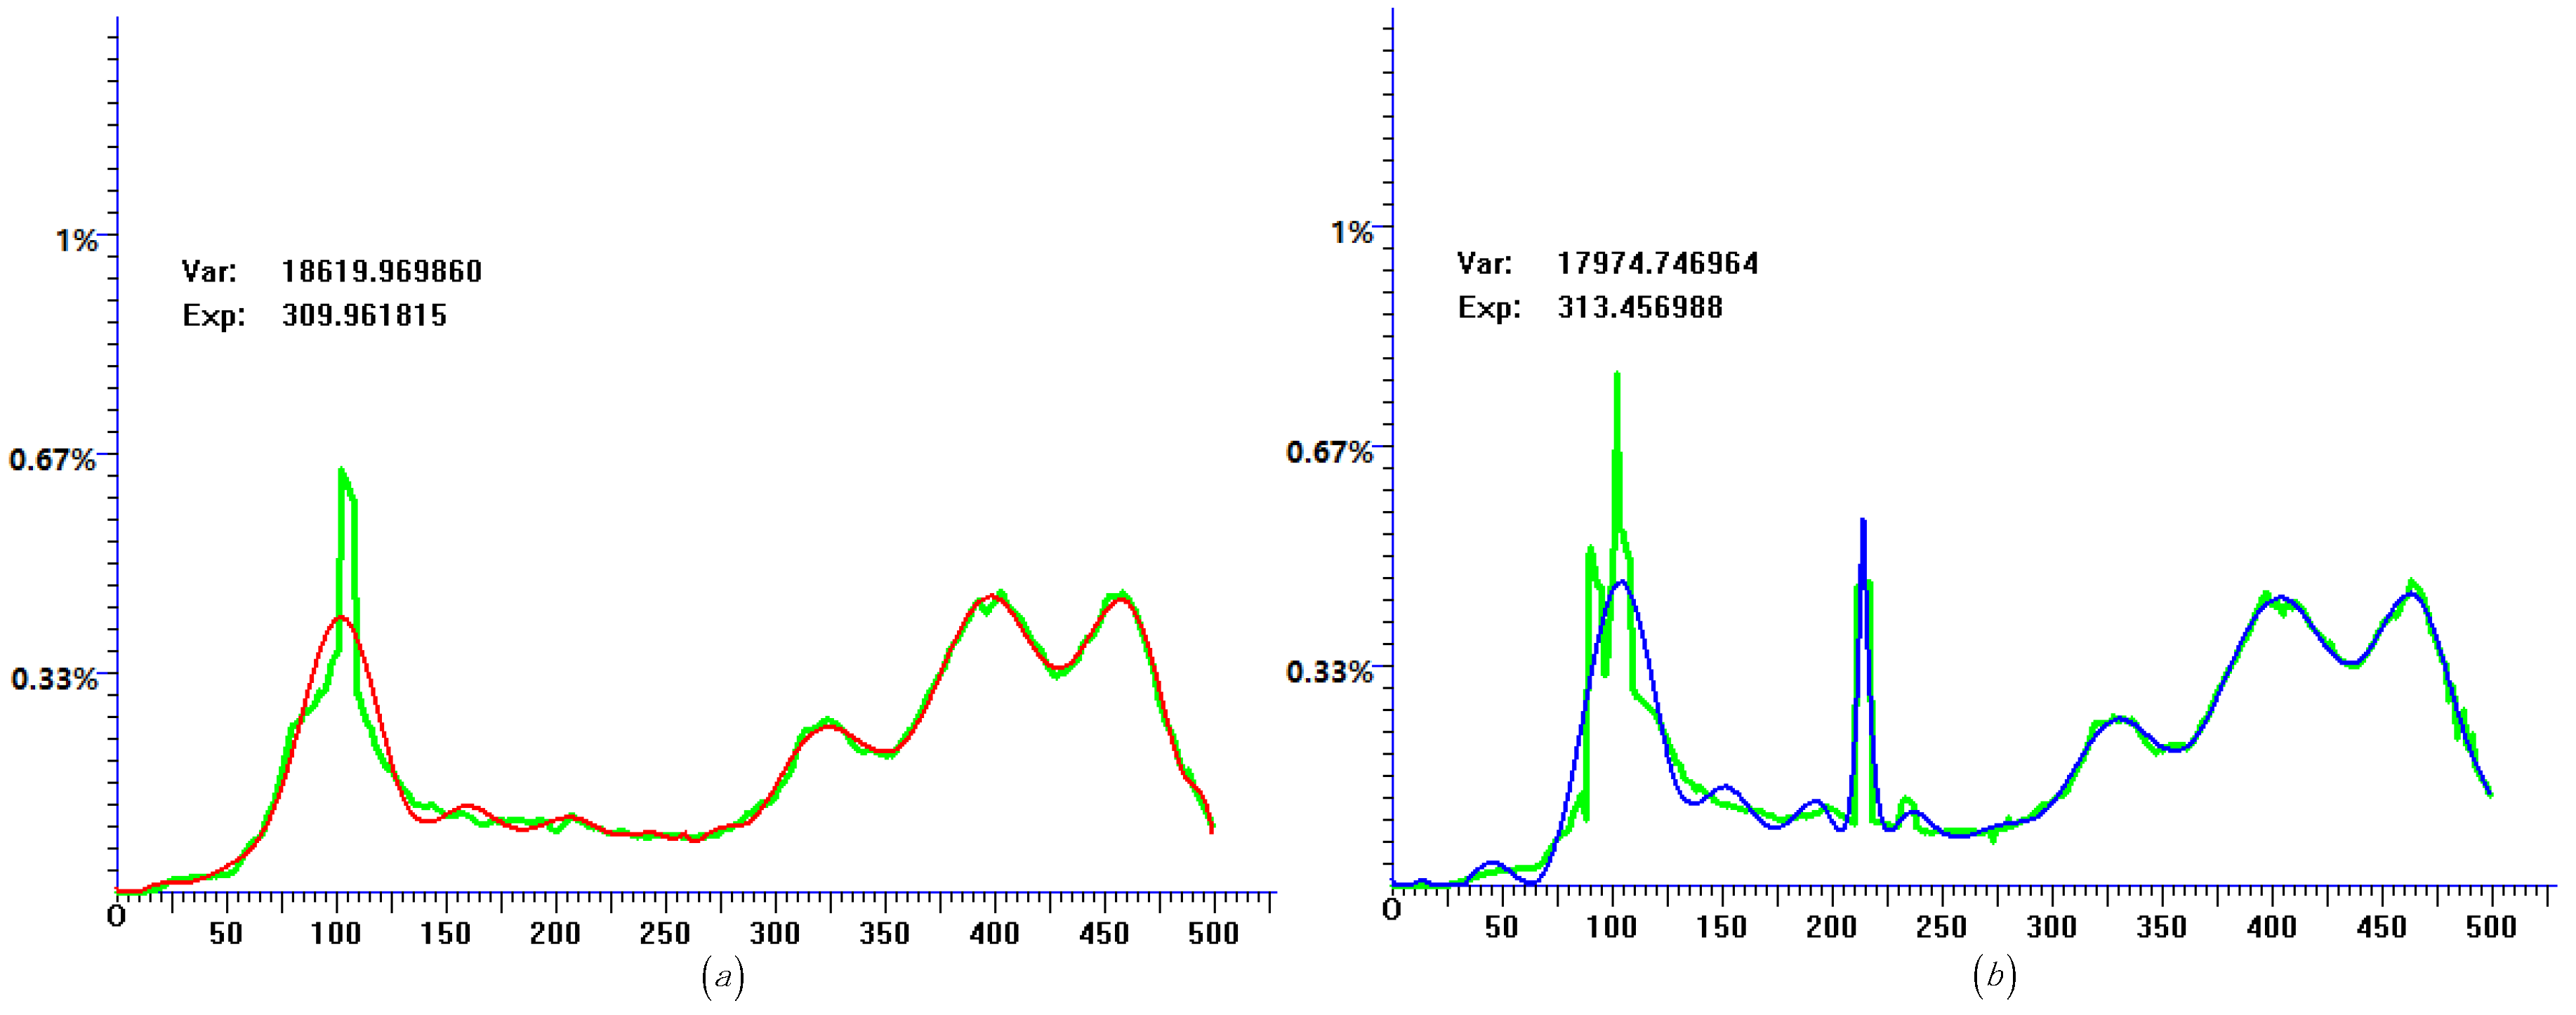
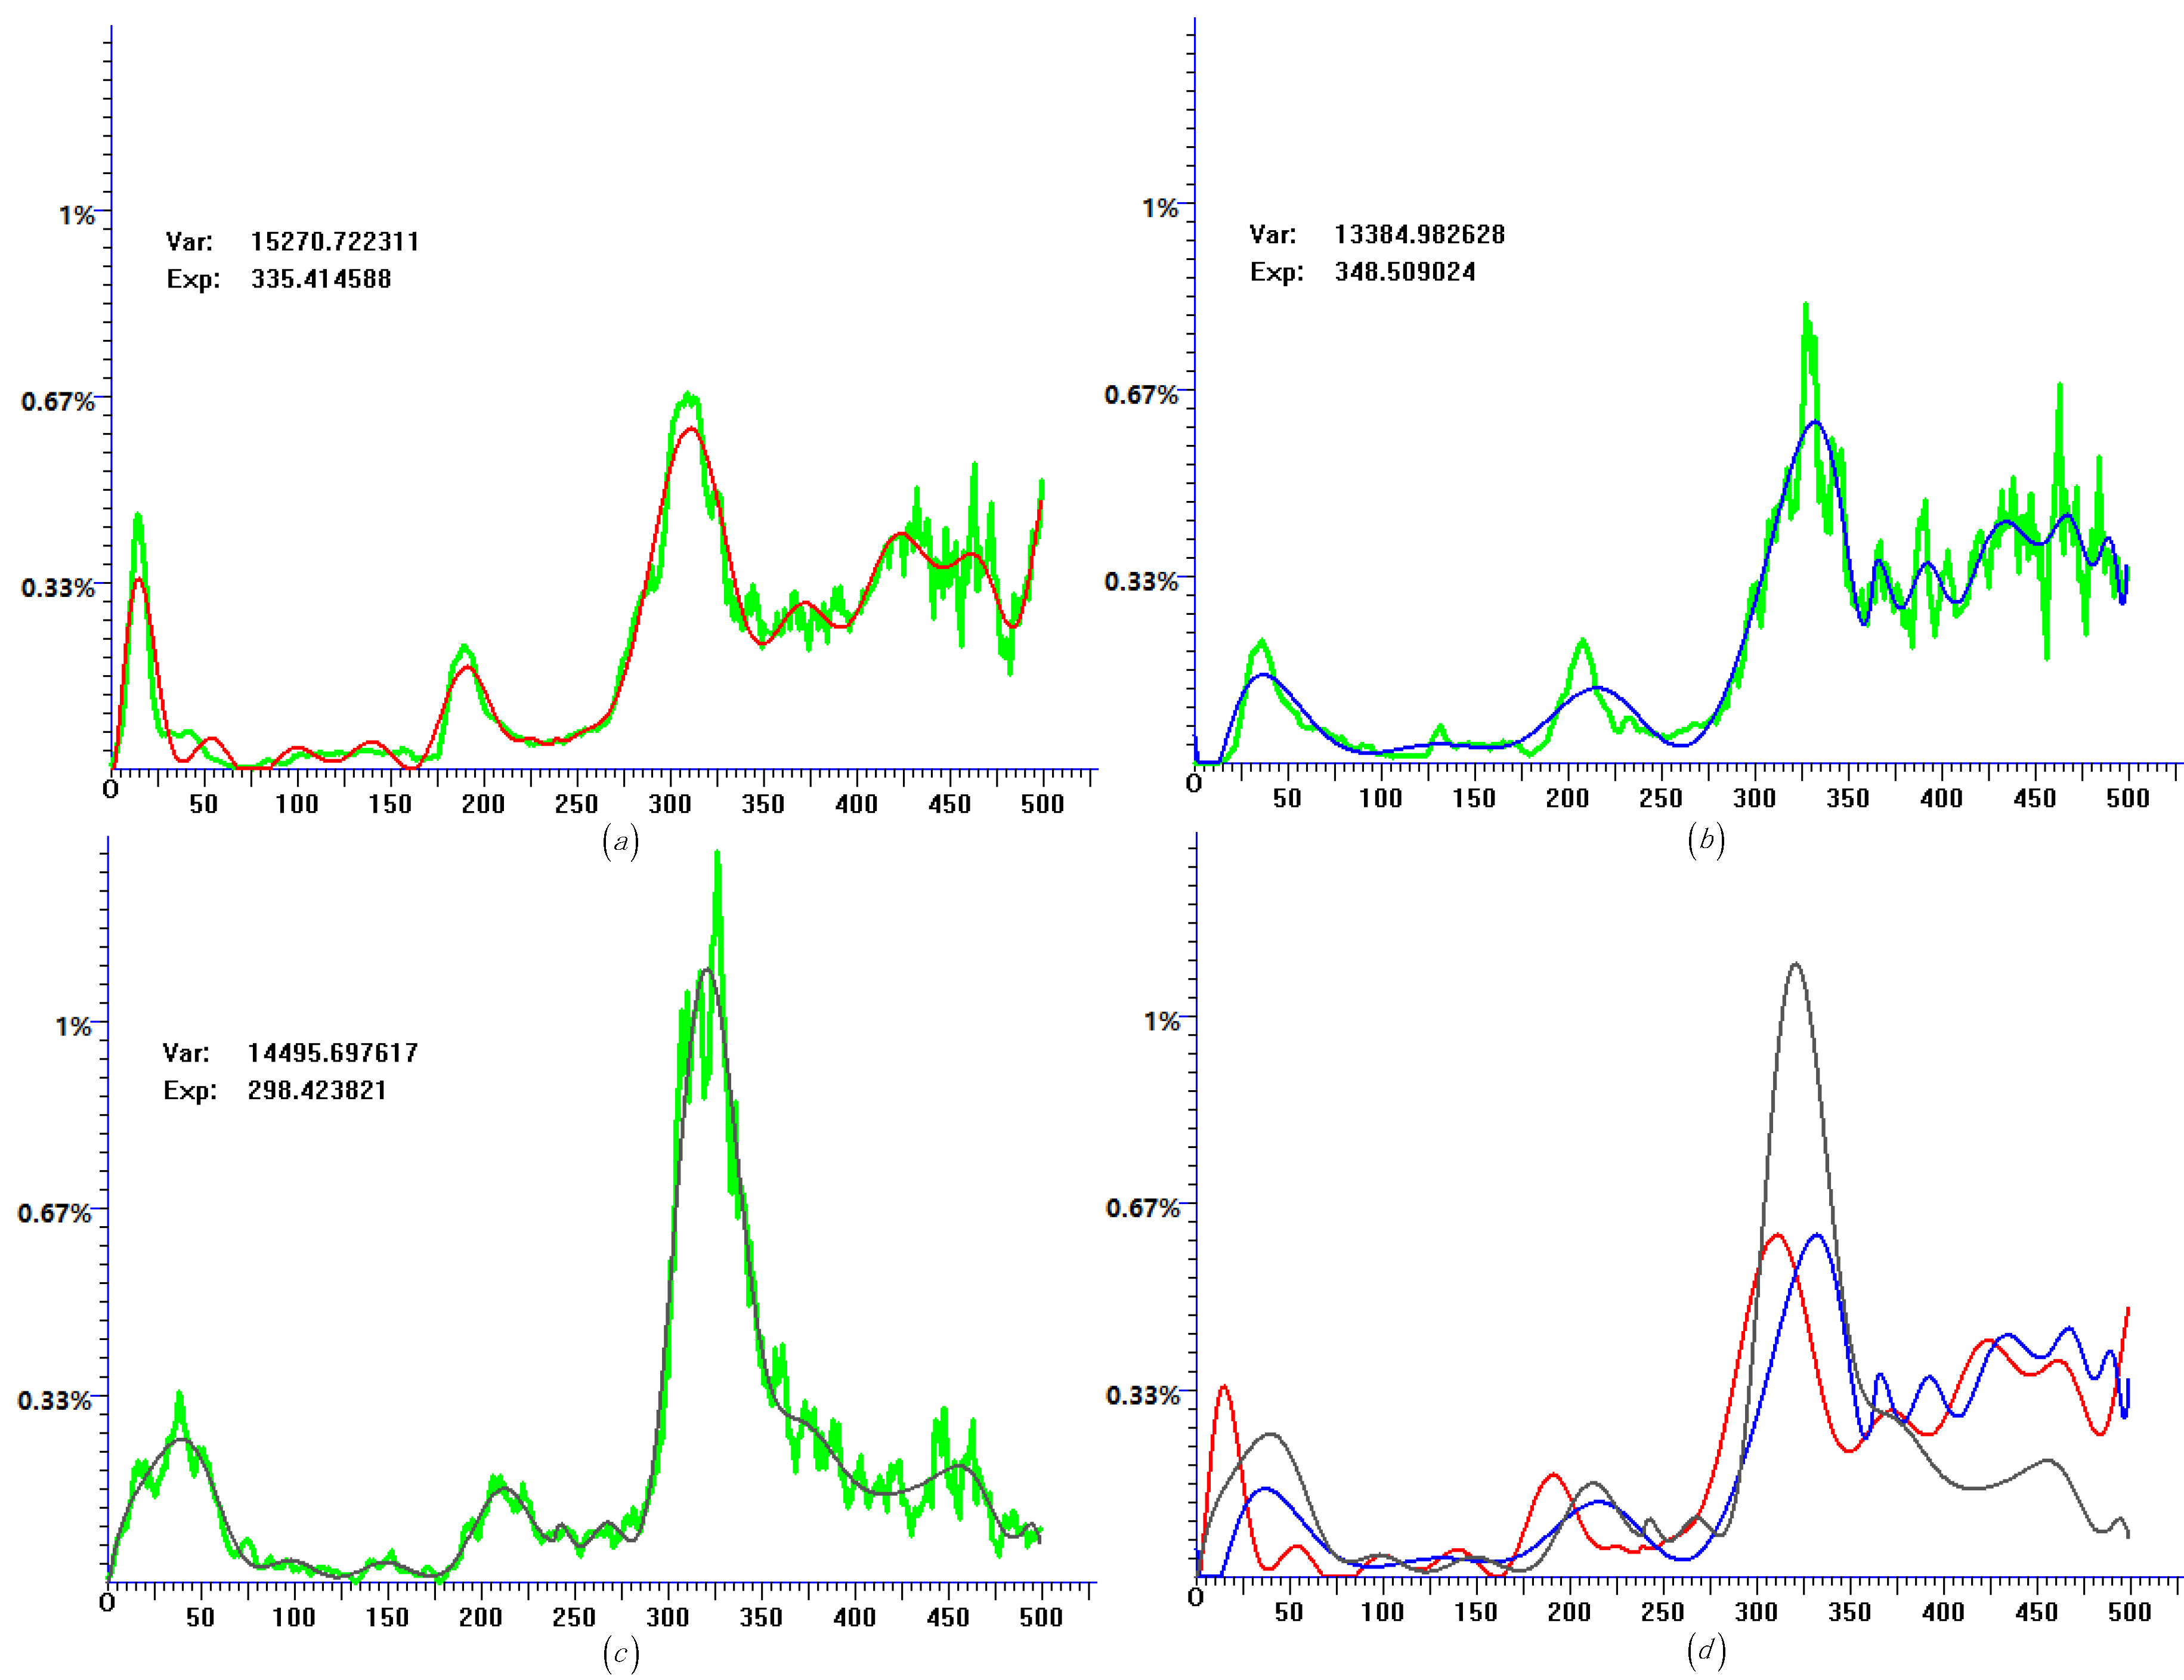
Figure 4.
Histogram data and quasi-distribution fitting of Chile. (a) Histogram data of daily confirmed cases and the corresponding quasi-distribution fitting. (b) Histogram data of daily recovery cases and the corresponding quasi-distribution fitting. (c) Histogram data of daily fatality cases and the corresponding quasi-distribution fitting. (d) Quasi-distribution fitting results of daily confirmed cases (red), daily recovery cases (blue), and daily fatality cases (black) show in the same coordinate.
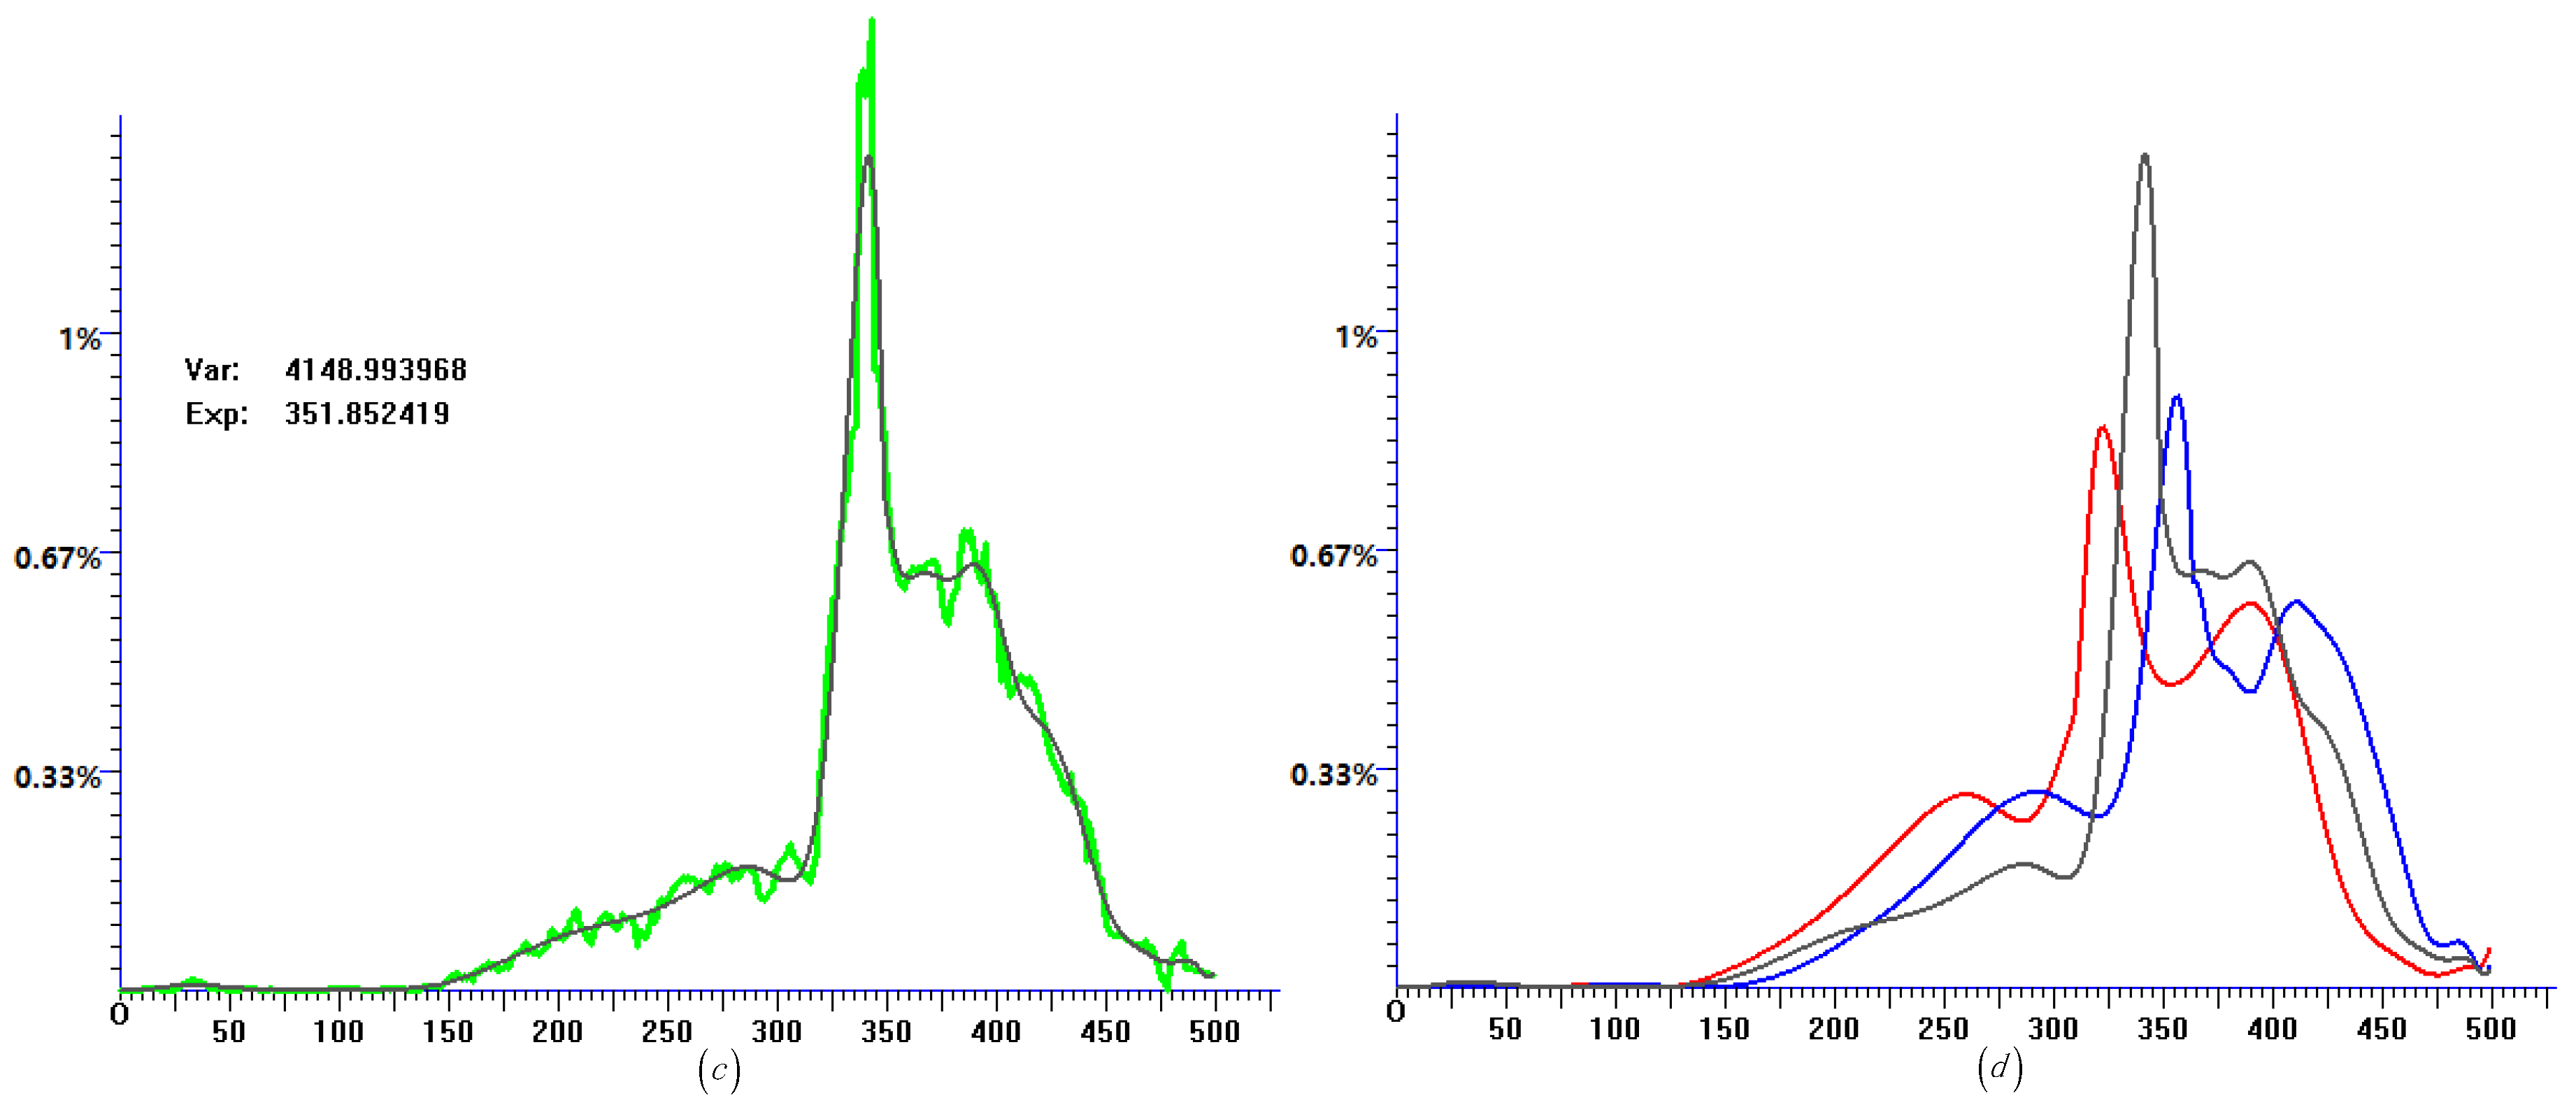
Figure 5.
Histogram data and quasi-distribution fitting of Denmark. (a) Histogram data of daily confirmed cases and the corresponding quasi-distribution fitting. (b) Histogram data of daily recovery cases and the corresponding quasi-distribution fitting. (c) Histogram data of daily fatality cases and the corresponding quasi-distribution fitting. (d) Quasi-distribution fitting results of daily confirmed cases (red), daily recovery cases (blue), and daily fatality cases (black) show in the same coordinate.
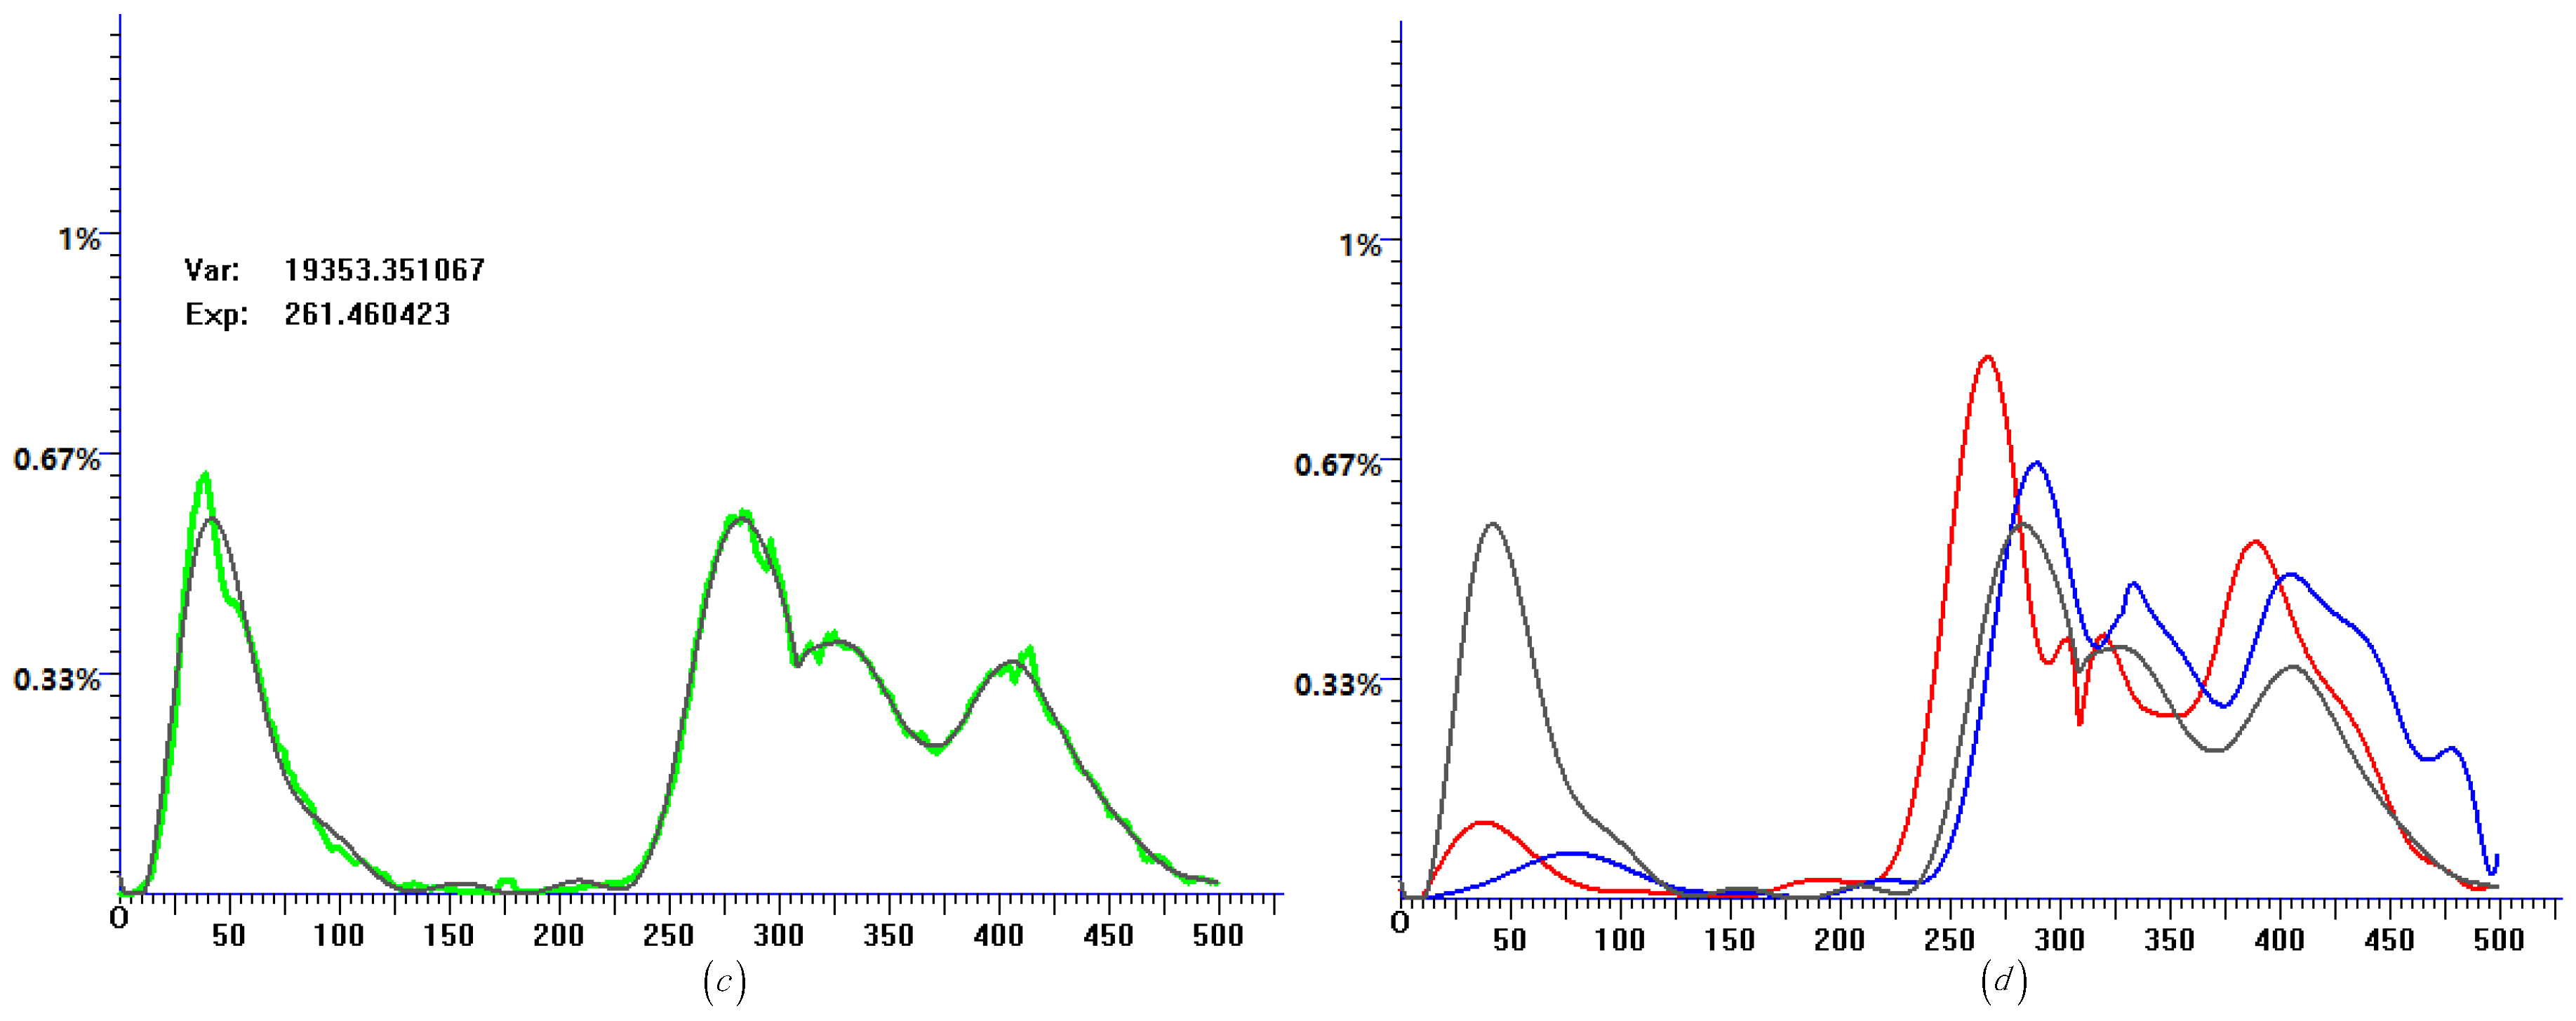
Figure 6.
Histogram data and quasi-distribution fitting of France. (a) Histogram data of daily confirmed cases and the corresponding quasi-distribution fitting. (b) Histogram data of daily recovery cases and the corresponding quasi-distribution fitting. (c) Histogram data of daily fatality cases and the corresponding quasi-distribution fitting. (d) Quasi-distribution fitting results of daily confirmed cases (red), daily recovery cases (blue), and daily fatality cases (black) show in the same coordinate.
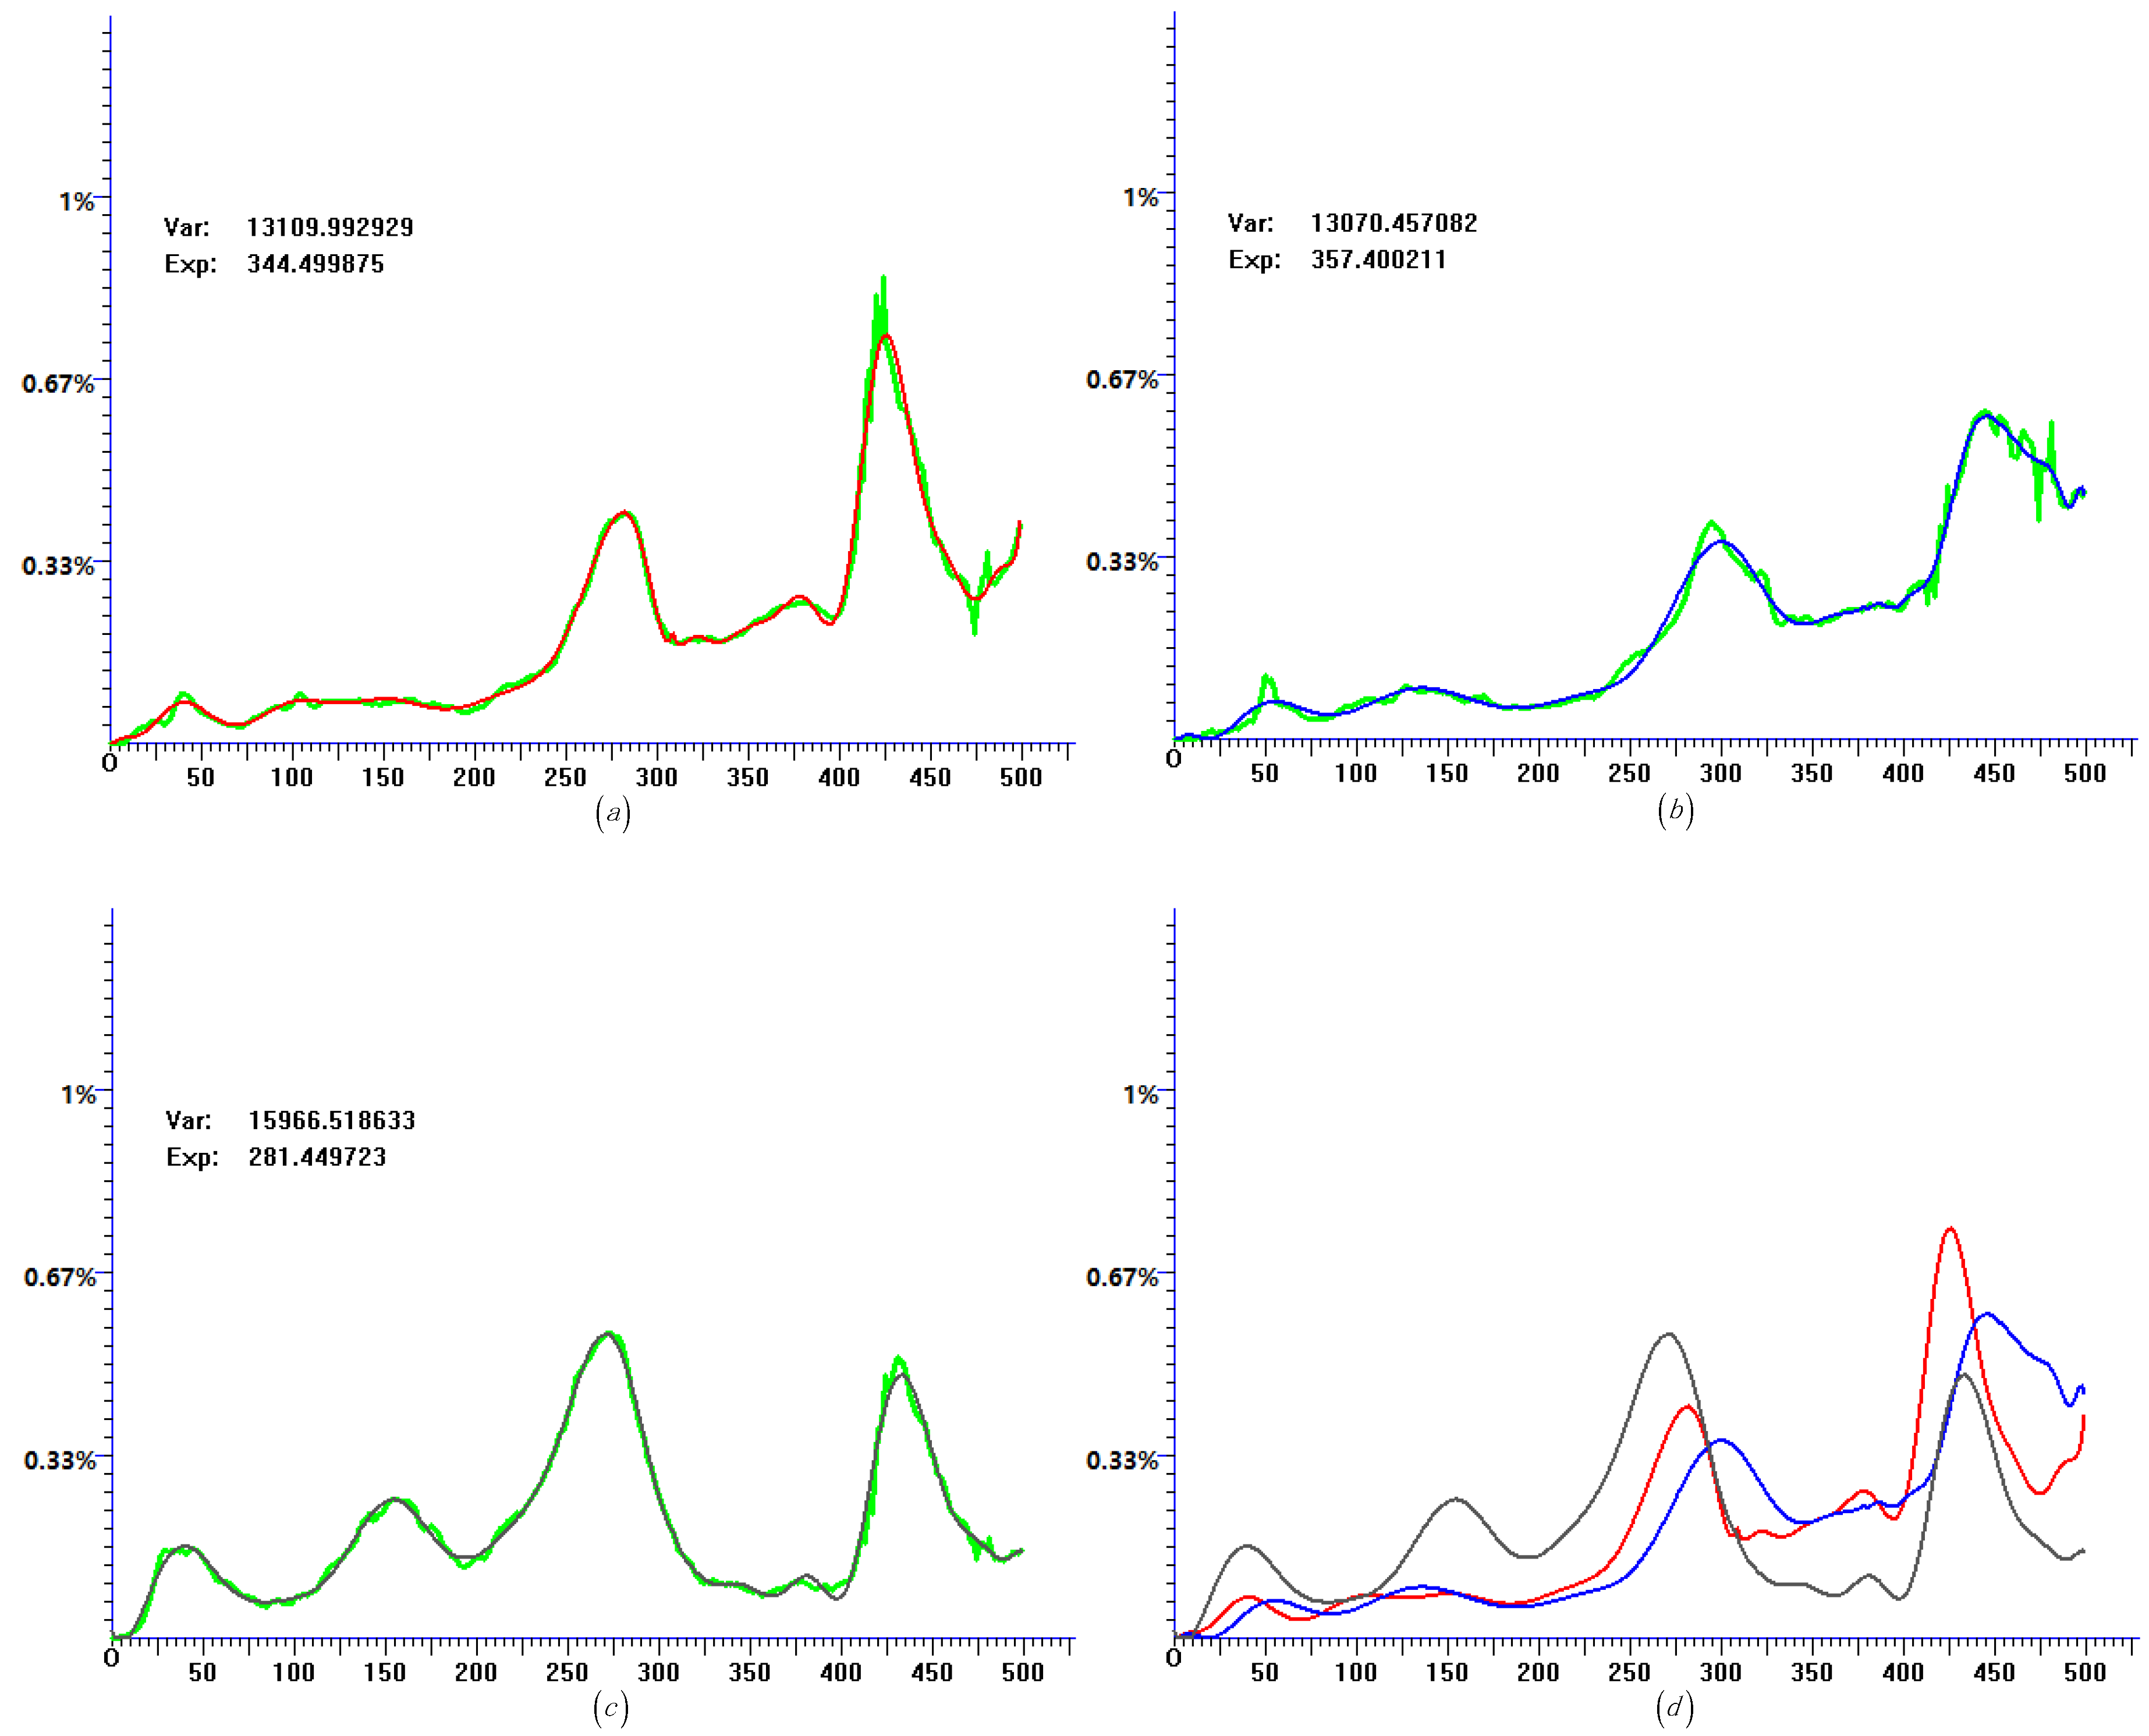
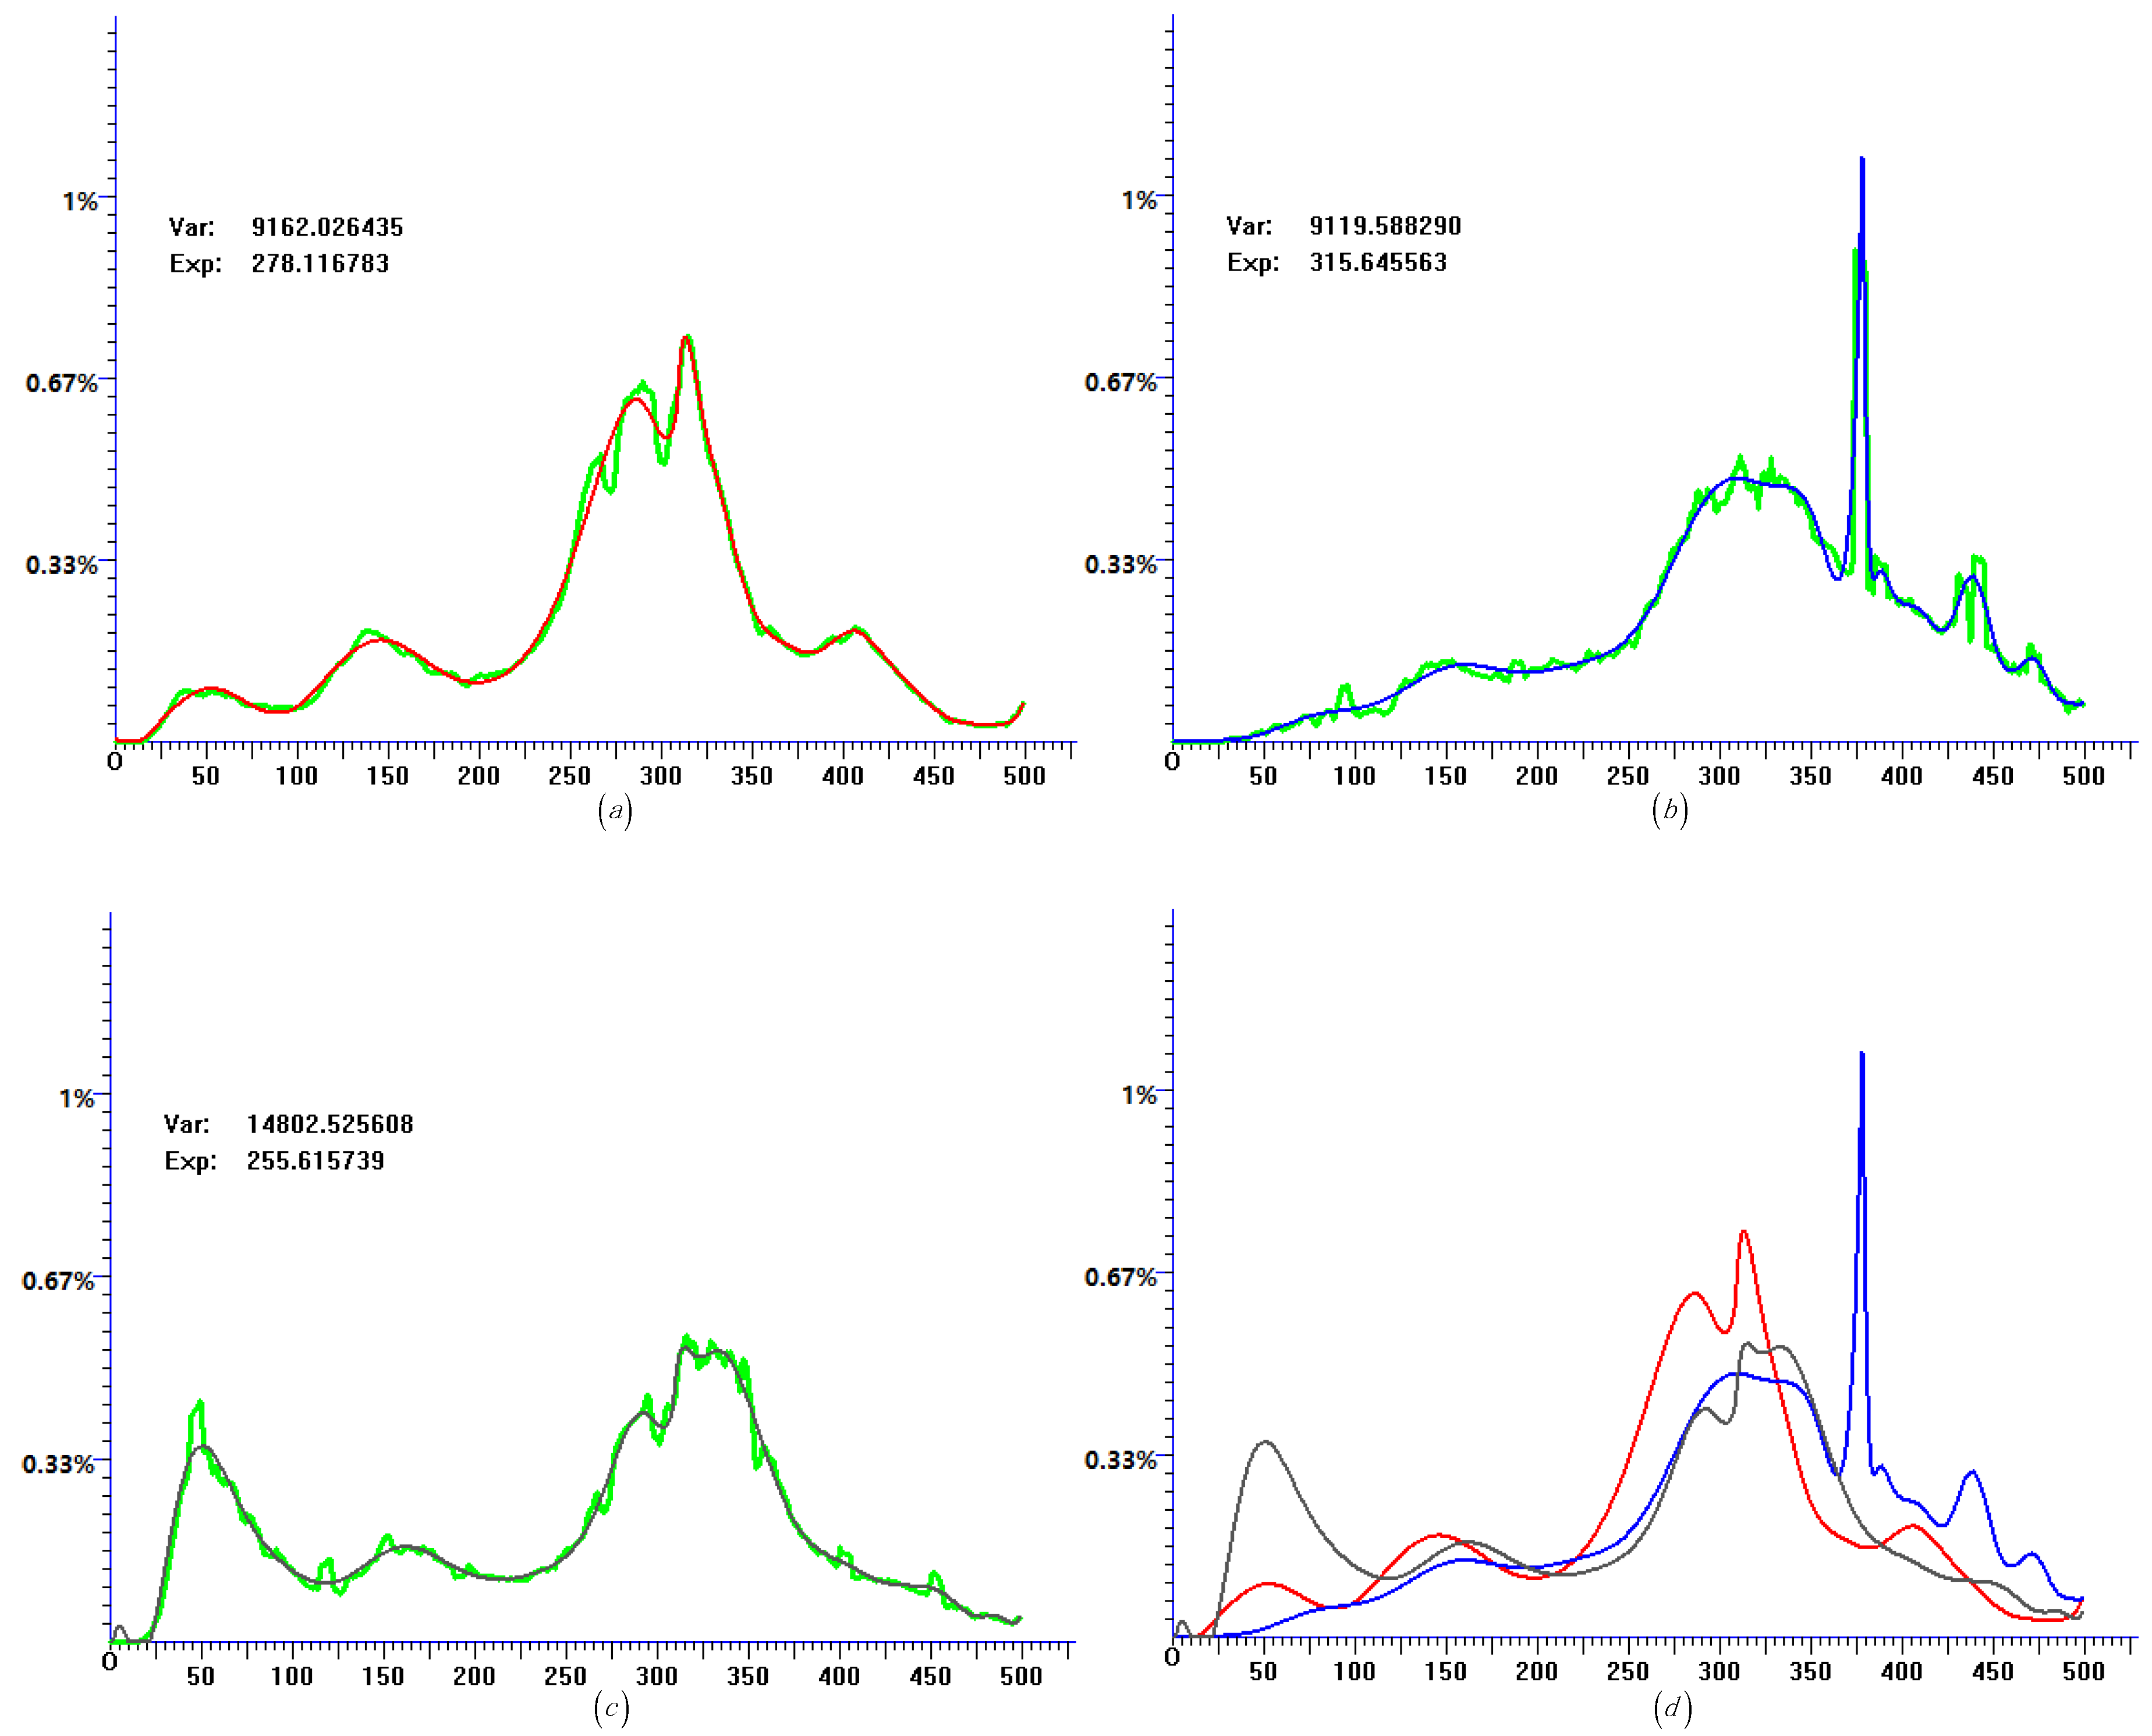
Figure 7.
Histogram data and quasi-distribution fitting of Germany. (a) Histogram data of daily confirmed cases and the corresponding quasi-distribution fitting. (b) Histogram data of daily recovery cases and the corresponding quasi-distribution fitting. (c) Histogram data of daily fatality cases and the corresponding quasi-distribution fitting. (d) Quasi-distribution fitting results of daily confirmed cases (red), daily recovery cases (blue), and daily fatality cases (black) show in the same coordinate.
Figure 8.
Histogram data and quasi-distribution fitting of Italy. (a) Histogram data of daily confirmed cases and the corresponding quasi-distribution fitting. (b) Histogram data of daily recovery cases and the corresponding quasi-distribution fitting. (c) Histogram data of daily fatality cases and the corresponding quasi-distribution fitting. (d) Quasi-distribution fitting results of daily confirmed cases (red), daily recovery cases (blue), and daily fatality cases (black) show in the same coordinate.
Figure 9.
Histogram data and quasi-distribution fitting of Iran. (a) Histogram data of daily confirmed cases and the corresponding quasi-distribution fitting. (b) Histogram data of daily recovery cases and the corresponding quasi-distribution fitting. (c) Histogram data of daily fatality cases and the corresponding quasi-distribution fitting. (d) Quasi-distribution fitting results of daily confirmed cases (red), daily recovery cases (blue), and daily fatality cases (black) show in the same coordinate.
Figure 10.
Histogram data and quasi-distribution fitting of the US. (a) Histogram data of daily confirmed cases and the corresponding quasi-distribution fitting. (b) Histogram data of daily recovery cases and the corresponding quasi-distribution fitting. (c) Histogram data of daily fatality cases and the corresponding quasi-distribution fitting. (d) Quasi-distribution fitting results of daily confirmed cases (red), daily recovery cases (blue), and daily fatality cases (black) show in the same coordinate.
Figure 11.
Histogram data and quasi-distribution fitting of India. (a) Histogram data of daily confirmed cases and the corresponding quasi-distribution fitting. (b) Histogram data of daily recovery cases and the corresponding quasi-distribution fitting. (c) Histogram data of daily fatality cases and the corresponding quasi-distribution fitting. (d) Quasi-distribution fitting results of daily confirmed cases (red), daily recovery cases (blue), and daily fatality cases (black) show in the same coordinate.
Figure 12.
Histogram data and quasi-distribution fitting of Poland. (a) Histogram data of daily confirmed cases and the corresponding quasi-distribution fitting. (b) Histogram data of daily recovery cases and the corresponding quasi-distribution fitting. (c) Histogram data of daily fatality cases and the corresponding quasi-distribution fitting. (d) Quasi-distribution fitting results of daily confirmed cases (red), daily recovery cases (blue), and daily fatality cases (black) show in the same coordinate.
Figure 13.
Histogram data and quasi-distribution fitting of Israel. (a) Histogram data of daily confirmed cases and the corresponding quasi-distribution fitting. (b) Histogram data of daily recovery cases and the corresponding quasi-distribution fitting. (c) Histogram data of daily fatality cases and the corresponding quasi-distribution fitting. (d) Quasi-distribution fitting results of daily confirmed cases (red), daily recovery cases (blue), and daily fatality cases (black) show in the same coordinate.
Figure 14.
Histogram data and quasi-distribution fitting of Japan. (a) Histogram data of daily confirmed cases and the corresponding quasi-distribution fitting. (b) Histogram data of daily recovery cases and the corresponding quasi-distribution fitting. (c) Histogram data of daily fatality cases and the corresponding quasi-distribution fitting. (d) Quasi-distribution fitting results of daily confirmed cases (red), daily recovery cases (blue), and daily fatality cases (black) show in the same coordinate.
Figure 15.
Histogram data and quasi-distribution fitting of the Philippines. (a) Histogram data of daily confirmed cases and the corresponding quasi-distribution fitting. (b) Histogram data of daily recovery cases and the corresponding quasi-distribution fitting. (c) Histogram data of daily fatality cases and the corresponding quasi-distribution fitting. (d) Quasi-distribution fitting results of daily confirmed cases (red), daily recovery cases (blue), and daily fatality cases (black) show in the same coordinate.
Figure 16.
Histogram data and quasi-distribution fitting of Korea. (a) Histogram data of daily confirmed cases and the corresponding quasi-distribution fitting. (b) Histogram data of daily recovery cases and the corresponding quasi-distribution fitting. (c) Histogram data of daily fatality cases and the corresponding quasi-distribution fitting. (d) Quasi-distribution fitting results of daily confirmed cases (red), daily recovery cases (blue), and daily fatality cases (black) show in the same coordinate.
Figure 17.
Histogram data and quasi-distribution fitting of Lebanon. (a) Histogram data of daily confirmed cases and the corresponding quasi-distribution fitting. (b) Histogram data of daily recovery cases and the corresponding quasi-distribution fitting. (c) Histogram data of daily fatality cases and the corresponding quasi-distribution fitting. (d) Quasi-distribution fitting results of daily confirmed cases (red), daily recovery cases (blue), and daily fatality cases (black) show in the same coordinate.
Figure 18.
Histogram data and quasi-distribution fitting of Portugal. (a) Histogram data of daily confirmed cases and the corresponding quasi-distribution fitting. (b) Histogram data of daily recovery cases and the corresponding quasi-distribution fitting. (c) Histogram data of daily fatality cases and the corresponding quasi-distribution fitting. (d) Quasi-distribution fitting results of daily confirmed cases (red), daily recovery cases (blue), and daily fatality cases (black) show in the same coordinate.
Table 1.
Daily new cases of different countries in five days.
Table 1.
Daily new cases of different countries in five days.
| Finland | France | Korea | Ecuador |
|---|
| 11/4/2020 | 293 | 7/2/2020 | 659 | 1/15/2021 | 513 | 7/13/2020 | 589 |
| 11/5/2020 | 189 | 7/3/2020 | 582 | 1/16/2021 | 1099 | 7/14/2020 | 0 |
| 11/6/2020 | 266 | 7/4/2020 | 0 | 1/17/2021 | 0 | 7/15/2020 | 1870 |
| 11/7/2020 | 0 | 7/5/2020 | 0 | 1/18/2021 | 389 | 7/16/2020 | 1036 |
| 11/8/2020 | 412 | 7/6/2020 | 1375 | 1/19/2021 | 386 | 7/17/2020 | 1079 |
Table 2.
Beginning date and ending date of different countries’ COVID-19 data.
Table 2.
Beginning date and ending date of different countries’ COVID-19 data.
| Country | Beginning Date | Ending Date | Country | Beginning Date | Ending Date |
|---|
| Austria | 3/01/2020 | 7/13/2021 | Brazil | 3/06/2020 | 7/18/2021 |
| Canada | 2/28/2020 | 7/11/2021 | Chile | 3/04/2020 | 7/16/2021 |
| The US | 2/29/2020 | 7/12/2021 | Denmark | 3/02/2020 | 7/14/2021 |
| France | 2/26/2020 | 7/09/2021 | Germany | 2/29/2020 | 7/12/2021 |
| India | 3/02/2020 | 7/14/2021 | Iran | 2/19/2020 | 7/02/2021 |
| Israel | 3/06/2020 | 7/18/2021 | Italy | 2/21/2020 | 7/04/2021 |
| Japan | 1/29/2020 | 6/11/2021 | Korea | 2/17/2020 | 6/30/2021 |
| Lebanon | 2/26/2020 | 7/09/2021 | The Philippines | 3/07/2020 | 7/19/2021 |
| Poland | 3/04/2020 | 7/16/2021 | Portugal | 2/24/2020 | 7/07/2021 |


