
Parameters Sensitivity Analysis of COVID-19 Based on the SCEIR Prediction Model

Abstract
1. Introduction
2. Model Building
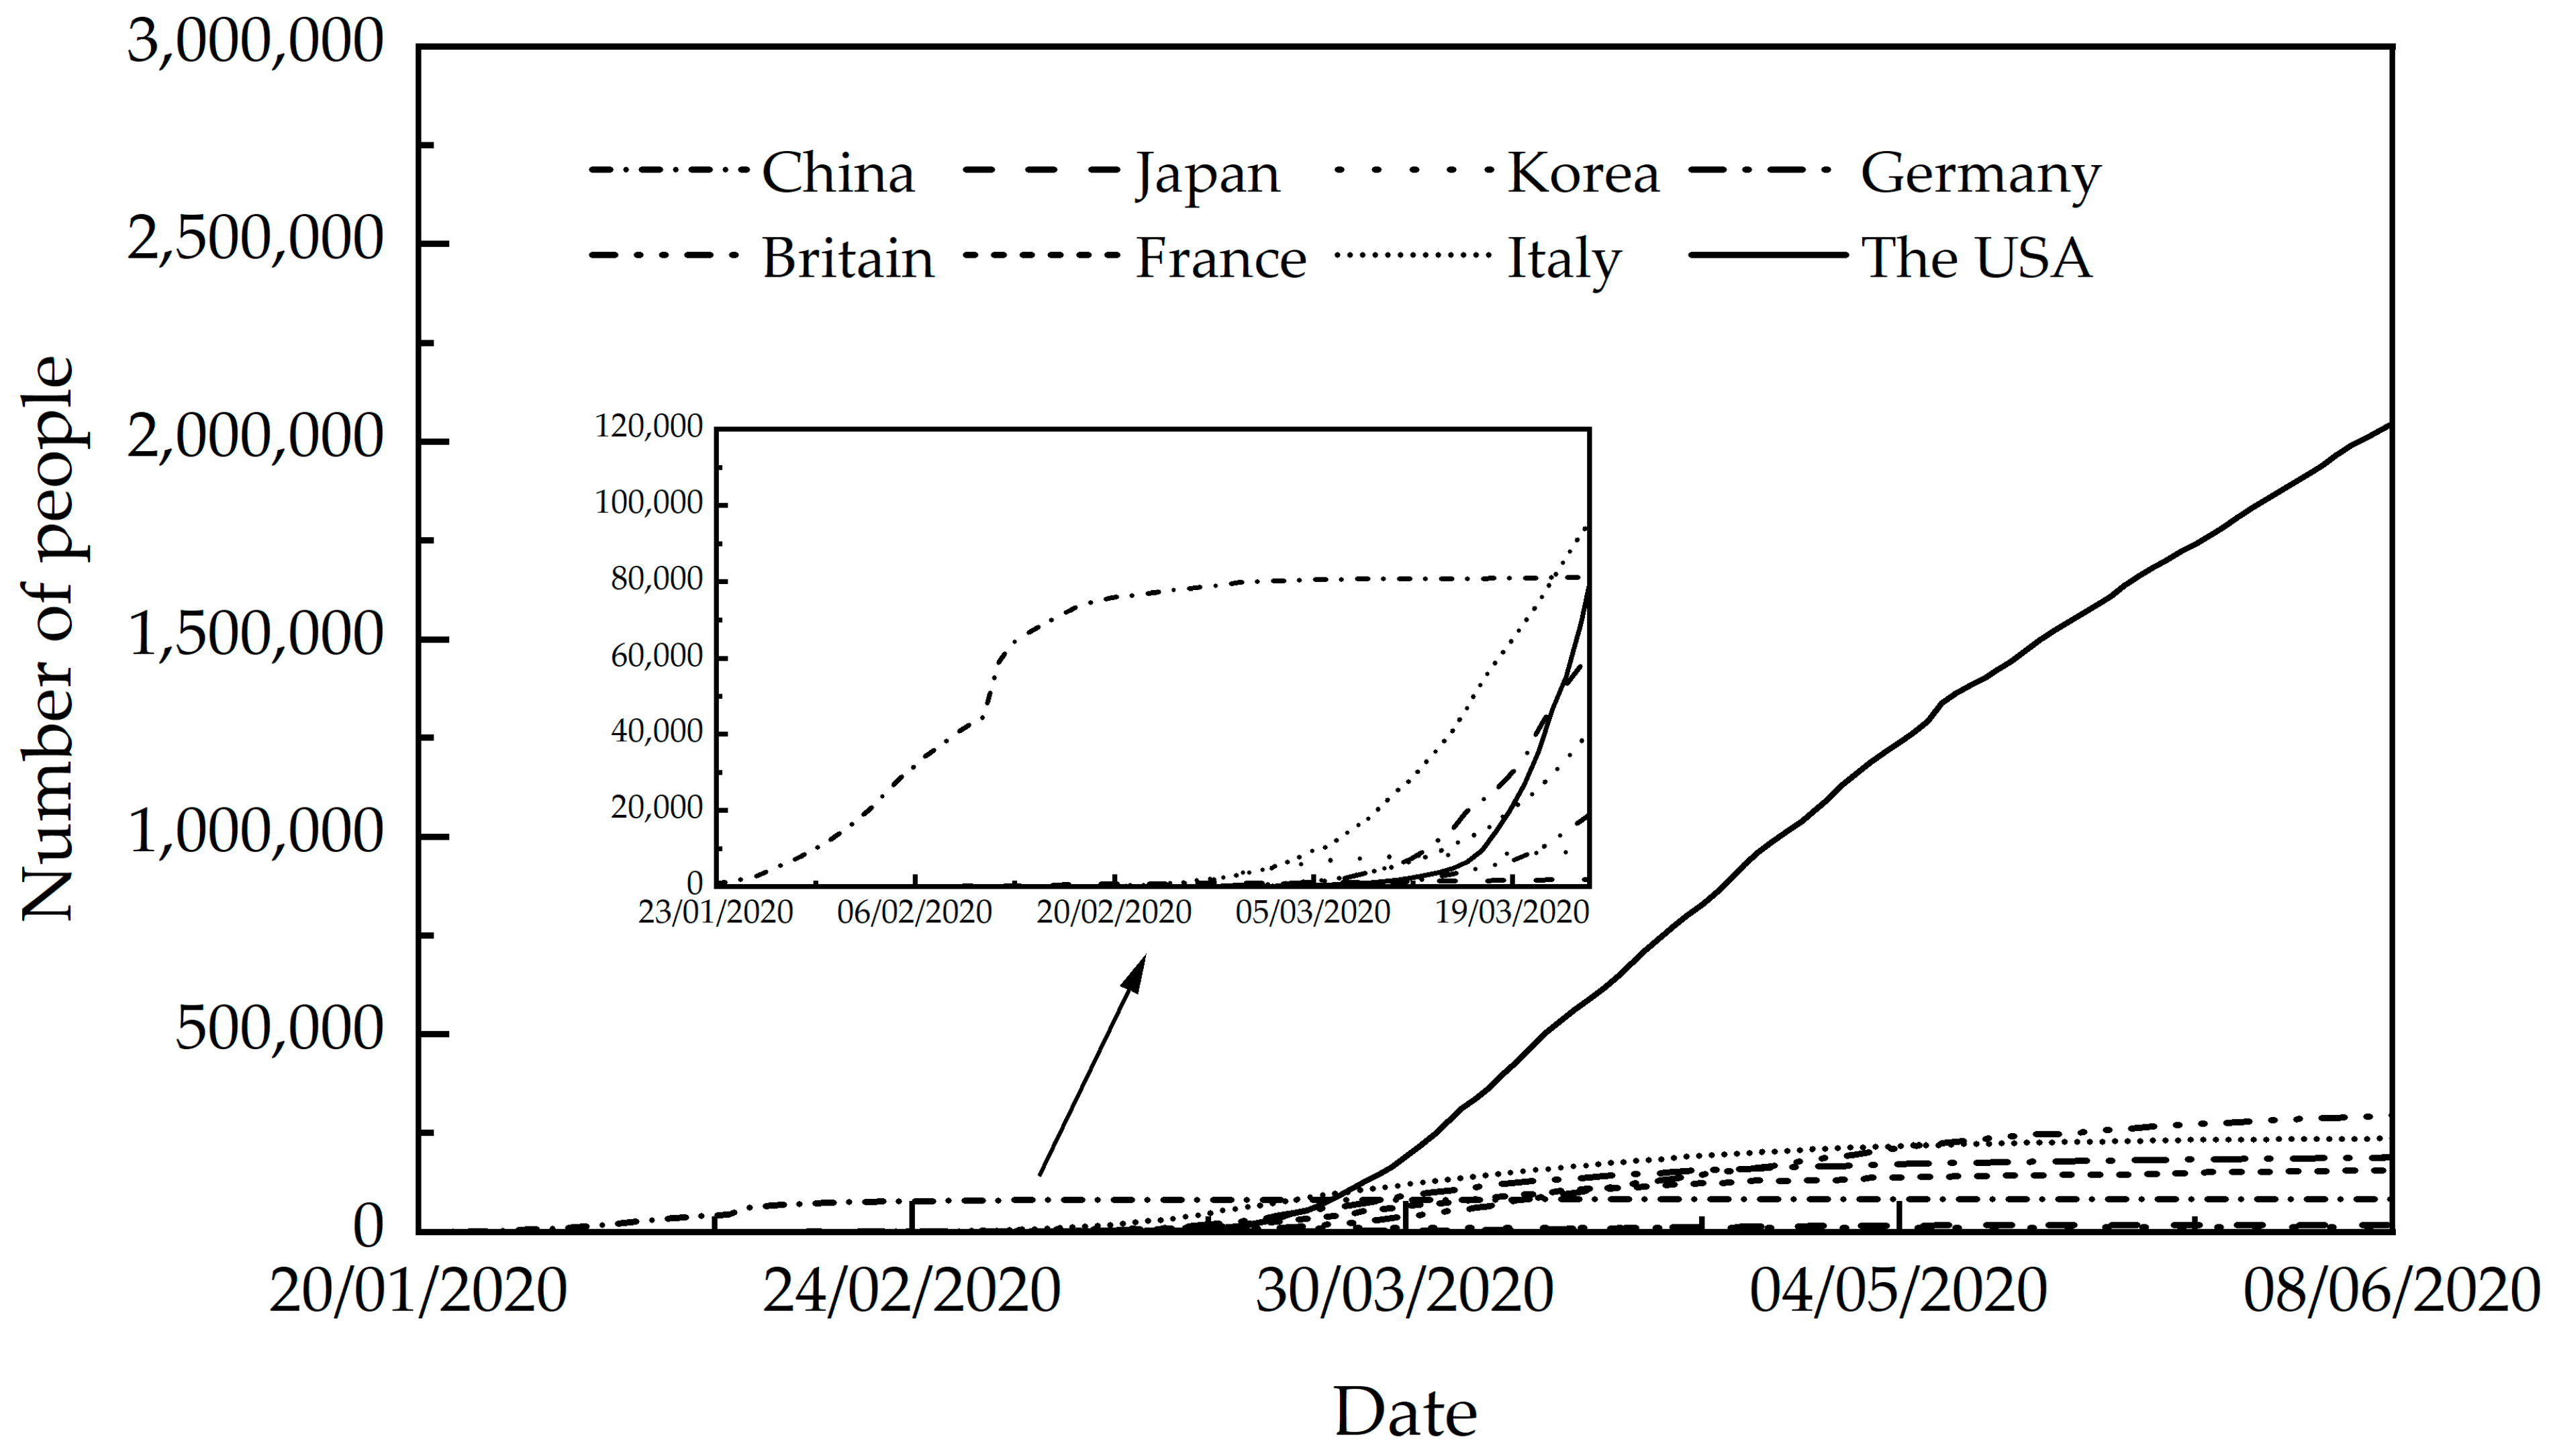
2.1. Data Selection
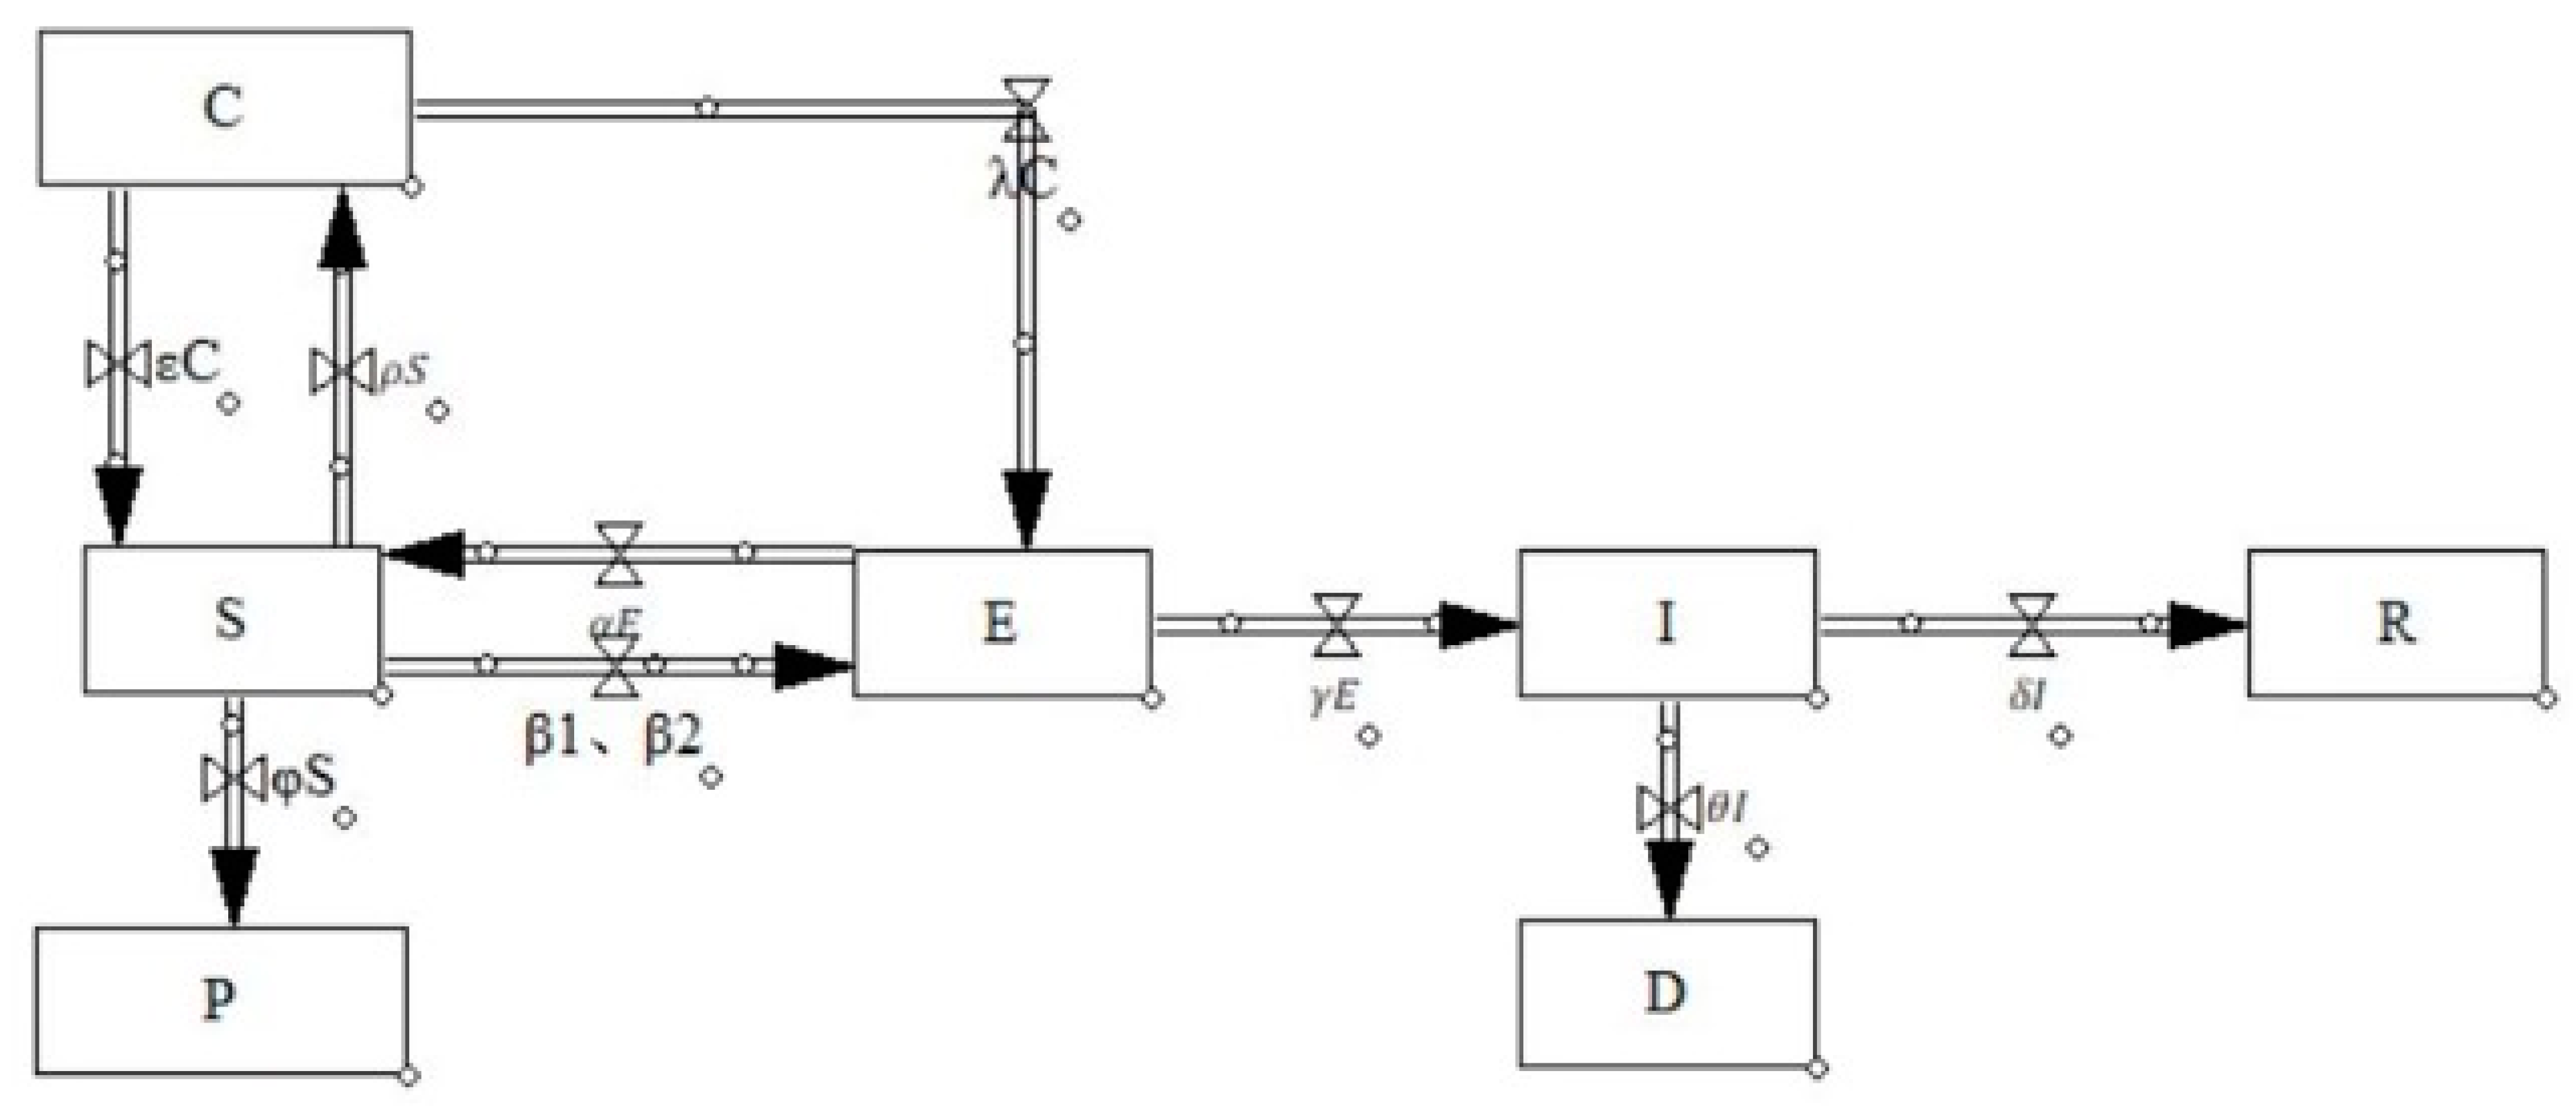
2.2. SCEIR Model
- (1)
- Introduce C: Close contacts
- (2)
- Introduce P: Self-protectors
- (3)
- R Redefined

| China | Source | The USA | Source | Italy | Source | |
|---|---|---|---|---|---|---|
| 14 billion | [29] | 3.3 billion | [30] | 0.559 billion | [30] | |
| 8420 | [29] | 0 | - | 0 | - | |
| 1072 | [29] | 0 | - | 0 | - | |
| 816 | [29] | 0 | - | 2 | - | |
| 34 | [29] | 0 | - | 0 | - | |
| 25 | [29] | 0 | - | 0 | - | |
| 0 | [29] | 0 | - | 0 | - | |
| 0.15 | [29] | 0.4 | [30] | 0.3 | [30] | |
| 0.15 | [29] | 0.4 | [30] | 0.3 | [30] | |
| 0.2 | OLS | 0.135 | OLS | 0.25 | OLS | |
| 0.8 | OLS | 0.865 | OLS | 0.75 | OLS | |
| 0.001 | OLS | 0.0001 | OLS | 0.001 | OLS | |
| 0.05 | OLS | 0.05 | OLS | 0.05 | OLS | |
| 0.95 | OLS | 0.95 | OLS | 0.95 | OLS | |
| 0.1 | [29] | 0.05 | [30] | 0.053 | [30] | |
| 0.006 | [29] | 0.007 | [30] | 0.01 | [30] | |
| 0.19 | MCMC | - | - | 0.01 | MCMC |
2.3. Forecasting Models and Comparative Analysis of China, the USA, and Italy
2.3.1. Initial Values of the Model and Selection of Parameters
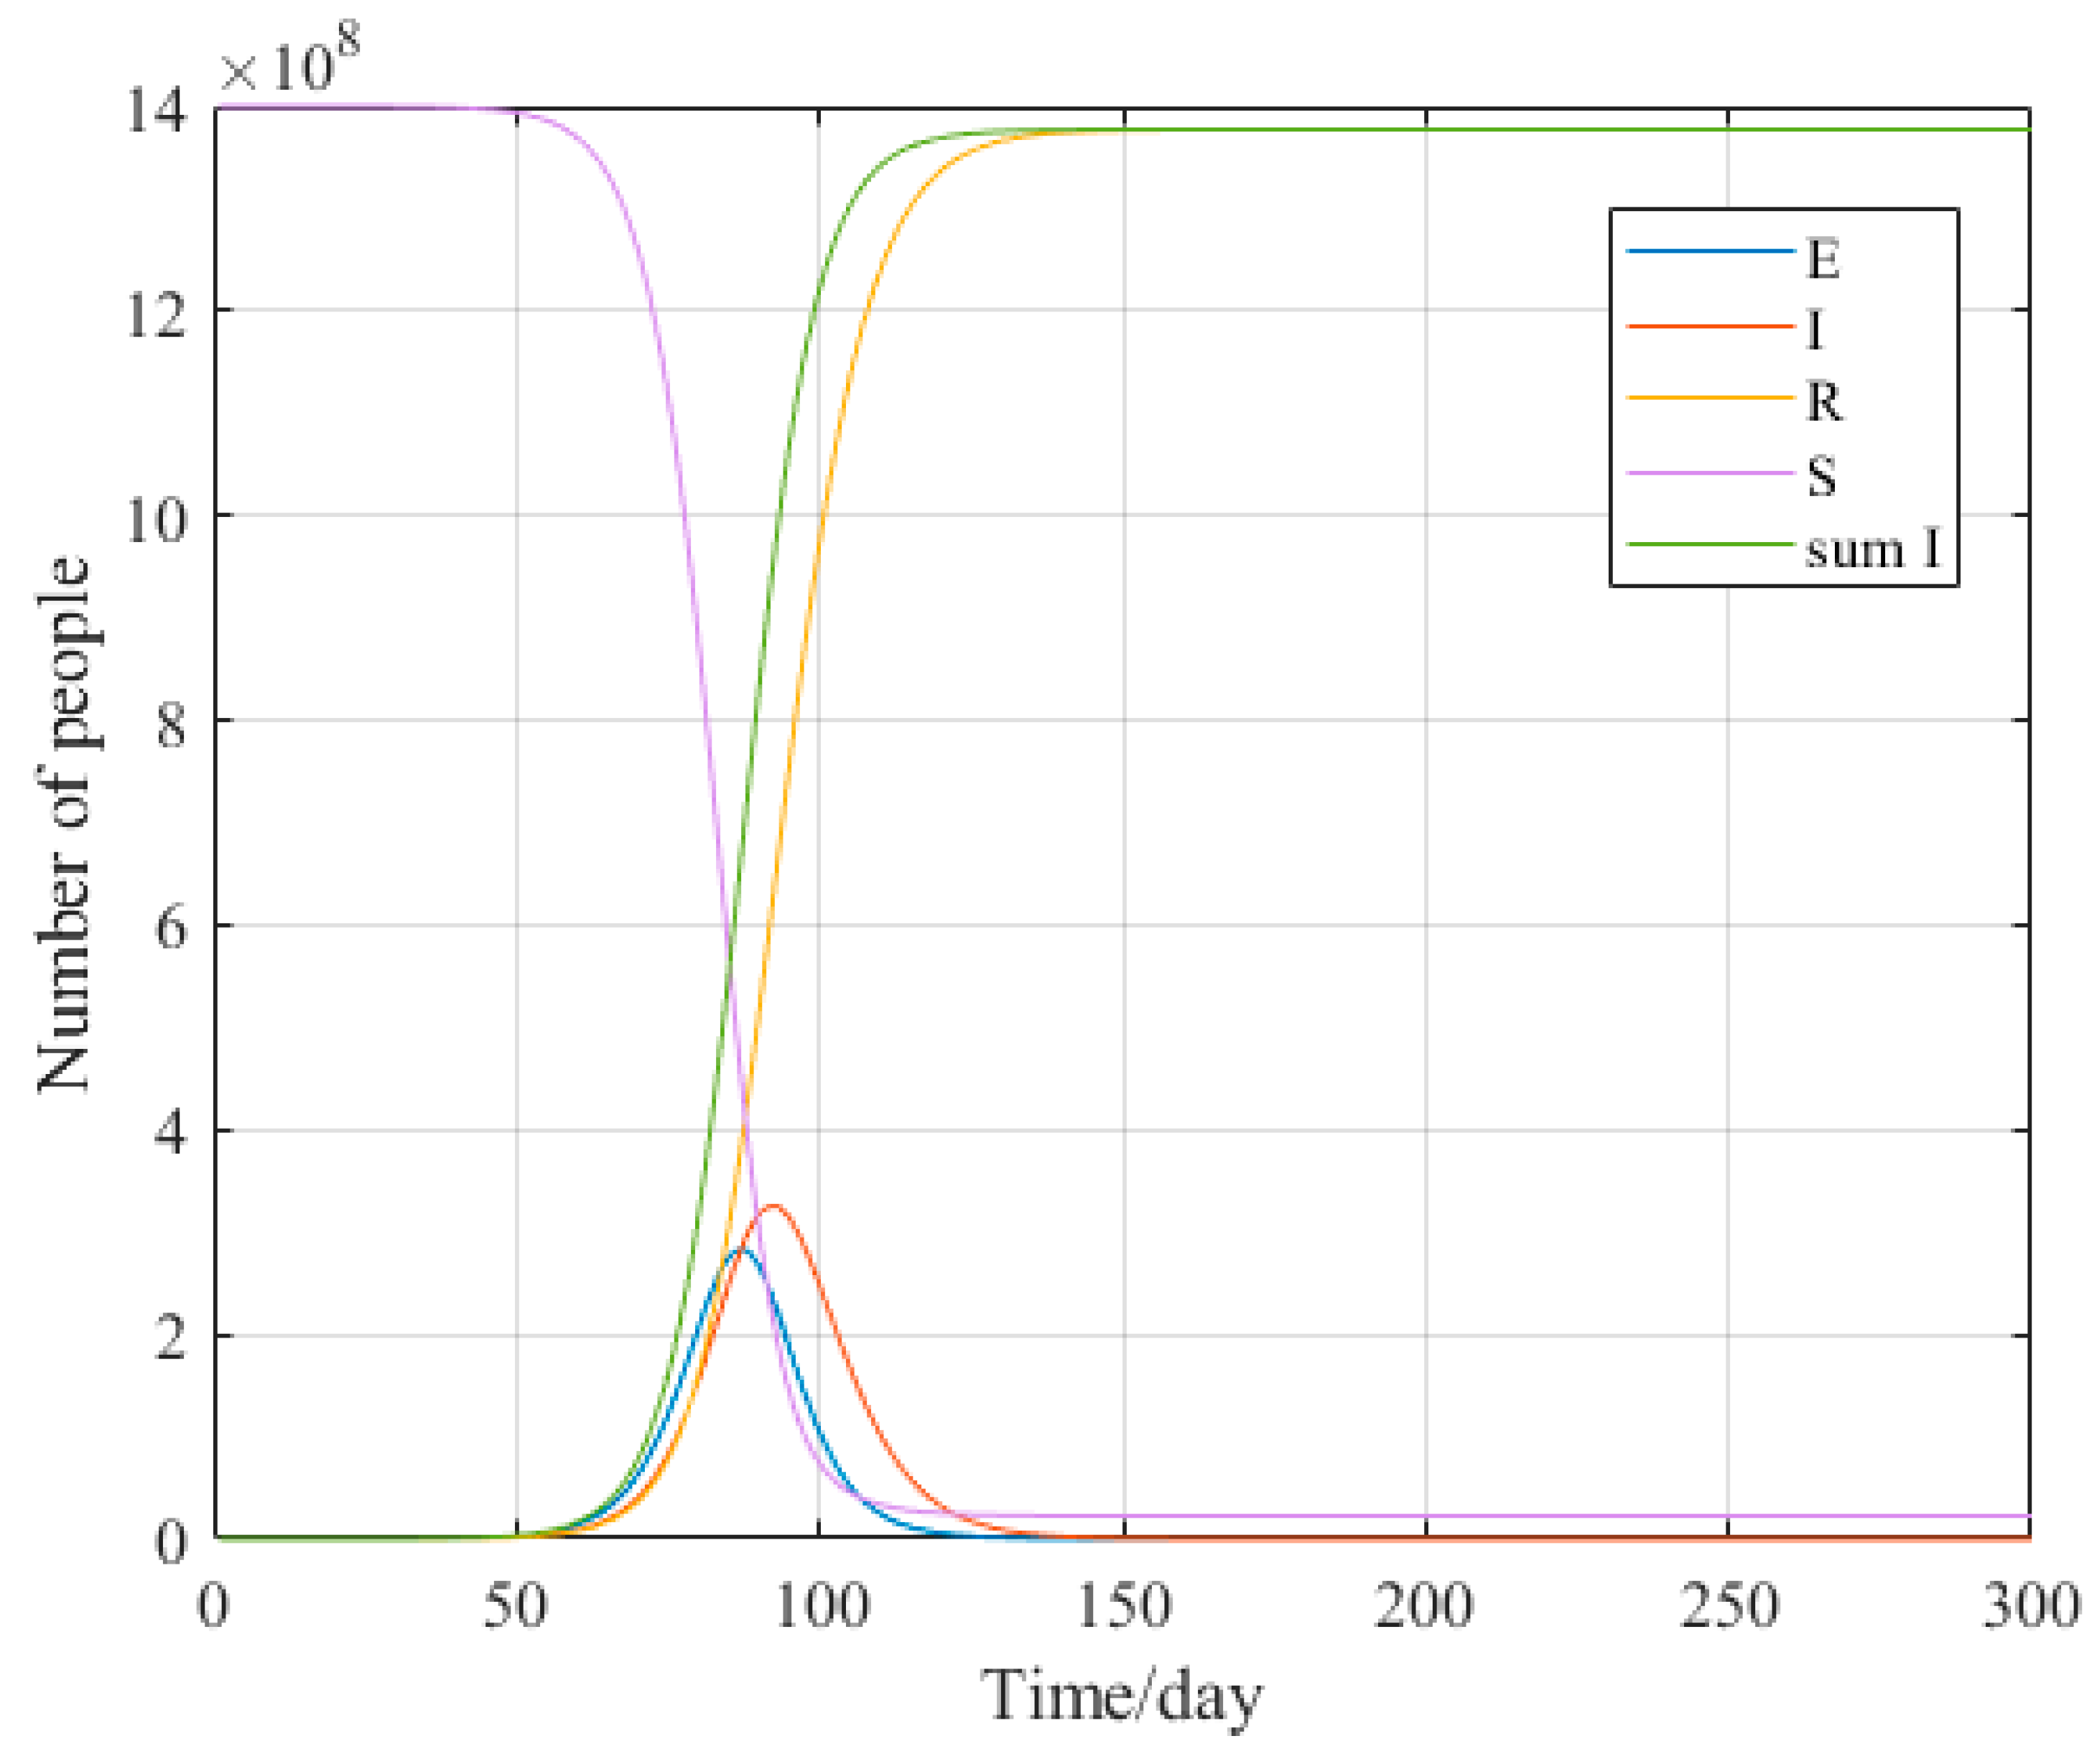
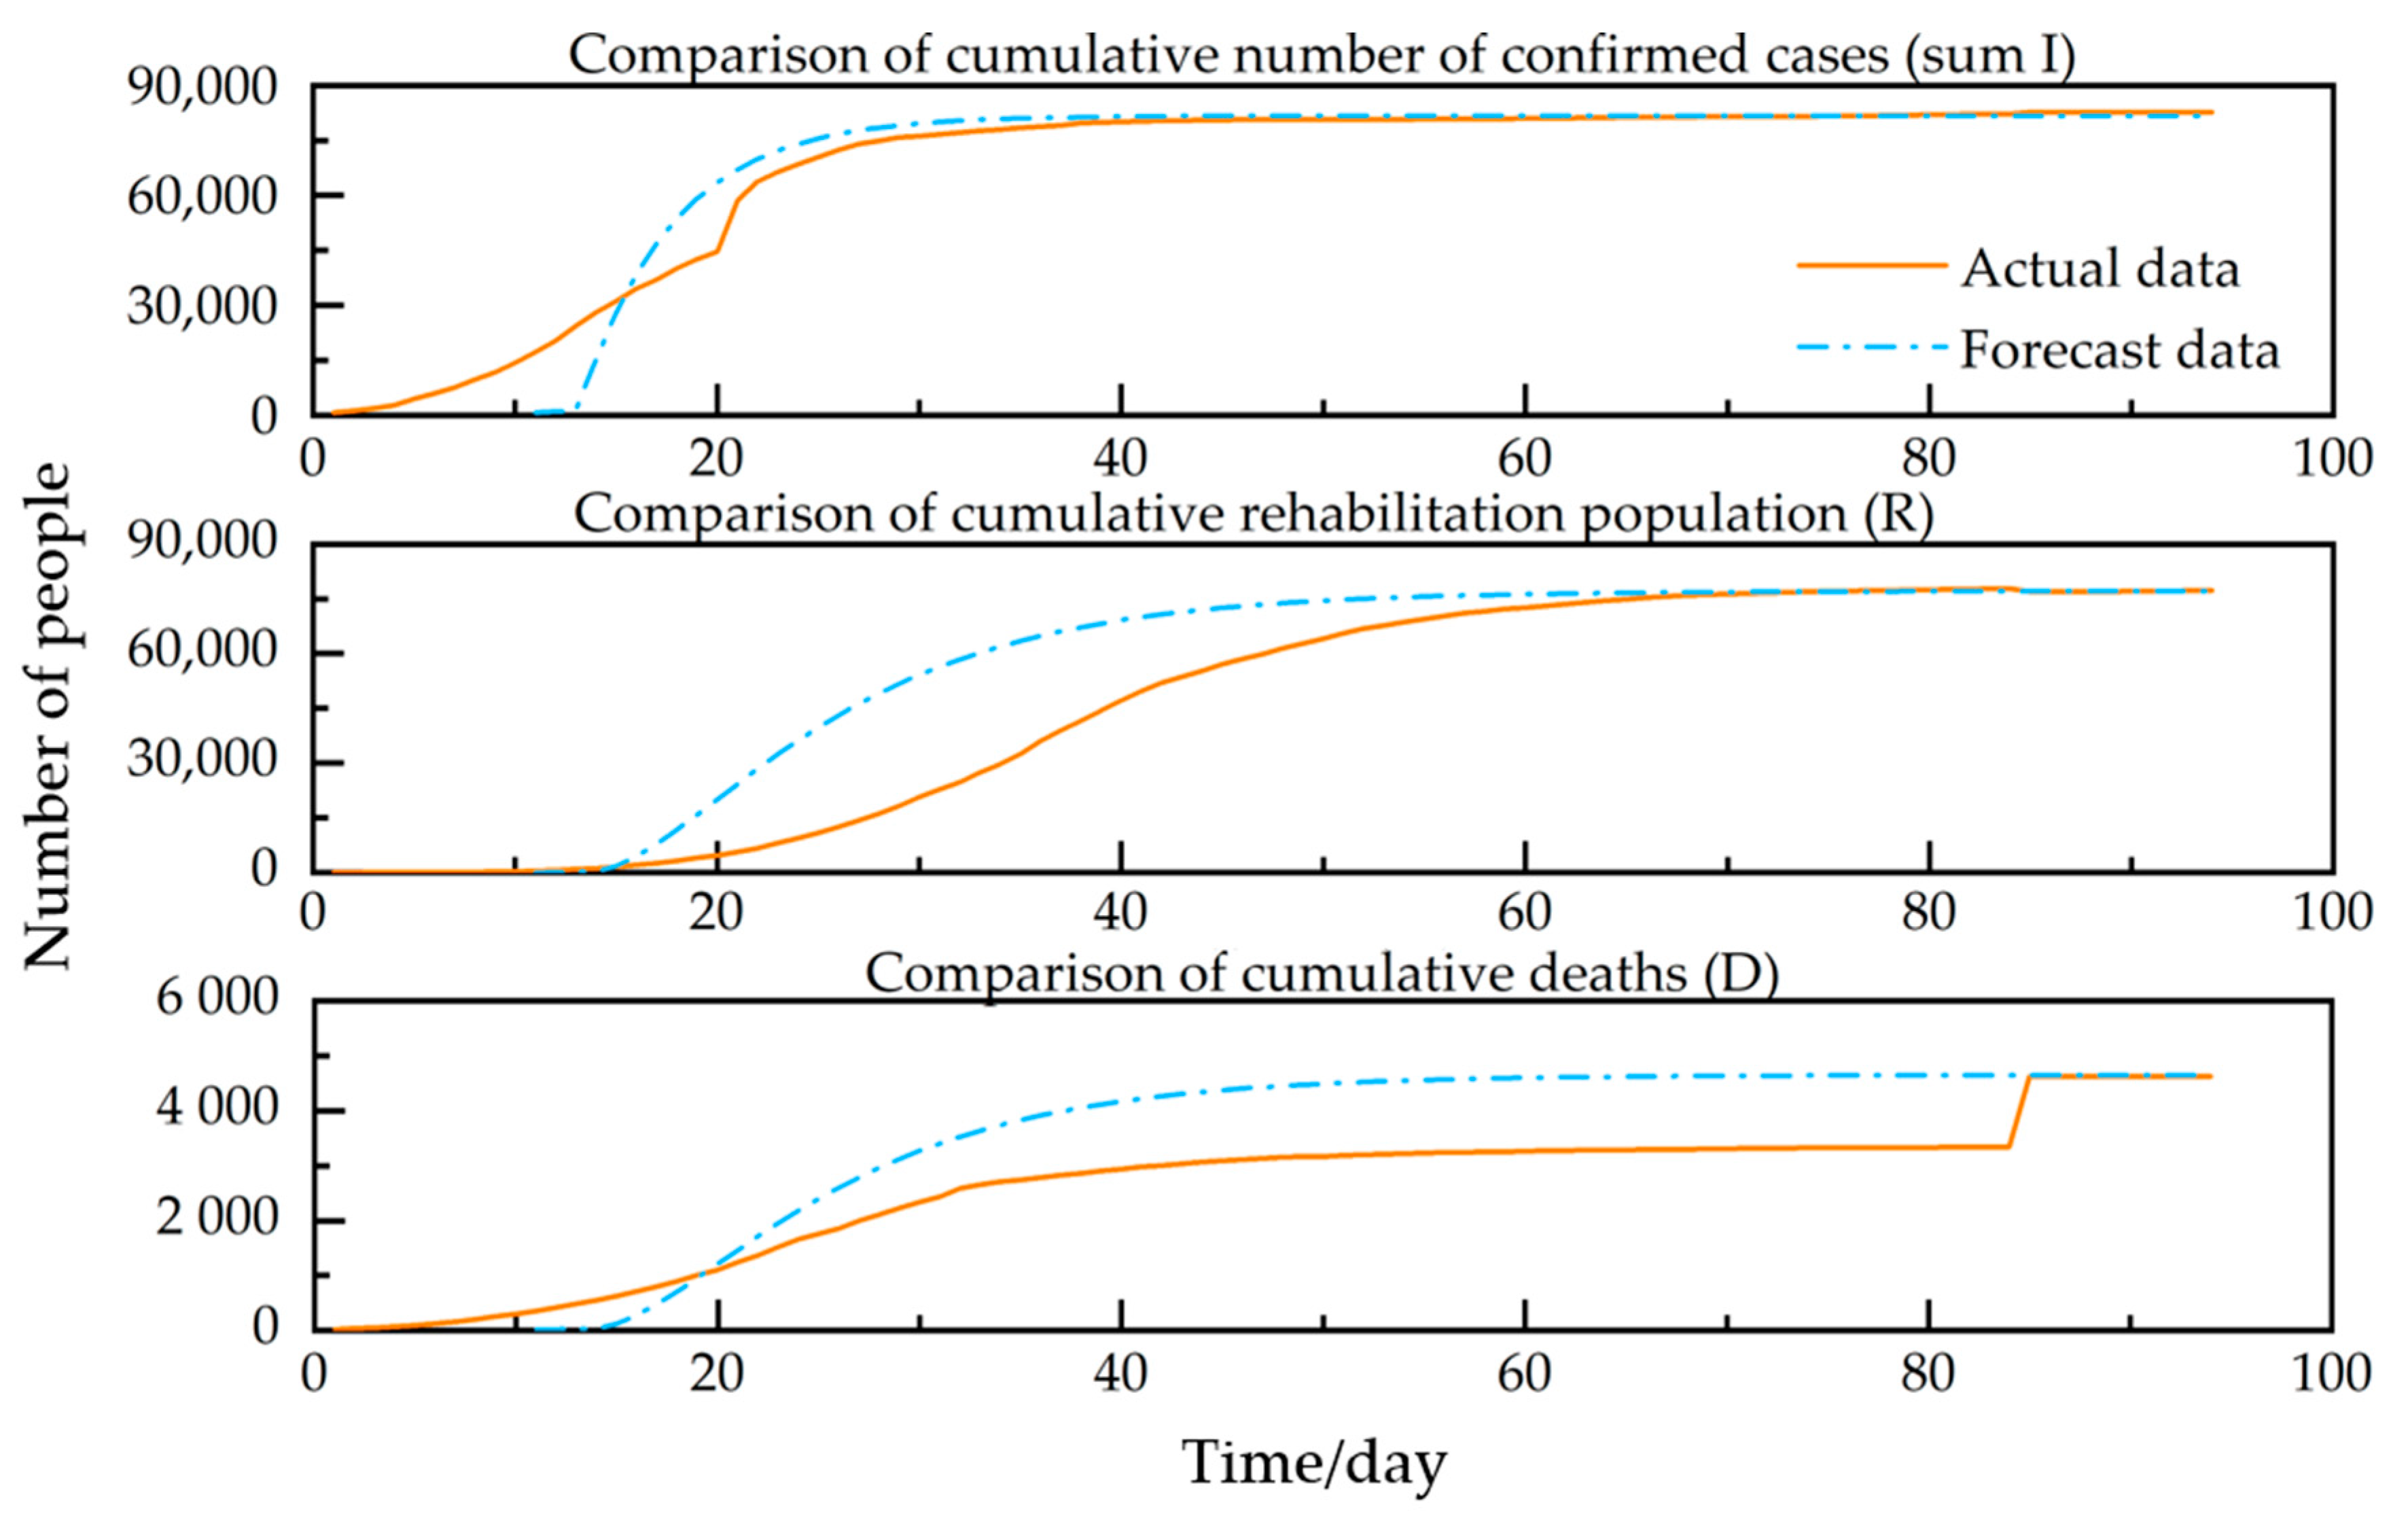
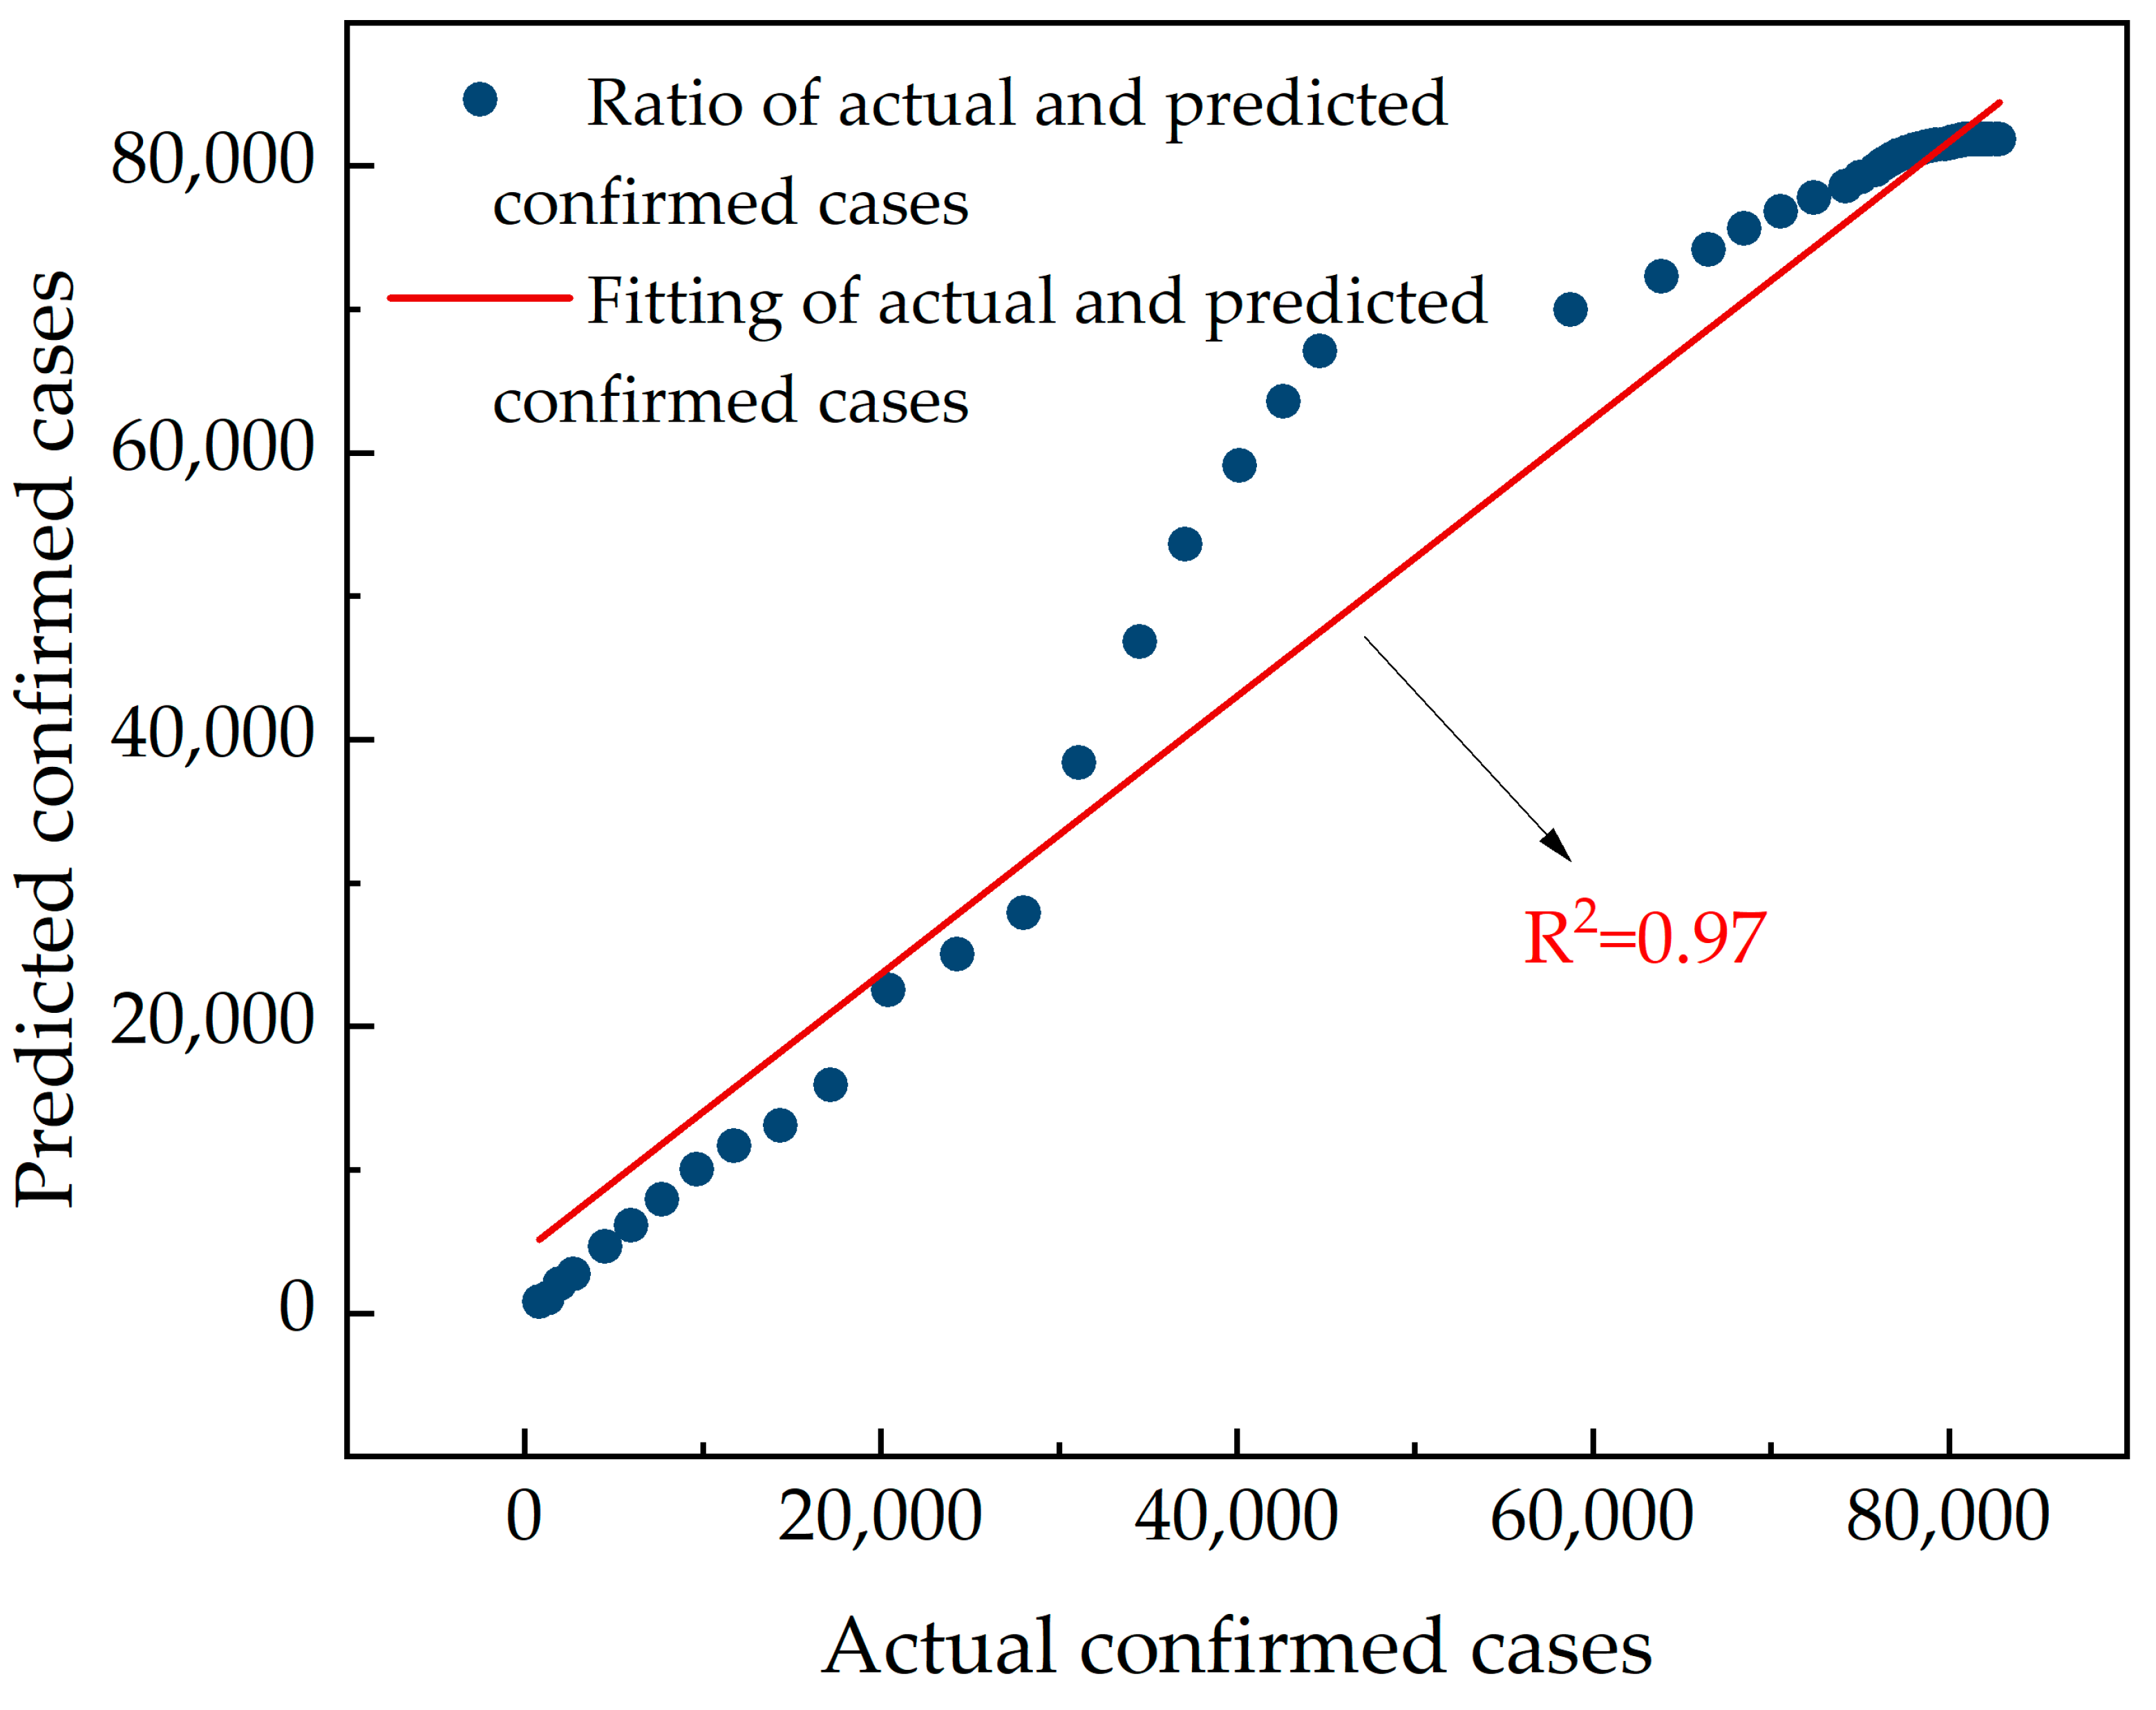
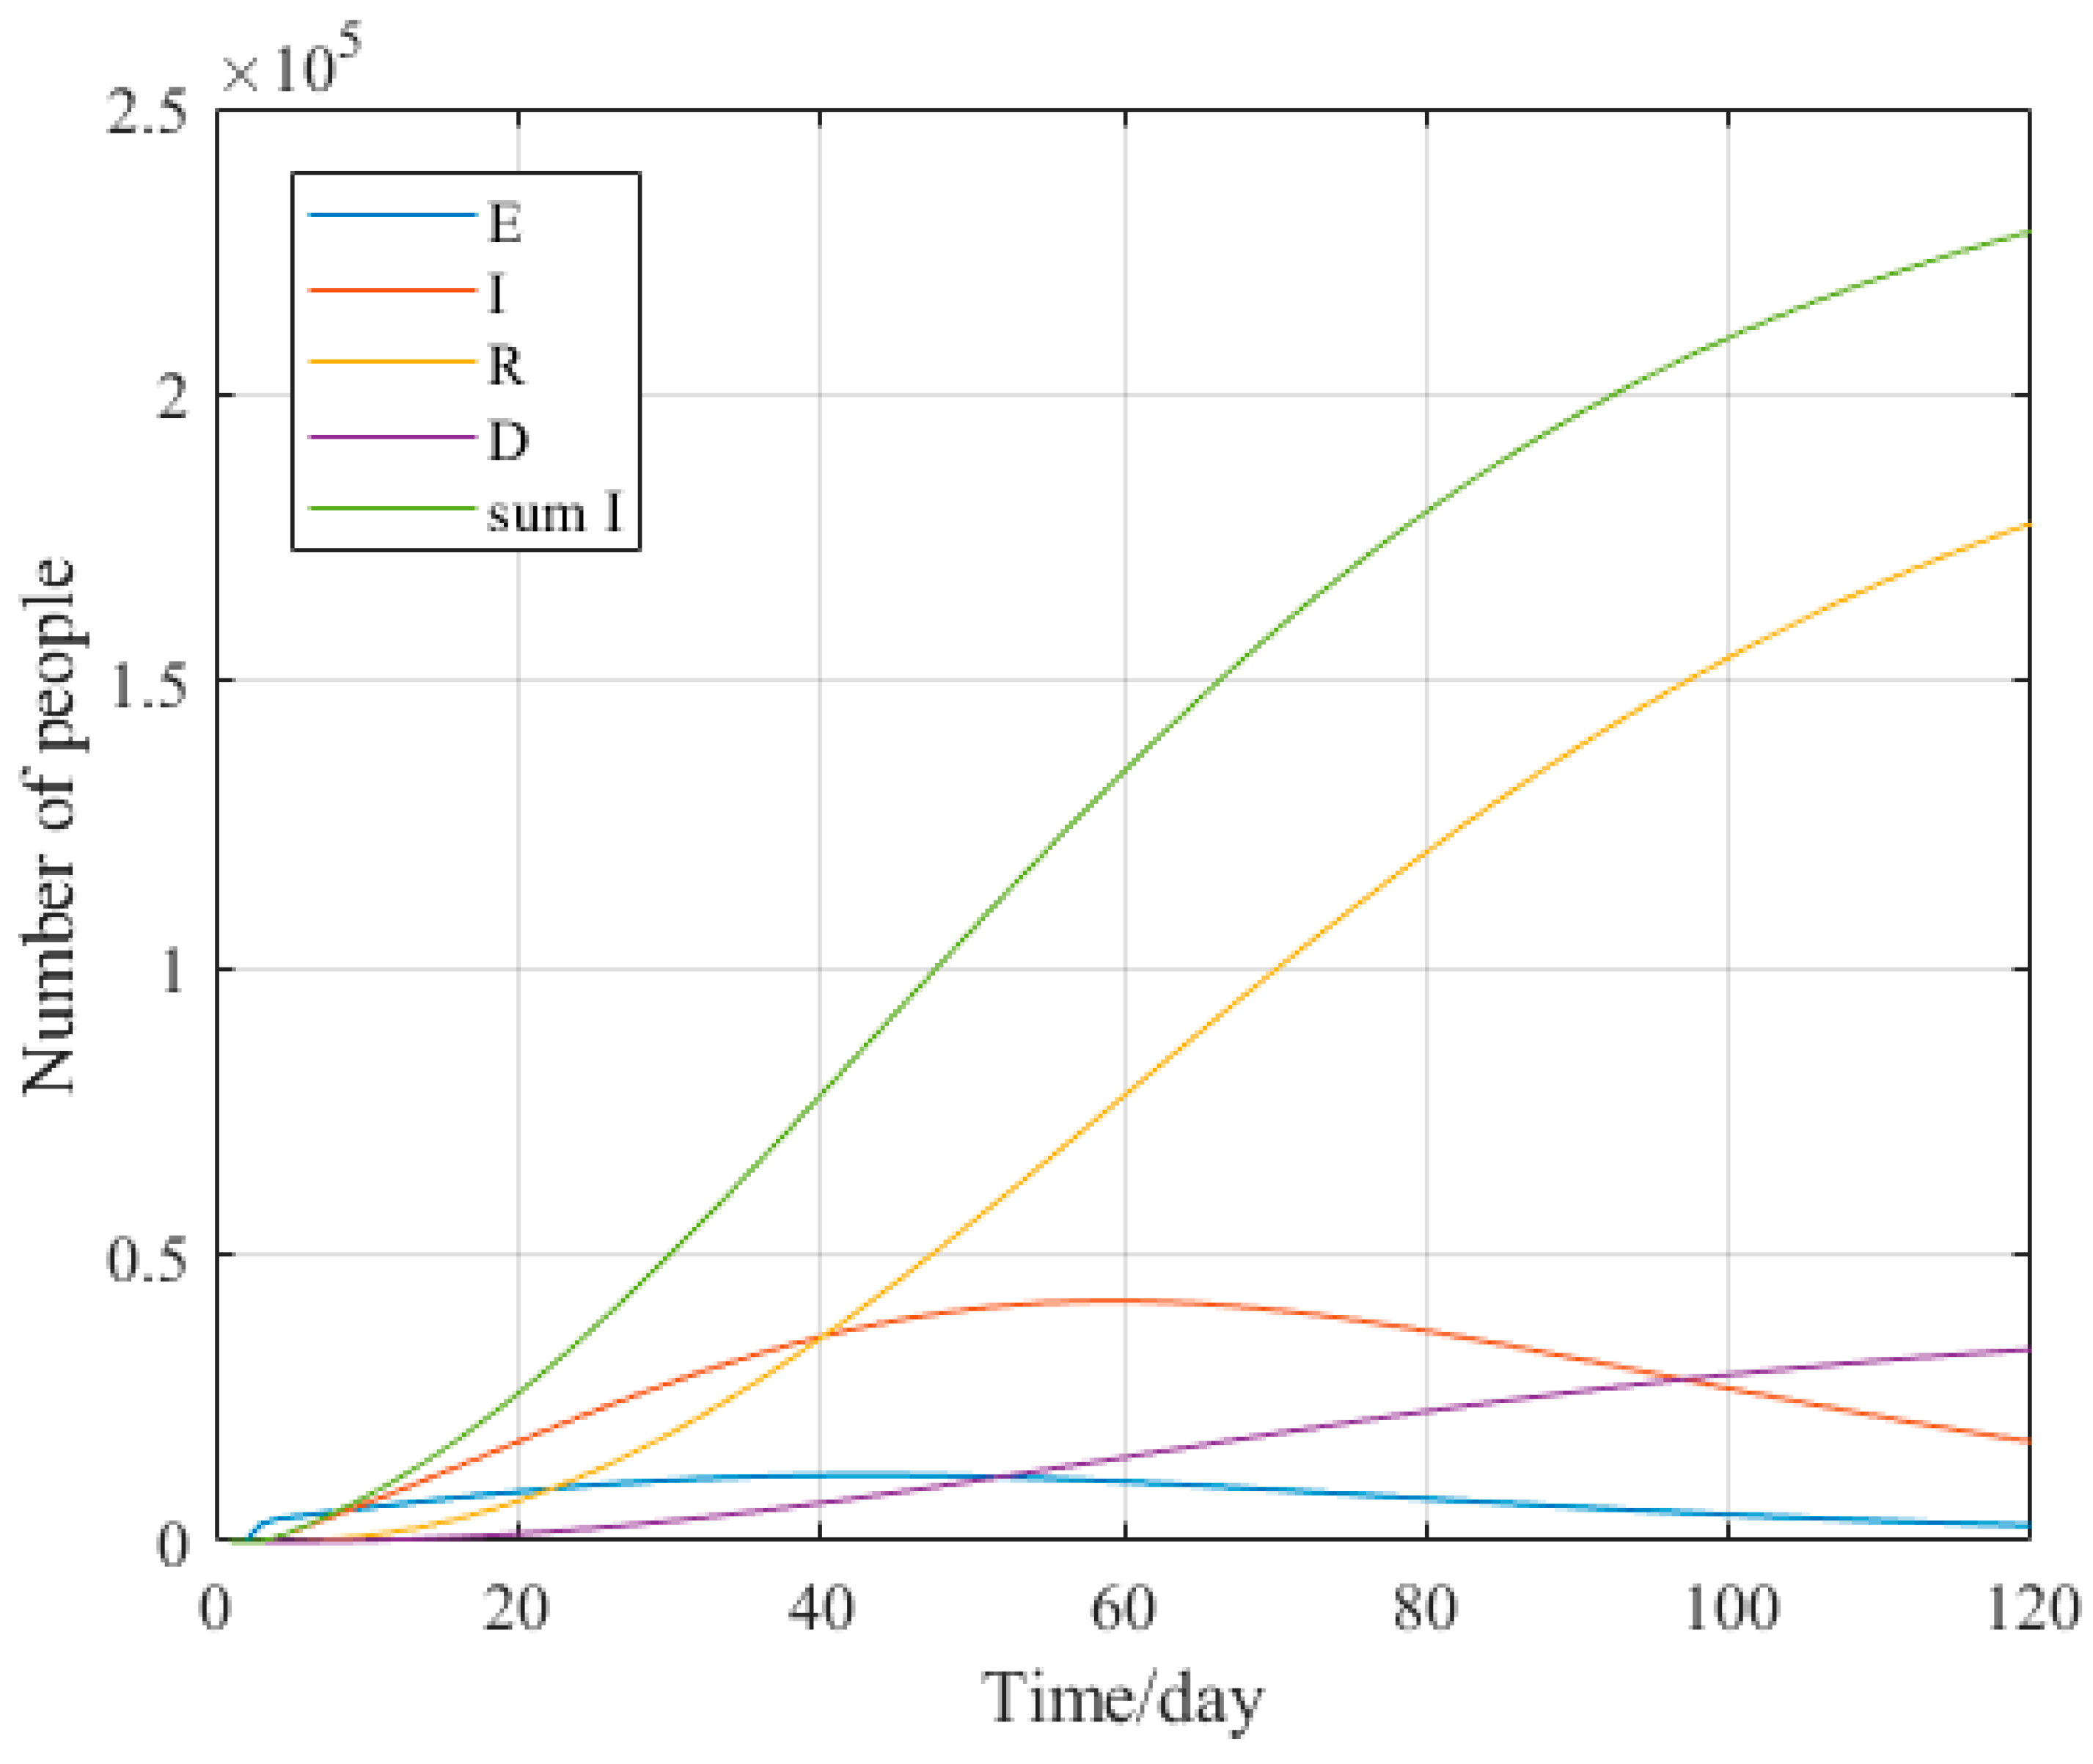
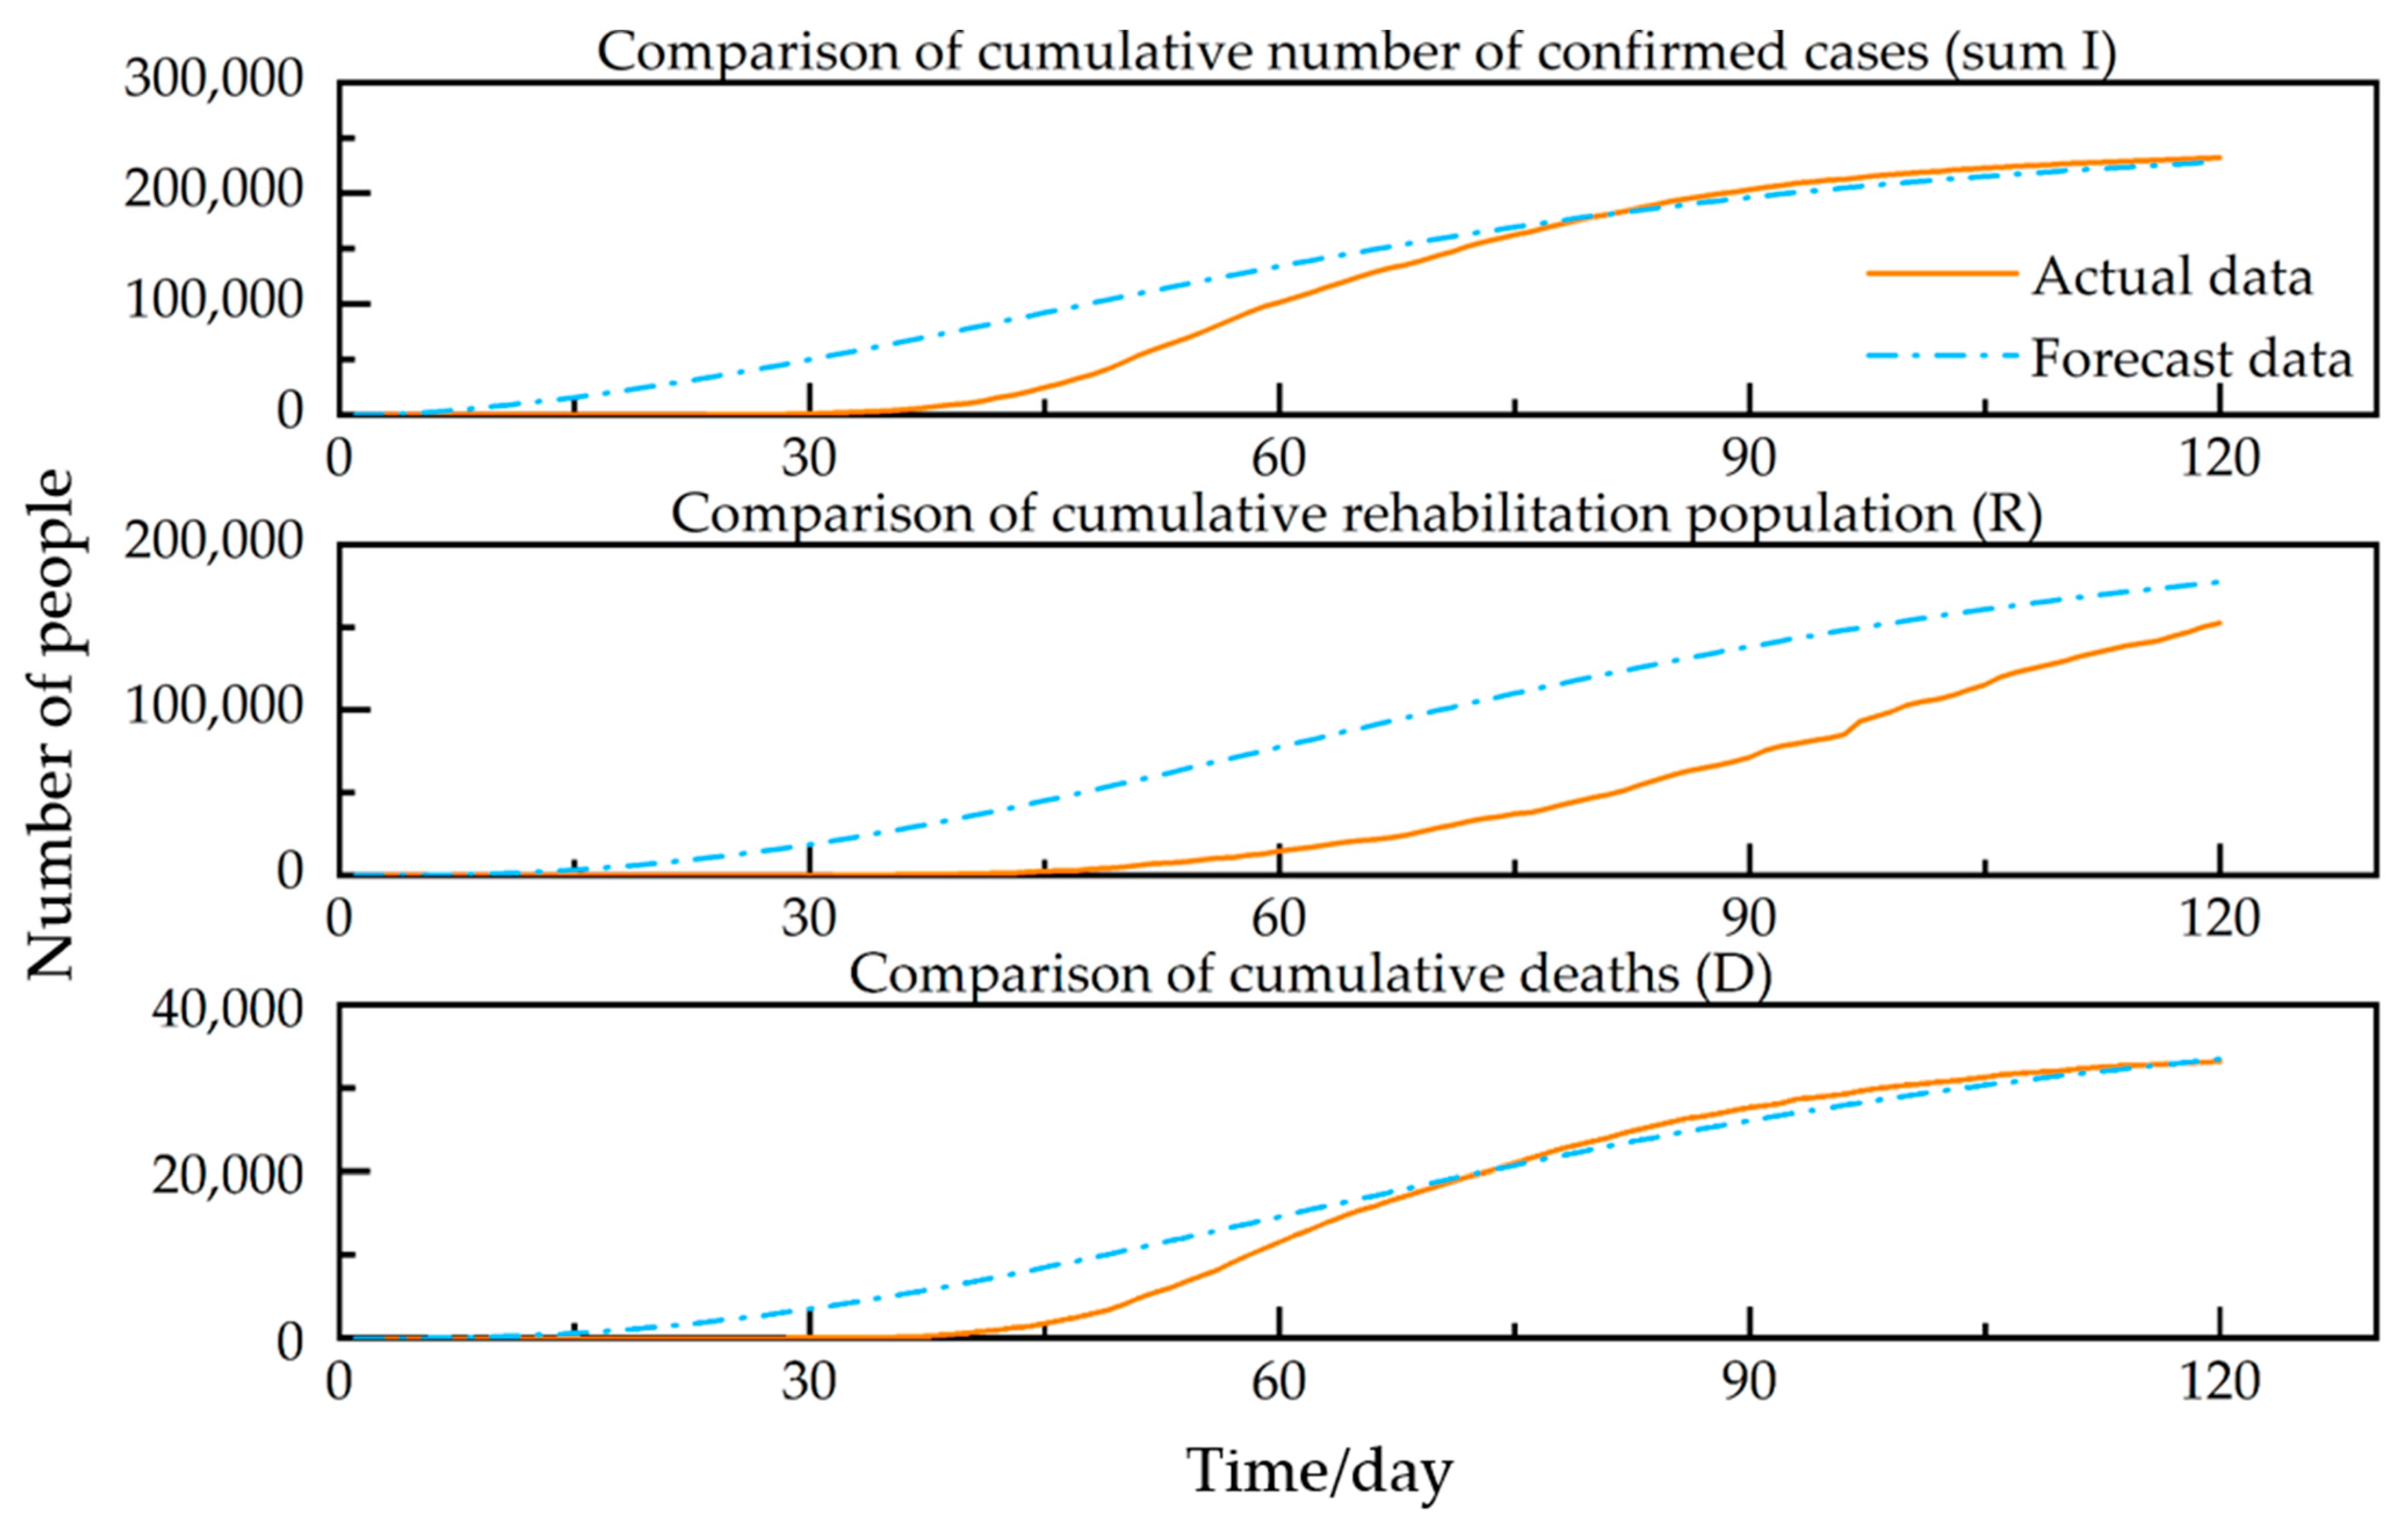
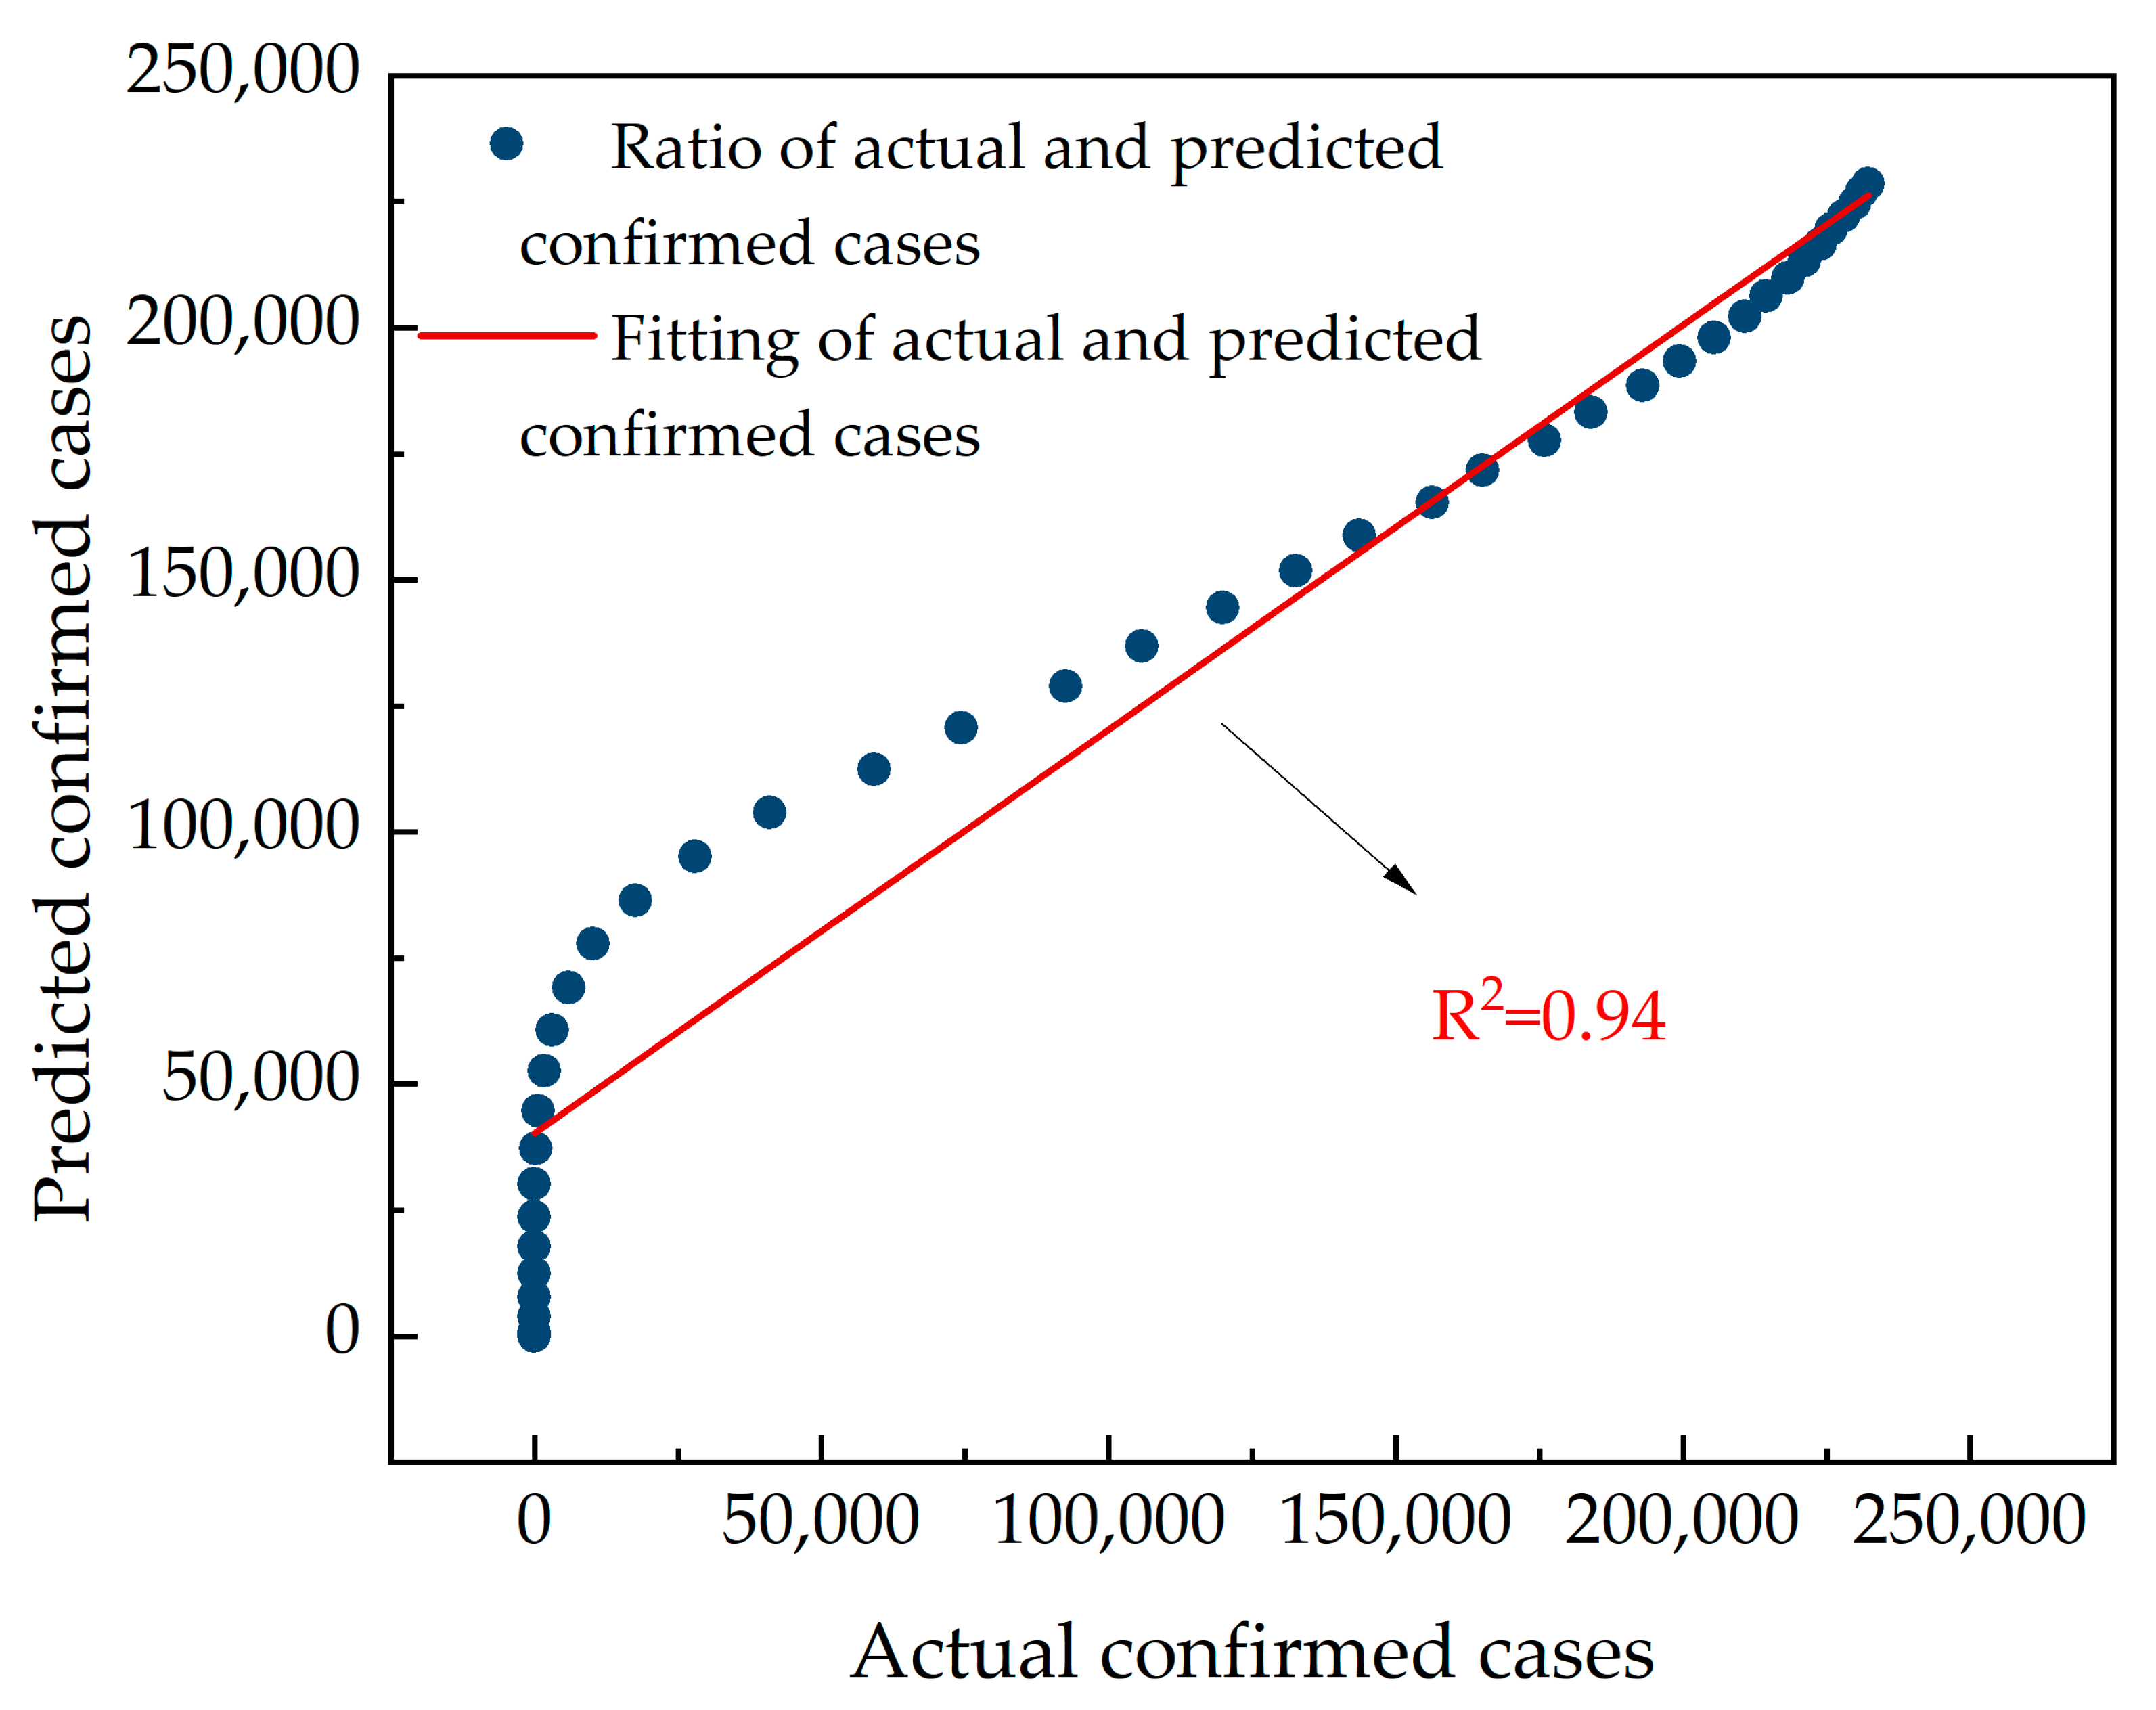
2.3.2. Forecasting Models and Comparative Analysis for China
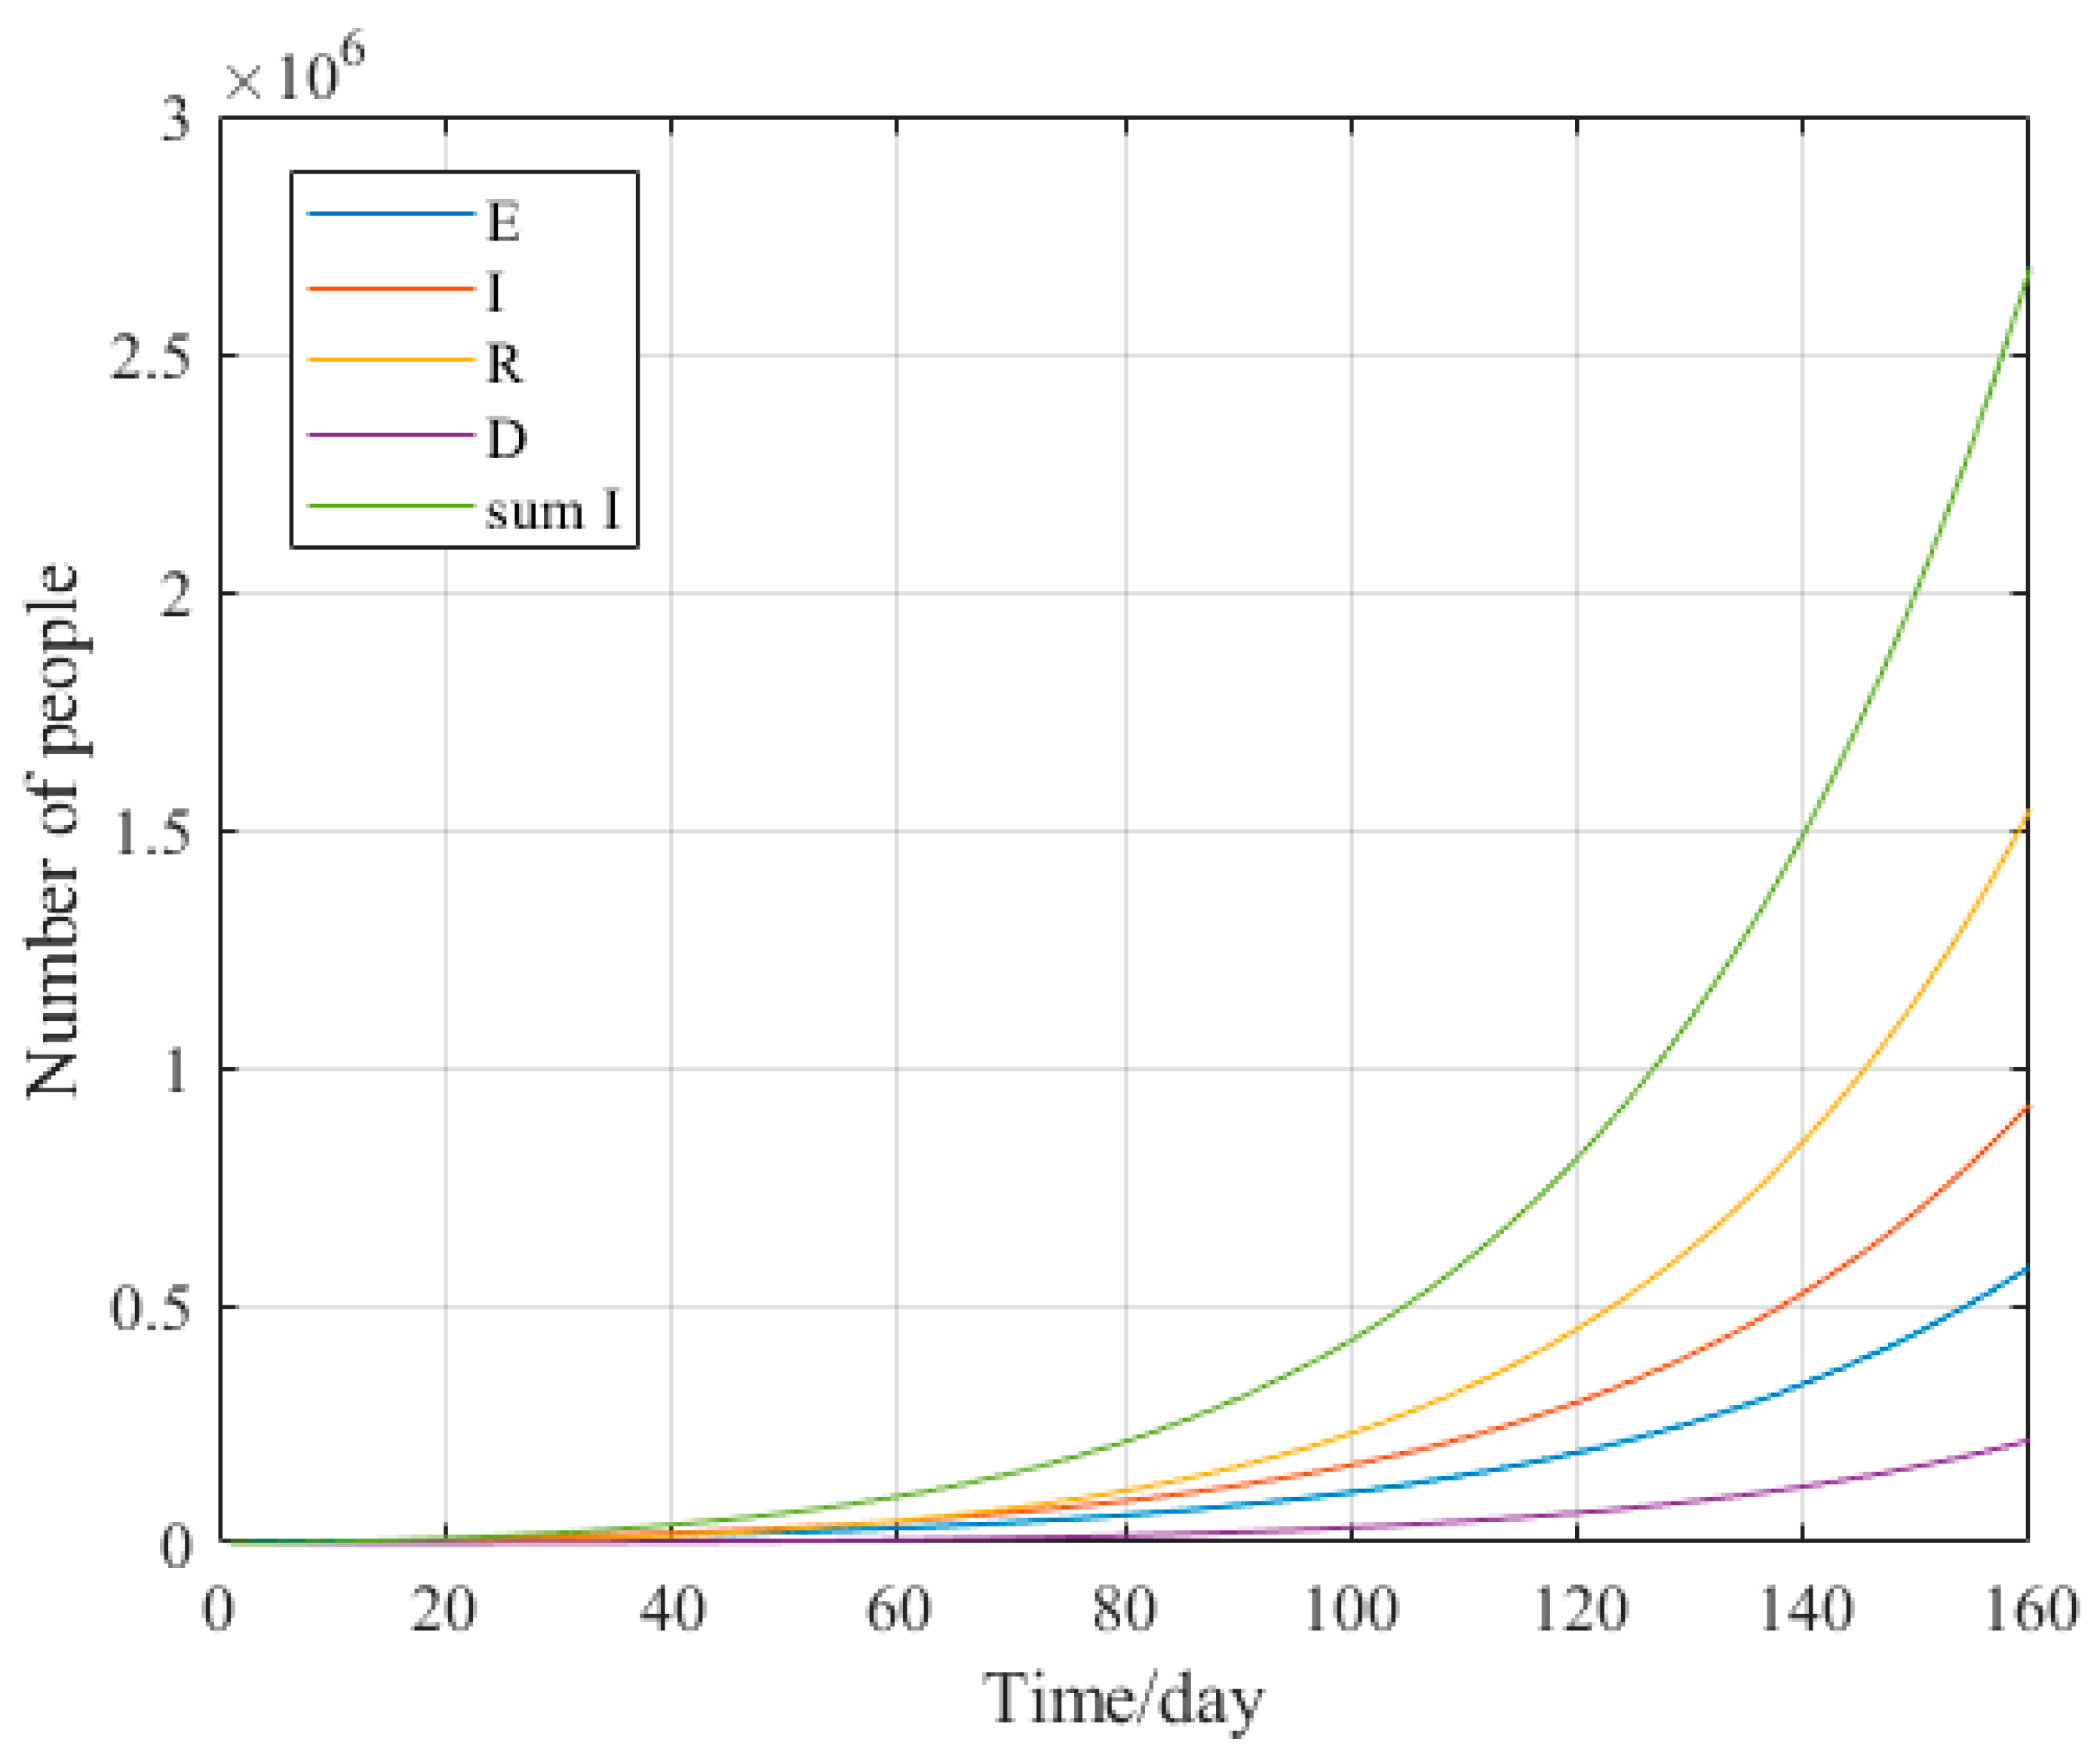
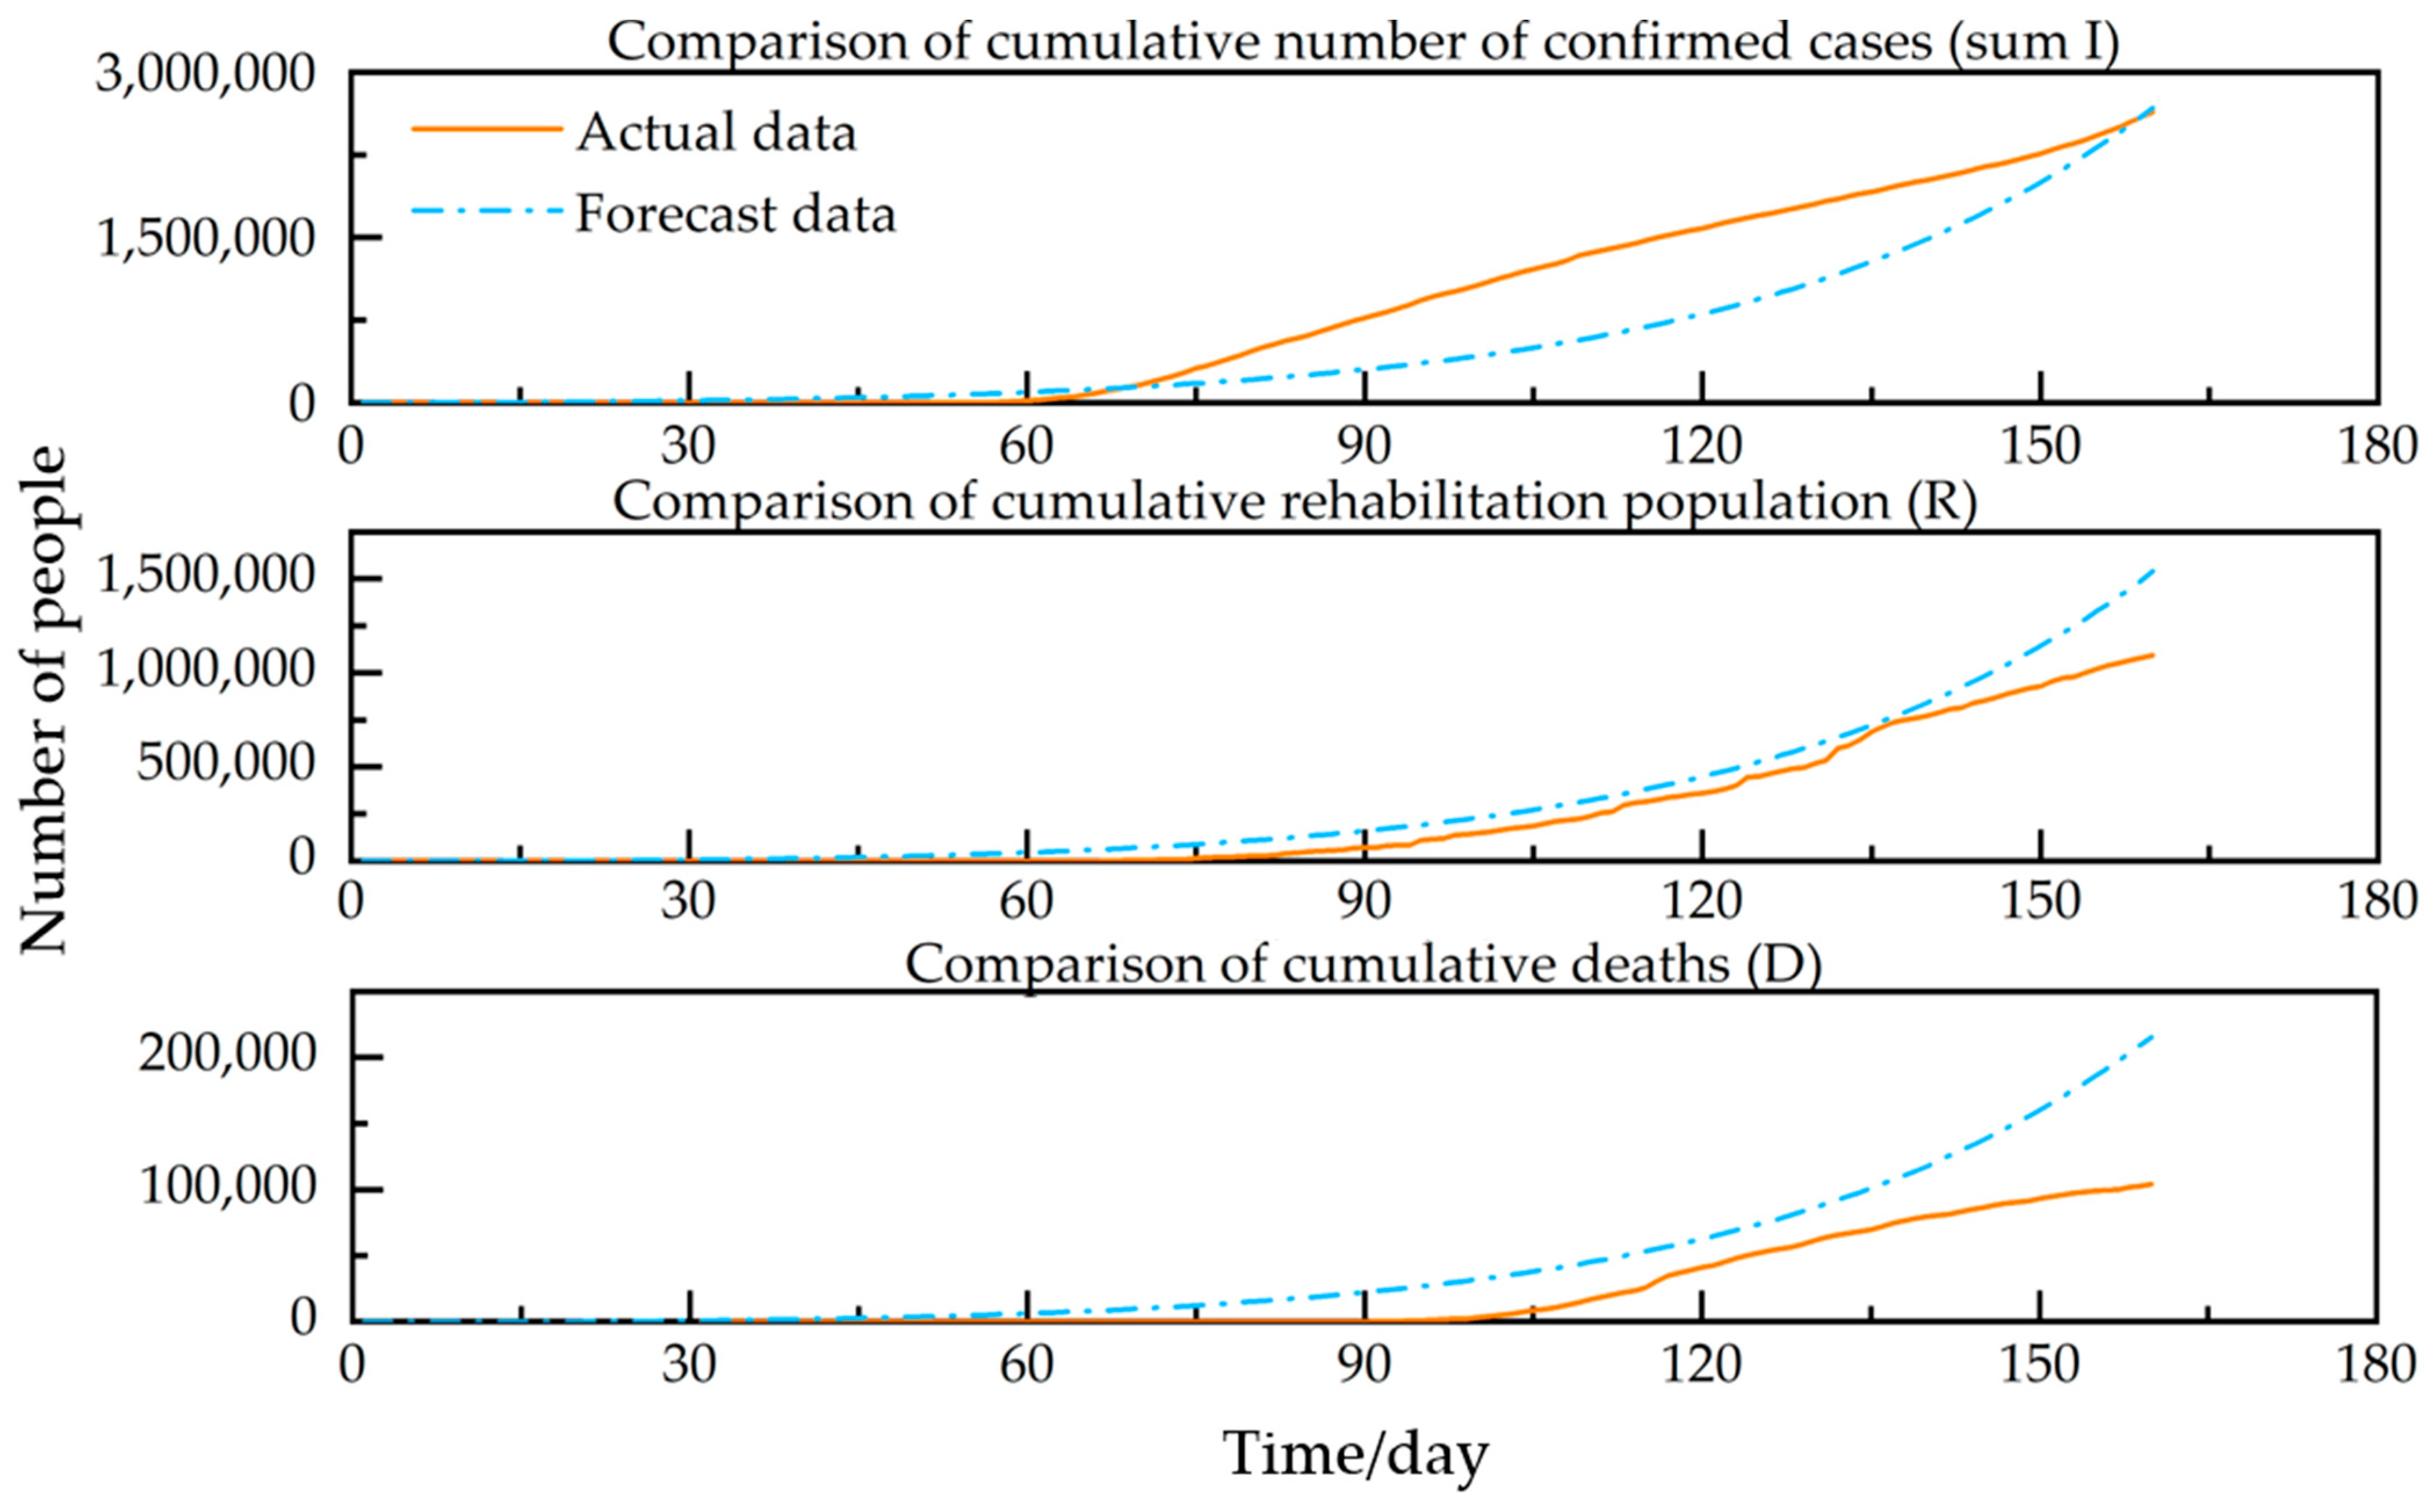
2.3.3. Forecast Models and Comparative Analysis in the USA
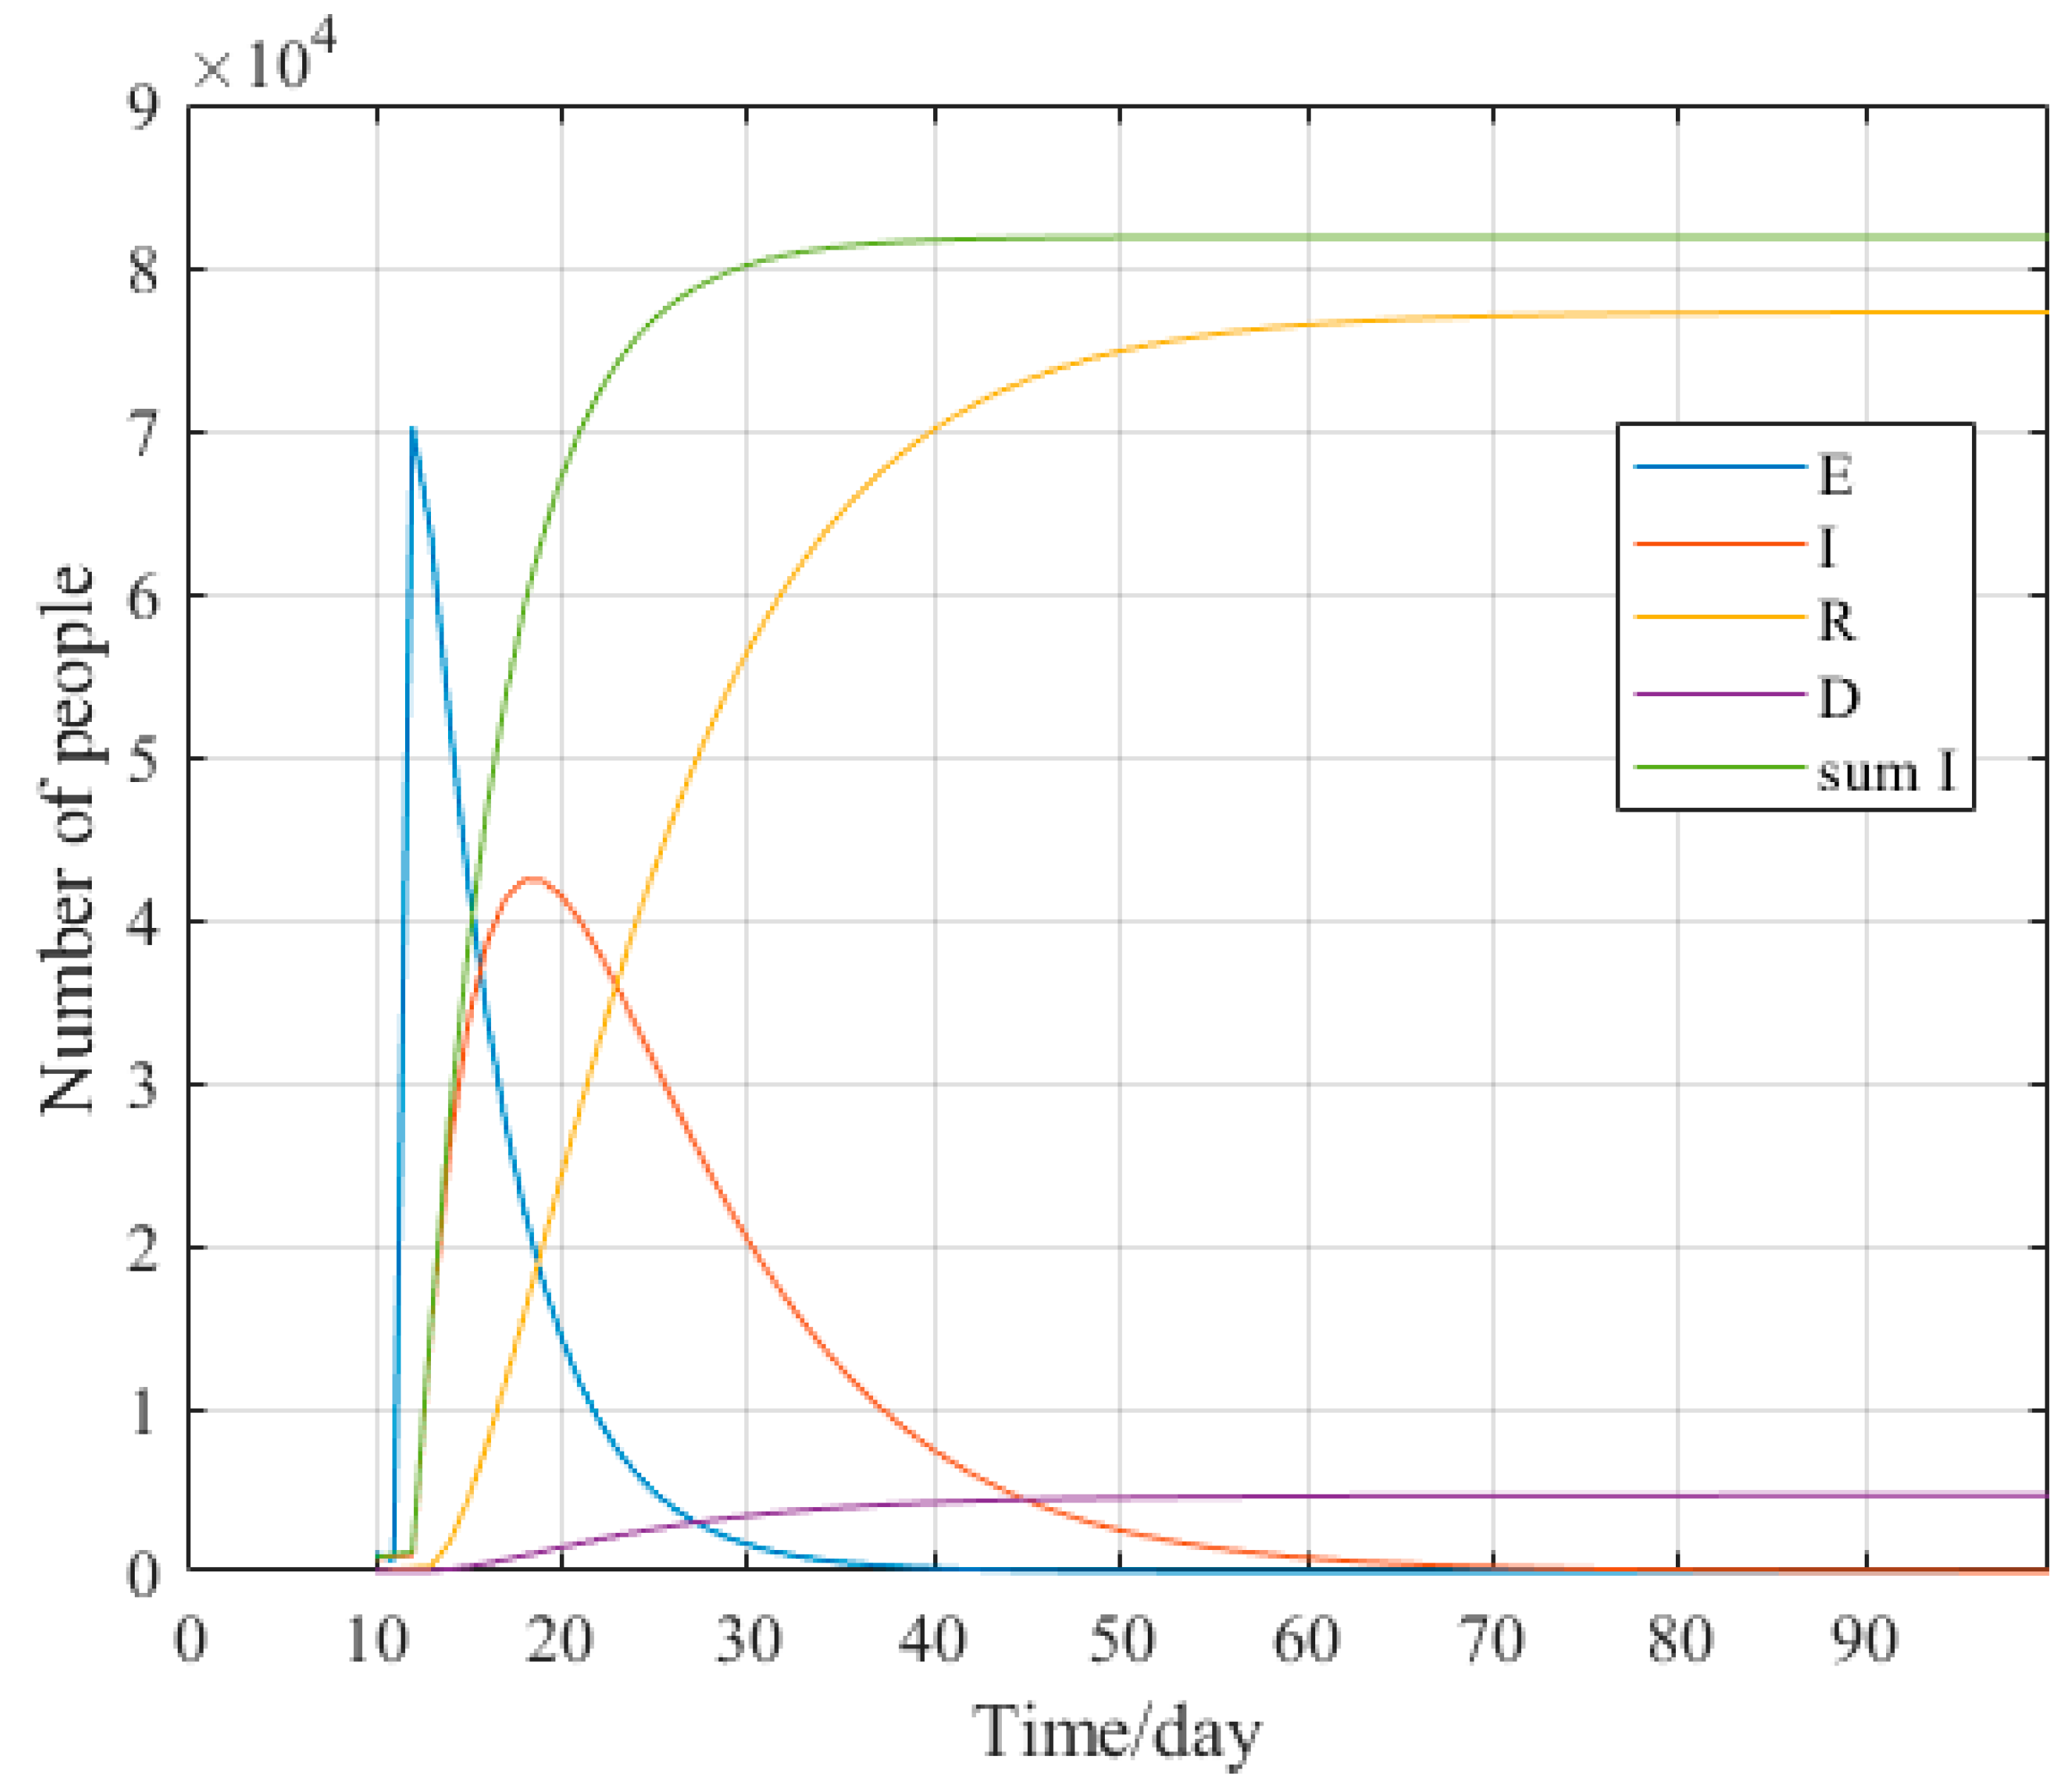
2.3.4. Forecasting Models and Comparative Analysis for Italy
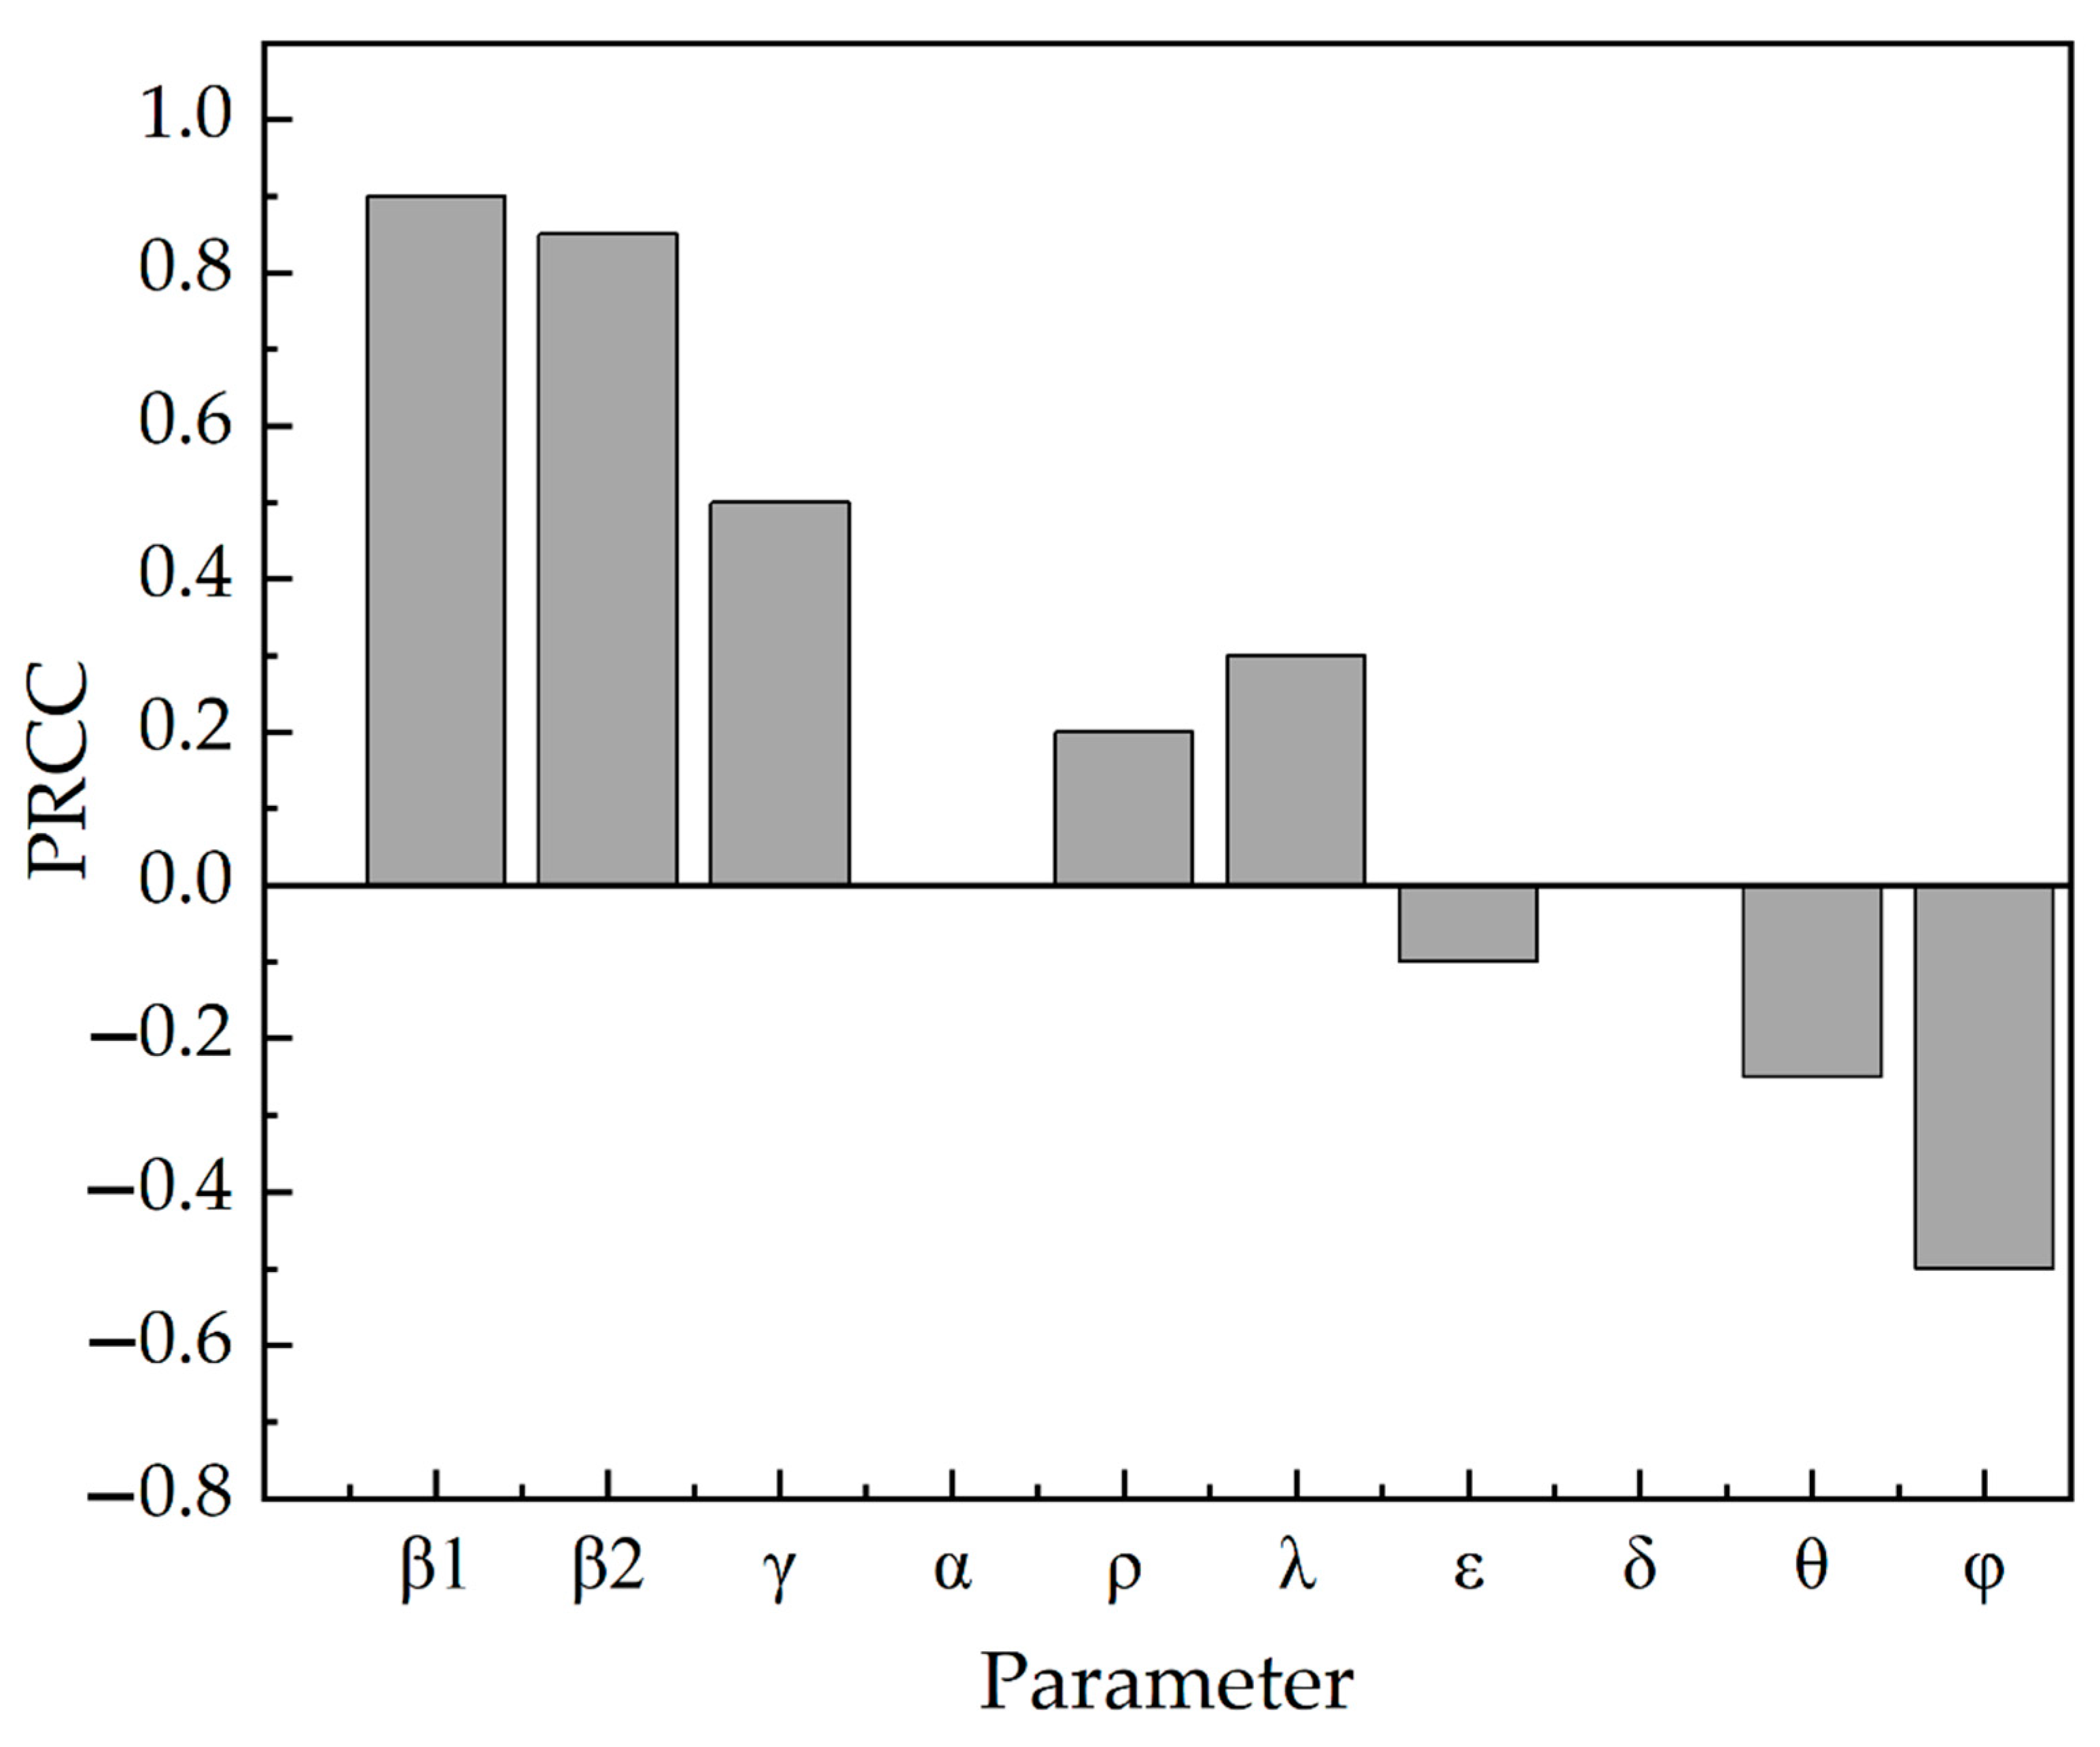
3. Sensitivity Analysis of Important Parameters
4. Emergency Management Measures
- Strengthen the application of information intelligence technology. China has the world’s most extensive information system for epidemic reporting. But it did not play a good role in prevention and control at the early stage of the COVID-19 epidemic. It led to the spread of the epidemic on a large scale. In future epidemic prevention and control, we should focus on isolating close contacts, incubators, and infected persons. Ensure efficient and rapid tracing of close contacts, sub-close contacts, and temporal concomitants of confirmed cases.
- Raise awareness of population protection. This is an essential part of epidemic prevention and control. The critical channels of communication and contact with the news media and the public should be fully utilized to scientifically guide the public’s emotions, mindset, and rational coping behavior. Different types of services should be provided for different target populations, such as psychological support, diversion, and crisis intervention assistance. Improve public mental health literacy, guide the public to protect themselves consciously, and reduce the probability of transmission.
- Strengthen implementation at the level of access to medical care. Ensure the implementation of reasonable and practical arrangements for epidemic surveillance, nucleic acid testing, medical treatment, and emergency disposal. Further, improve the cure rate of confirmed cases and reduce the mortality rate of confirmed cases.
- Strengthen the emergency management of public health safety in universities. In the context of the new pneumonia epidemic, schools, as a place where the density of the population is concentrated, should enhance the construction of infrastructure for public health emergencies to “take precautions and prepare for a rainy day”.
5. Conclusions
- In this paper, the SCEIR infectious disease model was constructed by adding close contacts (C) and self-protectors (P) according to the actual situation of the COVID-19 epidemic. Comparing the SEIR model can root an accurate prediction of the development direction of the epidemic. This provides a reference value for simulating and predicting areas where similar epidemics may occur.
- The influence of each parameter in the SCEIR model on R0, obtained from sensitivity analysis conducted by Anylogic, corresponds to specific epidemic prevention and control measures as follows: tracking close contacts, raising crowd awareness, and media campaigns have a positive influence on R0; home isolation and raising awareness of medical care have a negative influence on R0.
- Based on the impact of various epidemic prevention measures on R0, this paper makes recommendations in terms of strengthening the application of information intelligence technology, using media campaigns to raise awareness of crowd protection, and strengthening the implementation at the level of access to medical care. It provides a reference value for developing reasonable and practical emergency management measures in areas where the epidemic has not yet been controlled.
- Over time, COVID-19 has continued to mutate, with the emergence of Delta and Omicron strains. The natural population birth rate and mortality rate, as well as the migration in and out of the population, were not considered in this paper, and there are some limitations. In the future, the SCEIR model can be further optimized to ensure accurate and effective simulation prediction.
Author Contributions
Funding
Institutional Review Board Statement
Informed Consent Statement
Data Availability Statement
Conflicts of Interest
References
- Lin, Q.; Zhao, S.; Gao, D.; Lou, Y.; Yang, S.; Musa, S.S.; Wang, M.H.; Cai, Y.; Wang, W.; Yang, L.; et al. A conceptual model for the coronavirus disease 2019 (COVID-19) outbreak in Wuhan, China with individual reaction and governmental action. Int. J. Infect. Dis. 2020, 93, 211–216. [Google Scholar] [CrossRef] [PubMed]
- He, S.; Peng, Y.; Sun, K. SEIR modeling of the COVID-19 and its dynamics. Nonlinear Dyn. 2020, 101, 1667–1680. [Google Scholar] [CrossRef] [PubMed]
- Xu, C.; Yu, Y.; Chen, Y.; Lu, Z. Forecast analysis of the epidemics trend of COVID-19 in the USA by a generalized fractional-order SEIR model. Nonlinear Dyn. 2020, 101, 1621–1634. [Google Scholar] [CrossRef] [PubMed]
- Bi, J.; Wang, X.; Hu, Y.; Luo, M.; Zhang, J.; Hu, F.; Ding, Z. A Method for Dynamic Risk Assessment and Prediction of Public Health Emergencies Based on an Improved SEIR Model: Novel Coronavirus COVID-19 in Ten European Countries. J. Geo Inf. Sci. 2021, 23, 259–273. [Google Scholar]
- Engbert, R.; Rabe, M.M.; Kliegl, R.; Reich, S. Sequential Data Assimilation of the Stochastic SEIR Epidemic Model for Regional COVID-19 Dynamics. Bull. Math. Biol. 2020, 83, 1. [Google Scholar] [CrossRef]
- Cooke, K.L.; van den Driessche, P. Analysis of an SEIRS epidemic model with two delays. J. Math. Biol. 1996, 35, 240–260. [Google Scholar] [CrossRef]
- Chinazzi, M.; Davis, J.T.; Ajelli, M.; Gioannini, C.; Litvinova, M.; Merler, S.; Pastore, A.P.Y.; Mu, K.; Rossi, L.; Sun, K.; et al. The effect of travel restrictions on the spread of the 2019 novel coronavirus (COVID-19) outbreak. Science 2020, 368, 395–400. [Google Scholar] [CrossRef]
- Yang, Z.; Zeng, Z.; Wang, K.; Wong, S.-S.; Liang, W.; Zanin, M.; Liu, P.; Cao, X.; Gao, Z.; Mai, Z.; et al. Modified SEIR and AI prediction of the epidemics trend of COVID-19 in China under public health interventions. J. Thorac. Dis. 2020, 12, 165. [Google Scholar] [CrossRef]
- Modi, K.; Umate, L.; Makade, K.; Dubey, R.S.; Agarwal, P. Simulation based study for estimation of COVID-19 spread in India using SEIR model. J. Interdiscip. Math. 2021, 24, 245–258. [Google Scholar] [CrossRef]
- Piovella, N. Analytical solution of SEIR model describing the free spread of the COVID-19 pandemic. Chaos Solitons Fractals 2020, 140, 110243. [Google Scholar] [CrossRef]
- Li, Q.; Guan, X.; Wu, P.; Wang, X.; Zhou, L.; Tong, Y.; Ren, R.; Leung, K.S.M.; Lau, E.H.Y.; Wong, J.Y.; et al. Early Transmission Dynamics in Wuhan, China, of Novel Coronavirus-Infected Pneumonia. N. Engl. J. Med. 2020, 382, 1199–1207. [Google Scholar] [CrossRef] [PubMed]
- Peng, Y.; Sun, K.; He, S.; Peng, D. Parameter Identification of Fractional-Order Discrete Chaotic Systems. Entropy 2019, 21, 27. [Google Scholar] [CrossRef] [PubMed]
- Luo, D.; Qian, H.; Liu, C.; Huang, S. Effect Evaluation of COVID-19 Control Strategy in Different Countries and Periods: Based on Adaptive PSO-SEIR Model. Chin. Sci. Bull. Chin. 2021, 66, 453–464. [Google Scholar] [CrossRef]
- Schneider, K.A.; Ngwa, G.A.; Schwehm, M.; Eichner, L.; Eichner, M. The COVID-19 pandemic preparedness simulation tool: CovidSIM. BMC Infect. Dis. 2020, 20, 859. [Google Scholar] [CrossRef] [PubMed]
- Longini, I.M., Jr.; Halloran, M.E.; Nizam, A.; Yang, Y. Containing pandemic influenza with antiviral agents. Am. J. Epidemiol. 2004, 159, 623–633. [Google Scholar] [CrossRef] [PubMed]
- Zhou, S.; Zhou, S.; Zheng, Z.; Lu, J.; Song, T. Risk assessment for precise intervention of COVID-19 epidemic based on available big data and spatio-temporal simulation method: Empirical evidence from different public places in Guangzhou, China. Appl. Geogr. 2022, 143, 102702. [Google Scholar] [CrossRef] [PubMed]
- Zhou, C.; Zhang, T.; Teng, Y.; Liu, J. COVID-19 Epidemic Prediction based on BPNN and Back-to School Analysis based on SEIR Model in University. Chin. J. Soc. Med. 2020, 37, 581–585. [Google Scholar]
- Zhi, Y.; Chen, J.; Yang, L. Assessment of COVID-19 Epidemic Situation and Prediction of its Development Trend Based on Improved SEIR Model. J. Dongguan Univ. Technol. 2020, 27, 11–16. [Google Scholar] [CrossRef]
- Avadhanula, V.; Piedra, P.A. The Prevention of Common Respiratory Virus Epidemics in 2020–21 during the Severe Acute Respiratory Syndrome Coronavirus 2 (SARS-CoV-2) Pandemic: An Unexpected Benefit of the Implementation of Public Health Measures. Lancet Reg. Health Am. 2021, 2, 100043. [Google Scholar] [CrossRef]
- Naveen, B.R.; Gurtoo, A. Public transport strategy and epidemic prevention framework in the Context of COVID-19. Transp. Policy 2022, 116, 165–174. [Google Scholar] [CrossRef]
- Tang, B.; Xia, F.; Bragazzi, N.L.; McCarthy, Z.; Wang, X.; He, S.; Sun, X.; Tang, S.; Xiao, Y.; Wu, J. Lessons drawn from China and South Korea for managing COVID-19 epidemic: Insights from a comparative modeling study. ISA Trans. 2022, 124, 164–175. [Google Scholar] [CrossRef] [PubMed]
- Fu, L.; Wang, X.; Wang, D.; Griffin, M.A.; Li, P. Human and organizational factors within the public sectors for the prevention and control of epidemic. Saf. Sci. 2020, 131, 104929. [Google Scholar] [CrossRef] [PubMed]
- Adamopoulos, I.; Lamnisos, D.; Syrou, N.; Boustras, G. Public health and work safety pilot study: Inspection of job risks, burn out syndrome and job satisfaction of public health inspectors in Greece. Saf. Sci. 2022, 147, 105592. [Google Scholar] [CrossRef]
- Wu, J.; Wang, K.; He, C.; Huang, X.; Dong, K. Characterizing the patterns of China’s policies against COVID-19: A bibliometric study. Inf. Process. Manag. 2021, 58, 102562. [Google Scholar] [CrossRef] [PubMed]
- Sun, Q.-H.; Su, Y. Psychological crisis intervention for college students during novel coronavirus infection epidemic. Psychiatry Res. 2020, 289, 113043. [Google Scholar] [CrossRef]
- Kong, X.; Liu, F.; Wang, H.; Yang, R.; Chen, D.; Wang, X.; Lu, F.; Rao, H.; Chen, H. Prevention and control measures significantly curbed the SARS-CoV-2 and influenza epidemics in China. J. Virus Erad. 2021, 7, 100040. [Google Scholar] [CrossRef]
- Zhu, X.; Zhou, Y. SEIR Model Based on COVID-19 Early Data. Times Fortune 2020, 12, 239–240. [Google Scholar]
- Postavaru, O.; Anton, S.R.; Toma, A. COVID-19 pandemic and chaos theory. Math. Comput. Simul. 2021, 181, 138–149. [Google Scholar] [CrossRef]
- National Health Commission of the People’s Republic of China. Available online: http://www.nhc.gov.cn/ (accessed on 1 November 2022).
- Johns Hopkins University. Available online: https://www.jhu.edu/ (accessed on 1 November 2022).
- Jia, J. Application of MATLAB in the Simulation of Network Infectious Diseases. Digit. Technol. Appl. 2016, 2, 107–108. [Google Scholar]
- Guo, G.; Li, G.-H. Sensitivity Analysis of a SIR Two Plaque Infectious Disease Model in Public Health Education. J. North Univ. China Nat. Sci. Ed. 2020, 41, 203–208. [Google Scholar]


| Description | ||
|---|---|---|
| variable | Initial susceptible | |
| Initial close contacts | ||
| Initial exposed | ||
| Initial infected | ||
| Initial recovery | ||
| Initial self-protectors | ||
| parameter | Infection rate in contact with E | |
| Infection rate in contact with I | ||
| Conversion rate from exposed persons to infected persons | ||
| Conversion rate from exposed persons to susceptible persons | ||
| Conversion rate from susceptible person to close contact person | ||
| Probability of close contacts being infected | ||
| Conversion rate from close contacts to susceptible persons | ||
| Recovery probability of infected persons | ||
| Death probability of infected person | ||
| Self-isolation rate |
| China | The USA | Italy | |||
|---|---|---|---|---|---|
| Major Measures | Impact Parameters | Major Measures | Impact Parameters | Major Measures | Impact Parameters |
| Track close contacts | Improve the awareness of crowd protection | Improve medical awareness | |||
| Isolate suspected patients | Media publicity | Isolate suspected patients | |||
| Track the footprints of suspected patients | Set up special hospitals | Improve the awareness of crowd protection | |||
| Improve the awareness of crowd protection | Isolate confirmed patients | Media publicity | |||
| Media publicity | Improve medical awareness | Set up special hospitals | |||
| Set up special hospitals | Curfew | Isolate confirmed patients | |||
| Isolate confirmed patients | - | - | Home Isolation | ||
| Improve medical awareness | - | - | State blocking | ||
| Publish diagnosis and treatment plan | - | - | - | - | |
| Home Isolation | - | - | - | - | |
| National blocking | - | - | - | - | |
| Establish module hospitals | - | - | - | - | |
Publisher’s Note: MDPI stays neutral with regard to jurisdictional claims in published maps and institutional affiliations. |
© 2022 by the authors. Licensee MDPI, Basel, Switzerland. This article is an open access article distributed under the terms and conditions of the Creative Commons Attribution (CC BY) license (https://creativecommons.org/licenses/by/4.0/).
Share and Cite
Ni, G.; Wang, Y.; Gong, L.; Ban, J.; Li, Z. Parameters Sensitivity Analysis of COVID-19 Based on the SCEIR Prediction Model. COVID 2022, 2, 1787-1805. https://doi.org/10.3390/covid2120129
Ni G, Wang Y, Gong L, Ban J, Li Z. Parameters Sensitivity Analysis of COVID-19 Based on the SCEIR Prediction Model. COVID. 2022; 2(12):1787-1805. https://doi.org/10.3390/covid2120129
Chicago/Turabian StyleNi, Guanhua, Yan Wang, Li Gong, Jing Ban, and Zhao Li. 2022. "Parameters Sensitivity Analysis of COVID-19 Based on the SCEIR Prediction Model" COVID 2, no. 12: 1787-1805. https://doi.org/10.3390/covid2120129
APA StyleNi, G., Wang, Y., Gong, L., Ban, J., & Li, Z. (2022). Parameters Sensitivity Analysis of COVID-19 Based on the SCEIR Prediction Model. COVID, 2(12), 1787-1805. https://doi.org/10.3390/covid2120129