Abstract
At the end of 2019, COVID-19 outbreaks occurred one after another in countries worldwide. Managing the outbreak efficiently and stably is an essential public health issue facing countries worldwide. In this paper, based on the SEIR model, we propose a SCEIR model that incorporates close contacts (C) and self-protectors (P). Firstly, the epidemic data of China, the USA, and Italy are predicted and compared with the actual data. Secondly, sensitivity analysis of each parameter in the SCEIR model was conducted using Anylogic. The study shows that the SCEIR model established in this paper has a certain validity. The infection rate in contact with E (𝛽) etc., has positive effects on the basic regeneration number (R0); the self-isolation rate (φ) etc., has a negative effect on the basic regeneration number (R0). Emergency management measures are proposed according to the influencing factors corresponding to the model parameters. These can provide theoretical guidance for developing effective epidemic prevention and control measures in areas where the epidemic has not yet been controlled. It also provides some reference for formulating prevention and control policies for similar epidemics that may occur in the future.
1. Introduction
COVID-19 is a worldwide public health emergency. Since its discovery in late December 2019, it has rapidly spread to almost all countries in the world in just a few months. Subsequently, it was declared a significant health hazard by the World Health Organization (WHO) [1]. Italy and the USA are among the most affected countries after China. From the outbreak to the present, the epidemic in China has been steadily controlled. However, there are still many countries where the epidemic is not effectively controlled [2]. More than two years have passed since the first patient was diagnosed with COVID-19. With the continuous mutation of the New Coronavirus, the Delta strain and the Omicron strain has emerged. A new peak of the epidemic was observed in various countries around November 2021. The epidemic has seen a second rebound, posing a significant threat to global public health and the economy [3]. In summary, the COVID-19 epidemic is a significant public health emergency with rapid spread, widespread infection, and great difficulty in prevention and control. It poses a new challenge to the world’s public health emergency management system [4].
Emerging epidemic infectious diseases such as COVID-19 require predictive models to implement precisely adjusted responses. Implementing measures to eliminate or attenuate its profound impact on society [5]. Traditional infectious disease models have become an essential tool in the current analysis of the transmission characteristics of COVID-19. The most common is the SEIR (susceptible-exposed-infected-recovered) model containing an incubation period [6]. Matteo Chinazzi et al. [7] used the global pooled population disease transmission model SEIR to predict the impact of travel restrictions on the domestic and international spread of the outbreak. They showed that travel restrictions delayed the overall outbreak progression by 3 to 5 days in mainland China, and the impact was more pronounced at the international level. Zifeng Yang et al. [8] integrated epidemiological data on COVID-19 into a susceptible exposure infection removal (SEIR) model to predict the outbreak based on a simulation model of SARS data in 2003. Kanak Modi et al. [9] used the SEIR model to find the estimated progression of COVID-19 spread at different basic reproduction numbers (R0) in India and computed a comparison to obtain a weak negative correlation between BCG and elevated body temperature and incidence of COVID-19.
However, the traditional SEIR model does not consider the practical effect of the response measures taken in the fight against the epidemic, so the original model needs to be improved. To improve the simulation, Nicola Piovella [10] derived peak and asymptotic values and their characteristic times for populations affected by COVID-19 by analyzing the SEIR infectious disease model to provide simple analytical expressions. Qun Li et al. [11] described the epidemiology of NCIP by analyzing data from the first 425 laboratory-confirmed cases in Wuhan, China. Yuexi Peng et al. [12] proposed an improved particle swarm optimization parameter identification algorithm to address the shortcomings of existing chaotic synchronization methods for fractional order discrete chaotic systems. It provides a reference value for the improvement of the SEIR model. Danting Luo et al. [13] used an adaptive PSO-SEIR algorithm to compute the inverse of the critical parameters in SEIR using a particle swarm algorithm and then find the key parameters. Kristan A. Schneider et al. [14] proposed a complex extension of the classical SEIR model for evaluating the effects of various interventions. It was obtained that reducing exposure through social distance (e.g., curfew, hygienic behavior, etc.) was also influential in delaying the peak of the epidemic. Ira M. Longini et al. [15] investigated the effectiveness of targeted antiviral prophylaxis to control influenza by using stochastic epidemiological simulations, comparing targeted antiviral prophylaxis with vaccination strategies, and verifying that targeted antiviral prophylaxis has the potential to be an effective measure to contain influenza. Shuli Zhou et al. [16] discussed the intra-urban Spatio-temporal transmission process of COVID-19 in 11 public places in Guangzhou, China. A Spatio-temporal simulation method that can estimate the travel flow within a dynamic city was designed based on the SEIR model using big data and a gravity model. This can help decision-makers to make rapid and accurate risk assessments and implement interventions before outbreaks. Caixia Zhou et al. [17] combined a BP neural network (BPNN) model with an SEIR model to theoretically analyze the timing and mode of resumption of schooling in Chinese universities. Yunchao Zhi et al. [18] discussed the shortcomings of the SEIR model in predicting epidemic development by analyzing the phase change of the basic reproduction number R0.
Regarding emergency management, Vasanthi Avadhanula et al. [19] found through comparative studies that when effective non-pharmacological intervention (NPI) strategies were adopted, the number of illnesses was significantly reduced, and NPI strategies will be an essential component of future respiratory virus pandemic control. B.R. Naveen et al. [20] developed a ridership-driven transportation strategy framework and an epidemic prevention strategy framework based on three mobility principles: flexibility, integrated mobility, and public partnership, by mapping ridership clusters based on passenger travel dynamics. This was used to address the emergency management needs of travel changes due to the new crown pneumonia. Biao Tang et al. [21] conducted a comparative study of COVID-19 outbreaks in three different settings, mainland China, Guangdong Province, China, and South Korea. They developed two models of disease transmission dynamics to obtain: a consistent top-down approach and strict public health emergency management measures were vital to the successful control of COVID-19 outbreaks in China. In South Korea, the critical factor in outbreak prevention and control was an extremely high detection rate of sick patients. Lipeng Fu et al. [22] developed a quantitative model based on the HOF, prediction of associated risk factors, and probability and diagnostic key factors of pandemics within the public sector regarding PCE. By providing a risk assessment model for epidemics or pandemics, providing a risk analysis method for the public health field and helping in the implementation of subsequent emergency management measures. Using a survey of Greek public health inspectors, Ioannis Adamopoulos et al. [23] suggest that job satisfaction is associated with ergonomic risk, with demographic variables being the most robust predictors, which suggests new recommendations for occupational health and safety in the field of public health inspection. Jiang Wu et al. [24] analyzed the characteristics of the Chinese government’s policy model for responding to the new coronary pneumonia and proposed countermeasures for how China should respond to the COVID-19 public health emergencies from the perspective of policy development. Qian-Hui SUN et al. [25] suggested that during this stressful period of “school closure”, it is necessary to focus on school students’ mental health. Teachers should actively help and guide students and provide them with good psychological support. Xiansha Kong et al. [26] analyzed the cumulative confirmation of COVID-19 and influenza cases and found that the implementation of a series of measures to address COVID-19 mitigated the new coronary pneumonia and influenza epidemic in China. The paper suggested that the overall national security concept should be adhered to and the risk awareness and concept of the whole society should be improved, etc. This is good guidance for good epidemic prevention and control.
Therefore, this paper proposes an improved SCEIR model based on the conventional SEIR model, combined with the actual situation of COVID-19 in China, the USA, and Italy. Simulation software such as Matlab and Anylogic were used to analyze the prediction. The cumulative diagnosis, cure, and death data from China, the USA, and Italy were compared and analyzed for sensitivity analysis of the parameters in SCEIR. Based on the analysis results, reasonable and practical emergency management measures were proposed to prevent and control COVID-19.
2. Model Building
2.1. Data Selection
The data for China in this article are from the National Health Commission of China (“NHC”). The data for the remaining countries are from the Johns Hopkins University School of Medicine (JHUSM).
As seen in Figure 1, the countries with the most severe early outbreaks were China and Italy, and the country with the most severe late outbreaks was the USA. Among the pre-epidemic prevention and control in each country, China has the most excellent prevention and control efforts, followed by Italy, and the USA has fewer prevention and control efforts. Therefore, data from three countries, China, the USA, and Italy, were selected for analysis in this paper.
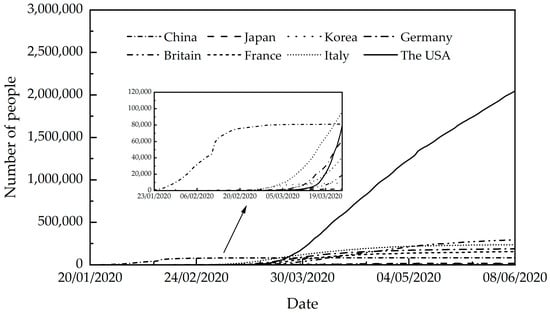
Figure 1.
Cumulative number of confirmed cases in various countries (20 January 2020–8 June 2020) Source: authors.
2.2. SCEIR Model
COVID-19 is a new coronavirus that is different from previous infectious diseases. Its main transmission characteristics are high transmission rate, latent nature, and infectiousness of the population in the latent state. Therefore, the SEIR model is chosen for analysis in this paper. In the traditional SEIR model, the study population is divided into four types: S, E, I, and R. S (Susceptible) represents susceptible people, i.e., healthy people who have never been infected with an infectious virus but can be infected by contact with an infected person; E (Exposed) represents latent people, i.e., susceptible people who are infected with the virus until they develop symptoms; I (Infected) represents infected people, i.e., virus carriers who develop self-perceived or clinically recognizable symptoms during the 14-day incubation period and have a solid ability to transmit the virus to susceptible persons in contact; R (Recovered) represents emigrated persons, i.e., people who have recovered from the completion of treatment of infected persons or died, and recovered persons have antibodies after healing. They are not infected even when in contact with infected persons [27]. The SEIR formula is as follows.
In the infectious disease model, the basic reproduction number R0 is an important measurement parameter. The basic regeneration number is defined as the number of diseases caused by susceptible individuals per infected person during the infection period. The World Health Organization has given the calculation formula of R0 in <2019-nCoV (COVID-19) Basic Supplies Forecasting Tool > R0 = infection period * number of contacts per person per day * Infection probability of each contact. In this paper, the basic reproduction number R0 is obtained through literature. Therefore, the actual calculation in this paper is the infection rate β: infection rate β = basic regeneration number R0/infection period. In COVID-19, the infection period is usually 14 days.
Based on the traditional SEIR model, the description of parameters in Table 1 and the relevant parameter values in Table 2 are used to predict the epidemic situation in China through Matlab to get Figure 2. In Figure 2, sum I is defined as cumulative confirmed patients. Where “β” in the SEIR model is equivalent to “β2” in the SCEIR model.

Table 1.
Description of the SCEIRD model.
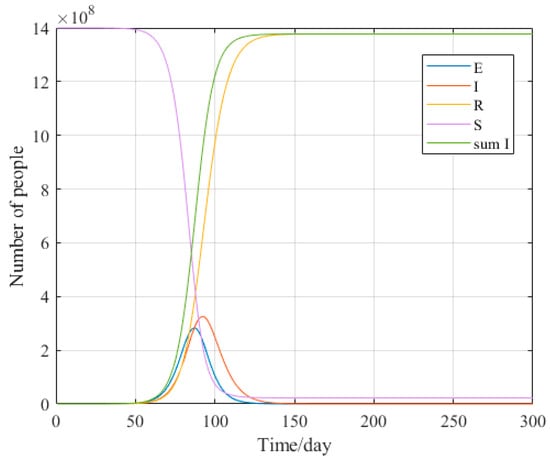
Figure 2.
Trend chart of epidemic situation prediction in China based on SEIR model. Source: authors.
It can be seen from Figure 2 that without any interference, the cumulative confirmed cases predicted by the SEIR model will increase indefinitely until reaching the total population, which is obviously unreasonable. All mathematical models involve simplifications. However, some omitted factors may be crucial [28]. Based on the actual situation in China, the USA, and Italy. In this paper, we propose establishing the SCEIR equation by introducing close contacts (C) and self-protectors (P) and correcting the initial SEIR equation. It is convenient to consider better the actual situation in the early stage of the epidemic. Among them, the exposed (E) include asymptomatic infected persons. The modified definition is as follows.
- (1)
- Introduce C: Close contacts
Close contacts are people who are in contact with suspected or confirmed cases or asymptomatic infected persons. But have not taken effective protective measures.
- (2)
- Introduce P: Self-protectors
Due to the self-isolation and self-protection of the Chinese population, each day, a susceptible person S becomes a less susceptible self-protector P at a rate of φ. A susceptible person is assumed to be safe from infection after becoming a self-isolator. This setting applies only to countries where self-isolation occurs.
- (3)
- R Redefined
In order to intuitively show the recovery rate and mortality rate of COVID-19, the migrants are divided into R recovery patients and D death patients, neither of which is infectious.
Conceptually, the modified model is as follows.
where, St+1, Ct+1, Et+1, It+1, Rt+1, Dt+1 and Pt+1 denote the number of susceptible, close contact, exposed, recovery, and death on day t + 1, respectively, and the subscript t denotes the amount of day-by-day variation. The parameter meanings are referred to in Table 1. The flow chart is shown in Figure 3.


Table 2.
Initial value and parameter value of the SCEIR model.
Table 2.
Initial value and parameter value of the SCEIR model.
| China | Source | The USA | Source | Italy | Source | |
|---|---|---|---|---|---|---|
| 14 billion | [29] | 3.3 billion | [30] | 0.559 billion | [30] | |
| 8420 | [29] | 0 | - | 0 | - | |
| 1072 | [29] | 0 | - | 0 | - | |
| 816 | [29] | 0 | - | 2 | - | |
| 34 | [29] | 0 | - | 0 | - | |
| 25 | [29] | 0 | - | 0 | - | |
| 0 | [29] | 0 | - | 0 | - | |
| 0.15 | [29] | 0.4 | [30] | 0.3 | [30] | |
| 0.15 | [29] | 0.4 | [30] | 0.3 | [30] | |
| 0.2 | OLS | 0.135 | OLS | 0.25 | OLS | |
| 0.8 | OLS | 0.865 | OLS | 0.75 | OLS | |
| 0.001 | OLS | 0.0001 | OLS | 0.001 | OLS | |
| 0.05 | OLS | 0.05 | OLS | 0.05 | OLS | |
| 0.95 | OLS | 0.95 | OLS | 0.95 | OLS | |
| 0.1 | [29] | 0.05 | [30] | 0.053 | [30] | |
| 0.006 | [29] | 0.007 | [30] | 0.01 | [30] | |
| 0.19 | MCMC | - | - | 0.01 | MCMC |
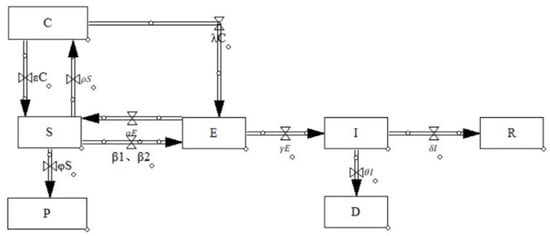
Figure 3.
SCEIR flow chart of COVID-19. Source: authors.
For better analysis, the following assumptions are made in this paper for the proposed SCEIR model: the influences of population inflow and outflow on the model are not considered; the natural mortality rate and the natural growth rate of the population during the period are not considered; E includes asymptomatic infected persons, and the R has antibodies and is no longer sick. Refer to Table 1 for the description of relevant variables and parameters in the SCEIR model.
2.3. Forecasting Models and Comparative Analysis of China, the USA, and Italy
2.3.1. Initial Values of the Model and Selection of Parameters
The initial data for China were obtained from the National Health Commission of China [29]. The initial data for both the USA and Italy were obtained from Johns Hopkins University [30]. The total population of China was 1.4 billion, the total population of the USA was 3.3 billion, and the total population of Italy was 0.559 billion, and N = S + C + E + I + R + D + P. The initial time selected was 23 January 2020.
Some of the parameter values in the SCEIR model are derived from the National Health Commission of China and Johns Hopkins University, and some are estimated using the ordinary least squares (hereinafter referred to as OLS). The OLS is a common classical parameter optimization algorithm. Its principle is to select the parameter that minimizes the sum of squares of errors between the actual value and the model result value as the parameter optimal solution. The specific parameter values are shown in Table 2.
2.3.2. Forecasting Models and Comparative Analysis for China
Matlab is a simulation software with powerful numerical calculations and easy-to-write programs to simulate infectious diseases by stochastic simulation [31]. Based on the epidemic data and parameter values for China listed in Section 2.2, simulations were performed by Matlab. The predicted trend of the epidemic in China can be obtained in Figure 4.
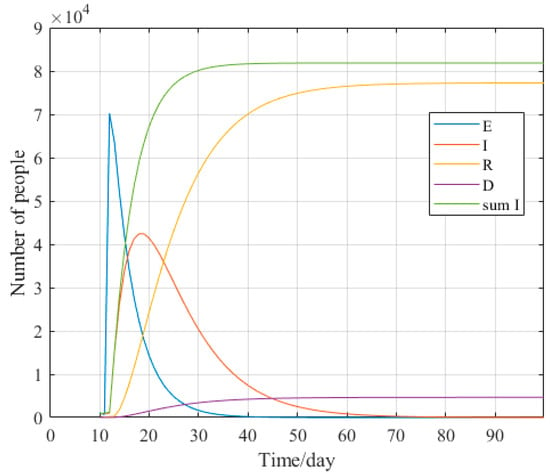
Figure 4.
Trend chart of epidemic situation prediction in China. Source: authors.
The Chinese National Health Commission released data on the China epidemic on 23 January 2020. The epidemic in China stabilized in March, and all confirmed patients in Hubei Province were discharged on 26 April 2020. The overall epidemic in China was steadily controlled, so data from 23 January to 26 April 2020, for a total of 94 days, were selected for comparative analysis.
As seen in Figure 5, the steep increase in cumulative cases on 12 February was due to a change in diagnosis in Hubei Province on that date. Thus approximately 12,000 clinically diagnosed confirmed cases were added to the cumulative number of cases in China on 12 February. This resulted in a significant change in the data. In addition, the Chinese National Health Commission revised the mortality data on 16 April, resulting in a sudden increase in the cumulative number of deaths, similar to the predicted data. The comparison chart shows that the results obtained from the model strongly correlate with the actual data in four aspects: cumulative confirmed cases, newly confirmed cases, recovered cases, and deaths.
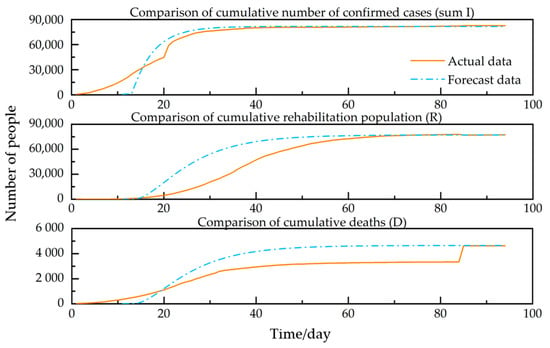
Figure 5.
Comparison of China’s actual data and forecast data. Source: authors.
By comparing the SEIR model and the SCEIR model, as shown in Figure 2 and Figure 4. It can be seen that the SCEIR model proposed in this paper influenced the simulation of the spread of the COVID-19 outbreak. Figure 4 clearly shows that the number of infected individuals (I) is significantly reduced due to self-isolation. According to Figure 5, the cumulative number of confirmed cases reaches its peak at approximately the same time. This observation suggests that the SCEIR model is more accurate than the SEIR model.
To further verify the accuracy of the predicted data, the actual number of confirmed cases and the predicted number of confirmed cases were fit. They analyzed to obtain Figure 6. As shown in Figure 6, the goodness-of-fit (R2) was 0.97, which proved that the actual number of confirmed cases and the predicted number of confirmed cases had a high correlation, indicating that the SCEIR model was effective.
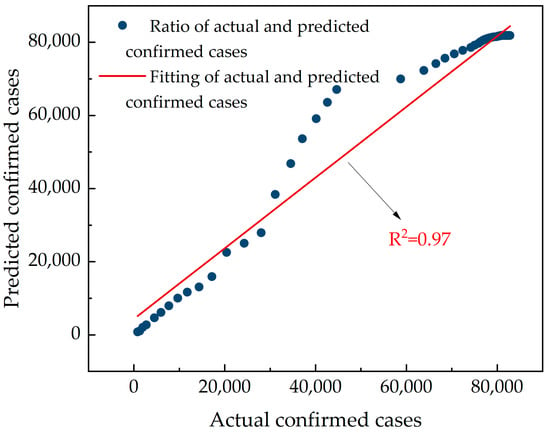
Figure 6.
Fitting chart of actual and predicted confirmed cases in China. Source: authors.
2.3.3. Forecast Models and Comparative Analysis in the USA
Based on the epidemic data and parameter values for the USA listed in Section 2.2 simulations were performed by Matlab. It is possible to obtain the predicted trend of the epidemic in the USA in Figure 7.
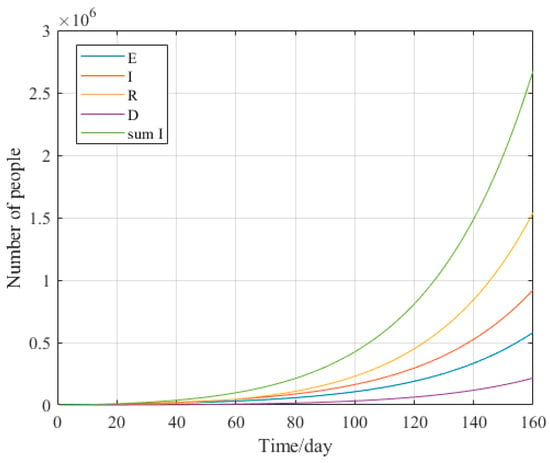
Figure 7.
Trend chart of epidemic situation prediction in the USA. Source: authors.
In the epidemic data released by Johns Hopkins University, the USA data were counted from 21 January 2020. Therefore, we selected data from 21 January to 28 June 2020, for a total of 160 days in the USA, for comparative analysis in this paper.
The results in Figure 8 are generally correlated with the actual data in all three aspects: cumulative confirmed cases, recovered cases, and deaths. The reason for this is the analysis of the slow growth of cumulative confirmed cases in the USA before April. Still, there is exponential growth after April with a slightly more significant difference.
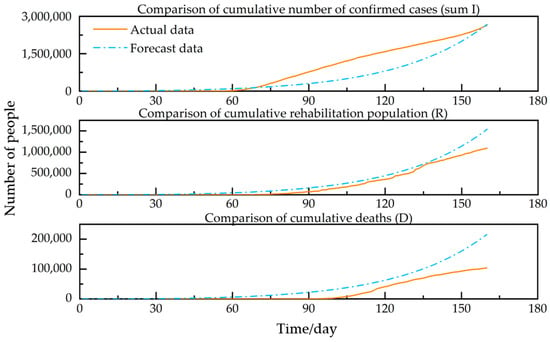
Figure 8.
Comparison of actual data and forecast data in the USA. Source: authors.
A fit analysis of the actual number of confirmed and predicted confirmed cases in the USA was performed to obtain Figure 9. As shown in Figure 9, the goodness-of-fit (R2) was 0.88. Although lower than the goodness-of-fit (R2) for China, it is greater than the general value of 0.8. In summary, there is a high correlation between the actual number of confirmed and predicted confirmed cases in the USA, indicating that the SCEIR model is valid for a country with a trend of COVID-19 outbreak development such as the USA.
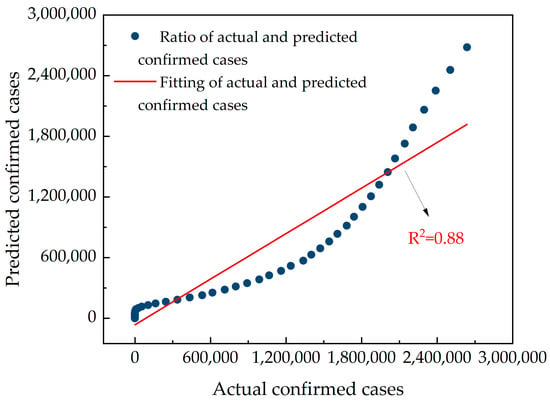
Figure 9.
Fitting chart of actual and predicted confirmed cases in the USA. Source: authors.
2.3.4. Forecasting Models and Comparative Analysis for Italy
Based on the epidemic data and parameter values for the USA listed in Section 2.2, simulations were performed by Matlab. The predictable trend of the Italian epidemic is obtained in Figure 10.
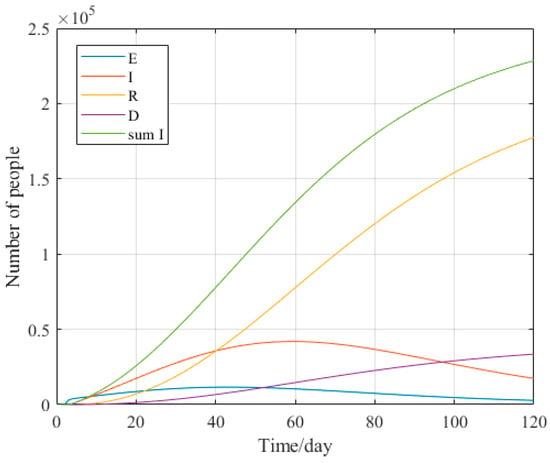
Figure 10.
Trend chart of epidemic situation prediction in Italy. Source: authors.
To facilitate the analysis and comparison of the data for the three countries. This paper selected data for Italy for a total of 120 days, from 31 January to 29 May 2020, for comparative analysis.
The results obtained in Figure 11 are generally correlated with the actual data, although the cumulative number of recoveries is generally correlated with the actual data. However, there is a strong correlation with the actual data in 2 aspects: cumulative confirmed cases and cumulative deaths.
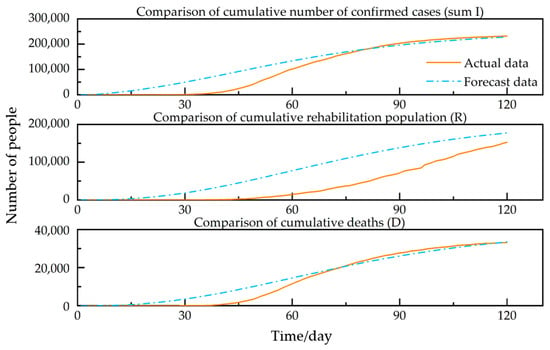
Figure 11.
Comparison between actual data and forecast data in Italy. Source: authors.
A fit analysis of the actual number of confirmed and predicted confirmed cases in Italy was performed to obtain Figure 12. As shown in Figure 12, the goodness-of-fit (R2) was 0.94. This demonstrates a high correlation between the actual number of confirmed and predicted cases in Italy, indicating that the SCEIR model is valid for a country with a trend of COVID-19 epidemic development such as Italy.
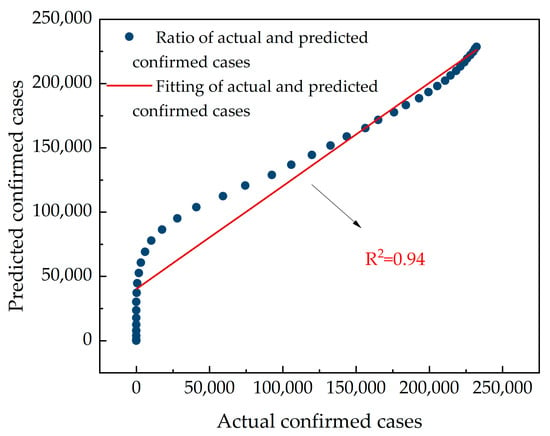
Figure 12.
Fitting chart of actual and predicted confirmed cases in Italy. Source: authors.
The following results can be derived by combining the actual data with the predicted data and the goodness-of-fit for the three countries. Although there is some error in the SCEIR model, the overall predicted data are reasonable. This provides a particular reference for future epidemic prediction work.
3. Sensitivity Analysis of Important Parameters
China carried out strict outbreak prevention and control measures from the very beginning of the outbreak. Prevention and control measures include, but were not limited to, tracing of close contacts and suspected patients, isolation of suspected patients, and setting up specialized hospitals for admission and treatment. Among these measures, establishing module hospitals was China’s first prevention and control measure and played an essential role in preventing and controlling the epidemic. China is also the first country to echo home isolation and national containment, providing a reference solution for global epidemic prevention and control.
The epidemic in the USA was very weak in the early stages, so the epidemic was not well controlled, leading to an out-of-control epidemic in the later stages. The USA had no home quarantine policy in the early stages, and some states later implemented “no-footing” and “curfew” policies. However, the implementation effect is not very good. Therefore, this paper does not consider self-protectors in the USA SCEIR model. The epidemic in the USA is still on the rise due to the inadequacy of prevention measures.
Italy is the second country with a severe outbreak after China. During the first wave of the epidemic, the Italian government borrowed from China’s epidemic prevention policies, and the prevention was effective. However, a new outbreak started in Italy in November 2020 and December 2021.
The main epidemic prevention measures in China, the USA, and Italy are listed in Table 2 by synthesizing the three countries’ epidemic prevention policies and actual implementation. The impact parameters in the SCEIR model corresponding to the epidemic prevention measures are marked in Table 3.

Table 3.
Major epidemic prevention measures and their impact parameters in China, the USA and Italy.
As the table shows, raising awareness of population protection, setting up specialized hospitals, isolating confirmed patients, raising awareness of medical care, media campaigns, and home isolation are the standard preventive measures in the three countries. Among them, ρ, β1, β2, δ and φ appear more frequently, and γ, α, λ, ε, and θ appear less frequently.
To determine the dependence of each parameter on the basic reproduction number R0, a sensitivity analysis of each parameter was performed using Anylogic. The analysis was used to determine the effect of each parameter on the actual data. Sensitivity analysis involves identifying the relationship between input and predicted parameters through a series of tests using different input parameters to see how changes in the predicted parameter values affect the system’s dynamic behavior [32]. Anylogic’s ranking corresponds directly to the degree of statistical influence. A positive value indicates that an increase in this parameter leads to an increase in R0. In contrast, a negative value indicates that an increase in this parameter leads to a decrease in R0. As shown in Figure 13, among these parameters, ρ, β1, β2, λ and γ have a positive effect on R0, α, ε, θ, δ and φ have a negative effect on R0.
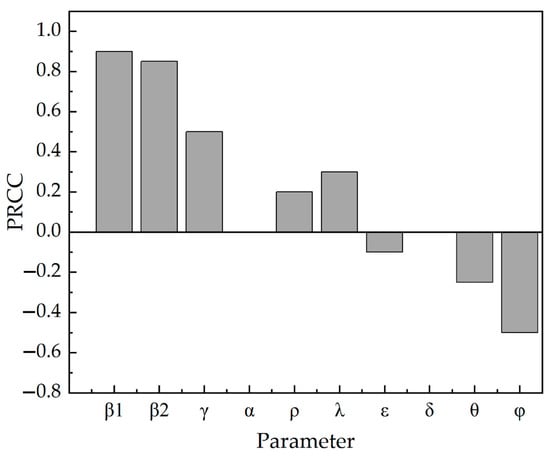
Figure 13.
Sensitivity analysis of parameters in SCEIR. Source: authors.
According to the three countries’ epidemic prevention and control measures, it can be seen that the differential parameter between the USA and Italy compared with China, except for the first Chinese square cabin hospital, is φ. It can also be seen from Figure 13 that the self-isolation rate φ has a negative effect on the basic reproduction number R0. Therefore, this paper estimates the self-isolation rate that can be achieved in the USA and Italy. The predicted data after enhancing the self-isolation rate in the USA and Italy are obtained by calculation. The predicted results are shown in Figure 14.
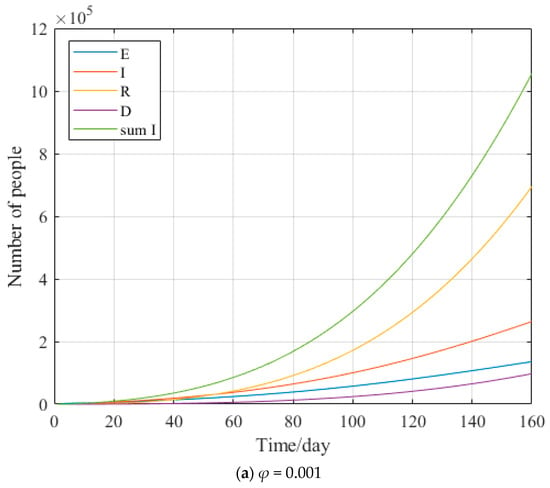
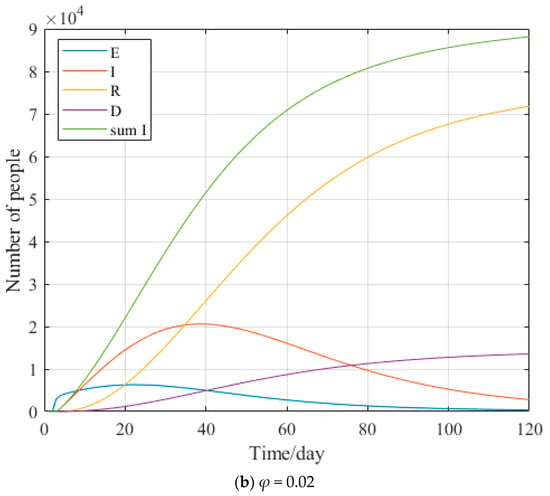
Figure 14.
The USA (a) Italy (b) Prediction chart after enhancement φ. Source: authors.
As seen in Figure 15, when increasing the self-isolation rate to 0.001 in the USA and 0.02 in Italy, the cumulative number of confirmed cases can decrease by nearly 2/3.
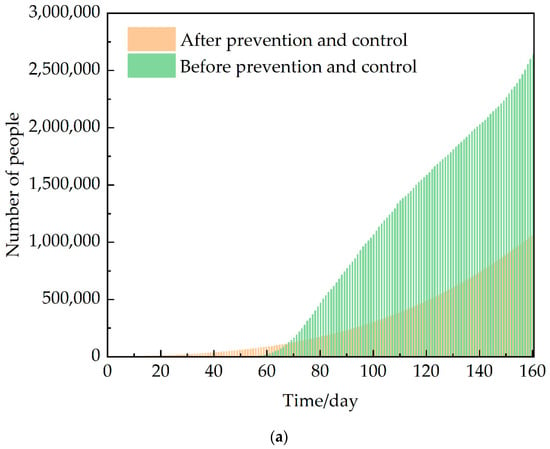
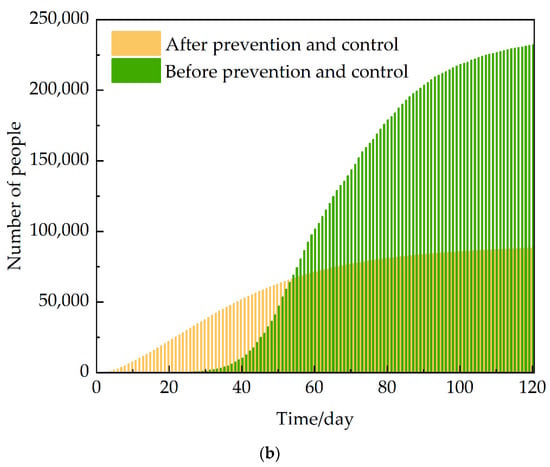
Figure 15.
The USA (a) Italy (b) Comparison chart of cumulative diagnosis after enhanced φ. Source: authors.
4. Emergency Management Measures
According to the sensitivity analysis conducted by Anylogic for each parameter in the SCEIR model, we obtained that ρ, β1, β2, λ and γ had positive effects on R0, and α, ε, θ, δ and φ had negative effects on R0. According to the influence of various parameters on R0, the following suggestions on COVID-19 emergency management measures are proposed.
- Strengthen the application of information intelligence technology. China has the world’s most extensive information system for epidemic reporting. But it did not play a good role in prevention and control at the early stage of the COVID-19 epidemic. It led to the spread of the epidemic on a large scale. In future epidemic prevention and control, we should focus on isolating close contacts, incubators, and infected persons. Ensure efficient and rapid tracing of close contacts, sub-close contacts, and temporal concomitants of confirmed cases.
- Raise awareness of population protection. This is an essential part of epidemic prevention and control. The critical channels of communication and contact with the news media and the public should be fully utilized to scientifically guide the public’s emotions, mindset, and rational coping behavior. Different types of services should be provided for different target populations, such as psychological support, diversion, and crisis intervention assistance. Improve public mental health literacy, guide the public to protect themselves consciously, and reduce the probability of transmission.
- Strengthen implementation at the level of access to medical care. Ensure the implementation of reasonable and practical arrangements for epidemic surveillance, nucleic acid testing, medical treatment, and emergency disposal. Further, improve the cure rate of confirmed cases and reduce the mortality rate of confirmed cases.
- Strengthen the emergency management of public health safety in universities. In the context of the new pneumonia epidemic, schools, as a place where the density of the population is concentrated, should enhance the construction of infrastructure for public health emergencies to “take precautions and prepare for a rainy day”.
5. Conclusions
- In this paper, the SCEIR infectious disease model was constructed by adding close contacts (C) and self-protectors (P) according to the actual situation of the COVID-19 epidemic. Comparing the SEIR model can root an accurate prediction of the development direction of the epidemic. This provides a reference value for simulating and predicting areas where similar epidemics may occur.
- The influence of each parameter in the SCEIR model on R0, obtained from sensitivity analysis conducted by Anylogic, corresponds to specific epidemic prevention and control measures as follows: tracking close contacts, raising crowd awareness, and media campaigns have a positive influence on R0; home isolation and raising awareness of medical care have a negative influence on R0.
- Based on the impact of various epidemic prevention measures on R0, this paper makes recommendations in terms of strengthening the application of information intelligence technology, using media campaigns to raise awareness of crowd protection, and strengthening the implementation at the level of access to medical care. It provides a reference value for developing reasonable and practical emergency management measures in areas where the epidemic has not yet been controlled.
- Over time, COVID-19 has continued to mutate, with the emergence of Delta and Omicron strains. The natural population birth rate and mortality rate, as well as the migration in and out of the population, were not considered in this paper, and there are some limitations. In the future, the SCEIR model can be further optimized to ensure accurate and effective simulation prediction.
Author Contributions
Conceptualization, Y.W. and G.N.; methodology, Y.W.; software, Y.W. and Z.L.; formal analysis, Y.W. and G.N.; investigation, Y.W. and L.G.; data curation, Y.W.; writing—original draft preparation, Y.W.; writing—review and editing, Y.W. and G.N.; supervision, Y.W.; project administration, Y.W. and J.B.; funding acquisition, Y.W. and G.N. All authors have read and agreed to the published version of the manuscript.
Funding
This work is financially supported by the National Natural Science Foundation of China (Nos. 52174192 and 51934004), the Shandong Provincial Natural Science Foundation (No. ZR2021YQ37), the Youth Innovation Science and Technology Program of Higher Education in Shandong Province (2021KJ011) and the China Postdoctoral Science Foundation (No. 2019T120599).
Institutional Review Board Statement
Not applicable.
Informed Consent Statement
Not applicable.
Data Availability Statement
Datasets generated during the current study are available from the corresponding author upon reasonable request.
Conflicts of Interest
The authors declare no conflict of interest.
References
- Lin, Q.; Zhao, S.; Gao, D.; Lou, Y.; Yang, S.; Musa, S.S.; Wang, M.H.; Cai, Y.; Wang, W.; Yang, L.; et al. A conceptual model for the coronavirus disease 2019 (COVID-19) outbreak in Wuhan, China with individual reaction and governmental action. Int. J. Infect. Dis. 2020, 93, 211–216. [Google Scholar] [CrossRef] [PubMed]
- He, S.; Peng, Y.; Sun, K. SEIR modeling of the COVID-19 and its dynamics. Nonlinear Dyn. 2020, 101, 1667–1680. [Google Scholar] [CrossRef] [PubMed]
- Xu, C.; Yu, Y.; Chen, Y.; Lu, Z. Forecast analysis of the epidemics trend of COVID-19 in the USA by a generalized fractional-order SEIR model. Nonlinear Dyn. 2020, 101, 1621–1634. [Google Scholar] [CrossRef] [PubMed]
- Bi, J.; Wang, X.; Hu, Y.; Luo, M.; Zhang, J.; Hu, F.; Ding, Z. A Method for Dynamic Risk Assessment and Prediction of Public Health Emergencies Based on an Improved SEIR Model: Novel Coronavirus COVID-19 in Ten European Countries. J. Geo Inf. Sci. 2021, 23, 259–273. [Google Scholar]
- Engbert, R.; Rabe, M.M.; Kliegl, R.; Reich, S. Sequential Data Assimilation of the Stochastic SEIR Epidemic Model for Regional COVID-19 Dynamics. Bull. Math. Biol. 2020, 83, 1. [Google Scholar] [CrossRef]
- Cooke, K.L.; van den Driessche, P. Analysis of an SEIRS epidemic model with two delays. J. Math. Biol. 1996, 35, 240–260. [Google Scholar] [CrossRef]
- Chinazzi, M.; Davis, J.T.; Ajelli, M.; Gioannini, C.; Litvinova, M.; Merler, S.; Pastore, A.P.Y.; Mu, K.; Rossi, L.; Sun, K.; et al. The effect of travel restrictions on the spread of the 2019 novel coronavirus (COVID-19) outbreak. Science 2020, 368, 395–400. [Google Scholar] [CrossRef]
- Yang, Z.; Zeng, Z.; Wang, K.; Wong, S.-S.; Liang, W.; Zanin, M.; Liu, P.; Cao, X.; Gao, Z.; Mai, Z.; et al. Modified SEIR and AI prediction of the epidemics trend of COVID-19 in China under public health interventions. J. Thorac. Dis. 2020, 12, 165. [Google Scholar] [CrossRef]
- Modi, K.; Umate, L.; Makade, K.; Dubey, R.S.; Agarwal, P. Simulation based study for estimation of COVID-19 spread in India using SEIR model. J. Interdiscip. Math. 2021, 24, 245–258. [Google Scholar] [CrossRef]
- Piovella, N. Analytical solution of SEIR model describing the free spread of the COVID-19 pandemic. Chaos Solitons Fractals 2020, 140, 110243. [Google Scholar] [CrossRef]
- Li, Q.; Guan, X.; Wu, P.; Wang, X.; Zhou, L.; Tong, Y.; Ren, R.; Leung, K.S.M.; Lau, E.H.Y.; Wong, J.Y.; et al. Early Transmission Dynamics in Wuhan, China, of Novel Coronavirus-Infected Pneumonia. N. Engl. J. Med. 2020, 382, 1199–1207. [Google Scholar] [CrossRef] [PubMed]
- Peng, Y.; Sun, K.; He, S.; Peng, D. Parameter Identification of Fractional-Order Discrete Chaotic Systems. Entropy 2019, 21, 27. [Google Scholar] [CrossRef] [PubMed]
- Luo, D.; Qian, H.; Liu, C.; Huang, S. Effect Evaluation of COVID-19 Control Strategy in Different Countries and Periods: Based on Adaptive PSO-SEIR Model. Chin. Sci. Bull. Chin. 2021, 66, 453–464. [Google Scholar] [CrossRef]
- Schneider, K.A.; Ngwa, G.A.; Schwehm, M.; Eichner, L.; Eichner, M. The COVID-19 pandemic preparedness simulation tool: CovidSIM. BMC Infect. Dis. 2020, 20, 859. [Google Scholar] [CrossRef] [PubMed]
- Longini, I.M., Jr.; Halloran, M.E.; Nizam, A.; Yang, Y. Containing pandemic influenza with antiviral agents. Am. J. Epidemiol. 2004, 159, 623–633. [Google Scholar] [CrossRef] [PubMed]
- Zhou, S.; Zhou, S.; Zheng, Z.; Lu, J.; Song, T. Risk assessment for precise intervention of COVID-19 epidemic based on available big data and spatio-temporal simulation method: Empirical evidence from different public places in Guangzhou, China. Appl. Geogr. 2022, 143, 102702. [Google Scholar] [CrossRef] [PubMed]
- Zhou, C.; Zhang, T.; Teng, Y.; Liu, J. COVID-19 Epidemic Prediction based on BPNN and Back-to School Analysis based on SEIR Model in University. Chin. J. Soc. Med. 2020, 37, 581–585. [Google Scholar]
- Zhi, Y.; Chen, J.; Yang, L. Assessment of COVID-19 Epidemic Situation and Prediction of its Development Trend Based on Improved SEIR Model. J. Dongguan Univ. Technol. 2020, 27, 11–16. [Google Scholar] [CrossRef]
- Avadhanula, V.; Piedra, P.A. The Prevention of Common Respiratory Virus Epidemics in 2020–21 during the Severe Acute Respiratory Syndrome Coronavirus 2 (SARS-CoV-2) Pandemic: An Unexpected Benefit of the Implementation of Public Health Measures. Lancet Reg. Health Am. 2021, 2, 100043. [Google Scholar] [CrossRef]
- Naveen, B.R.; Gurtoo, A. Public transport strategy and epidemic prevention framework in the Context of COVID-19. Transp. Policy 2022, 116, 165–174. [Google Scholar] [CrossRef]
- Tang, B.; Xia, F.; Bragazzi, N.L.; McCarthy, Z.; Wang, X.; He, S.; Sun, X.; Tang, S.; Xiao, Y.; Wu, J. Lessons drawn from China and South Korea for managing COVID-19 epidemic: Insights from a comparative modeling study. ISA Trans. 2022, 124, 164–175. [Google Scholar] [CrossRef] [PubMed]
- Fu, L.; Wang, X.; Wang, D.; Griffin, M.A.; Li, P. Human and organizational factors within the public sectors for the prevention and control of epidemic. Saf. Sci. 2020, 131, 104929. [Google Scholar] [CrossRef] [PubMed]
- Adamopoulos, I.; Lamnisos, D.; Syrou, N.; Boustras, G. Public health and work safety pilot study: Inspection of job risks, burn out syndrome and job satisfaction of public health inspectors in Greece. Saf. Sci. 2022, 147, 105592. [Google Scholar] [CrossRef]
- Wu, J.; Wang, K.; He, C.; Huang, X.; Dong, K. Characterizing the patterns of China’s policies against COVID-19: A bibliometric study. Inf. Process. Manag. 2021, 58, 102562. [Google Scholar] [CrossRef] [PubMed]
- Sun, Q.-H.; Su, Y. Psychological crisis intervention for college students during novel coronavirus infection epidemic. Psychiatry Res. 2020, 289, 113043. [Google Scholar] [CrossRef]
- Kong, X.; Liu, F.; Wang, H.; Yang, R.; Chen, D.; Wang, X.; Lu, F.; Rao, H.; Chen, H. Prevention and control measures significantly curbed the SARS-CoV-2 and influenza epidemics in China. J. Virus Erad. 2021, 7, 100040. [Google Scholar] [CrossRef]
- Zhu, X.; Zhou, Y. SEIR Model Based on COVID-19 Early Data. Times Fortune 2020, 12, 239–240. [Google Scholar]
- Postavaru, O.; Anton, S.R.; Toma, A. COVID-19 pandemic and chaos theory. Math. Comput. Simul. 2021, 181, 138–149. [Google Scholar] [CrossRef]
- National Health Commission of the People’s Republic of China. Available online: http://www.nhc.gov.cn/ (accessed on 1 November 2022).
- Johns Hopkins University. Available online: https://www.jhu.edu/ (accessed on 1 November 2022).
- Jia, J. Application of MATLAB in the Simulation of Network Infectious Diseases. Digit. Technol. Appl. 2016, 2, 107–108. [Google Scholar]
- Guo, G.; Li, G.-H. Sensitivity Analysis of a SIR Two Plaque Infectious Disease Model in Public Health Education. J. North Univ. China Nat. Sci. Ed. 2020, 41, 203–208. [Google Scholar]
Publisher’s Note: MDPI stays neutral with regard to jurisdictional claims in published maps and institutional affiliations. |
© 2022 by the authors. Licensee MDPI, Basel, Switzerland. This article is an open access article distributed under the terms and conditions of the Creative Commons Attribution (CC BY) license (https://creativecommons.org/licenses/by/4.0/).