Article

A Descriptive Analysis of the Impact of COVID-19 on Emergency Department Attendance and Visit Characteristics in Singapore

by
Mei Qiu Lim
1,*,
Seyed Ehsan Saffari
2,
Andrew Fu Wah Ho
3,
Johannes Nathaniel Min Hui Liew
1,
Boon Kiat Kenneth Tan
3,
Nicole Simin Sim
3,
Yuzeng Shen
3,
Fahad Javaid Siddiqui
4,† and
Marcus Eng Hock Ong
3,4,†
1
Duke-NUS Medical School, 8 College Road, Singapore 169857, Singapore
2
Centre for Quantitative Medicine, Health Services and Systems Research, Duke-NUS Medical School, 8 College Road, Singapore 169857, Singapore
3
Department of Emergency Medicine, Singapore General Hospital, 1 Hospital Crescent, Outram Road, Singapore 169608, Singapore
4
Prehospital and Emergency Research Centre, Health Services and Systems Research, Duke-NUS Medical School, 8 College Road, Singapore 169857, Singapore
*
Author to whom correspondence should be addressed.
These authors contributed equally to this work.
COVID 2021, 1(4), 739-750; https://doi.org/10.3390/covid1040059
Submission received: 14 October 2021 / Revised: 23 November 2021 / Accepted: 1 December 2021 / Published: 6 December 2021

Abstract

:
Background: The coronavirus disease 2019 (COVID-19) has impacted the utilisation of Emergency Department (ED) services worldwide. This study aims to describe the changes in attendance at a single ED and corresponding patient visit characteristics before and during the COVID-19 period. Methods: In a single-centre retrospective cohort study, we used descriptive statistics to compare ED attendance, patient demographics and visit characteristics during the COVID-19 period (1 January–28 June 2020) and its corresponding historical period in 2019 (2 January–30 June 2019). Results: The mean ED attendance decreased from 342 visits/day in the pre-COVID-19 period to 297 visits/day in the COVID-19 period. This was accompanied by a decline in presentations in nearly every ICD-10-CM diagnosis category except for respiratory-related diseases. Notably, we observed reductions in visits by critically ill patients and severe disease presentations during the COVID-19 period. We also noted a shift in the ED patient case-mix from ‘Non-fever’ cases to ‘Fever’ cases, likely giving rise to two distinct trough-to-peak visit patterns during the pre-Circuit Breaker and Circuit Breaker period. Conclusions: This descriptive study revealed distinct ED visit trends across different time periods. The COVID-19 pandemic caused a reduction in ED attendances amongst patients with low-acuity conditions and those with highest priority for emergency care. This raises concern about treatment-seeking delays and the possible impact on health outcomes. The downward trend in low-acuity presentations also presents learning opportunities for ED crowd management planning in a post-COVID-19 era.

1. Introduction

The coronavirus disease 2019 (COVID-19) has impacted the utilisation of Emergency Department (ED) services worldwide. Despite the surge in suspected COVID-19 cases, there is global evidence to show that the overall daily attendance at EDs has declined [1,2,3,4]. Several studies have described significant reductions in visits associated with time-sensitive and life-threatening conditions such as acute myocardial infarctions and strokes [5,6,7], suggesting a worrying trend of patients with acute medical conditions failing to seek critically needed hospital care.
Singapore saw its first COVID-19 case on 23 January 2020. Although COVID-19 fatality rates in Singapore remain one of the lowest globally, the city-state nevertheless experienced huge spikes in infections that prompted two major national interventions to curb the spread of COVID-19 in the community [8]. The first raising of the risk assessment of COVID-19 to Disease Outbreak Response System Condition (DORSCON) Orange on 7 February 2020 caused public fear and concern [9,10]. The second intervention was the Circuit Breaker, a partial lockdown on public movement on 7 April 2020, as Singapore observed the peak of daily incidence in April. The local government was aggressive in public education efforts, encouraging residents to stay at home and exercise social responsibility, which pre-empted hidden pockets of infected cases from affecting others in the community. The close coordination of different healthcare sectors at a national level allowed continued access to public healthcare services, ensuring that the system had sufficient capacity to care for clinically unwell patients at peak infection rates [11]. Following the Circuit Breaker, the above measures helped to keep the number of community infected cases low [12].
At the time of writing, the highly infectious dominant Delta variant was rapidly circulating in the community [13]. Despite being one of the first Asian countries to implement an effective vaccination programme, Singapore may return to a Circuit Breaker when a surge in COVID-19 cases overwhelms the intensive care unit (ICU) capacity of hospitals [13,14]. As Singapore moves through the ebb and flow of controlling the pandemic, understanding the trend of ED attendance and visit characteristics will facilitate hospital resource planning and allocation in anticipation of a worsening COVID-19 situation and future pandemics to come. Hence, this descriptive study aims to understand how attendance at a single ED for both non-emergent and acute life-threatening conditions and corresponding patient visit characteristics changed during the initial stages of the COVID-19 period compared with the pre-COVID-19 period.

2. Materials and Methods

2.1. Study Design and Setting

Singapore General Hospital (SGH) is one of Singapore’s largest and oldest acute tertiary hospitals with 1785 beds in total. Its ED sees approximately 130,000 patients annually [15]. In this retrospective cohort study, SGH ED attendance, patient demographics and visit characteristics were reported during the COVID-19 period (1 January–28 June 2020) and compared with a historical period in 2019 (2 January–30 June 2019). The studied COVID-19 period was chosen as it represented the changes in ED attendance over the course of time, revealing trends specific to the pre-Circuit Breaker period and Circuit Breaker period. The pre-Circuit Breaker period included both the pre-DORSCON Orange and DORSCON Orange periods.

2.2. Data Source and Extraction

Routine and administrative data on ED attendances were extracted from the electronic health intelligence system (eHINTS) at SGH ED. The collected data fields were gender, age, nationality, ethnicity, mode of arrival, patient acuity category scale (PACS), disposition and clinical reason for attendance. This was a service evaluation study that did not require further ethical deliberation by the SingHealth Centralised Institutional Review Board (CIRB Ref: 2020/2470).

2.3. Patient Acuity Category Scale (PACS)

All public hospitals use PACS to triage patients in the ED [16]. The four main levels of PACS status are: Priority 1 (P1), for patients requiring immediate resuscitation; Priority 2 (P2), for non-ambulant patients requiring critical care; Priority 3 (P3), for ambulant patients with mild to moderate symptoms; and Priority (P4), for patients with non-emergent conditions that are more appropriately managed in primary health care settings. The febrile counterparts of these categories are P1F, P2F and P3F, respectively.

2.4. SNOMED CT to ICD-10-CM Conversion for ED Diagnosis

In our dataset, the ED diagnoses were coded and classified according to the Systematized Nomenclature of Medicine Clinical Terms (SNOMED CT). As the International Classification of Diseases, Tenth Revision, Clinical Modification (ICD-10-CM) codes are oriented more for statistical data collection, SNOMED CT codes were converted to ICD-10-CM and mapped to twenty-one broad ICD-10-CM categories using the SNOMED CT to ICD-10-CM Map provided by the National Library of Medicine [17]. Only the first matched ICD-10-CM code was kept in instances where there were multiple possible matches of ICD-10-CM codes to one SNOMED CT code.

2.5. Statistical Analysis

The patient characteristics of ED attendance were reported as the mean, median, standard deviation and range (where appropriate) for the continuous variables and frequency and percent for the categorical variables during the pre-COVID-19 and COVID-19 periods. The plotted attendance was stratified by year and febrile status. The comparison of the categorical variables between the pre-COVID-19 and COVID-19 periods was tabulated as a frequency reduction and percentage change. The weekly number of ED attendances was reported by year (pre-COVID-19 vs. COVID-19 periods) and febrile triage status. All data were de-identified before data processing and the statistical analysis was performed using R software (v4.0.0) [18].

3. Results

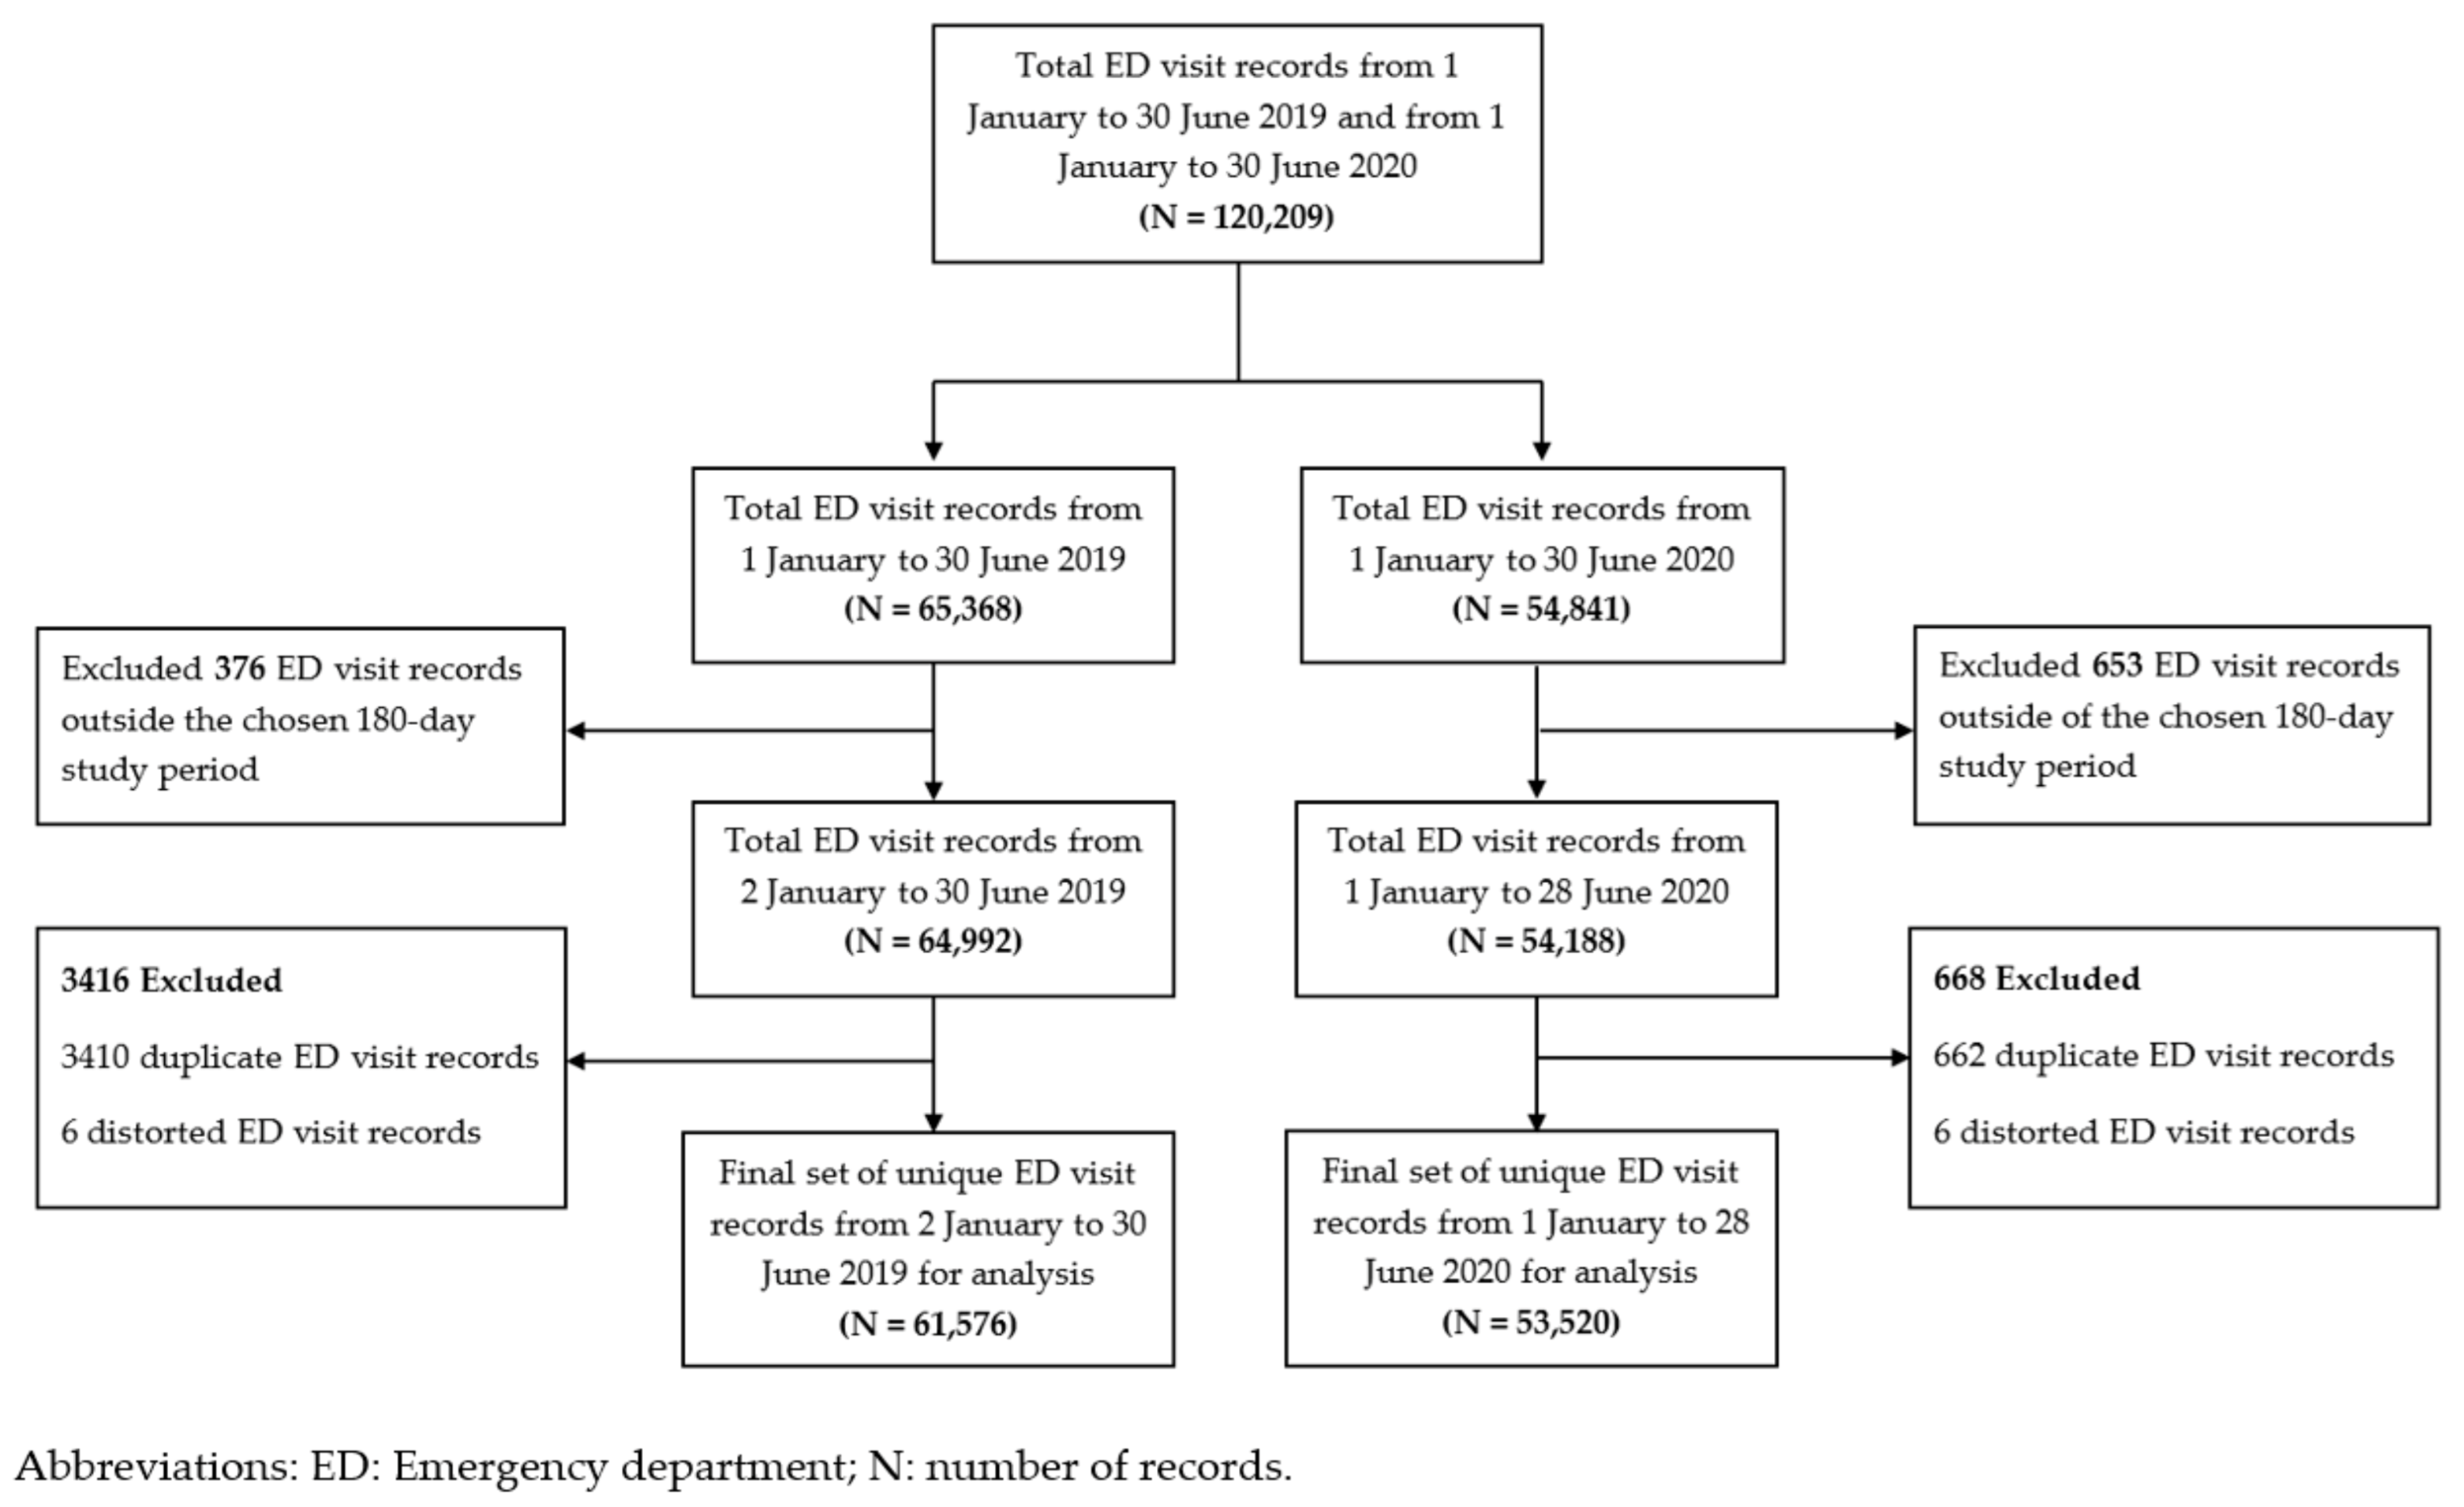
3.1. ED Visit Records Selected for the Analysis

Out of 120,209 ED visit records extracted, 1029 visit records outside our study period were excluded. A further exclusion of 4072 duplicate records and 12 distorted records left us with 115,096 ED visit records for the analysis; the pre-COVID-19 period had 61,576 visit records and the COVID-19 period had 53,520 visit records (Figure 1).

3.2. Patient Demographics and Visit Characteristics

Table 1 shows the gross reduction in the number of ED visits at SGH across gender, ethnicity, age groups and Singapore citizens during the COVID-19 period. Overall, the mean number of daily ED visits (SD) during the COVID-19 period was 297 (31.8), lower than that during the pre-COVID-19 period (342, 44.9). The decline in ED admissions was evident across all ward types except for the infectious disease or isolation wards during the COVID-19 period.

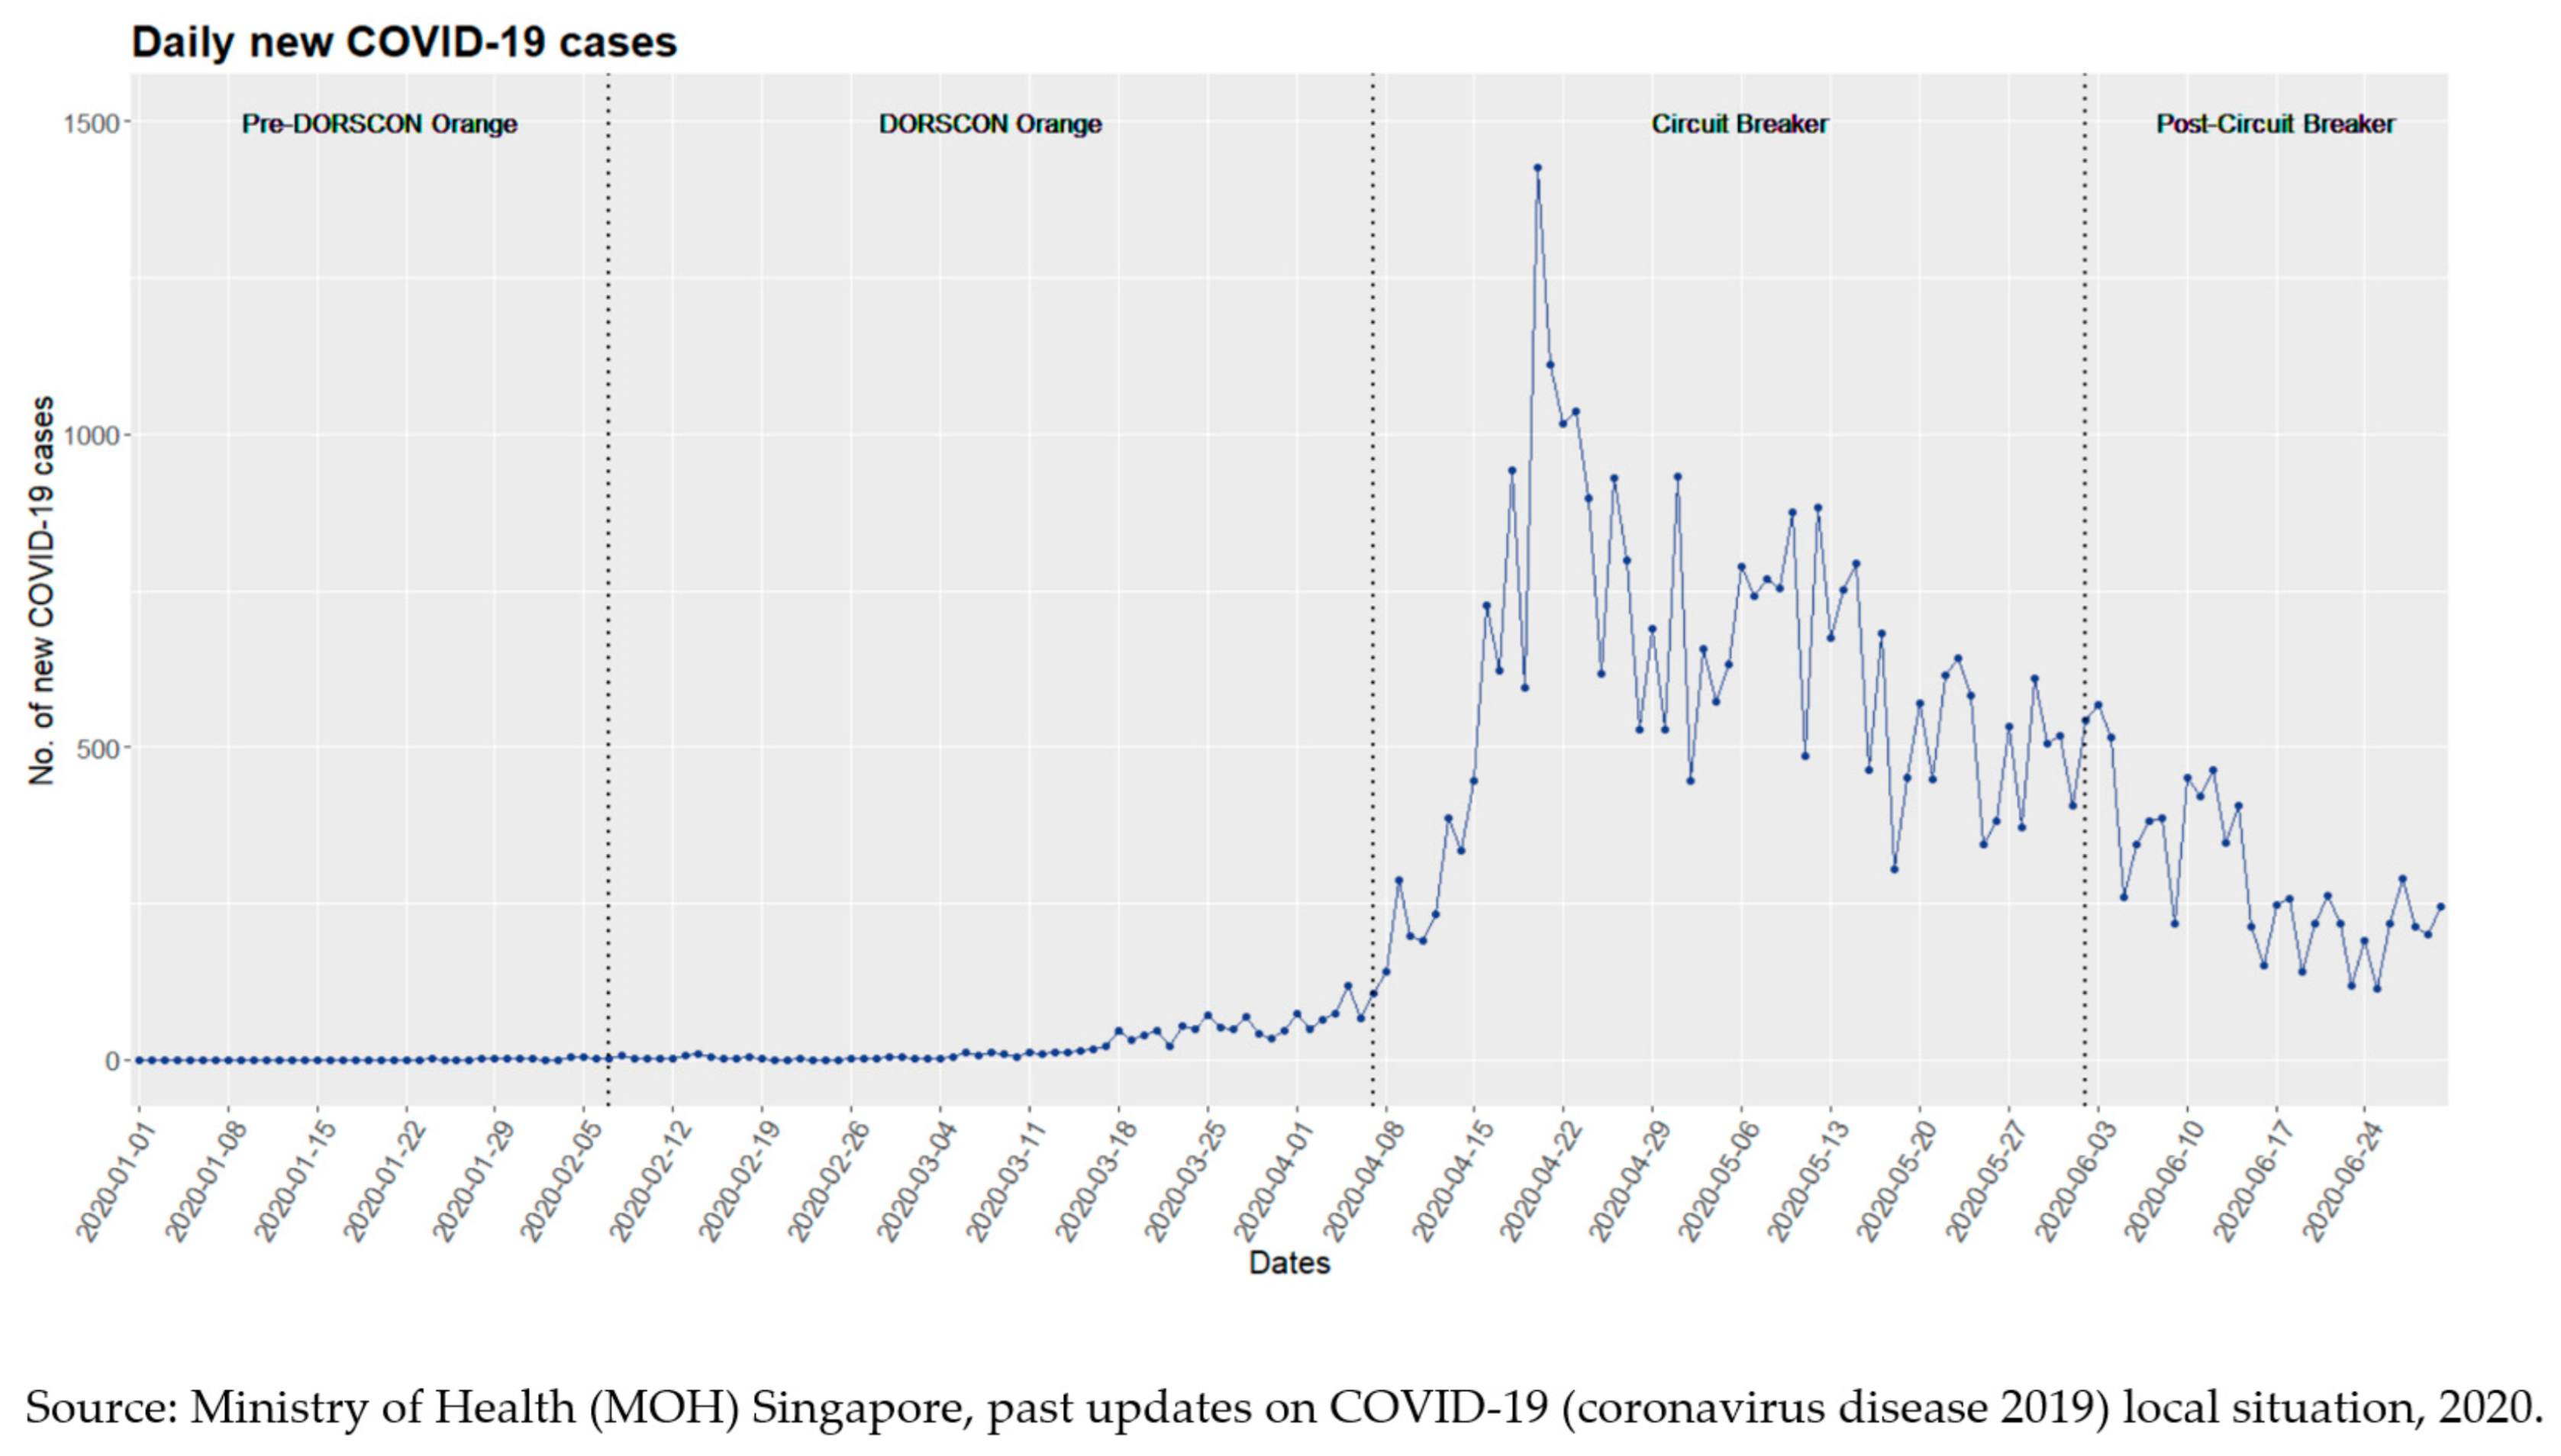
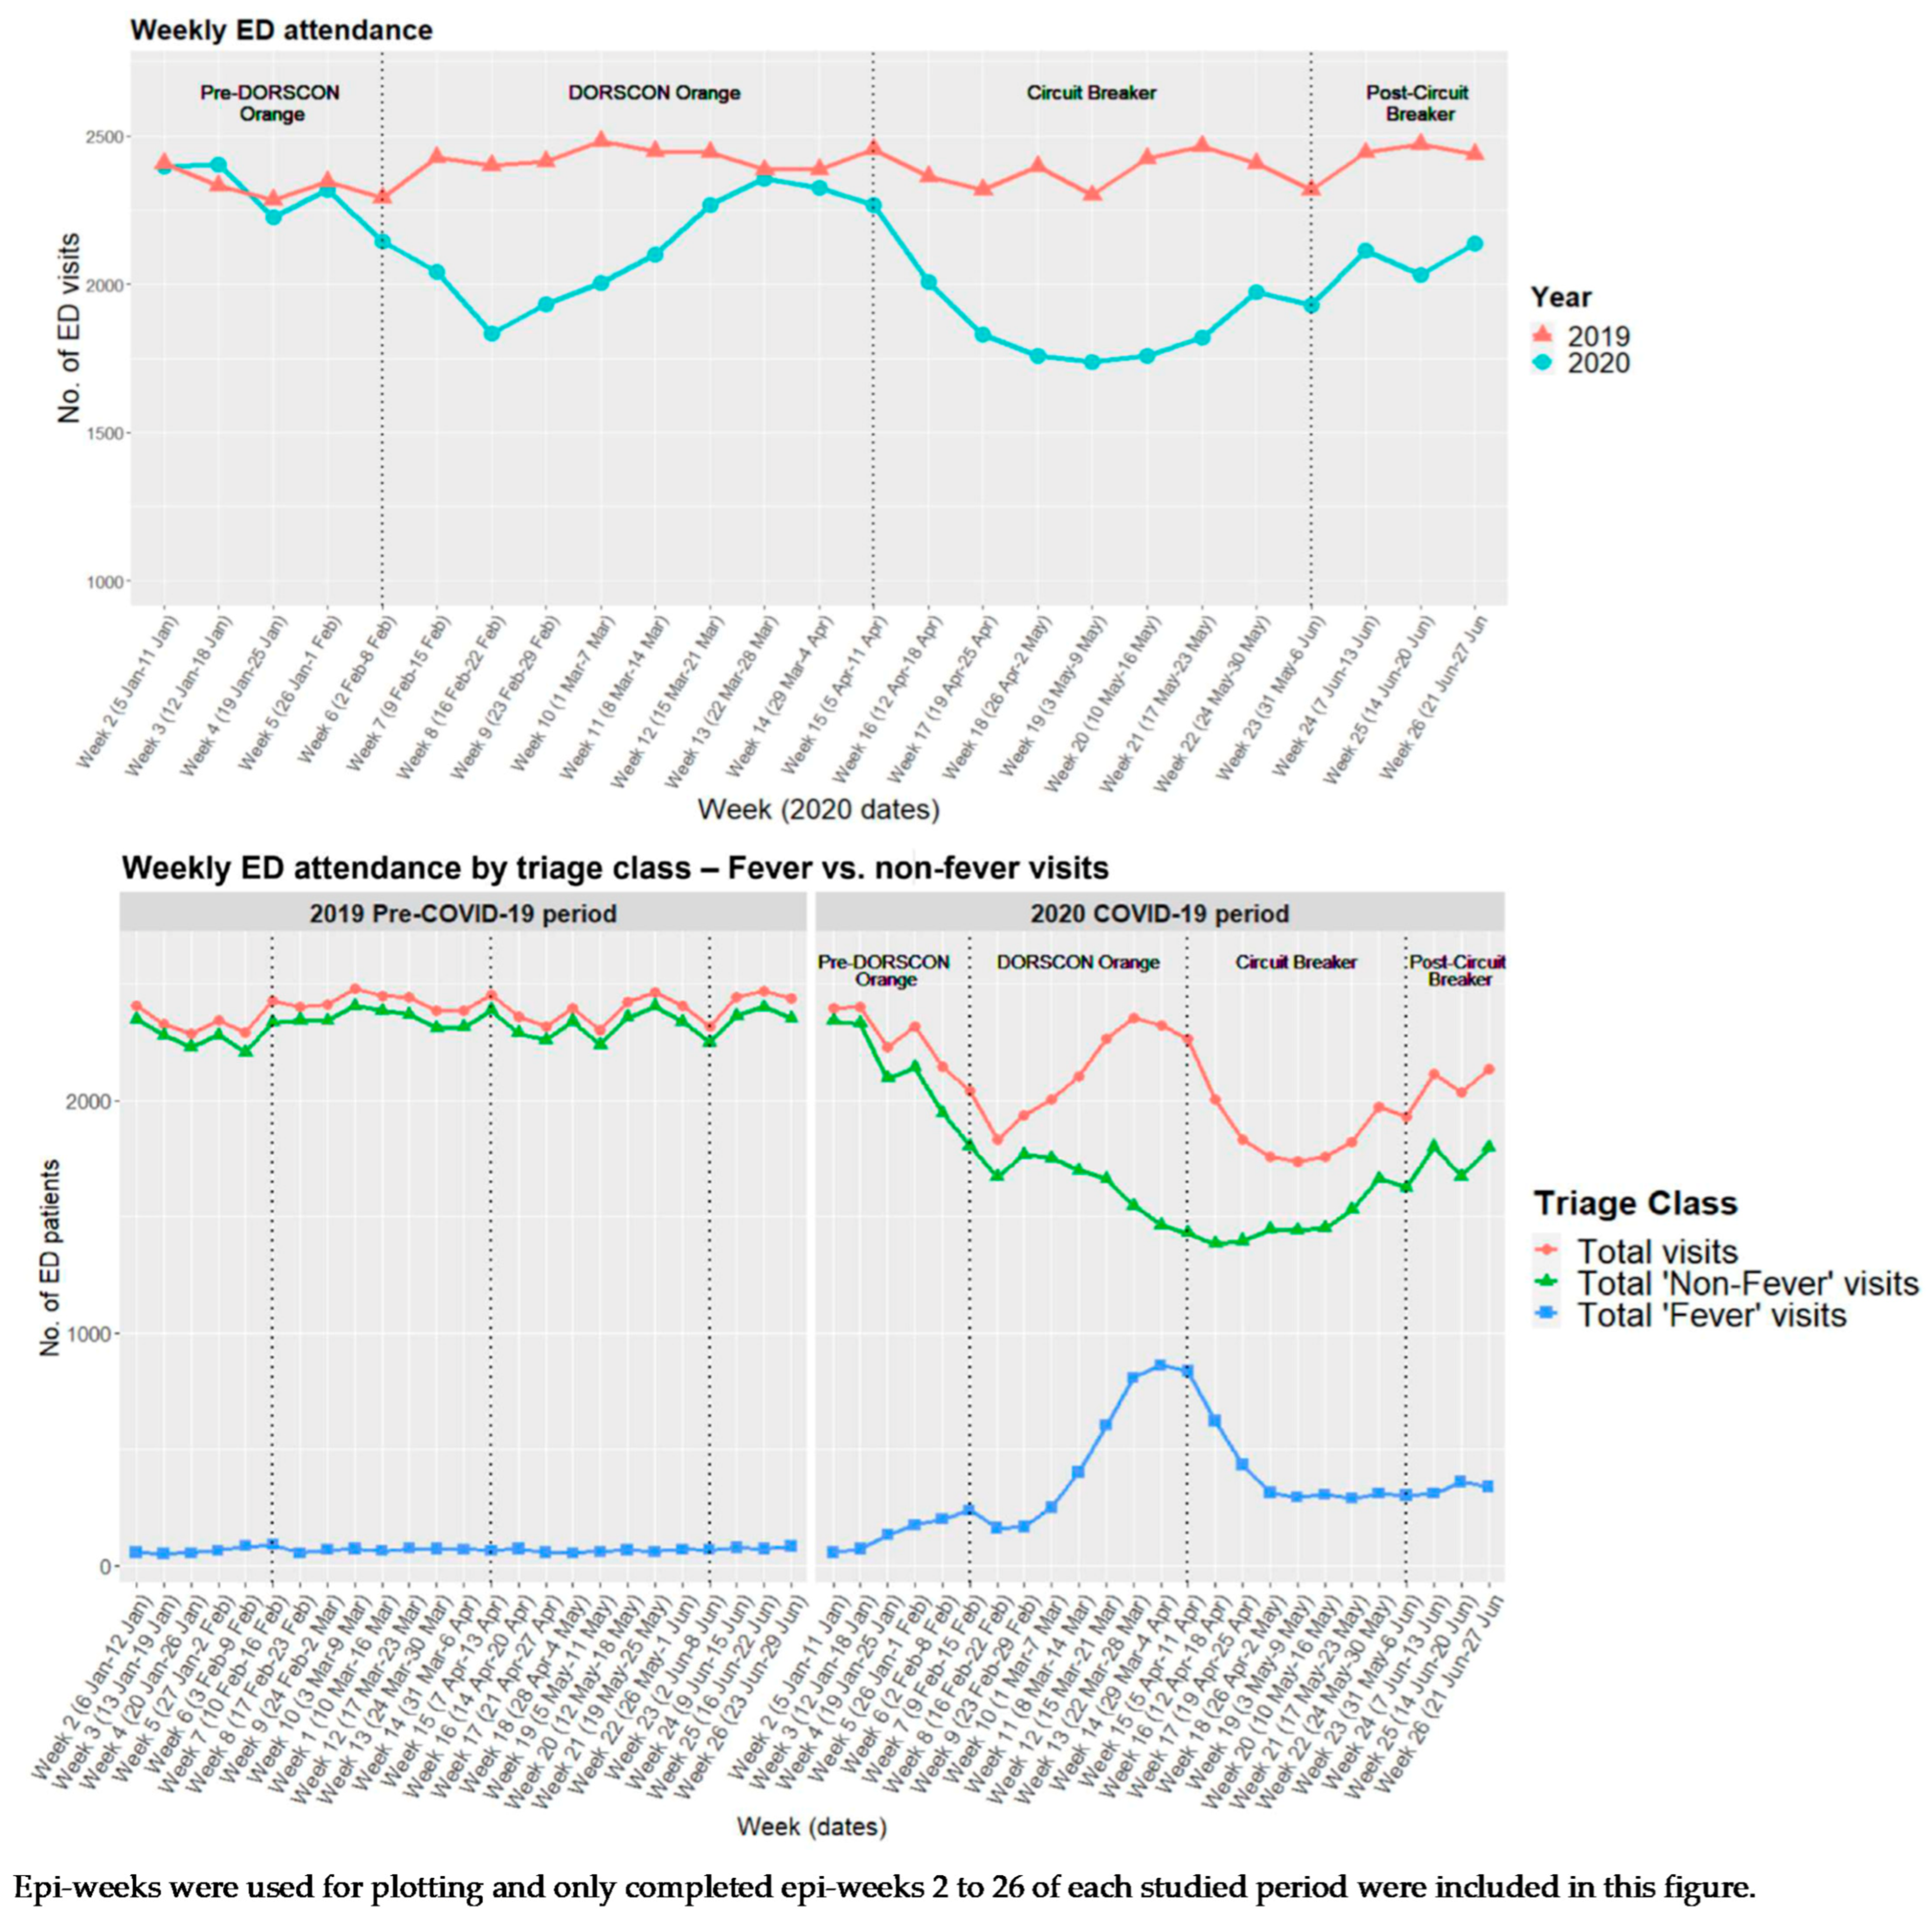
3.3. Two-Phase ED Attendance Trend

Within the COVID-19 period, the national tally of daily infected cases started relatively small during the pre-Circuit Breaker period (Figure 2) [19]. Thereafter, the tally rocketed to its highest during the Circuit Breaker period. Figure 3 illustrates the two-phase ED attendance trend experienced at SGH ED during the pre-Circuit Breaker period and Circuit Breaker period, respectively.

3.3.1. First Phase of the ED Attendance Trend

Approximately one week before DORSCON Orange initiation (2 February–8 February 2020, Week 6), there was a noticeable drop of 6.4% in the weekly ED attendance (2144 vs. 2291 baseline) compared with the same week in 2019 (Figure 3). The initial downward trend in ED attendance was largely driven by a decrease in ‘Non-Fever’ visits. The subsequent sharp returning of ED attendance corresponded with the rising numbers of ‘Fever’ visits even though the national tally of daily infected cases was relatively low, below a hundred (Figure 2). The weekly ED attendance peaked during the last week of March, almost reaching pre-COVID-19 numbers in the same week.

3.3.2. Second Phase of the ED Attendance Trend

SGH ED experienced its second fall in attendance where both the number of ‘Fever’ and ‘Non-Fever’ visits declined (Figure 3). The steepest drop occurred during 3 May–9 May 2020 (Week 19) where a 27.4% dip in ED visits was observed relative to the same week in the pre-COVID-19 period. Unlike the surge in ED attendance and the number of ‘Fever’ visits that we observed during the pre-Circuit Breaker period (first phase), the ED attendance declined even as daily infected cases hit record-breaking numbers during the Circuit Breaker (second phase) (Figure 2). Nevertheless, as the nation was halfway through the Circuit Breaker, we observed a slow and steady climb in SGH ED attendance that was visually distinct from the surge in the first phase (Figure 3). This gradual recovery coincided with the rise in total ‘Non-Fever’ visits and a relatively constant number of ‘Fever’ visits. Following the end of the Circuit Breaker and the gradual easing of restrictions for the safe resumption of activities, ED attendances continued to show signs of gradual recovery to the baseline numbers (Figure 3).

3.4. Sub-Group Analysis of the ED Attendance by ‘Non-Fever’ and ‘Fever’ Triage Categories

There was a decline in ED attendances across all ‘Non-Fever’ triage groups (P1–P4), including the sickest patient group (P1). There were 4.7% and 7.8% reductions in the proportion of P1 visits (10.0% vs. 14.7% baseline) and P3 visits (19.6% vs. 27.4% baseline), respectively (Table 1, Figure S1 Supplementary Materials). In contrast, there was an increase in ED attendees across all ‘Fever’ triage groups. Of note, there were 8.5 times more (7636 vs. 900 baseline) P3F ED visits during the COVID-19 period compared with the pre-COVID-19 period.

3.5. Clinical Reasons for ED Attendance

Among the 115,096 visit records, we excluded 2545 records (2.2%) with no documentation of the diagnosis code in our analysis of diagnoses. The remaining 112,551 visit records had a total of 143,995 documented SNOMED CT diagnosis codes. Out of these, approximately 3000 documented diagnosis codes (2%) were not mapped to ICD-10-CM categories and these were excluded from our analysis.
The decline in ED attendance was accompanied by decreases in nearly every diagnosis category except for diseases of the respiratory system. The greatest reduction in proportion was seen in the diagnostic category that covers injury, poisoning and certain other consequences of external causes (Table 2). Notably, the decline in P1 visits was accompanied by a drop in presentations of severe diseases such as strokes, acute myocardial infarctions, heart failure, appendicitis and paralytic ileus and intestinal obstructions without a hernia.

4. Discussion

Since the beginning of the COVID-19 outbreak, the overall number of SGH ED visits and admissions have dipped compared with the corresponding pre-COVID-19 period. With such a large decrease in ED visits at SGH, one may expect the sickest patients (P1) to continue attending the ED for unquestionably needed emergency care. However, SGH ED saw fewer life-threatening presentations and a decrease in both the number and proportion of P1 visits throughout the COVID-19 period. This could have arisen either from a true decrease in the incidence of emergent conditions or that patients in need of care did not seek help at the ED.
Patients may have avoided SGH ED due to a fear of burdening the healthcare system [20] or contracting the dreadful virus in a public hospital that was screening for and treating COVID-19 [21]. Early public engagement efforts in Singapore consistently emphasised the availability of community medical services to ease the load on public hospitals, which could have redirected patients from the ED to alternative avenues [22]. These avenues included community COVID-19 swab operations and isolation facilities, teleconsultation services and general practitioner (GP) clinics adequately equipped to manage patients with respiratory symptoms.
The severe acute respiratory syndrome (SARS) outbreak in 2003 was the deadliest infectious disease outbreak in recent Singapore history with a high mortality rate. Locally, the SARS outbreak occurred mainly within the hospital setting, with visitors making up almost half of the total infected cases at an acute care hospital [23]. Parallels can be drawn between SARS and COVID-19, with both being coronaviruses with a high transmissibility [24]. This could have played a role in the association of hospitals as key sources of viral transmissions, especially during the initial stages of the COVID-19 pandemic when little was known about the virus.
Our data, however, cannot prove whether there was a true decrease in the incidence of diseases or whether patients avoided the ED or sought treatment elsewhere. Initiatives such as social distancing and a partial lockdown could likely have led to a lower incidence of common community infections and injuries related to work, sports and road traffic accidents. Nevertheless, whether there was any delay and failure in seeking urgently needed treatments remains a major public health concern as this can translate to poorer health outcomes and potentially increase the need for hospital care [25]. Amid a new wave of COVID-19 infections in the community, addressing factors contributing to the decline in ED visits may help to identify key targets of interventions for better health outcomes.
During the first phase, where the daily counts of newly infected community cases were relatively low, the shift in the ED patient case-mix from ‘Non-Fever’ cases to ‘Fever’ cases may have been contributed to by suspected COVID-19 cases seeking testing and treatment at the ED as well as patients seeking care for flu-like symptoms from a fear that they had contracted the COVID-19 virus [26]. Amidst the rise in ‘Fever’ visits during the first phase, the overall number of ‘Non-Fever’ visits fell and this decline persisted into the Circuit Breaker period (second phase). On the contrary, the surge in the number of infected cases during the Circuit Breaker (second phase) was largely restricted to the densely occupied migrant worker dormitories rather than the community [27]. The prompt gazetting of these dormitories as isolation areas, a general compliance with social distancing measures, rapid contact tracing and systematic screening for COVID-19 likely stemmed any widespread infection to the community. Moreover, the scaling up of community medical facilities and services during the Circuit Breaker (second phase) allowed quicker testing and the housing of clinically well COVID-19 patients [27]. These measures likely gained traction throughout the Circuit Breaker and prevented an overwhelming number of ‘Fever’ visits to SGH ED, which partially explains the persistent nadir of ED attendance observed during the first half of the Circuit Breaker.
In the second half of the Circuit Breaker, the recovery in ‘Non-Fever’ visits may have been due to a delay in seeking treatment, resulting in more severe presentations that required emergent care and admission to the ED. It may also be attributed to a better public perception of the local COVID-19 situation and the declining number of new cases in the community at that point. These may have quelled the fear of the public of contracting the virus in the community and hospital settings.
The COVID-19 pandemic shows no signs of abating globally and the resurgence of outbreaks, as seen in many other countries, is inevitable as Singapore reopens its borders. A deeper understanding of the indirect impact of the pandemic on patient outcomes and the overall demand for emergent care across the nation is needed. Further studies on patients presenting to the ED during this period are needed to fully understand the health implications of the COVID-19 outbreak. It is also essential to explore public perceptions regarding seeking treatment at an ED during the COVID-19 period. Lastly, understanding the reasons behind the decline in low-acuity presentations may be useful for ED crowd management planning in a post-COVID-19 era.
As this was a single-centre study based on the patient profiles at SGH and as the analysis was performed using data collected from the eHINTS database at SGH ED, our findings may not be generalisable to other EDs in Singapore and we do not know whether additional or fewer patients sought treatment at other hospitals. Although this study was not able to prove causation due to the nature of a descriptive analysis, our findings provide first insights on how ED utilisation at SGH changed across different sub-periods of the COVID-19 pandemic, laying out important questions and implications that future studies should address.

5. Conclusions

The COVID-19 pandemic caused a large decline in ED attendances at SGH even amongst those with the highest priority for emergency care. This raises concerns whether patients were delaying critically needed treatment at the ED and whether this resulted in poorer health outcomes. This descriptive analysis revealed distinct ED visit trends across different time periods. A deeper understanding of how patients use healthcare services across different healthcare institutions will guide policymakers on hospital resource planning and allocation in anticipation of worsening COVID-19 situations and in future pandemics.

Supplementary Materials

The following are available online at https://www.mdpi.com/article/10.3390/covid1040059/s1, Figure S1: Weekly ED attendance trend for each ‘Non-Fever’ triage group during the pre-COVID-19 and COVID-19 periods.

Author Contributions

Conceptualisation, F.J.S. and M.E.H.O.; methodology, M.Q.L., S.E.S., F.J.S. and M.E.H.O.; formal analysis, M.Q.L.; data curation, M.Q.L., S.E.S., A.F.W.H., J.N.M.H.L., B.K.K.T., N.S.S., Y.S., F.J.S. and M.E.H.O.; writing—original draft preparation, M.Q.L.; writing—review and editing, M.Q.L., S.E.S., A.F.W.H., J.N.M.H.L., B.K.K.T., N.S.S., Y.S., F.J.S. and M.E.H.O.; visualisation, M.Q.L.; supervision, S.E.S., F.J.S. and M.E.H.O. All authors have read and agreed to the published version of the manuscript.

Funding

This work was supported by the National Medical Research Council [grant number COVID19RF2-0028]. The funder of the study had no role in study design, data collection, data analysis, data interpretation, or writing of the report.

Institutional Review Board Statement

This was a service evaluation study that did not require further ethical deliberation by the SingHealth Centralised Institutional Review Board (CIRB Ref: 2020/2470).

Informed Consent Statement

Patient consent was waived as all data were de-identified by the SingHealth Health Services Research Centre (HSRC) in accordance with the Human Biomedical Research Act (HBRA) before data processing and analysis.

Data Availability Statement

The data presented in this study are available on request from the corresponding author.

Acknowledgments

The authors are grateful to Narayanan Ragavendran, who works with the Health Services Research Centre at Singhealth, for kindly providing his expertise and service in data de-identification and Sherman Lian for helping with the extraction of anonymised patient data. The authors would also like to thank Gayathri Devi Nadarajan for providing valuable insights on SGH ED’s workflow and Liu Nan for providing R coding guidance and support. Lastly, the authors would like to express gratitude to Zhong Xun for providing guidance on the conversion of SNOMED CT diagnosis codes to ICD-10-CM categories.

Conflicts of Interest

The authors declare no conflict of interest.

References

  1. Hartnett, K.P.; Kite-Powell, A.; DeVies, J.; Coletta, M.A.; Boehmer, T.K.; Adjemian, J.; Gundlapalli, A.V.; National Syndromic Surveillance Program Community of Practice. Impact of the COVID-19 Pandemic on Emergency Department Visits—United States, 1 January 2019–30 May 2020. MMWR Morb. Mortal. Wkly. Rep. 2020, 69, 699–704. [Google Scholar] [CrossRef] [PubMed]
  2. Cella, A.; Marchetti, F.; Iughetti, L.; Di Biase, A.R.; Graziani, G.; De Fanti, A.; Valletta, E.; Vaienti, F.; Vergine, G.; Viola, L.; et al. Italian COVID-19 Epidemic: Effects on Paediatric Emergency Attendance—A Survey in the Emilia Romagna Region. BMJ Paediatr. Open 2020, 4, e000742. [Google Scholar] [CrossRef] [PubMed]
  3. Leow, S.H.; Dean, W.; MacDonald-Nethercott, M.; MacDonald-Nethercott, E.; Boyle, A.A. The Attend Study: A Retrospective Observational Study of Emergency Department Attendances During the Early Stages of the COVID-19 Pandemic. Cureus 2020, 12, e9328. [Google Scholar] [CrossRef] [PubMed]
  4. Walline, J.H.; Song, P.P.; Lim, A.M.; Hung, K.K.; Graham, C.A. Hong Kong Emergency Department Attendance Plummets during COVID-19. Emerg. Med. Australas. 2020, 32, 1093–1094. [Google Scholar] [CrossRef] [PubMed]
  5. De Filippo, O.; D’Ascenzo, F.; Angelini, F.; Bocchino, P.P.; Conrotto, F.; Saglietto, A.; Secco, G.G.; Campo, G.; Gallone, G.; Verardi, R.; et al. Reduced Rate of Hospital Admissions for ACS during Covid-19 Outbreak in Northern Italy. N. Engl. J. Med. 2020, 383, 88–89. [Google Scholar] [CrossRef] [PubMed]
  6. Lange, S.J.; Ritchey, M.D.; Goodman, A.B.; Dias, T.; Twentyman, E.; Fuld, J.; Schieve, L.A.; Imperatore, G.; Benoit, S.R.; Kite-Powell, A.; et al. Potential Indirect Effects of the COVID-19 Pandemic on Use of Emergency Departments for Acute Life-Threatening Conditions—United States, January–May 2020. Am. J. Transplantation 2020, 20, 2612–2617. [Google Scholar] [CrossRef] [PubMed]
  7. Nagamine, M.; Chow, D.S.; Chang, P.D.; Boden-Albala, B.; Yu, W.; Soun, J.E. Impact of COVID-19 on Acute Stroke Presentation at a Comprehensive Stroke Center. Front. Neurol. 2020, 11, 850. [Google Scholar] [CrossRef] [PubMed]
  8. Khalik, S. Surge in Coronavirus Infections Strains Healthcare System. The Straits Times Singapore, 18 April 2020. [Google Scholar]
  9. What Do the Different DORSCON Levels Mean. Available online: http://www.gov.sg/article/what-do-the-different-dorscon-levels-mean (accessed on 15 August 2020).
  10. Shorey, S.; Ang, E.; Yamina, A.; Tam, C. Perceptions of Public on the COVID-19 Outbreak in Singapore: A Qualitative Content Analysis. J. Public Health 2020, 42, 665–671. [Google Scholar] [CrossRef] [PubMed]
  11. Comprehensive Medical Strategy for COVID-19. Available online: https://www.moh.gov.sg/news-highlights/details/comprehensive-medical-strategy-for-covid-19 (accessed on 15 August 2020).
  12. Tay, T.F. Coronavirus: Community Cases Remain Low but Singapore Should Prepare for Second Wave, Says Gan Kim Yong. The Straits Times Singapore, 17 July 2020. [Google Scholar]
  13. Singapore Starts Booster Shots as COVID Cases Hit 1-Year High. Available online: https://asia.nikkei.com/Spotlight/Coronavirus/COVID-vaccines/Singapore-starts-booster-shots-as-COVID-cases-hit-1-year-high (accessed on 14 September 2021).
  14. Govt Won’t Rule out Return to Circuit Breaker or Heightened Alert If COVID-19 Cases in ICUs Rise Sharply: Lawrence Wong. Available online: https://www.todayonline.com/singapore/govt-wont-rule-out-return-circuit-breaker-or-heightened-alert-if-covid-19-cases-icus-rise (accessed on 6 September 2021).
  15. Quah, L.J.J.; Tan, B.K.K.; Fua, T.-P.; Wee, C.P.J.; Lim, C.S.; Nadarajan, G.; Zakaria, N.D.; Chan, S.-E.J.; Wan, P.W.; Teo, L.T.; et al. Reorganising the Emergency Department to Manage the COVID-19 Outbreak. Int. J. Emerg. Med. 2020, 13, 32. [Google Scholar] [CrossRef] [PubMed]
  16. Fong, R.Y.; Glen, W.S.S.; Mohamed Jamil, A.K.; Tam, W.W.S.; Kowitlawakul, Y. Comparison of the Emergency Severity Index versus the Patient Acuity Category Scale in an Emergency Setting. Int. Emerg. Nurs. 2018, 41, 13–18. [Google Scholar] [CrossRef] [PubMed]
  17. SNOMED CT to ICD-10-CM Map. Available online: https://www.nlm.nih.gov/research/umls/mapping_projects/snomedct_to_icd10cm.html (accessed on 27 September 2020).
  18. R Core Team. R: A Language and Environment for Statistical Computing; R Foundation for Statistical Computing: Vienna, Austria, 2020; Available online: https://www.R-project.org/ (accessed on 30 April 2020).
  19. Past Updates on COVID-19 Local Situation. Available online: https://www.moh.gov.sg/covid-19/past-updates (accessed on 15 August 2020).
  20. Singaporeans Are Confident in the Government Amidst Fears of the COVID-19 Outbreak. Available online: https://www.ipsos.com/en-sg/singaporeans-are-confident-government-amidst-fears-covid-19-outbreak (accessed on 16 August 2020).
  21. Wong, L.E.; Hawkins, J.E.; Langness, S.; Iris, P.; Sammann, A. Where Are All the Patients? Addressing Covid-19 Fear to Encourage Sick Patients to Seek Emergency Care. NEJM Catalyst Innov. Care Deliv. 2020, 1, 1–12. [Google Scholar] [CrossRef]
  22. Lin, R.J.; Lee, T.H.; Lye, D.C. From SARS to COVID-19: The Singapore journey. Med. J. Aust. 2020, 212, 497–502. [Google Scholar] [CrossRef] [PubMed]
  23. Gopalakrishna, G.; Choo, P.; Leo, Y.S.; Tay, B.K.; Lim, Y.T.; Khan, A.S.; Tan, C.C. SARS transmission and hospital containment. Emerg. Infect. Dis. 2004, 10, 395–400. [Google Scholar] [CrossRef] [PubMed]
  24. Ong, S.W.X.; Coleman, K.K.; Chia, P.Y.; Thoon, K.C.; Pada, S.; Venkatachalam, I.; Fisher, D.; Tan, Y.K.; Tan, B.H.; Ng, O.T.; et al. Transmission modes of severe acute respiratory syndrome coronavirus 2 and implications on infection control: A review. Singap. Med. J. 2020, 1, 21. [Google Scholar] [CrossRef] [PubMed]
  25. Czeisler, M.É.; Marynak, K.; Clarke, K.E.N.; Salah, Z.; Shakya, I.; Thierry, J.M.; Ali, N.; McMillan, H.; Wiley, J.F.; Weaver, M.D.; et al. Delay or Avoidance of Medical Care Because of COVID-19–Related Concerns—United States, June 2020. Morb. Mortal. Wkly. Rep. 2020, 69, 1250–1257. [Google Scholar] [CrossRef] [PubMed]
  26. Inside Singapore’s COVID-19 Screening Centre, on the Front Line against the Disease. Available online: https://www.channelnewsasia.com/cnainsider/inside-singapore-covid-19-screening-centre-defence-disease-ncid-765381 (accessed on 19 April 2020).
  27. Stretched but Coping: How Singapore’s Healthcare System Has Cranked up Efforts to Deal with COVID-19. Available online: https://www.channelnewsasia.com/singapore/covid-19-singapore-health-capacity-hospitals-treatment-935336 (accessed on 4 May 2020).
Figure 1. Flowchart depicting the study selection process of the ED visit records selected for the analysis.
Covid 01 00059 g001
Figure 2. An illustration of the trend of daily newly infected cases in Singapore.
Covid 01 00059 g002
Figure 3. Weekly SGH ED attendance by year and by febrile triage status during the studied COVID-19 period and its corresponding historical pre-COVID-19 period. The start of each week corresponded with Sunday of that week; hence, incomplete ‘Week 1′ data were excluded from this figure.
Covid 01 00059 g003
Table 1. SGH ED patient characteristics during the pre-COVID-19 period in 2019 and COVID-19 period in 2020.
Time Periods StudiedPre-COVID-19 PeriodCOVID-19 Period% Change in ED Attendances Compared with the Pre-COVID-19 Period
2 January–30 June 20191 January–28 June 2020
Total number of ED visits61,57653,520−8056 (−13.1%)
Mean ED attendance (SD, range)342 (44.9, 277–427)297 (31.8, 207–445)
DemographicsN (%)N (%)
Gender
 Male31,707 (51.5%)28,942 (54.1%)−2765 (−8.7%)
 Female29,869 (48.5%)24,578 (45.9%)−5291 (−17.7%)
Age (year)
 Median (Q1–Q3, range)56 (36–70, 0–106)55 (35–70, 0–105)
 0–10386 (0.6%)216 (0.4%)−170 (−44.0%)
 11–14213 (0.3%)108 (0.2%)−105 (−49.3%)
 15–245172 (8.4%)3970 (7.4%)−1202 (−23.2%)
 25–348448 (13.7%)8407 (15.7%)−41 (−0.5%)
 35–447008 (11.4%)6916 (12.9%)−92 (−1.3%)
 45–547856 (12.8%)6757 (12.6%)−1099 (−14.0%)
 55–6410,736 (17.4%)8884 (16.6%)−1852 (−17.3%)
 ≥6521,757 (35.3%)18,261 (34.1%)−3496 (−16.1%)
 Missing01
Citizenship status
 Singapore citizen49,592 (80.5%)41,099 (76.8%)−8493 (−17.1%)
 Non-citizen11,984 (19.5%)12,421 (23.2%)+437 (+3.6%)
Ethnicity
 Chinese39,663 (64.4%)33,137 (61.9%)−6525 (−16.5%)
 Indian8034 (13.0%)7605 (14.2%)−429 (−5.3%)
 Malay6603 (10.7%)5811 (10.9%)−792 (−12.0%)
 Others7276 (11.8%)6967 (13.0%)−309 (−4.2%)
Visit characteristicsN (%)N (%)
Mode of arrival
 Non-ambulance52,585 (85.4%)43,239 (80.8%)−9346 (−17.8%)
 SCDF ambulance6432 (10.4%)7384 (13.8%)+952 (+14.8%)
 Private ambulance2559 (4.2%)2897 (5.4%)+338 (+13.2%)
Patient acuity category status
 P19049 (14.7%)5336 (10.0%)−3713 (−41.0%)
 P233,550 (54.5%)28,608 (53.5%)−4942 (−14.7%)
 P316,874 (27.4%)10,486 (19.6%)−6388 (−37.9%)
 P4345 (0.6%)138 (0.3%)−207 (−60.0%)
 P1F144 (0.2%)178 (0.3%)+34 (+23.6%)
 P2F714 (1.2%)1138 (2.1%)+424 (+59.4%)
 P3F900 (1.5%)7636 (14.3%)+6736 (+748.4%)
Disposition
 Admitted from ED25,422 (41.3%)23,422 (43.8%)−2000 (−7.9%)
  General ward21,958 (86.4%)20,000 (85.4%)−1958 (−8.9%)
  High dependency ward1190 (4.7%)872 (3.7%)−318 (−26.7%)
  Intermediate care area387 (1.5%)231 (1.0%)−156 (−40.3%)
  Intensive care unit372 (1.5%)302 (1.3%)−70 (−18.8%)
  Infectious disease/isolation ward857 (3.4%)1891 (8.1%)+1034 (+120.7%)
  Unknown658 (2.6%)126 (0.5%)−532 (−80.9%)
 Not admitted36,126 (58.7%)30,054 (56.2%)−6072 (−16.8%)
 Missing2844
ED: Emergency Department; SD: standard deviation; N: number of patients; Q1: first quartile, representing the 25th percentile value; Q3: third quartile, representing the 75th percentile value; SCDF: Singapore Civil Defence Force; P1: Priority 1; P1F: Priority 1 Fever; P2: Priority 2; P2F: Priority 2 Fever; P3: Priority 3; P3F: Priority 3 Fever; P4: Priority 4.
Table 2. SGH ED patient characteristics during the pre-COVID-19 period in 2019 and the COVID-19 period in 2020.
Time Periods StudiedPre-COVID-19 PeriodCOVID-19 Period% Change in Frequency Compared with the Pre-COVID-19 Period
2 January–30 June 20191 January–28 June 2020
Total number of ED visits61,57653,520
Number of ED visits with ≥1 recorded diagnosis60,16652,385
Total number of documented diagnoses73,545 (100%)67,444 (100%)
ICD-10-CM diagnosis categoriesN (% total documented diagnoses)N (% total documented diagnoses)
 Symptoms, signs and abnormal clinical and laboratory findings, not elsewhere classified19,196 (25.5%)16,883 (24.5%)−2313 (−12.0%)
 Injury, poisoning and certain other consequences of external causes9358 (12.5%)6779 (9.9%)−2579 (−27.6%)
 Diseases of the musculoskeletal system and connective tissue5932 (7.9%)3995 (5.8%)−1937 (−32.7%)
 Diseases of the circulatory system5810 (7.7%)4723 (6.9%)−1087 (−18.7%)
 Diseases of the respiratory system5594 (7.4%)11,842 (17.2%)+6248 (+111.7%)
 Diseases of the digestive system4971 (6.6%)4367 (6.4%)−604 (−12.2%)
 Diseases of the genitourinary system3821 (5.1%)3141 (4.6%)−680 (−17.8%)
 Certain infectious and parasitic diseases3799 (5.1%)3095 (4.5%)−704 (−18.5%)
 Endocrine, nutritional and metabolic diseases2976 (4.0%)2735 (4.0%)−241 (−8.1%)
 Diseases of the skin and subcutaneous tissue2937 (3.9%)2360 (3.4%)−577 (−19.6%)
 Diseases of the eye and adnexa2493 (3.3%)1805 (2.6%)−688 (−27.6%)
 Diseases of the nervous system1265 (1.7%)1074 (1.6%)−191 (−15.1%)
 Neoplasms1227 (1.6%)1069 (1.6%)−158 (−12.9%)
 Mental, behavioural and neurodevelopmental disorders1012 (1.3%)899 (1.3%)−113 (−11.2%)
 Diseases of the blood and blood-forming organs and certain disorders involving the immune mechanism943 (1.3%)860 (1.2%)−83 (−8.8%)
 External causes of morbidity699 (0.9%)636 (0.9%)−63 (−9.0%)
 Diseases of the ear and mastoid process640 (0.9%)537 (0.8%)−103 (−16.1%)
 Factors influencing health status and contact with health services557 (0.7%)405 (0.6%)−152 (−27.3%)
 Pregnancy, childbirth and the puerperium220 (0.3%)174 (0.3%)−46 (−20.9%)
 Congenital malformations, deformations and chromosomal abnormalities62 (0.1%)36 (0.1%)−26 (−41.9%)
 Certain conditions originating in the perinatal period33 (0.0%)29 (0.0%)−4 (−12.1%)
Total number of P1 visits90495336
Number of P1 visits with ≥1 recorded diagnosis90125313
Total number of recorded diagnoses11,510 (100%)7519 (100%)
ICD-10-CM diagnosis categoriesN (% total documented diagnoses)N (% total documented diagnoses)
Severe diseases
 Stroke704 (6.1%)516 (6.9%)−188 (−26.7%)
 Acute myocardial infarction508 (4.4%)440 (5.9%)−68 (−13.4%)
  STEMI226 (2.0%)187 (2.5%)−39 (−17.3%)
  NSTEMI282 (2.5%)253 (3.4%)−29 (−10.3%)
 Other acute ischemic heart diseases109 (0.9%)95 (1.3%)−14 (−12.8%)
 Heart failure337 (2.9%)231 (3.1%)−106 (−31.5%)
 Cardiac arrest92 (0.8%)102 (1.4%)+10 +(10.9%)
 Paralytic ileus and intestinal obstruction without hernia337 (2.9%)277 (3.7%)−60 (−17.8%)
 Appendicitis173 (1.5%)157 (2.1%)−16 (−9.2%)
ED: Emergency Department; N: number of total documented diagnoses; ICD-10-CM: International Classification of Diseases, Tenth Revision, Clinical Modification; P1: Priority 1; STEMI: ST elevation myocardial infarction; NSTEMI: non-ST elevation myocardial infarction.
Publisher’s Note: MDPI stays neutral with regard to jurisdictional claims in published maps and institutional affiliations.

