Article

Combining International Survey Datasets to Identify Indicators of Stress during the COVID-19 Pandemic: A Machine Learning Approach to Improve Generalization

1
Department of Statistics, Stanford University, 90 Serra Mall, Stanford, CA 94305, USA
2
Institute for Computational and Mathematical Engineering, Stanford University, 475 Via Ortega, Stanford, CA 94305, USA
3
Rehabilitation Service, VA Palo Alto Healthcare System, Palo Alto, CA 94304, USA
4
Department of Neurosurgery, Stanford University School of Medicine, Stanford, CA 94304, USA
5
Department of Environmental Medicine and Public Health, Icahn School of Medicine at Mount Sinai, New York, NY 10029, USA
6
Department of General Psychology, University of Padua, 35131 Padua, Italy
*
Author to whom correspondence should be addressed.
COVID 2021, 1(4), 728-738; https://doi.org/10.3390/covid1040058
Submission received: 25 October 2021 / Revised: 21 November 2021 / Accepted: 26 November 2021 / Published: 1 December 2021

Abstract

:
The scale and duration of the worldwide SARS-COVID-2 virus-related quarantine measures presented the global scientific community with a unique opportunity to study the accompanying psychological stress. Since March 2020, numerous publications have reported similar findings from diverse international studies on psychological stress, depression, and anxiety, which have increased during this pandemic. However, there remains a gap in interpreting the results from one country to another despite the global rise in mental health problems. The objective of our study was to identify global indicators of pandemic-related stress that traverse geographic and cultural boundaries. We amalgamated data from two independent global surveys across twelve countries and spanning four continents collected during the first wave of the mandated public health measures aimed at mitigating COVID-19. We applied machine learning (ML) modelling to these data, and the results revealed a significant positive correlation between PSS-10 scores and gender, relationship status, and groups. Confinement, fear of contagion, social isolation, financial hardship, etc., may be some reasons reported being the cause of the drastic increase in mental health problems worldwide. The decline of the typical protective factors (e.g., sleep, exercise, meditation) may have amplified existing vulnerabilities/co-morbidities (e.g., psychiatric history, age, gender). Our results further show that ML is an apropos tool to elucidate the underlying predictive factors in large, complex, heterogeneous datasets without invalidating the model assumptions. We believe our model provides clinicians, researchers, and decision-makers with evidence to investigate the moderators and mediators of stress and introduce novel interventions to mitigate the long-term effects of the COVID-19 pandemic.

1. Introduction

Across the globe, multiple studies report that COVID-19 has resulted in a perfect storm of quarantine isolation, inadequate and contradictory information, fear of infection and death, boredom, scarcity, financial loss, and stigma [1,2,3] Research evidence consistently points to COVID-19 having a uniform deleterious effect on the psychological well-being of millions of people [3,4,5]. However, there is a paucity of comparative or data validation studies that objectively combine data to report on the universal trends of validated measures. In part, this may be due to the complexity of analyzing data from multiple surveys that use proxy measures to estimate ‘psychological stress’ that includes linguistic and cultural boundaries. For instance, a country whose citizens have a history of prior social isolation measures to mitigate epidemics or other environmental threats (e.g., China) may respond differently to the pandemic than a country without any prior history of government-mandated social isolation. The combination of various survey datasets across different cultures and languages provides a powerful and systematic way to validate measures that may uncover underlying factors impacting psychological stress during this pandemic. Furthermore, the aggregation of datasets overcomes the limitations of different systems and cultures [6] in addition to providing objective indicators of the veracity and generalizability of the reported impact of COVID-19 independent of context bias [7].
The field of artificial intelligence (AI) and machine learning (ML) is particularly apropos [8] as it can accurately handle large and complex datasets. AI and ML facilitate the development of models that accommodate multiple predictor variables and multi-dimensional and a variety of data to support the identification of trends and patterns without violating model assumptions or succumbing to collinearity issues [9]. ML models are focused on predictive accuracy rather than inference, which is achieved through learning algorithms that rely on different assumptions, such as support vector machine, random forest, and naïve Bayes regressions [10]. The process of cross-validation is the principal tool that ML algorithms use to train/learn and ultimately assess the generalizability of the results from data fitted to the algorithm [10,11]. Cross-validation consists of partitioning the entire dataset into distinct complementary subsets and iteratively testing the algorithm on subsets of the data (training set) and validating its predictive ability on other subsets (validation set). The iterative nature of cross-validation on distinct portions of the data avoids the pitfall of selection bias or overfitting of the model [10,11,12]. Furthermore, a strategy combining multiple heterogeneous datasets using ML provides greater accuracy of the results and more generalizable findings.
Here, we propose combining two cross-sectional survey datasets [5] (international—11 countries including the US but not Italy) and [13] (Italian). We particularly chose these datasets because they used the same outcome measure for psychological stress—the Perceived Stress Scale (PSS) [14]. The responses were collected on similar demographic and lifestyle questions across the two surveys to measure their respective population’s level of perceived stress during the lockdown associated with the first wave of the COVID-19 pandemic.
We aim to demonstrate the strength of combining cross-cultural datasets and the applicability of ML algorithms to facilitate the process and generate a predictive model that identifies and validates the key predictors of pandemic-related stress. Furthermore, we also aim to report correlations and interactions with demographic, cultural, and other mitigating factors in addition to the generalizability of the key uniform predictors.

2. Methods

2.1. Study Populations

This study reports on existing published data, beginning with the International [5] and then the Italian dataset [13]. We decided on these two datasets based on the following criteria: both datasets are comparable in terms of (i) time frame (first wave of lockdown beginning March 2020), (ii) method (survey), (iii) outcome measure (Perceived Stress Scale), and (iv) demographic and other variables that enable the uniform consolidation of the two datasets (see Figure 1). The addition of the Italian dataset to the international dataset was considered important and viable as it would provide additional comparable data on perceived stress from a similar European country to the three European countries already included in the international dataset.

2.2. Dataset Selection

Further details on the international dataset, collected to assess perceived levels of stress across the globe, are provided in an earlier publication [5]. In summary, the data collected consisted of 1685 complete survey responses from 11 different countries (US, Pakistan, Canada, Netherlands, Germany, Argentina, Mexico, Australia, UK, India, and China). The international dataset comprised a 38-item online survey that included a subset of questions on socio-demographic (sex, age, education, income), personal care (time devoted to sleep, exercise, meditation, and telecommunication with friends or family), and personal burden (hours of homeschooling, homecare, and remote work) aspects, and the Perceived Stress Scale (PSS-10) [15]. The Italian dataset collected similar data on sociodemographic characteristics, psychological traits, and assessed perceived stress using the same measurement tool—the PSS-10. However, the Italian dataset did not contain the personal care or personal burden questions.

2.3. Data Harmonization

The first step towards data validation and the construction of the ML predictive model consisted of integrating the [13] dataset into the [5] one by matching similar variables. To enable the consolidation of datasets, minor modifications were made to some items in the [5] dataset to match those with [13]. For instance, the variable education in the [5] dataset was measured in terms of “highest degree attained”, whereas education in [13] was measured in terms of “years of schooling”. Any modifications to the [5] dataset did not change the integrity of the data.

2.4. Statistical Approach

The data from each country in the international and Italian datasets are by default independent as they refer only to results for the population of that country; however, they all used the same measure of perceived stress—the Perceived Stress Scale (PSS-10). To identify the main effects and interactions, the two datasets (international N = 11 and Italy N = 1) were initially analyzed separately. The ML models were then applied to each dataset, and, finally, the datasets were combined (international and Italian) and a unique model was developed.

2.5. Interactions

To identify the most significant main effects and their interactions, we used several modeling techniques, performing an 8-2 split, which allocated 80% of the data as training data and the remaining 20% as testing data. As our response of interest is a binary classification (“low stress” vs. “high stress”), we primarily looked at four fundamental classification machine learning models: logistic regression (LR), Gaussian naïve Bayes (GNB), decision tree (DT), and support vector machine (SVM) in building our predictive model. For all the results detailed below, we first applied this method to only the international dataset [5]. We subsequently integrated the Italian data [13] into the international dataset and evaluated the results using the same approach of performing an 8-2 split on the combined data and building the models of the corresponding training data and using the remaining data as the test data for validation purposes.

2.6. Modeling Effort

Using the PSS-10 as the individual measure of perceived level of stress during the first wave of the pandemic, our team looked at building a machine learning classification tool to predict if an individual would have low or high stress during these times. Specifically, individuals with a score ≤ 26 would be classified as “low stress”, and those with a score of 27+ would be classified as “high stress.”

2.7. Feature Selection

The data’s corresponding 42 features were cleaned and prepared in readiness for analysis, including changing all text-based responses into dummy variables (e.g., sex into male/female categories) and ordering variables (i.e., income brackets into income levels 1–6).
Through our feature selection process, we attempted to reduce the number of overall features as some variables were superfluous and may even introduce noise to the data. To parse out the feature selection, we used the “SelectKBest” feature function from the “Sklearn” feature selection package. The feature selection process calculates the correlation between each feature and the target and computes a corresponding F-score and p-value. The final step involved ranking all the selected features according to their p-value and then deciding on the best number of features (K) to include in the model.
Iterating through different numbers of K, we ultimately decided to use K = 10 features to train and validate the model on less_excercise, less_meditation, less_sleep, no_change_sleep, age, male, female, personal_care, sleep_covid, and exercise_covid.

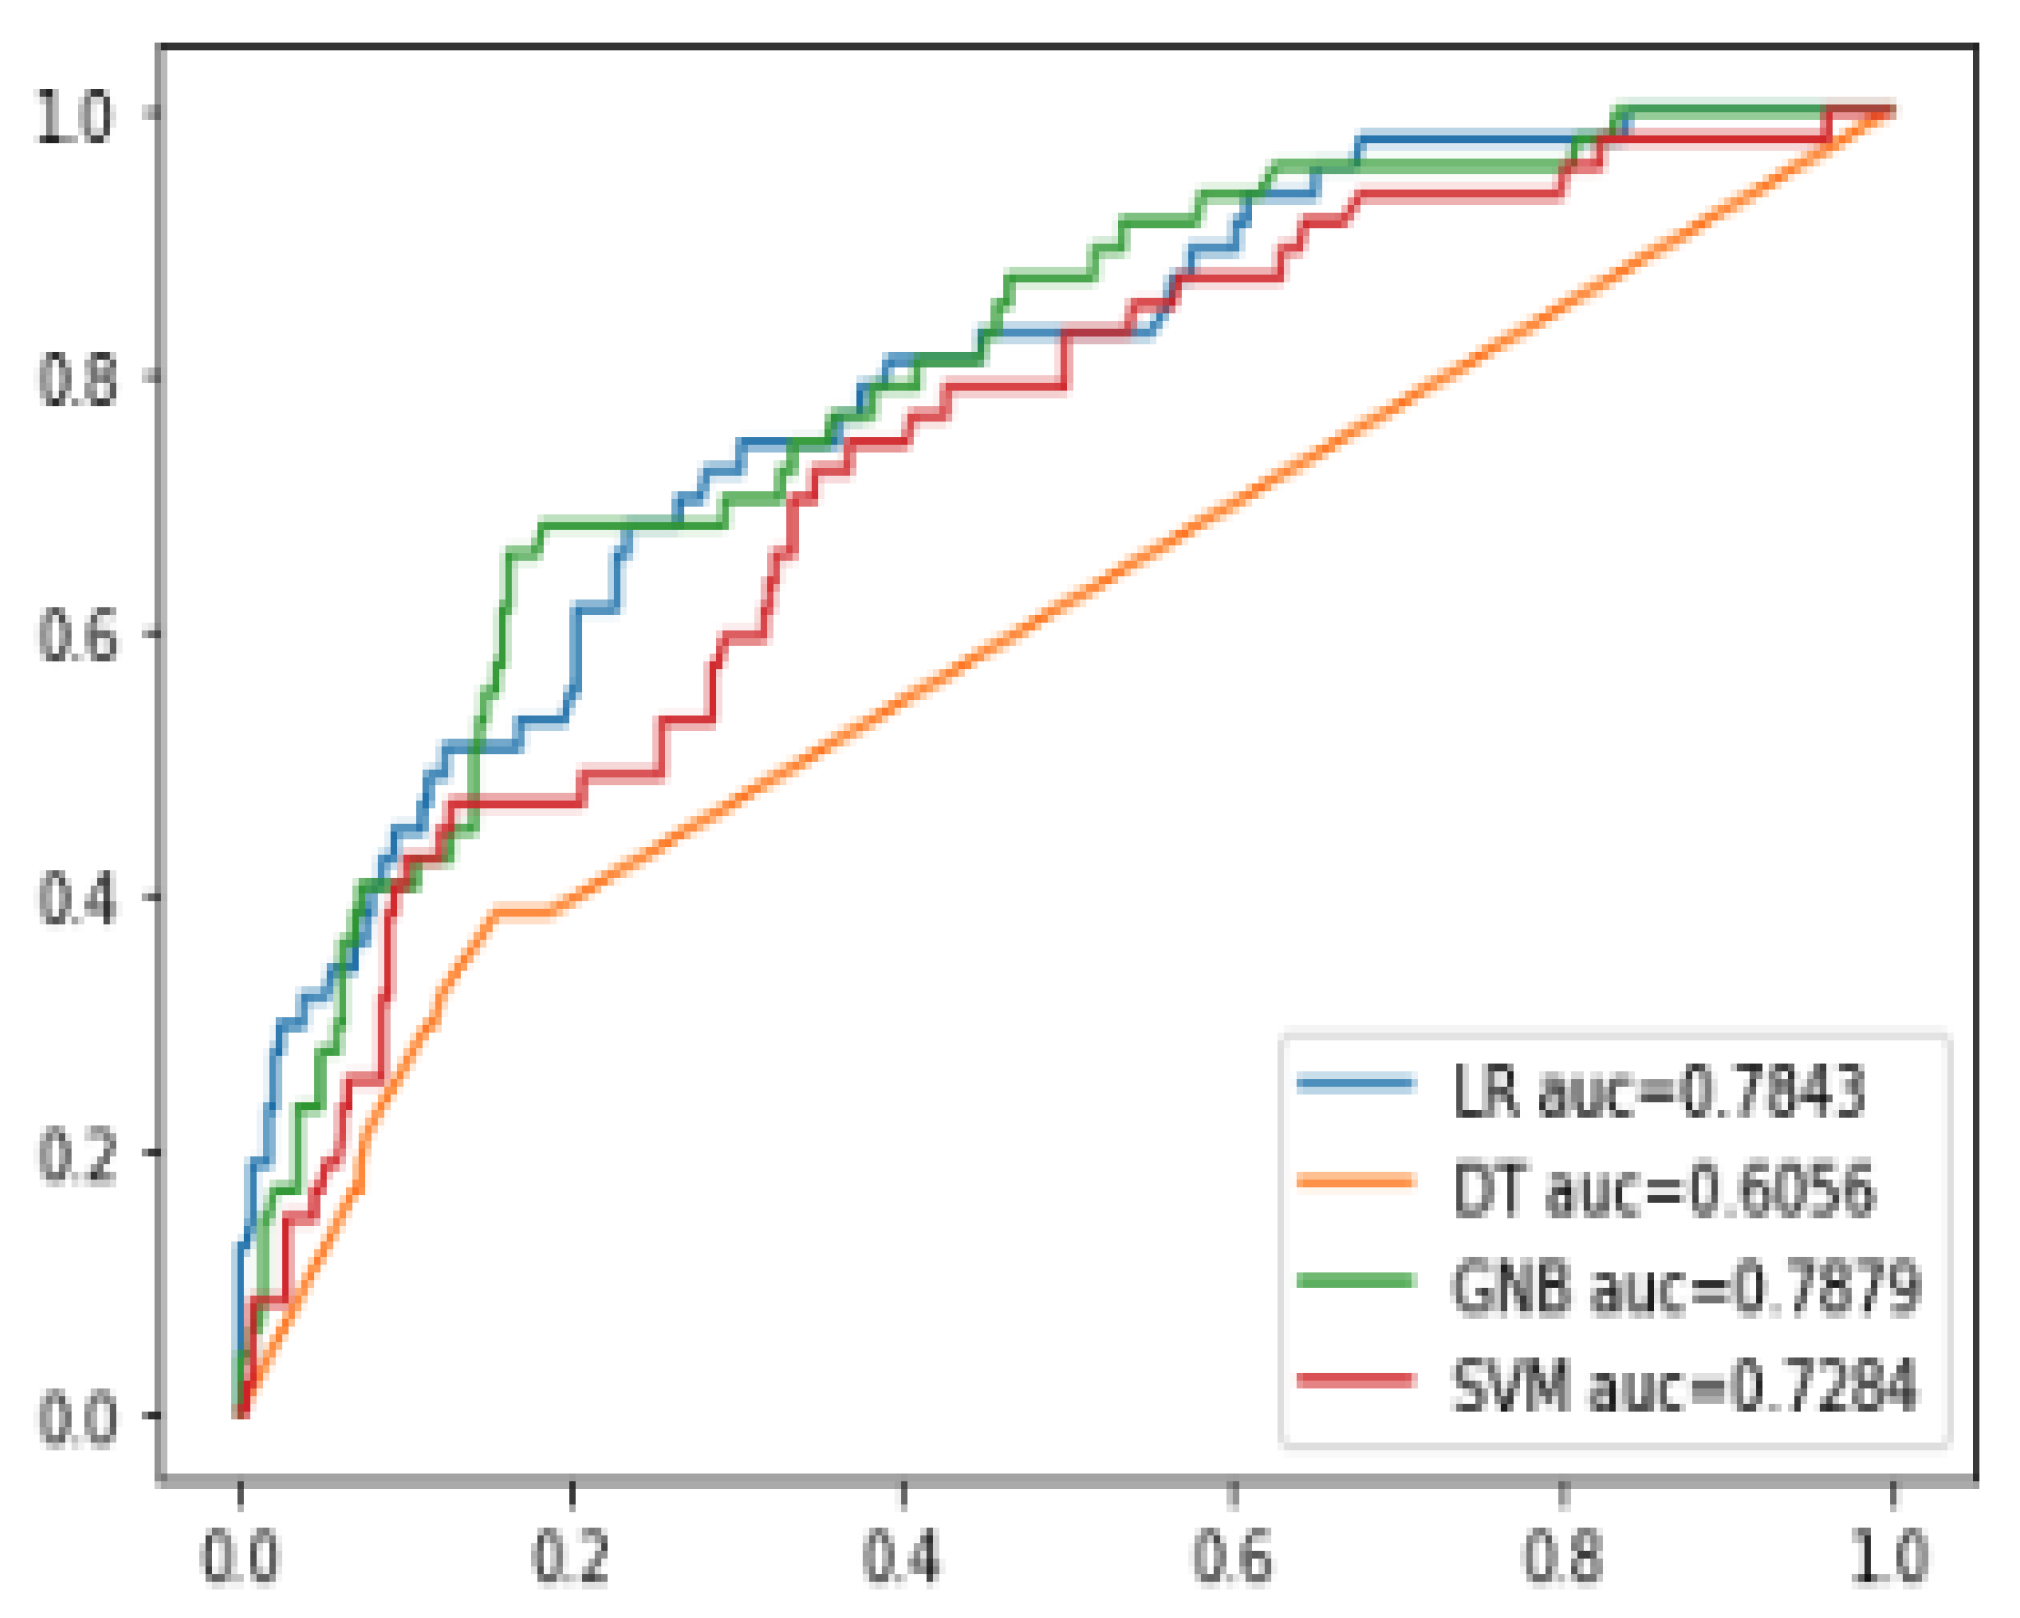
2.8. Model Selection

For our classification model, we looked at four fundamental machine learning models: logistic regression (LR), Gaussian naïve Bayes (GNB), decision tree (DT), and support vector machine (SVM). We additionally considered ensemble models, such as the random forest model and stacking models (SM) (explained later in this paper). For all ML approaches, we considered 10-fold cross-validation to adequately evaluate the model’s performance while balancing the probability of overfitting and selection bias. All ML approaches were performed using Python software.
Representative datasets measuring psychological wellbeing naturally have imbalanced class distributions as populations have greater numbers of people with lower stress levels than people with higher stress. To accommodate for this anticipated inequality, we incorporated a class weightage into the loss function. Specifically, more weightage was put on the higher stress classification, and the ratio of the weight was decided by the class distribution in the testing data while the model is trained.

3. Results

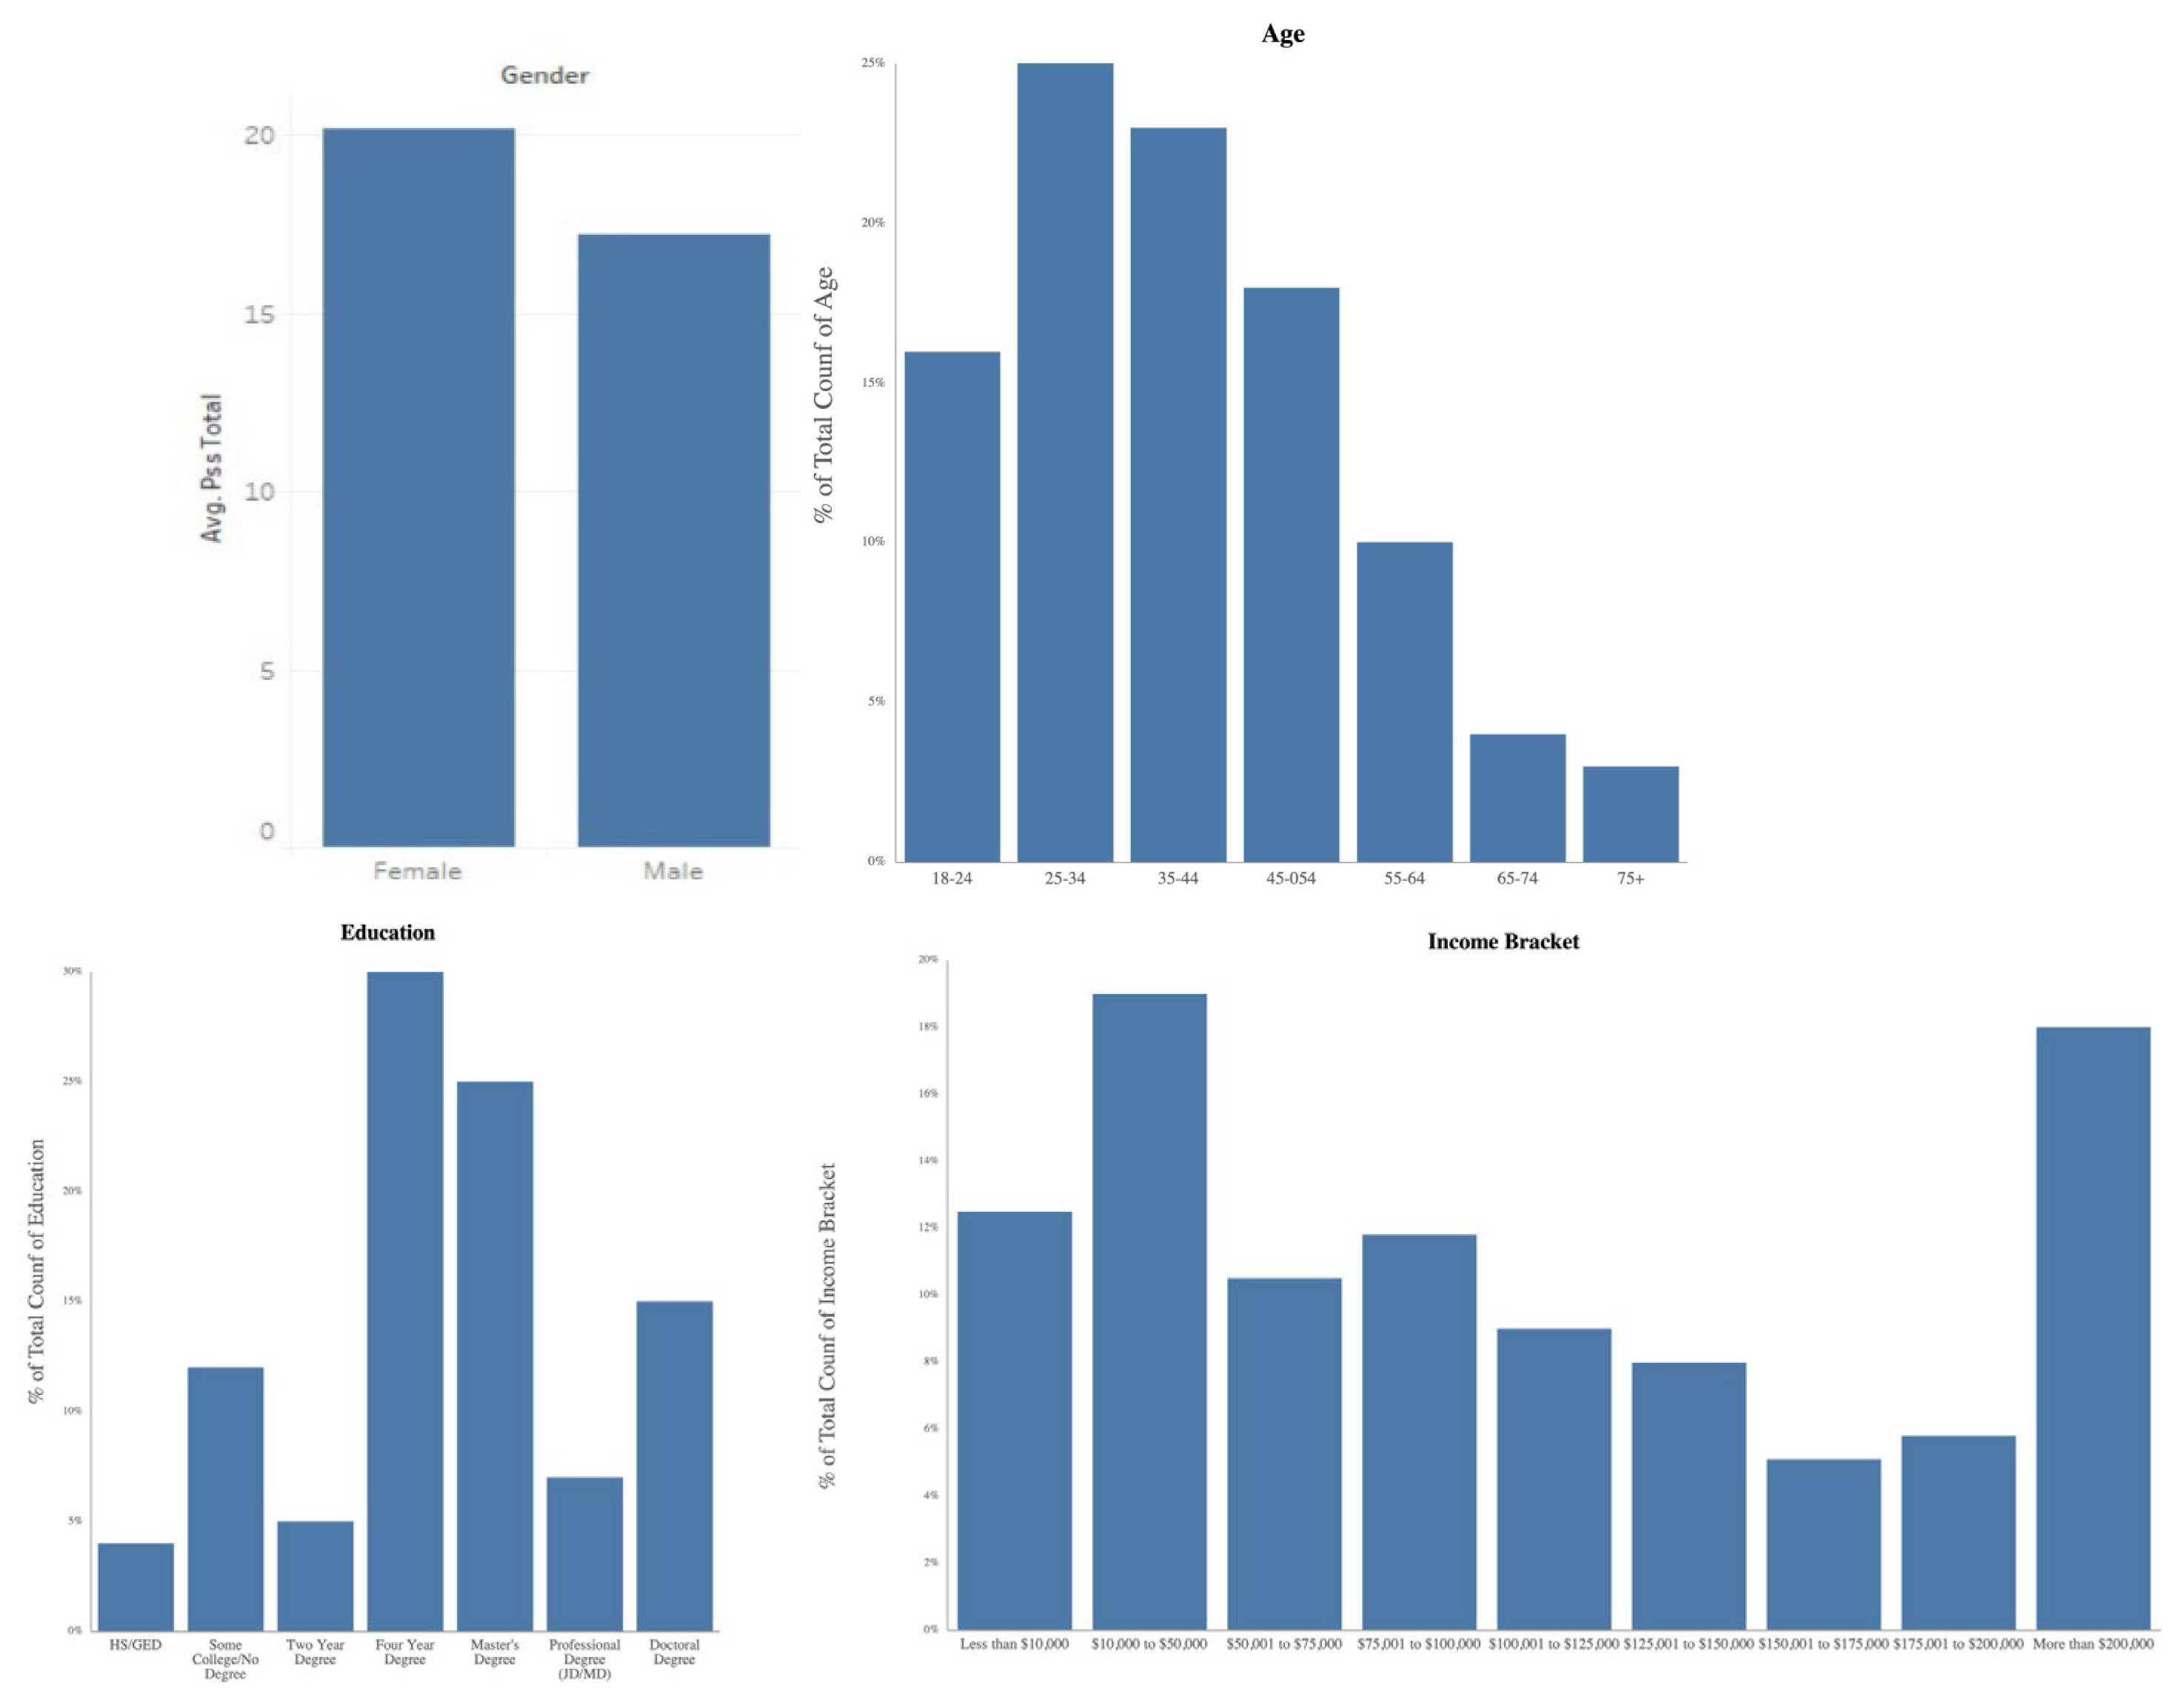
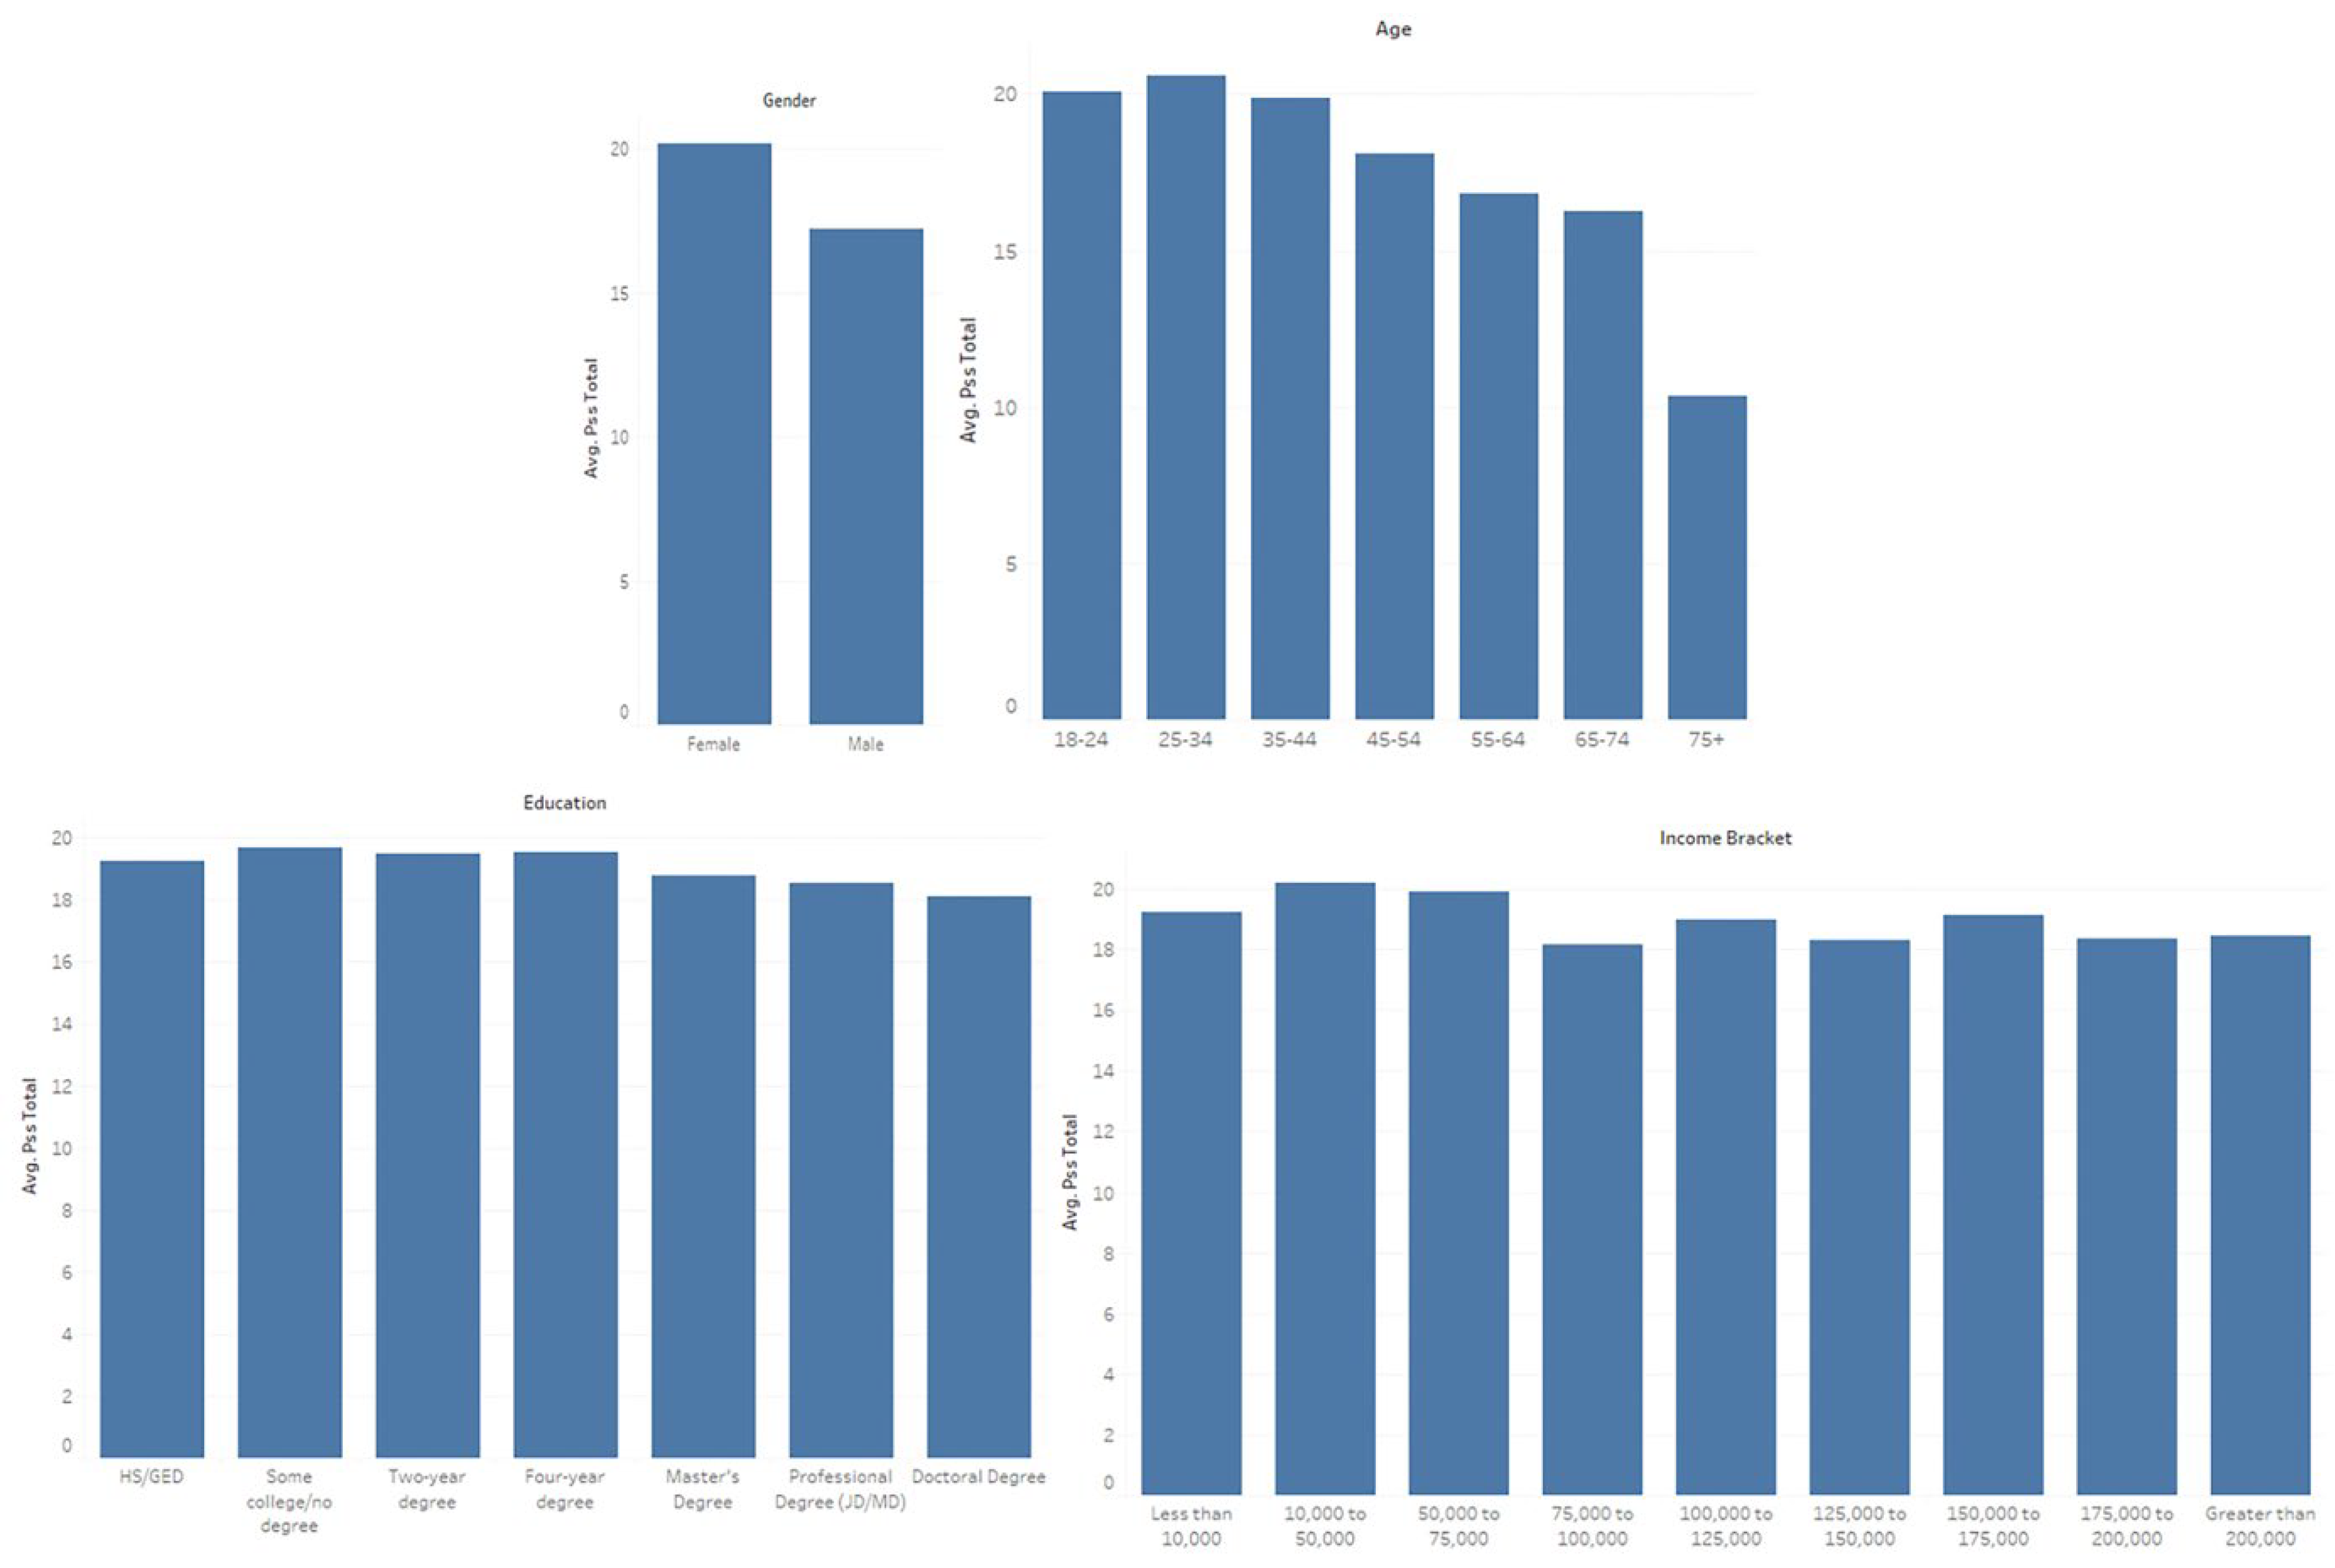
3.1. International Survey Demographics

When the PSS-10 total mean score was compared across a few of the survey response variables, younger females showed higher PSS-10 total mean scores. In addition, lower personal care and higher personal burden were also associated with higher PSS-10 total mean scores (Figure 2). The differences in stress by education or income did not appear as substantial.

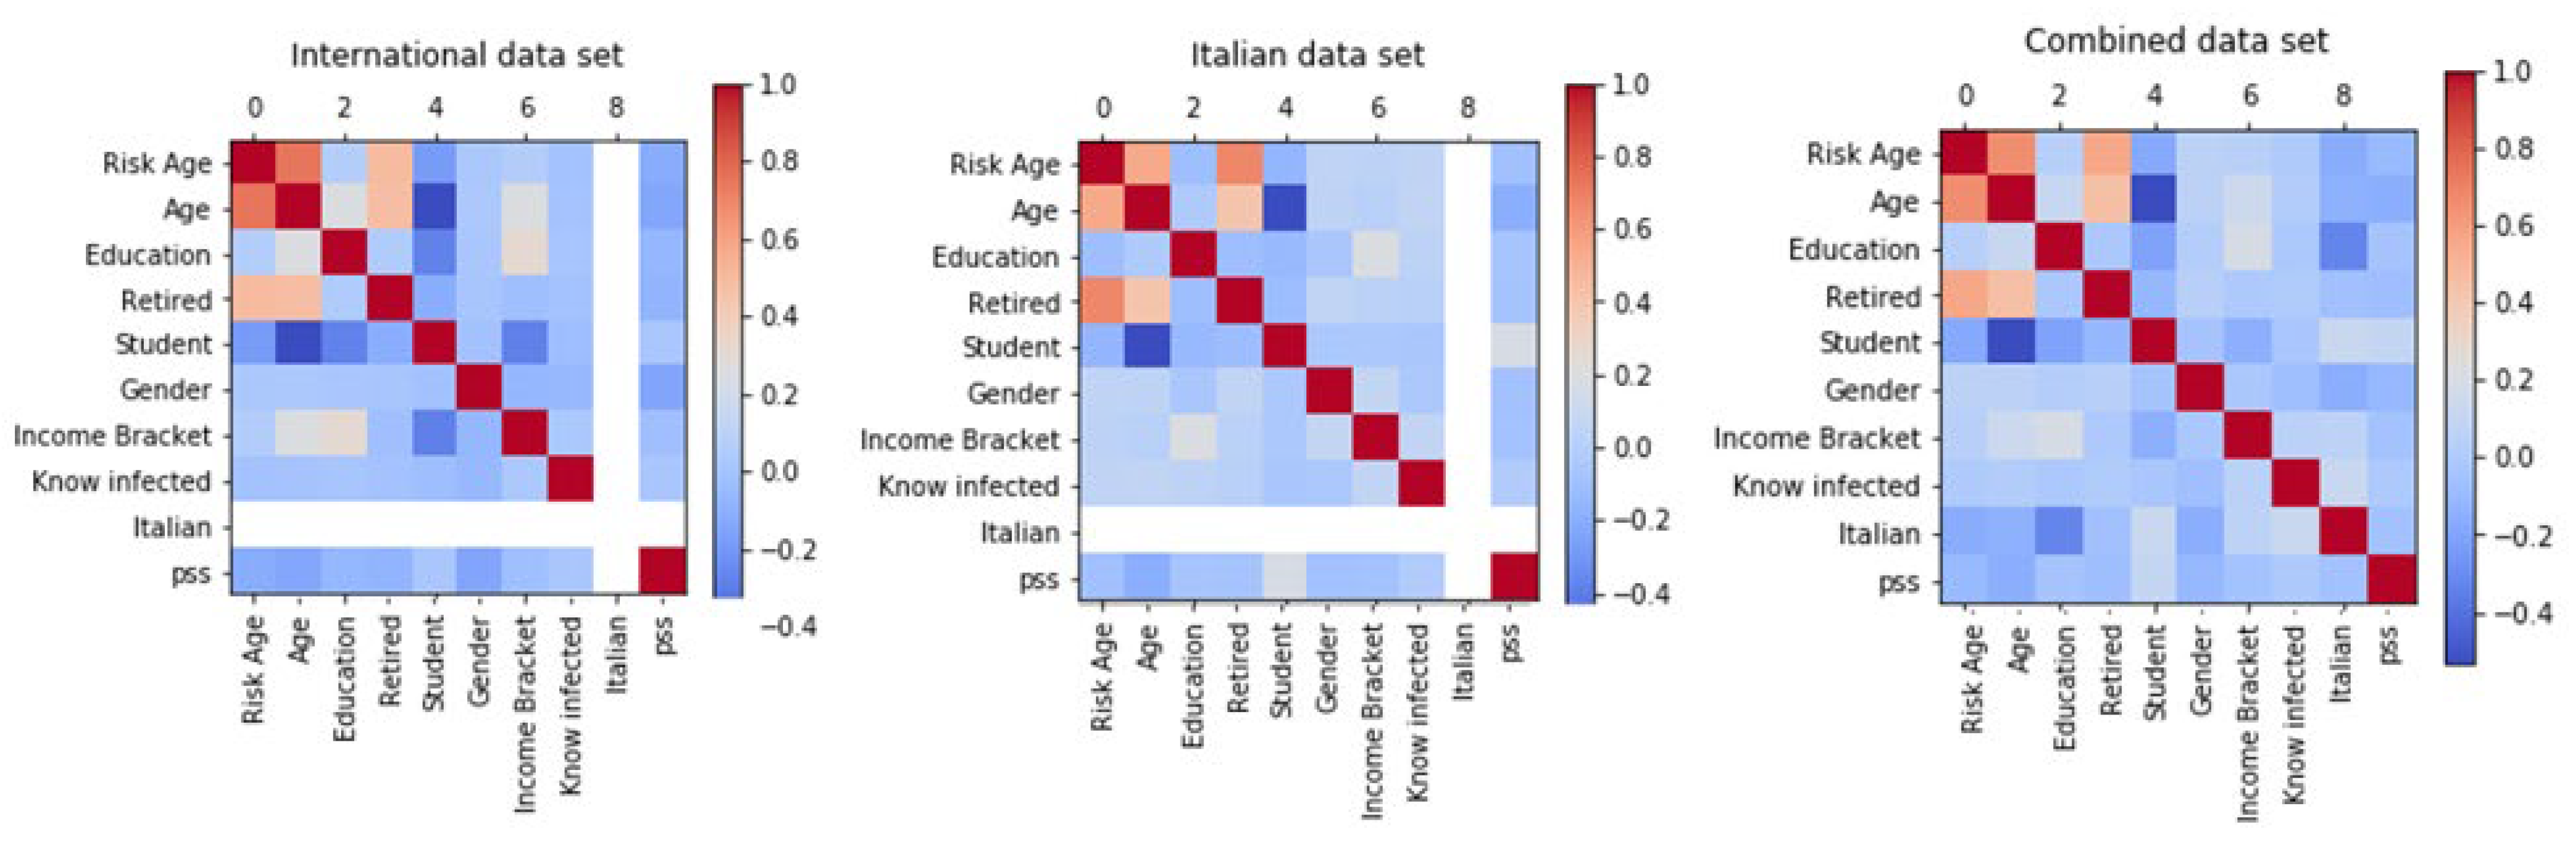
3.2. Correlation Analysis

To quantify the magnitude of the relationships between each independent variable and the total PSS-10 score, we performed correlations utilizing Pearson’s correlation coefficient.
“Low stress” was significantly (p < 0.05) negatively correlated with the total PSS-10 score and associated with a range of personal and lifestyle characteristics that included being male, married, older (higher age), employed full-time, higher education, high income, and high amounts of personal care (Figure 3). Inversely, “high stress” was associated with being female, single, a student, and having higher amounts of personal burden, which were all significantly (p < 0.05) positively correlated with the total PSS-10 (Figure 3).

3.3. Primary ML Analysis: Gaussian naïve Bayes (GNB)

When building our model, we first ran 10-fold cross-validation with our data, splitting it into 10 parts and using one part of the data as test data and the rest as training data for each iteration. The cross-validation score for each model shows that the GNB model has a relatively better performance than the rest of the models (see the Algorithm Comparison Plot in Figure S1). We provide the remainder of our results using this model and explain other models in the Supplementary Materials.
We performed an 80-20 split on the international dataset (Adamson et al., 2020), using 80% of the data as the training data and 20% of the data as the testing data. The ROC curves are shown in Figure 4 and indicate that all the models achieve an acceptable good (area under the curve, AUC > 0.7) except the decision tree model (DT) (see Table S1 in Supplementary Materials S2). In short, the models show a good trade-off between sensitivity and specificity, with a good discrimination performance.

3.4. Gaussian Naïve Bayesian (GNB) MODEL

The GNB classifier is a simple probabilistic classifier that is based on applying Bayes’ theorem with the assumption that there is strong independence between features and each feature has a normal distribution. Among all the methods applied, the GNB approach had the best performance, with a precision of 0.84 and a recall of 0.81 (See Table S1 in Supplementary Materials S2).

3.5. Sensitivity Analysis

To further validate our results, we compared the results from several ensemble models, such as random forest models (RFM) and stacking models (SM) (see Table S2 and Figure S2 in Supplementary Materials S2 and S3). The SM used uses logistic regression (GR), naïve Bayes (NB), and support vector machine (SVM) as the level-0 layer and logistic regression as the level-1 layer with the overall results in line with our prior best model of the GNB model (See Table S1 in Supplementary Materials S2).

3.6. Deep Learning Approach

Although the number of responses with the dataset was not ideal for complex deep learning algorithms (n is only 2000), we implemented a simple two-layer deep learning neural network to determine whether more complex approaches would result in better performing models (See Supplementary Materials S4).
The model had a standard RELU activation function between the hidden layers and a sigmoid activation function before the output layer. The loss function is binary cross-entropy. Testing the model on the same test sets as in the previous model iterations, the overall performance of the deep learning model is in line with those of the previous model (See Table S3 Supplementary Materials S2).

3.7. Interaction Analysis

Our earlier significant correlation between sex and high-stress levels is supported by prior research showing that being female is a key indicator of high stress during pandemic times. Consequently, we generated pair-wise products of each column to test if composite features would further improve our models with a focus on interactions with the variable “female”.
As the interaction effects are not independent, we chose logistic regression (LR) as the base model for our analysis on the interaction effects [16]. We computed the H-statistic for each pair-wise feature first and then computed the overall interaction strength for each feature pairing (See Supplementary Materials S5). Furthermore, as the strength of the interactions does not account for the directionality of each pairing, we chose the top three pairs with strength higher than 0.38 and incorporated those features into the features previously selected to determine the directionality of the interaction and if its inclusion would improve the overall performance of the model.
After repeating the feature selection using the new interaction features, the less_meditation feature was replaced by the no_change_sleep:female_feature. The results show that the overall performance of the LG model is identical to the results from the previous LG model (see Table S4 Supplementary Materials S2).

3.8. Integration with Italian Data

The methodological differences in the Italian survey limited the number of features that could be incorporated into both datasets. After conversion, nine features were incorporated into the model—age, education, retirement status, student status, sex, income bracket, and infection status. Figure 5 shows that the directionality and magnitude of all feature correlations were similar across all data.
The features for each of the datasets (international, Italian, and combined) were analyzed using Pearson correlation matrices to determine if the overall feature correlations would remain consistent. Consistently, in all the datasets, age and risk age are positively correlated. These two features are also positively correlated with the condition of being retired. Moreover, the datasets show a consistent negative correlation between age and being a student and, although weaker, a negative correlation between being a student and risk age, and between being a student and education.
We ran the previous algorithms on the newly combined dataset. The naïve Gaussian (NG) model applied on the combined dataset achieved the highest performance score (precision = 0.73, recall = 070, F1 score = 0.72, AUC = 0.64, see Table S5 Supplementary Materials S2).

4. Discussion

The objective of our study was to identify global indicators of pandemic-related stress that traverse geographic and cultural boundaries. We amalgamated data from two independent global surveys across twelve countries and spanning four continents collected during the first wave of the mandated public health measures aimed at mitigating COVID-19.
Our results show that machine learning is an apropos tool to elucidate underlying predictive factors in large, complex, heterogeneous datasets without invalidating model assumptions. The superiority of ML over other modeling techniques is its focus on accuracy rather than inference through the iterative cross-validation process of test/learn. The results of our model revealed a significant positive correlation between the PSS-10 scores and gender, relationship status, and groups. In other words, across 12 countries, being, a young, single woman is associated with a higher personal burden and experiencing significant levels of stress during the early months of the pandemic.
Our results on gender disparities are consistent with prior findings [17]. In China [18], reported that women endorsed higher levels of hyperarousal, difficulty sleeping, and negative reactions or moods, symptoms commonly associated with posttraumatic stress disorder. Several studies proposed that the disproportionate number of women experiencing “high stress” is potentially attributable to women being more likely to work in high-risk environments, such as clinics, or as a function of their status as primary caregivers to children, significant others, or parental figures [19,20,21,22,23].
An international study revealed that most young people experienced severe stress during the early months of the pandemic [24]. The absence of typically protective factors, such as a social support network, and loneliness profoundly and negatively impacted single participants, illustrated by the negative correlations between stress and participants in relationships [25]. A concerning rise has been reported in depression, anxiety, drug addiction, and suicidal ideation in teenagers and young adults [26,27,28]. Our findings, as with others, suggest that resources should be allocated to address symptoms associated with psychological distress indirectly triggered by the necessary mitigation measures of the COVID-19 pandemic.
We believe our combined results provide clinicians, researchers, and decision-makers with sufficient evidence to investigate the mechanisms of stress in individuals worldwide. This will enable the prompt introduction of novel interventions to mitigate the potential long-term impact of psychological stress during future global-scale events similar to the COVID-19 pandemic.

4.1. Limitations

Although our final ML model provided accurate and robust variable classification and good generalizability, we encountered challenges during the process, and our model has limitations. Survey data are inexorably prone to biases, as illustrated by the survey responses in the [5] dataset that skewed towards female, well-educated, and higher-income households. The integration of survey data is arduous and may contain disparate survey questions that lead to response types often resulting in limited usable factors from which to build a model. The sixty-plus independent factors in the [13] survey and forty-plus independent factors in the [5] survey produced only nine viable factors in the combined dataset for integrated analysis. Ethnicity, a potentially important indicator of stress during a pandemic, was only collected in the US and thus could not be applied to the model using the global findings.
Our combined sample size of 3738 across the 12 datasets fell short of the recommended size to build a highly accurate machine learning classification model (n = 4000). Our future goal is to test the accuracy of this model on a larger dataset.
While the modifications we made to the two datasets did remove some features from each of the individual datasets, we believe that the combination of these datasets across linguistic and cultural boundaries is a more apt methodology to explicate the underlying factors impacting psychological stress during the pandemic. Indeed, datasets from different countries overcome limitations of different systems and cultures and facilitate the generalizability of the results, confirming scientific research findings with settings and people outside of the original context, permitting broader universal inference and generalizability.

4.2. Future Directions

Our future goal is to repeat and validate this survey to elucidate whether the naive Bayesian (NB) approach will continue to be the most predictive of the models.
In the current model, the geographical location of the survey responders was a significant factor, but the survey responders in Germany, Pakistan, and Mexico were more likely to report “low stress” levels. With more virulent strains of COVID-19 emerging, it will be interesting to explore if geographical location does become a significant indicator of pandemic-related stress.

Supplementary Materials

The following are available online https://www.mdpi.com/article/10.3390/covid1040058/s1. Supplementary Materials S1: Figure S1. Algorithm comparison of different machine learning methods on the international dataset (Adamson et al., 2020); Supplementary Materials S2: Table S1. Model performance metrics of the different machine learning methods on the international dataset (Adamson); Table S2. Model performance metrics of the ensemble models versus the previous Gaussian Naïve Bayes model on the international dataset (Adamson); Table S3. Model performance metrics of the deep learning approach on the international dataset (Adamson); Table S4. Model performance metrics of the logistic regression model with added interaction features on the international dataset (Adamson); Table S5. Model performance metrics of different models on data integration; Supplementary Materials S3: Figure S2. Algorithm comparison of different ensemble models versus the previous Gaussian Naïve Bayes model on the international dataset (Adamson); Supplementary Materials S4: Figure S3. Representation of a simple two-layer deep learning neural network; Supplementary Materials S5: Figure S4. Representation of pair-wise interaction strength between female and all other independent variables in the international data set (Adamson et al., 2020); Supplementary Materials S6: Figure S5. Algorithm comparison of Gaussian Naïve Bayes model applied on the international data set (Adamson), the Italian Flesia data set, and the combined data set.

Author Contributions

M.M.A. devised the main research topic, E.Y.Z. and D.X. planned and carried out the ML analysis. M.M.A., E.C., M.M., E.Y.Z. and conceived the conceptual ideas and proof outline. E.Y.Z., D.X., M.G., E.C., M.M., R.H., O.A.H. and M.M.A. drafted the manuscript, revised the manuscript critically, and gave the final approval for the version to be published. All authors have read and agreed to the published version of the manuscript.

Funding

This research received no external funding.

Institutional Review Board Statement

Stanford University IRB. The Italian study was approved by the ethics committee for psychological research at the University of Padova (protocol number 3576, unique code 189B46FE116994F1A8D1077B835D83BB).

Informed Consent Statement

This was an anonymous survey and no PHI was collected. Therefore, no consent was deemed necessary to obtain.

Data Availability Statement

The datasets analyzed in this article are not publicly available. Requests to access the datasets should be directed to [email protected].

Conflicts of Interest

The authors declare no conflict of interest.

References

  1. Galea, S.; Merchant, R.M.; Lurie, N. The mental health consequences of COVID-19 and physical distancing: The need for prevention and early intervention. JAMA Intern. Med. 2020, 180, 817–818. [Google Scholar] [CrossRef] [Green Version]
  2. Balkhair, A.A. COVID-19 Pandemic: A New Chapter in the History of Infectious Diseases. Oman Med. J. 2020, 35, e123. [Google Scholar] [CrossRef]
  3. Wang, C.; Pan, R.; Wan, X.; Tan, Y.; Xu, L.; Ho, C.S.; Ho, R.C. Immediate 1155 Psychological Responses and Associated Factors during the Initial Stage of the 2019 Coronavirus Disease (COVID-19) Epidemic among the General Population in China. Int. J. Environ. Res. Public Health 2020, 17, 1729. [Google Scholar] [CrossRef] [PubMed] [Green Version]
  4. Mazza, C.; Ricci, E.; Biondi, S.; Colasanti, M.; Ferracuti, S.; Napoli, C.; Roma, P. A Nationwide Survey of Psychological Distress among Italian People during the COVID-19 Pandemic: Immediate Psychological Responses and Associated Factors. Int. J. Environ. Res. Public Health 2020, 17, 3165. [Google Scholar] [CrossRef]
  5. Adamson, M.M.; Phillips, A.; Seenivasan, S.; Martinez, J.; Grewal, H.; Kang, X.; Coetzee, J.; Luttenbacher, I.; Jester, A.; Harris, O.A.; et al. International prevalence and correlates of psychological stress during the global COVID-19 pandemic. Int. J. Environ. Res. Public Health 2020, 17, 9248. [Google Scholar] [CrossRef] [PubMed]
  6. Hopfenbeck, T. The Role and Value of International Datasets and Comparisons in Education Research. Res. Intell. 2012, 119, 7–8. [Google Scholar]
  7. Polit, D.F.; Beck, C.T. Generalization in quantitative and qualitative research: Myths and strategies. Int. J. Nurs. Stud. 2010, 47, 1451–1458. [Google Scholar] [CrossRef] [Green Version]
  8. Harlow, L.L.; Oswald, F.L. Big data in psychology: Introduction to the special issue. Psychol. Methods 2016, 21, 447. [Google Scholar] [CrossRef] [PubMed] [Green Version]
  9. Stachl, C.; Pargent, F.; Hilbert, S.; Harari, G.M.; Schoedel, R.; Vaid, S.; Gosling, S.D.; Bühner, M. Personality research and assessment in the era of machine learning. Eur. J. Pers. 2019, 34, 613–631. [Google Scholar] [CrossRef]
  10. Orrù, G.; Monaro, M.; Conversano, C.; Gemignani, A.; Sartori, G. Machine Learning in Psychometrics and Psychological Research. Front. Psychol. 2020, 10, 2970. [Google Scholar] [CrossRef]
  11. Cawley, G.C.; Talbot, N.L.C. On over-fitting in model selection and subsequent selection bias in performance evaluation. J. Mach. Learn. Res. 2010, 11, 2079–2107. [Google Scholar]
  12. Stone, M. Cross-validatory choice and assessment of statistical predictions. J. R. Stat. Soc. Ser. B Methodol. 1974, 36, 111–133. [Google Scholar] [CrossRef]
  13. Flesia, L.; Monaro, M.; Mazza, C.; Fietta, V.; Colicino, E.; Segatto, B.; Roma, P. Predicting Perceived Stress Related to the Covid-19 Outbreak through Stable Psychological Traits and Machine Learning Models. J. Clin. Med. 2020, 9, 3350. [Google Scholar] [CrossRef] [PubMed]
  14. Cohen, S.; Williamson, G. Perceived stress in a probability sample of the United States. Soc. Psychol. Health 1988, 13, 31–67. [Google Scholar] [CrossRef]
  15. Cohen, S.; Kamarck, T.; Mermelstein, R. A Global Measure of Perceived Stress. J. Health Soc. Behav. 1983, 24, 385–396. [Google Scholar] [CrossRef] [PubMed]
  16. Schütze, H.; Manning, C.D.; Raghavan, P. Introduction to Information Retrieval; Cambridge University Press: Cambridge, UK, 2008. [Google Scholar]
  17. Dong, E.; Du, H.; Gardner, L. An interactive web-based dashboard to track COVID-19 in real time. Lancet Inf. Dis. 2020, 20, 533–534. [Google Scholar] [CrossRef]
  18. Liu, N.; Zhang, F.; Wei, C.; Jia, Y.; Shang, Z.; Sun, L.; Wu, L.; Sun, Z.; Zhou, Y.; Wang, Y.; et al. Prevalence and predictors of PTSS during COVID-19 outbreak in China hardest-hit areas: Gender differences matter. Psychiatry Res. 2020, 287, 112921. [Google Scholar] [CrossRef]
  19. Thomson, K.C.; Jenkins, E.; Gill, R.; Richardson, C.G.; Gagné Petteni, M.; McAuliffe, C.; Gadermann, A.M. Impacts of the COVID-19 Pandemic on Family Mental Health in Canada: Findings from a Multi-Round Cross-Sectional Study. Int. J. Environ. Res. Public Health 2021, 18, 12080. [Google Scholar] [CrossRef]
  20. Angwenyi, V.; Kabue, M.; Chongwo, E.; Mabrouk, A.; Too, E.K.; Odhiambo, R.; Nasambu, C.; Marangu, J.; Ssewanyana, D.; Njoroge, E.; et al. Mental Health during COVID-19 Pandemic among Caregivers of Young Children in Kenya’s Urban Informal Settlements. A Cross-Sectional Telephone Survey. Int. J. Environ. Res. Public Health 2021, 18, 10092. [Google Scholar] [CrossRef]
  21. Hung, M.S.; Lam, S.K.; Chan, L.C.; Liu, S.P.; Chow, M.C. The Psychological and Quality of Life Impacts on Women in Hong Kong during the COVID-19 Pandemic. Int. J. Environ. Res. Public Health 2021, 18, 6734. [Google Scholar] [CrossRef]
  22. Suárez-Rico, B.V.; Estrada-Gutierrez, G.; Sánchez-Martínez, M.; Perichart-Perera, O.; Rodríguez-Hernández, C.; González-Leyva, C.; Osorio-Valencia, E.; Cardona-Pérez, A.; Helguera-Repetto, A.C.; Espino y Sosa, S.; et al. Prevalence of depression, anxiety, and perceived stress in postpartum Mexican women during the COVID-19 lockdown. Int. J. Environ. Res. Public Health 2021, 18, 4627. [Google Scholar] [CrossRef] [PubMed]
  23. Wade, M.; Prime, H.; Johnson, D.; May, S.S.; Jenkins, J.M.; Browne, D.T. The disparate impact of COVID-19 on the mental health of female and male caregivers. Soc. Sci. Med. 2021, 275, 113801. [Google Scholar] [CrossRef] [PubMed]
  24. Varma, P.; Junge, M.; Meaklim, H.; Jackson, M.L. Younger people are more vulnerable to stress, anxiety and depression during COVID-19 pandemic: A global cross-sectional survey. Prog. Neuro-Psychopharmacol. Biol. Psychiatry 2021, 109, 110236. [Google Scholar] [CrossRef] [PubMed]
  25. Racine, N.; McArthur, B.A.; Cooke, J.E.; Eirich, R.; Zhu, J.; Madigan, S. Global prevalence of depressive and anxiety symptoms in children and adolescents during COVID-19: A meta-analysis. JAMA Pediatrics 2021, 175, 1142–1150. [Google Scholar] [CrossRef]
  26. Al Omari, O.; Al Sabei, S.; Al Rawajfah, O.; Abu Sharour, L.; Aljohani, K.; Alomari, K.; Shkman, L.; Al Dameery, K.; Saifan, A.; Al Zubidi, B.; et al. Prevalence and predictors of depression, anxiety, and stress among youth at the time of COVID-19: An online cross-sectional multicountry study. Depress. Res. Treat. 2020. [Google Scholar] [CrossRef] [PubMed]
  27. Sher, L. The impact of the COVID-19 pandemic on suicide rates. QJM Int. J. Med. 2020, 113, 707–712. [Google Scholar] [CrossRef] [PubMed]
  28. Wu, Z.; McGoogan, J.M. Characteristics of and Important Lessons From the 1175 Coronavirus Disease 2019 (COVID-19) Outbreak in China. JAMA 2020, 323, 1239–1242. [Google Scholar] [CrossRef]
Figure 1. Visual representation of mean PSS score by survey respondent demographic breakdown.
Covid 01 00058 g001
Figure 2. Visual representation of the total PSS-10 score by survey respondent demographic breakdown.
Covid 01 00058 g002
Figure 3. Correlation of independent variables and PSS-10.
Covid 01 00058 g003
Figure 4. ROC curves of the different machine learning methods on the international dataset (Adamson).
Covid 01 00058 g004
Figure 5. Correlation heatmap matrices for the international, Italian, and combined datasets.
Covid 01 00058 g005
Publisher’s Note: MDPI stays neutral with regard to jurisdictional claims in published maps and institutional affiliations.

