Abstract
People infected asymptomatically with SARS-CoV-2 can spread the virus very efficiently. To break infection chains, massive testing efforts are underway. While the value of RT-PCR in asymptomatic patients is established, point-of-care (POC) antigen tests against SARS-CoV-2 are considered inferior to RT-PCR in terms of sensitivity and specificity but have demonstrated utility, mostly in symptomatic patients. We compared the performance of three different antigen tests with colorimetric (Roche), fluorometric (Quidel Sofia 2), and instrument-based chemiluminescent (Fujirebio Lumipulse® G) readout. Sensitivities for Roche, Quidel, and Fujirebio were 62.5%, 90.9%, 97.5% (≤ct 26); 43.8%, 90.9%, 95.1% (≤ct 30); and 4.3%, 0.0%, 57.6% (˃ct 30), respectively. The two assays with increased sensitivity were employed to screen > 35,000 passengers at German airports under time constraints. Under real-world conditions, the rate of false positives was low: 0.15% (Quidel) and 0.06% for the instrument based Fujirebio assay. Our study exemplifies that antigen tests with enhanced detection methods have an acceptable sensitivity of >90% in samples containing SARS-CoV-2 RNA that are considered to be infectious. Therefore, our results support the view of the WHO that discourages the use of antigen assays with a sensitivity of “only” 80% for screening travelers.
1. Introduction
Since the discovery of Severe Acute Respiratory Syndrome Coronavirus-2 (SARS-CoV-2), RT-PCR-based diagnostic testing has been considered the gold standard due to its high sensitivity and specificity [1]. Due to globally rising numbers of infections and in order to meet the demands of testing and reduce transmission, SARS-CoV-2 antigen-detecting diagnostic tests have been developed in order to complement PCR-based testing [2,3]. Numerous commercially available antigen tests against SARS-CoV-2 have been established as a highly scalable addition to the gold standard virus genome identification using RT-PCR [4,5]. CE-IVD labelled antigen assay formats have demonstrated utility—with limitations—in symptomatic COVID-19 patients, as shown by various scientific publications and validation data [6].
The performance of such test formats in mostly asymptomatic non-COVID-19 individuals, for example travelers, is not so clear because virus load in asymptomatic individuals is significantly lower and test numbers are higher [7]. In contrast to symptomatic patients, asymptomatic COVID-19 cases do not develop symptoms over the duration of infection, but both are crucial drivers of transmission [8]. It has been estimated that 30–40% of people infected with SARS-CoV-2 are asymptomatic. Most of them do not know about their infection but contribute to a large proportion of new cases and transmissions [9,10]. Hence, the sensitivity and specificity of antigen tests must be considered and compared against routine virus RT-PCR in asymptomatic individuals.
Objectives:
- (I)
- Define the performance test characteristics of three different antigen testing formats: (1) point-of-care colorimetric read out, (2) point-of-care fluorometric, and (3) instrument-based chemiluminescent in asymptomatic testing of customers at German airports.
- (II)
- Assess the robustness of antigen testing performance over time by comparing positive and negative outcomes with RT-PCR results from samples collected and processed in parallel.
2. Materials and Methods
Our CE-IVD labelled RT-PCR system was performed, as described elsewhere [11]. The system has been calibrated with synthetic virus RNA standards through repeated external quality assessment schemes. A cycle threshold of 26 cycles represents 1,000,000 virus copies per milliliter, while 2000 virus copies per milliliter represents the limit of detection at 36 cycles.
All samples were taken from asymptomatic customers at the CENTOGENE airport centers in Frankfurt and Hamburg. The analysis was performed on site in laboratories adjacent (2 min walk) to the airport center. For analysis by chemiluminescence and RT-PCR in Frankfurt, samples were taken by shuttle to a nearby laboratory. Transport time was 15′ approximately twice an hour. The analysis was performed by trained laboratory personal.
For the point-of-care (POC) antigen test SARS-CoV-2 Rapid Antigen Test (Roche, Mannheim, Germany (Roc-AG)), two oropharyngeal dry swabs (CentoSwab™) were sampled in parallel, and one was used for antigen testing while the second swab went into RT-PCR as described. Dry swabs for antigen testing were handled as described in the manual, except for the fact that the elution buffer was added to the dry swab vial and not used in the plasticware included in the kit.
For the point-of-care fluorescence antigen test Sofia 2 SARS Antigen Fluorescent Immunoassay (Quidel, San Diego, USA (Q-AG)), a turbinate swab (provided by the supplier) and a dry swab (CentoSwab™) were sampled in parallel. The former was used for antigen testing while the latter went into RT-PCR as described [11]. The turbinate nasal swab was used according to the manufacturer’s manual.
For the instrument-based chemiluminescence antigen test Lumipulse® G SARS-CoV-2 Ag (Fujirebio, Zwijnaarde, Belgium (FRB-AG)), two oropharyngeal dry swabs (CentoSwab™) were sampled in parallel, and one was used for antigen testing while the second swab went into RT-PCR as described. Dry swabs for antigen testing were handled as described in the manual, except for the fact that the elution buffer (200 µL) was added to the dry swab.
All data processing took place exclusively in accordance with the consent of the users. The Corona Test Portal has been audited by Datenschutz cert GmbH and has been awarded the ips® (internet privacy standard—a nationally recognized standard for data protection and IT security testing of web services) seal of approval.
3. Results
3.1. Validation Results in Asymptomatic Travelers
Overall, in our asymptomatic cohort, the sensitivity of the SARS-CoV-2 Rapid Antigen Test (Roc-AG) was 20%, with a detection rate of 43.8% in samples with CT-values below 30 PCR cycles, which roughly corresponds to 100,000 viral copies (Table 1, Table 2 and Table 3). In contrast, both test formats with enhanced signal detection, Sofia SARS Antigen Fluorescent Immunoassay (Q-AG) and Lumipulse® G SARS-CoV-2 Ag (FRB-AG) showed an overall sensitivity of >75% (76.9% for Q-AG and 87.1% for FRB-AG), while sensitivity below 30 cycle CT values was 90.9% (Q-AG) and 95.1% (FRB-AG), respectively (see details in Table 3).

Table 1.
Sensitivity values of different antigen test formats compared simultaneously with RT-PCR samples. Results showing all CT values of the RT-PCR results.
Table 2.
Positive and negative AG results have been grouped according to CT values ≤ 26, ≤30, and ˃30 cycles. CT 26 corresponds to 106 copies per mL and is generally assumed to be the threshold for infectivity.
Table 3.
Summary of Table 2 given in percent.
For colorimetric point-of-care (POC) testing (Roc-AG), two series of dry swabs with 70 PCR-tested samples were tested according to the manufacturer’s protocols, except for the fact that oropharyngeal dry swabs (CentoSwab™) were used and sampling material were eluted by adding 200 µL PBS to the swabs. True positives (TP) accounted for 20% (8 of 40), while false-negatives (FN) where observed in 80% (32 of 40). Assuming an infectivity threshold at ~26 cycles with 1,000,000 virus particles per mL, the POC antigen sensitivity was 62.5% for samples with virus loads higher than 1,000,000 virus particles per mL.
While FN represented 50% of all samples with CT-values below 30 (12 of 24), this fraction was 95.7% in samples with CT-values ≥ 30 cycles (Table 2). True-negatives (TN) were seen in 97.6% of the cases (41 of 42), and one false-positive (FP) (2.4%) as compared with RT-PCR results from simultaneously collected oropharyngeal swabs. Figure 1 shows the sensitivity of all three antigen assays tested.
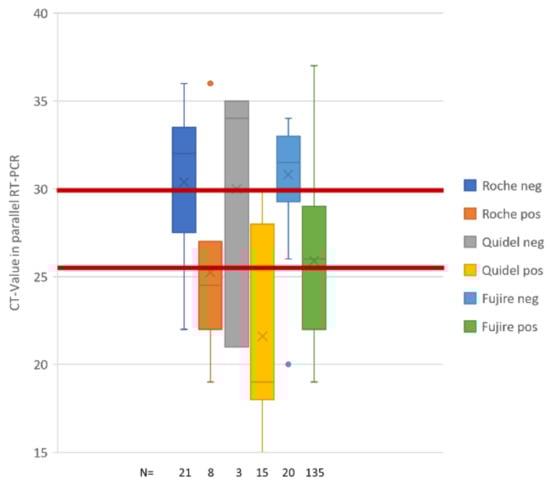
Figure 1.
Sensitivity of antigen formats tested. Box plots represents fractions of TP (pos) and FN (neg) for Roche POC (Roc-AG), Quidel Sofia2 (Q-AG), and Fujirebio lumipulse (FRB-AG) antigen assays. Columns are giving mean (cross), median (bar), and quartiles of TP and FN observations. The number of observations is given at the bottom of the graph. CT-values have always been collected in oropharyngeal swabs taken in parallel with the swab for antigen processing. Red bars depict cycle thresholds of 26 and 30 PCR cycles that correspond to 1,000,000 virus particles (26 cycles) and 100,000 virus particles, respectively. One million virus particles identified in a proband’s sample is considered significantly infectious according to German health authorities (Robert-Koch-Institut [12]).
For the fluorometric POC (Q-AG), a nasal swab (turbinate sampling) was compared with a concomitantly sampled oropharyngeal swab (CentoSwab™). A total of 13 PCR-positive samples were analyzed and TP summed up for 76.9% while FN were only observed in three cases. TP detections were seen up to CT 26. FN were rare; admittedly, samples with low virus particle content were rare in the cohort (Table 1 and Table 2). However, surveillance samples (see below) also covered this low-infectivity aspect of test performance.
The instrument-based chemiluminescence antigen test (FRB-AG) was also performed using dry swabs and an inactivation buffer provided by the manufacturer. A total of 155 RT-PCR positive samples were tested, where 135 samples were TP (87.1%) and 20 were FN (16.9%). TP detections were seen up to 37 cycles, equivalent to less than 2000 virus particles. Sensitivity at CT 26 was best still returning 97.5% of all TP.
Implementation of the colorimetric POC test system was not pursued due to inacceptable sensitivity and lack of potential to be integrated into digital workflows and, therefore, no additional surveillance samples were collected. We only implemented the fluorometric and instrument-based chemiluminescence antigen tests in our airport testing facilities, where robustness and performance were monitored in a surveillance interval over several weeks after deployment.
3.2. Surveillance Results in Asymptomatic Travelers
From 1 February to 31 March 2021, a total of 36,758 antigen tests were performed (317 antigen tests were controlled in a second dry swab sample that was taken together with the antigen samples). This reflected 0.6% of the total cohort and included all positive and technically failed antigen results. Details are given in Table 4.
Table 4.
RT-PCR results of systematic controls in positive and failed samples.
One hundred tests failed (97 Q-AG, 3 FRB-AG). Of these failed tests, 99 tests either also failed in RT-PCR (n = 6) or were reported as negative after RT-PCR (n = 93). Only one sample clearly showed positive RT-PCR results with CT-values of 16.2 (N1 gene) and 19.3 (N2 gene), respectively. In this respect, FRB-AG has a much better performance with less failed samples (0.02% vs. 0.47% failed for Q-AG).
Two hundred seventeen tests were termed positive by the CE-IVD marked analysis software (132 Q-AG, 85 FRB-AG), which reflected a fraction of 0.59% of all AG tests performed. Of those positive cases, 72.7% of all Q-AG and 81.2% of all FRB-AG were confirmed by positive amplification of SARS-CoV-2 RNA. This underscores a significantly higher positive predictive value for FRB-AG tests where the fraction of false-positives was only half of those found for Q-AG (24.2% for Q-AG vs. 11.8% for FRB-AG). Although Q-AG tests prima vista appeared to be more sensitive than FRB-AG tests, this difference was completely lost after deduction of false-positives and the addition of borderline positive RT-PCR results. The latter were identified when both viral targets (N1 and N2 gene) showed CT-values between 36 and 40 cycles.
The distribution of CT values of those true positive samples is given in Figure 2. Both antigen tests showed good performance for CT-values below 26 cycles (i.e., approx. 1,000,000 virus particles), while values between 26 and 30 cycles were underrepresented, and values >30 cycles (i.e., approx. less than 100,000 virus particles) were almost completely missing. FRB-AG had slightly higher (closer to expected) mean detected CT-values; however, the difference was not significant when compared with Q-AG.

Figure 2.
Normalized distribution of positively confirmed AG tests. Mean CT values (N1/N2 gene) of all RT-PCR positive samples in February and March 2021 (grey) have been compared with mean CT values of true positive Q-AG (blue) and FRG-AG (orange) samples, respectively. Y-axis represents PCR cycle number.
3.3. Normalized Distribution of Positively Confirmed Antigen Tests
After routine deployment of the verified tests, a total of 165 antigen tests (96 Q-AG, 69 FRB-AG) were confirmed by positive RNA amplification in oropharyngeal swabs taken at the same time in February and March 2021. For normalization of these results, the mean of N1 gene and N2 gene CT-values of all positive RT-PCR samples from 1 February to 31 March 2021 (n = 4.506) were sorted and plotted as a reference (Figure 3a). In contrast, normalized and ranked CT-values of true-positive Q-AG samples (n = 96) and FRB-AG (n = 69) showed preferential depletion of higher CT-values, as expected (Figure 3B,C). This illustration for missed positive individuals is also substantiated by the fraction of positive samples with CT-values below 26 and 30 cycles, respectively, where all RT-PCR samples aggregated for 74% below 26 cycles and 86% below 30 cycles, while this fraction for Q-AG was 85% below 26 cycles and 96% below 30 cycles, and for FRB-AG it was at 92% below 26 cycles and 98% below 30 cycles. This further indicates that even those more sensitive antigen test formats miss out on 10–15% of all positives with CT-values below 26 or 30 cycles, respectively. These findings are in line with the results of Corman et al. [4].
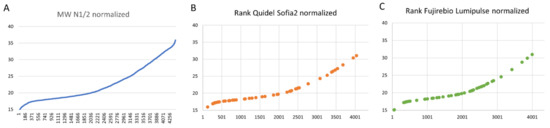
Figure 3.
Ranked CT-values for true positive antigen test results. The mean of N1 gene and N2 gene CT-values of all positive RT-PCR samples from 1 February to 31 March 2021 (n = 4.506) were sorted and plotted as a reference (A). This ranked list was used to define and illustrate the rank of the normalized CT-values of true-positive Q-AG samples (n = 96) and FRB-AG (n = 69) (B,C).
4. Discussion
While tens of thousands of samples have been described in point-of-care antigen testing approaches in symptomatic COVID-19 patients, the performance of POC antigen tests and laboratory instrument-based tests as compared with RT-PCR as a gold standard in asymptomatic individuals is scarce [5,13,14]. Nonetheless, such information is crucially important because the majority of POC antigen tests are used in population testing to provide safe travelling and schooling, or to provide safe working environments.
With a sensitivity expectation of >80% and a specificity expectation of >97%, the WHO [15] and many governmental health authorities have not set the bar for the performance of those widely used tests too high. Despite a recommendation of the WHO and ECDC that AG-tests should not be used for screening travelers [16,17], many countries have enabled travelling with a negative AG-test. However, no systematic analysis of antigen tests in larger asymptomatic cohorts has been provided. This holds especially true for the use of rapid antigen testing to facilitate safe cross border travelling at airports and other public transportation vehicles. International travel has been a prerequisite of turning the SARS-CoV-2 outbreak into a pandemic [18].
Our data gathered at German airports in Hamburg, Düsseldorf, and Frankfurt, with more than 200 antigen positives in a total cohort of more than 35,000 tests performed, represents the largest systematic cohort so far.
Our main findings confirm earlier observations in symptomatic COVID-19 patients demonstrating that standard point-of-care devices with colorimetric detection will identify less than 50% of all infectious asymptomatic individuals. Thus, our results confirm and reiterate the recommendation of the WHO [16] that rendering (non-improved) antigen tests are a very risky option of testing for safe travelling.
We could demonstrate that more sensitive antigen testing formats such as fluorometric or chemiluminescence-based tests are superior to colorimetric POC SARS-CoV-2 antigen tests. These superior tests can be employed routinely in airport under time constraints and provide significantly better testing performance. While the general sensitivity in travelers almost always covered those individuals with expected infectivity—and virus loads higher than 1,000,000 SARS-CoV-2 particles per sample—the rate of false-positives was twice as high in a plastic-device based fluorometric assay compared to a chemiluminescence-based assay run in a laboratory environment.
While FRG-Ag and Q-Ag are supposed to be different in terms of turnaround time, point-of-care availability, and production costs, both assay types displayed acceptable robustness for a one-time test shortly before a flight is boarded. However, for intercontinental flights, negative RT-PCR test results definitively will provide the highest predictive value and a higher safety margin.
In summary, we have shown the readiness of rapid antigen testing at airports to robustly identify asymptomatic but infectious travelers with SARS-CoV-2 infection.
An increased use imposes the significant risk that false-negative results will suggest to POCT-Ag negative asymptomatic probands (travelers) that hygienic safety measures, such as social distancing, medical masks, and frequent air exchange, are less necessary [19].
Author Contributions
Conceptualization, S.S. and P.B.; methodology, validation, L.P., N.V., J.H. (Jennifer Hannen), C.S. and A.S.; formal analysis, P.K., A.H., R.K., L.W. and P.B.; resources, V.W. and P.B.; writing—original draft preparation, P.B., S.S. and J.H. (Jörg Hartkamp); writing—review and editing, all authors.; supervision, S.S. and P.B. All authors have read and agreed to the published version of the manuscript.
Funding
This research received no external funding.
Institutional Review Board Statement
Ethical review and approval were waived for this study because we employed approved CE labeled standard laboratory tests on samples obtained for performing these tests. Our research did not include a new method or instrument. Thus, according to the declaration of Helsinki no statement of an ethics committee was necessary [20].
Informed Consent Statement
Informed consent was obtained from all subjects involved in the study.
Data Availability Statement
Not applicable.
Conflicts of Interest
L.P., N.V., J.H. (Jennifer Hannen), C.S., A.S., P.K., A.H., V.W., J.H. (Jörg Hartkamp), S.S. and P.B. are employees of CENTOGENE GmbH, Rostock, Germany; R.K., L.W., S.S. and P.B. are employees of Bauer Laboratoriums GmbH, Rostock, Germany; S.S. is an employee of Medizinisches Versorgungszentrum, Stralsund, Germany.
References
- Mathuria, J.P.; Yadav, R.; Rajkumar. Laboratory diagnosis of SARS-CoV-2-A review of current methods. J. Infect. Public Health 2020, 13, 901–905. [Google Scholar] [CrossRef] [PubMed]
- Loeffelholz, M.J.; Tang, Y.W. Laboratory diagnosis of emerging human coronavirus infections-the state of the art. Emerg. Microbes Infect. 2020, 9, 747–756. [Google Scholar] [CrossRef] [PubMed]
- Manabe, Y.C.; Sharfstein, J.S.; Armstrong, K. The Need for More and Better Testing for COVID-19. JAMA 2020, 324, 2153–2154. [Google Scholar] [CrossRef] [PubMed]
- Corman, V.M.; Haage, V.C.; Bleicker, T.; Schmidt, M.L.; Mühlemann, B.; Zuchowski, M.; Jo, W.K.; Tscheak, P.; Möncke-Buchner, E.; Müller, M.A.; et al. Comparison of seven commercial SARS-CoV-2 rapid point-of-care antigen tests: A single-centre laboratory evaluation study. Lancet Microbe 2021, 2, e311–e319. [Google Scholar] [CrossRef]
- Dinnes, J.; Deeks, J.J.; Berhane, S.; Taylor, M.; Adriano, A.; Davenport, C.; Dittrich, S.; Emperador, D.; Takwoingi, Y.; Cunningham, J.; et al. Rapid, point-of-care antigen and molecular-based tests for diagnosis of SARS-CoV-2 infection. Cochrane Database Syst. Rev. 2021, 3, CD013705. [Google Scholar] [CrossRef] [PubMed]
- Mak, G.C.; Lau, S.S.; Wong, K.K.; Chow, N.L.; Lau, C.S.; Lam, E.T.; Chan, R.C.; Tsang, D.N. Evaluation of rapid antigen detection kit from the WHO Emergency Use List for detecting SARS-CoV-2. J. Clin. Virol. 2021, 134, 104712. [Google Scholar] [CrossRef] [PubMed]
- Cevik, M.; Tate, M.; Lloyd, O.; Maraolo, A.E.; Schafers, J.; Ho, A. SARS-CoV-2, SARS-CoV, and MERS-CoV viral load dynamics, duration of viral shedding, and infectiousness: A systematic review and meta-analysis. Lancet Microbe 2021, 2, e13–e22. [Google Scholar] [CrossRef]
- Oran, D.P.; Topol, E.J. Prevalence of Asymptomatic SARS-CoV-2 Infection: A Narrative Review. Ann. Intemal Med. 2020, 173, 362–367. [Google Scholar] [CrossRef] [PubMed]
- Buitrago-Garcia, D.; Egli-Gany, D.; Counotte, M.J.; Hossmann, S.; Imeri, H.; Ipekci, A.M.; Salanti, G.; Low, N. Occurrence and transmission potential of asymptomatic and presymptomatic SARS-CoV-2 infections: A living systematic review and meta-analysis. PLoS Med. 2020, 17, e1003346. [Google Scholar] [CrossRef] [PubMed]
- Li, R.; Pei, S.; Chen, B.; Song, Y.; Zhang, T.; Yang, W.; Shaman, J. Substantial undocumented infection facilitates the rapid dissemination of novel coronavirus (SARS-CoV-2). Science 2020, 368, 489–493. [Google Scholar] [CrossRef] [PubMed] [Green Version]
- Beetz, C.; Skrahina, V.; Förster, T.M.; Gaber, H.; Paul, J.J.; Curado, F.; Rolfs, A.; Bauer, P.; Schäfer, S.; Weckesser, V.; et al. Rapid Large-Scale COVID-19 Testing During Shortages. Diagnostics 2020, 10, 464. [Google Scholar] [CrossRef] [PubMed]
- RKI. COVID-19: Entlassungskriterien aus der Isolierung. Available online: https://www.rki.de/DE/Content/InfAZ/N/Neuartiges_Coronavirus/Entlassmanagement-Infografik.pdf?__blob=publicationFile (accessed on 10 May 2021).
- Rasmussen, A.L.; Popescu, S.V. SARS-CoV-2 transmission without symptoms. Science 2021, 371, 1206–1207. [Google Scholar] [CrossRef] [PubMed]
- Pray, I.W. Performance of an Antigen-Based Test for Asymptomatic and Symptomatic SARS-CoV-2 Testing at Two University Campuses-Wisconsin, September–October 2020. MMWR Morb. Mortal. Wkly. Rep. 2021, 69, 1642–1647. [Google Scholar] [CrossRef] [PubMed]
- WHO. Antigen-Detection in the Diagnosis of SARS-CoV-2 Infection Using Rapid Immunoassays. 2020. Available online: https://apps.who.int/iris/bitstream/handle/10665/334253/WHO-2019-nCoV-Antigen_Detection-2020.1-eng.pdf?sequence=1&isAllowed=y (accessed on 25 April 2021).
- WHO. SARS-CoV-2 Antigen-Detecting RAPID diagnostic Tests: An Implementation Guide. 2020. Available online: https://www.who.int/publications/i/item/9789240017740 (accessed on 25 April 2021).
- EDCD. Options for the Use of Rapid Antigen Tests for COVID-19 in the EU/EEA and the UK. 2020. Available online: https://www.ecdc.europa.eu/sites/default/files/documents/Options-use-of-rapid-antigen-tests-for-COVID-19_0.pdf (accessed on 5 May 2021).
- Khanh, N.C.; Thai, P.Q.; Quach, H.L.; Thi, N.A.H.; Dinh, P.C.; Duong, T.N.; Mai, L.T.Q.; Nghia, N.D.; Tu, T.A.; Quang, L.N.; et al. Transmission of SARS-CoV 2 During Long-Haul Flight. Emerg. Infect. Dis. 2020, 26, 2617–2624. [Google Scholar] [CrossRef] [PubMed]
- Betsch, C.; Sprengholz, P.; Siegers, R.; Eitze, S.; Korn, L.; Goldhahn, L.; Schmitz, J.M.; Giesler, P.; Knauer, G.; Jenny, M.A. Empirical evidence to understand the human factor for effective rapid testing against SARS-CoV-2. Proc. Natl. Acad. Sci. USA 2021, 118, e2107179118. [Google Scholar] [CrossRef] [PubMed]
- Borovecki, A.; Mlinaric, A.; Horvat, M.; Smolcic, V.S. Informed consent and ethics committee approval in laboratory medicine. Biochem Med. 2018, 28, 030201. [Google Scholar] [CrossRef] [PubMed]
Publisher’s Note: MDPI stays neutral with regard to jurisdictional claims in published maps and institutional affiliations. |
© 2021 by the authors. Licensee MDPI, Basel, Switzerland. This article is an open access article distributed under the terms and conditions of the Creative Commons Attribution (CC BY) license (https://creativecommons.org/licenses/by/4.0/).