
Screening of a Small Number of Italian COVID-19 Syndrome Survivors by Means of the Fatigue Assessment Scale: Long COVID Prevalence and the Role of Gender


 ,
,
Abstract
:1. Introduction
2. Materials and Methods
3. Results
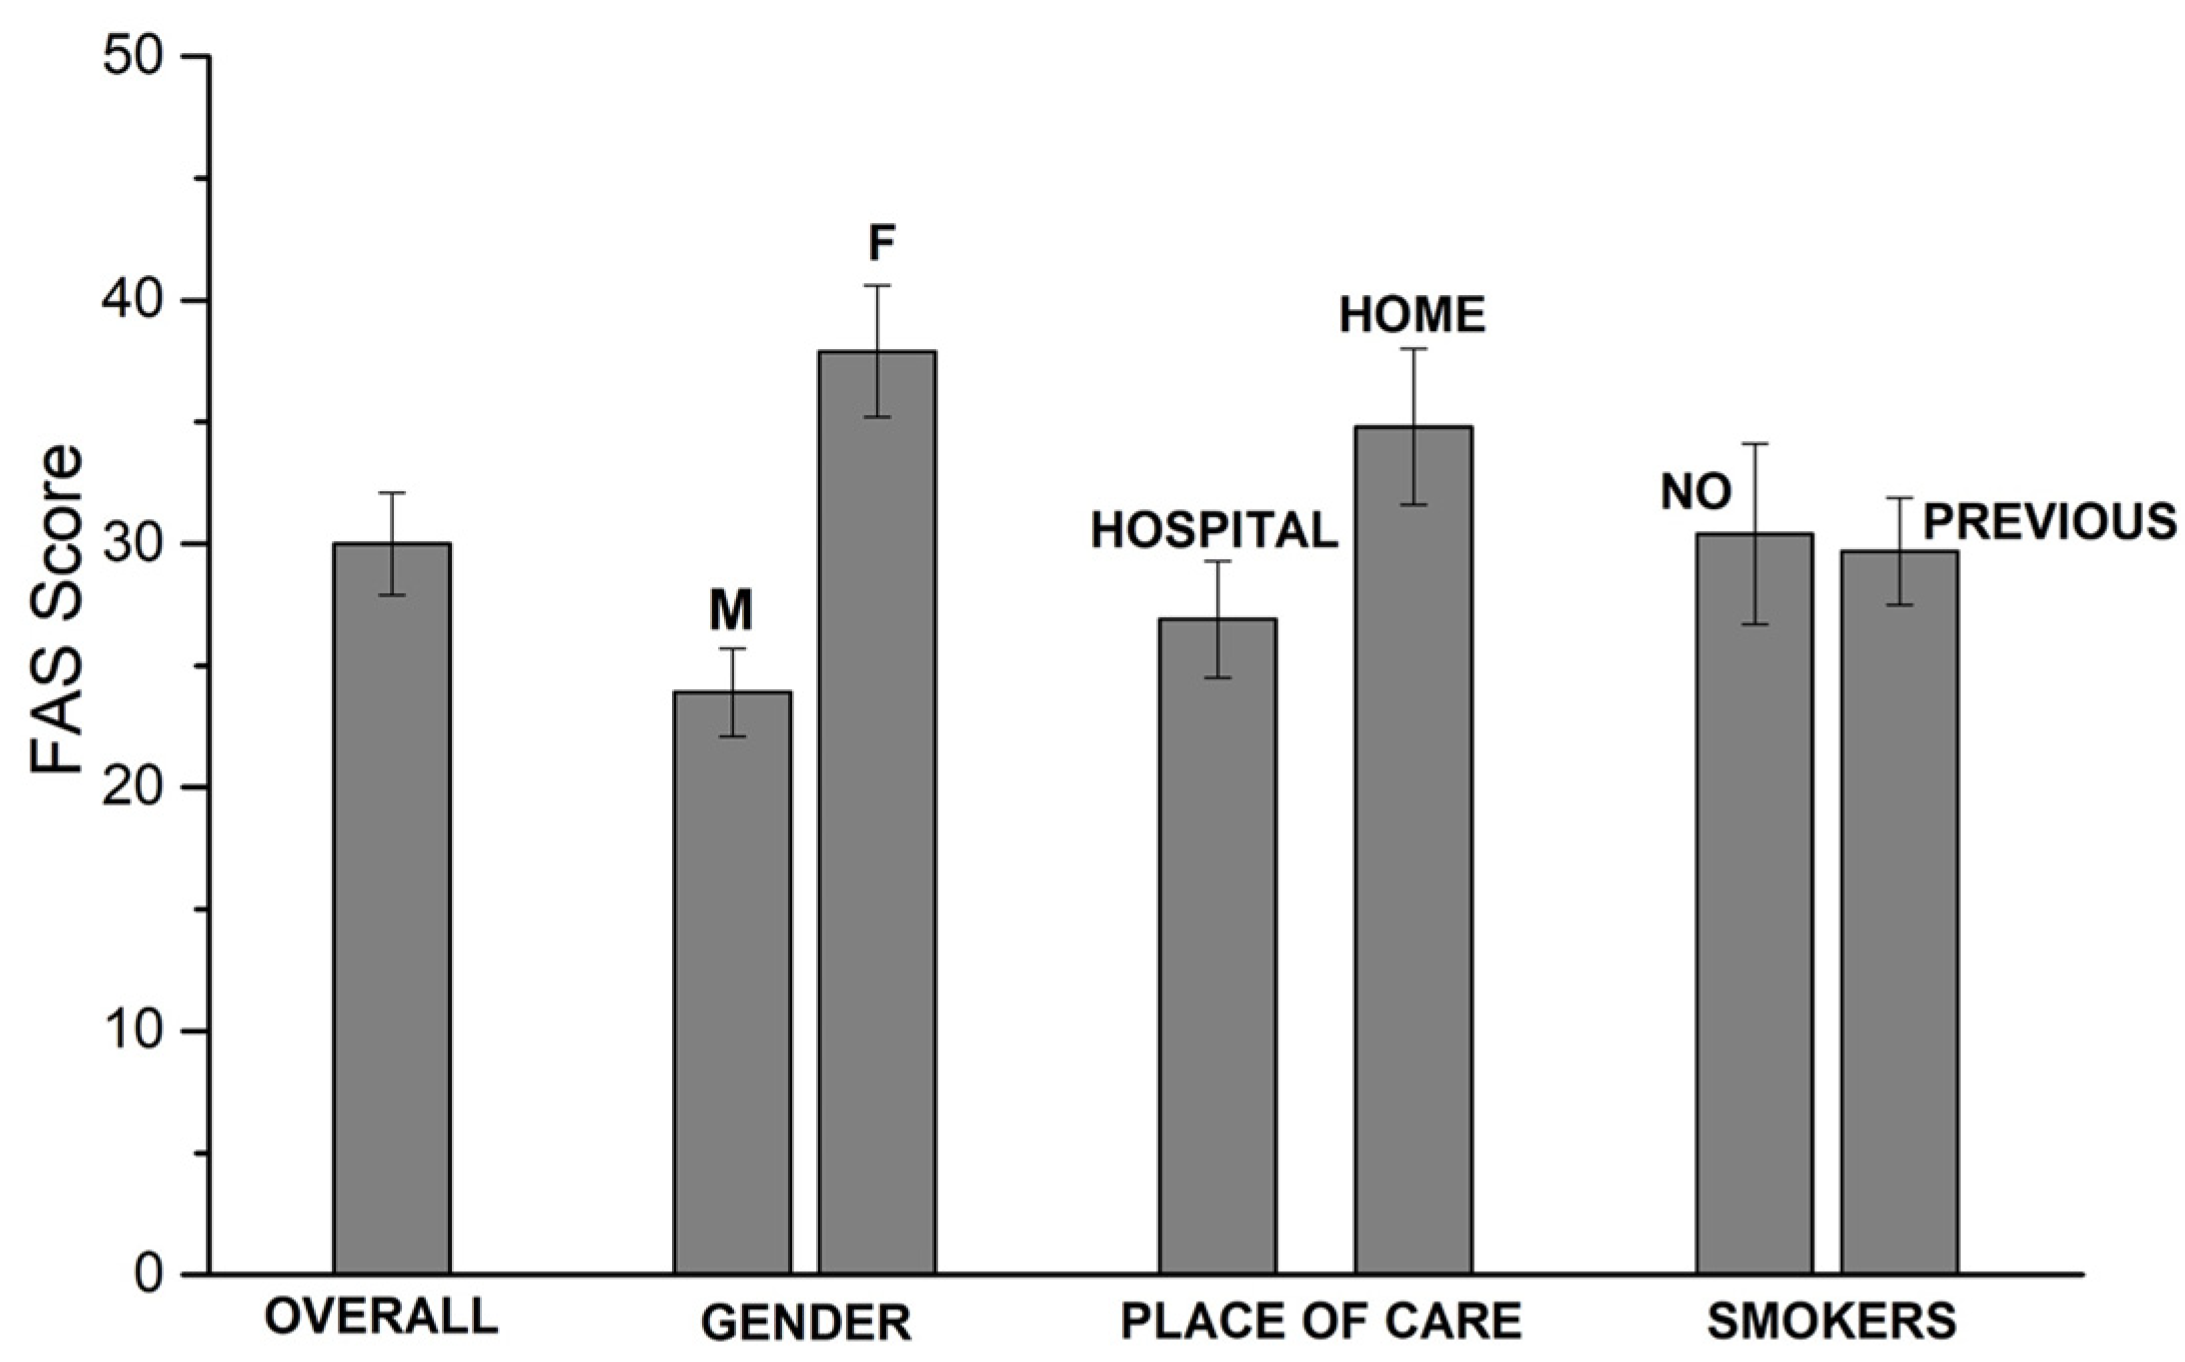
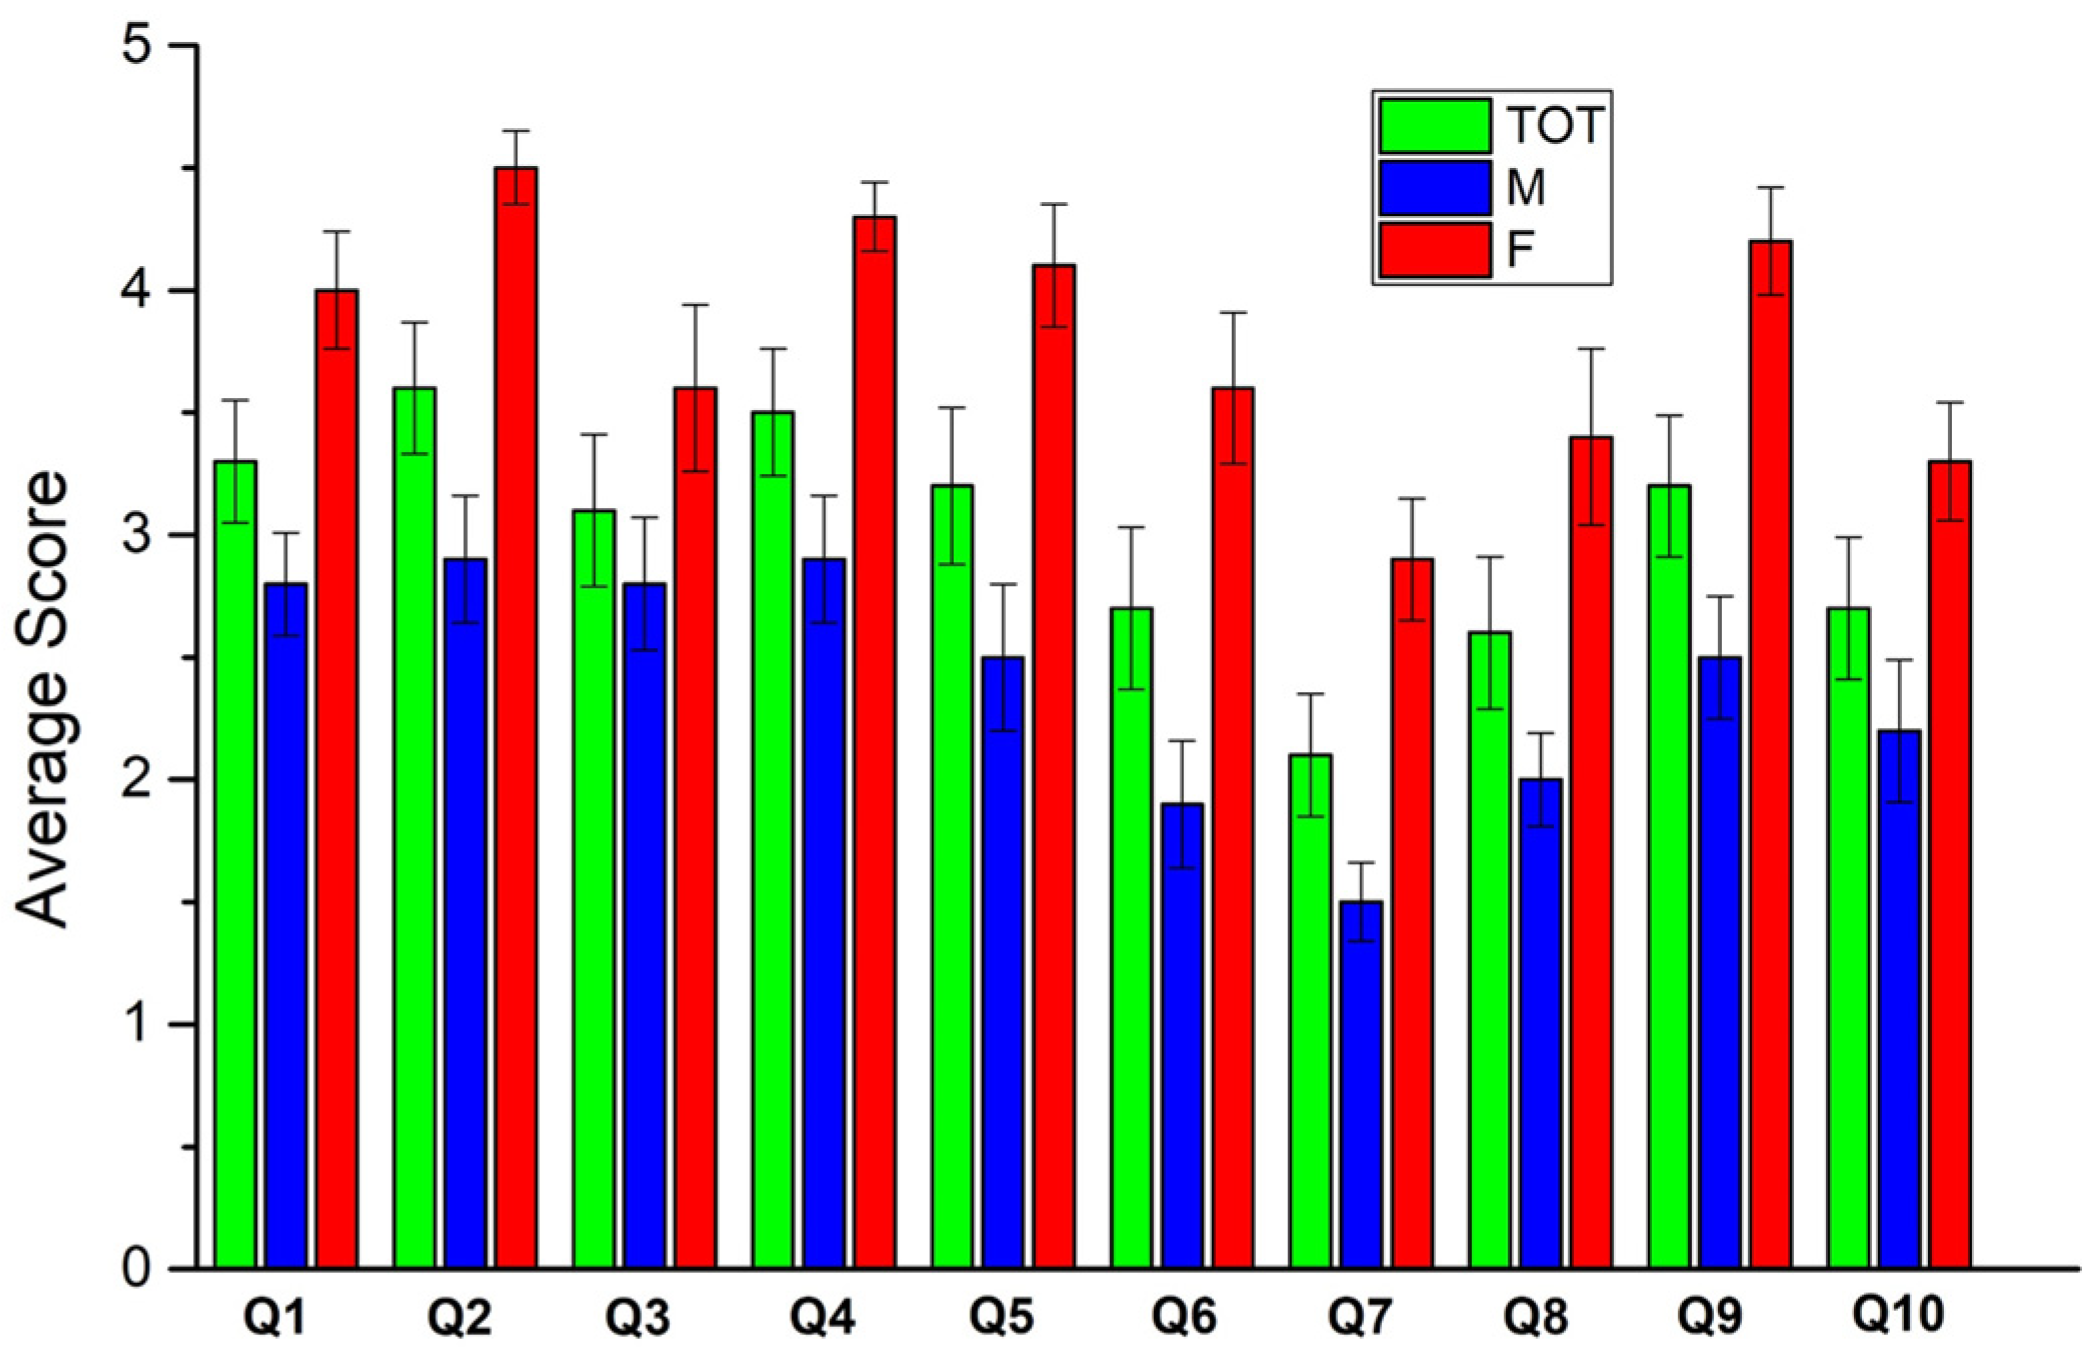
3.1. 1st Questionnaire
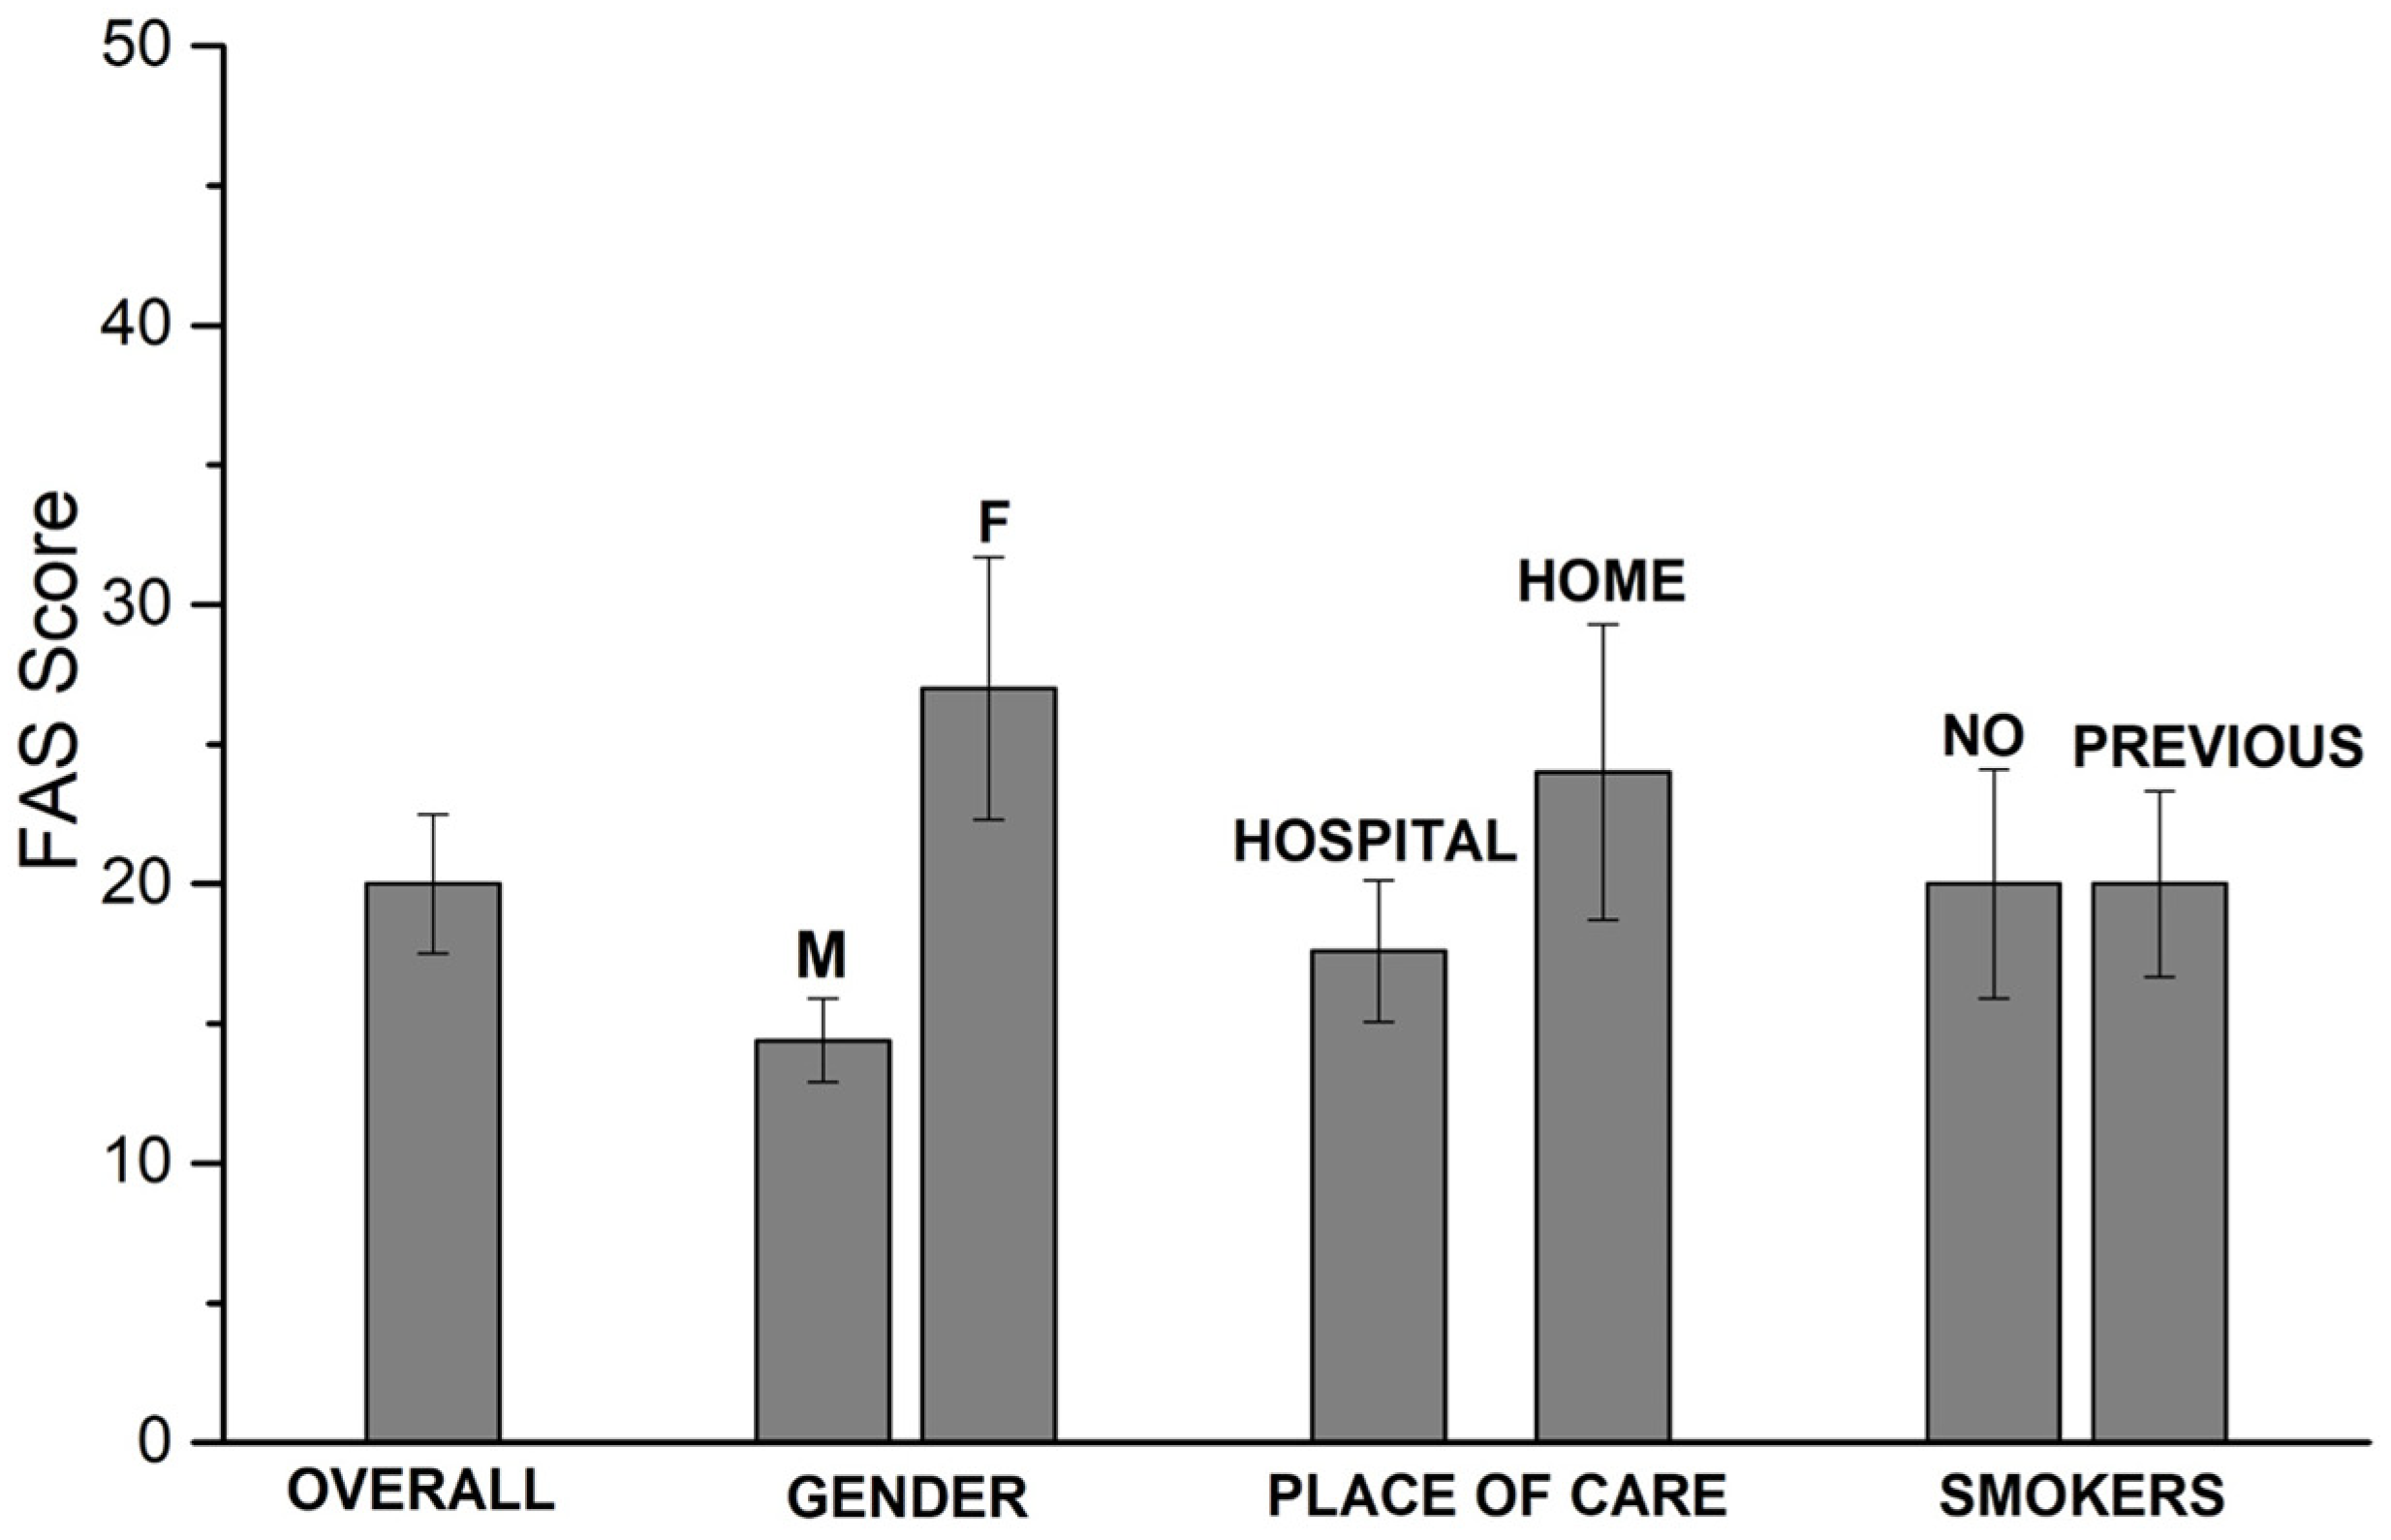
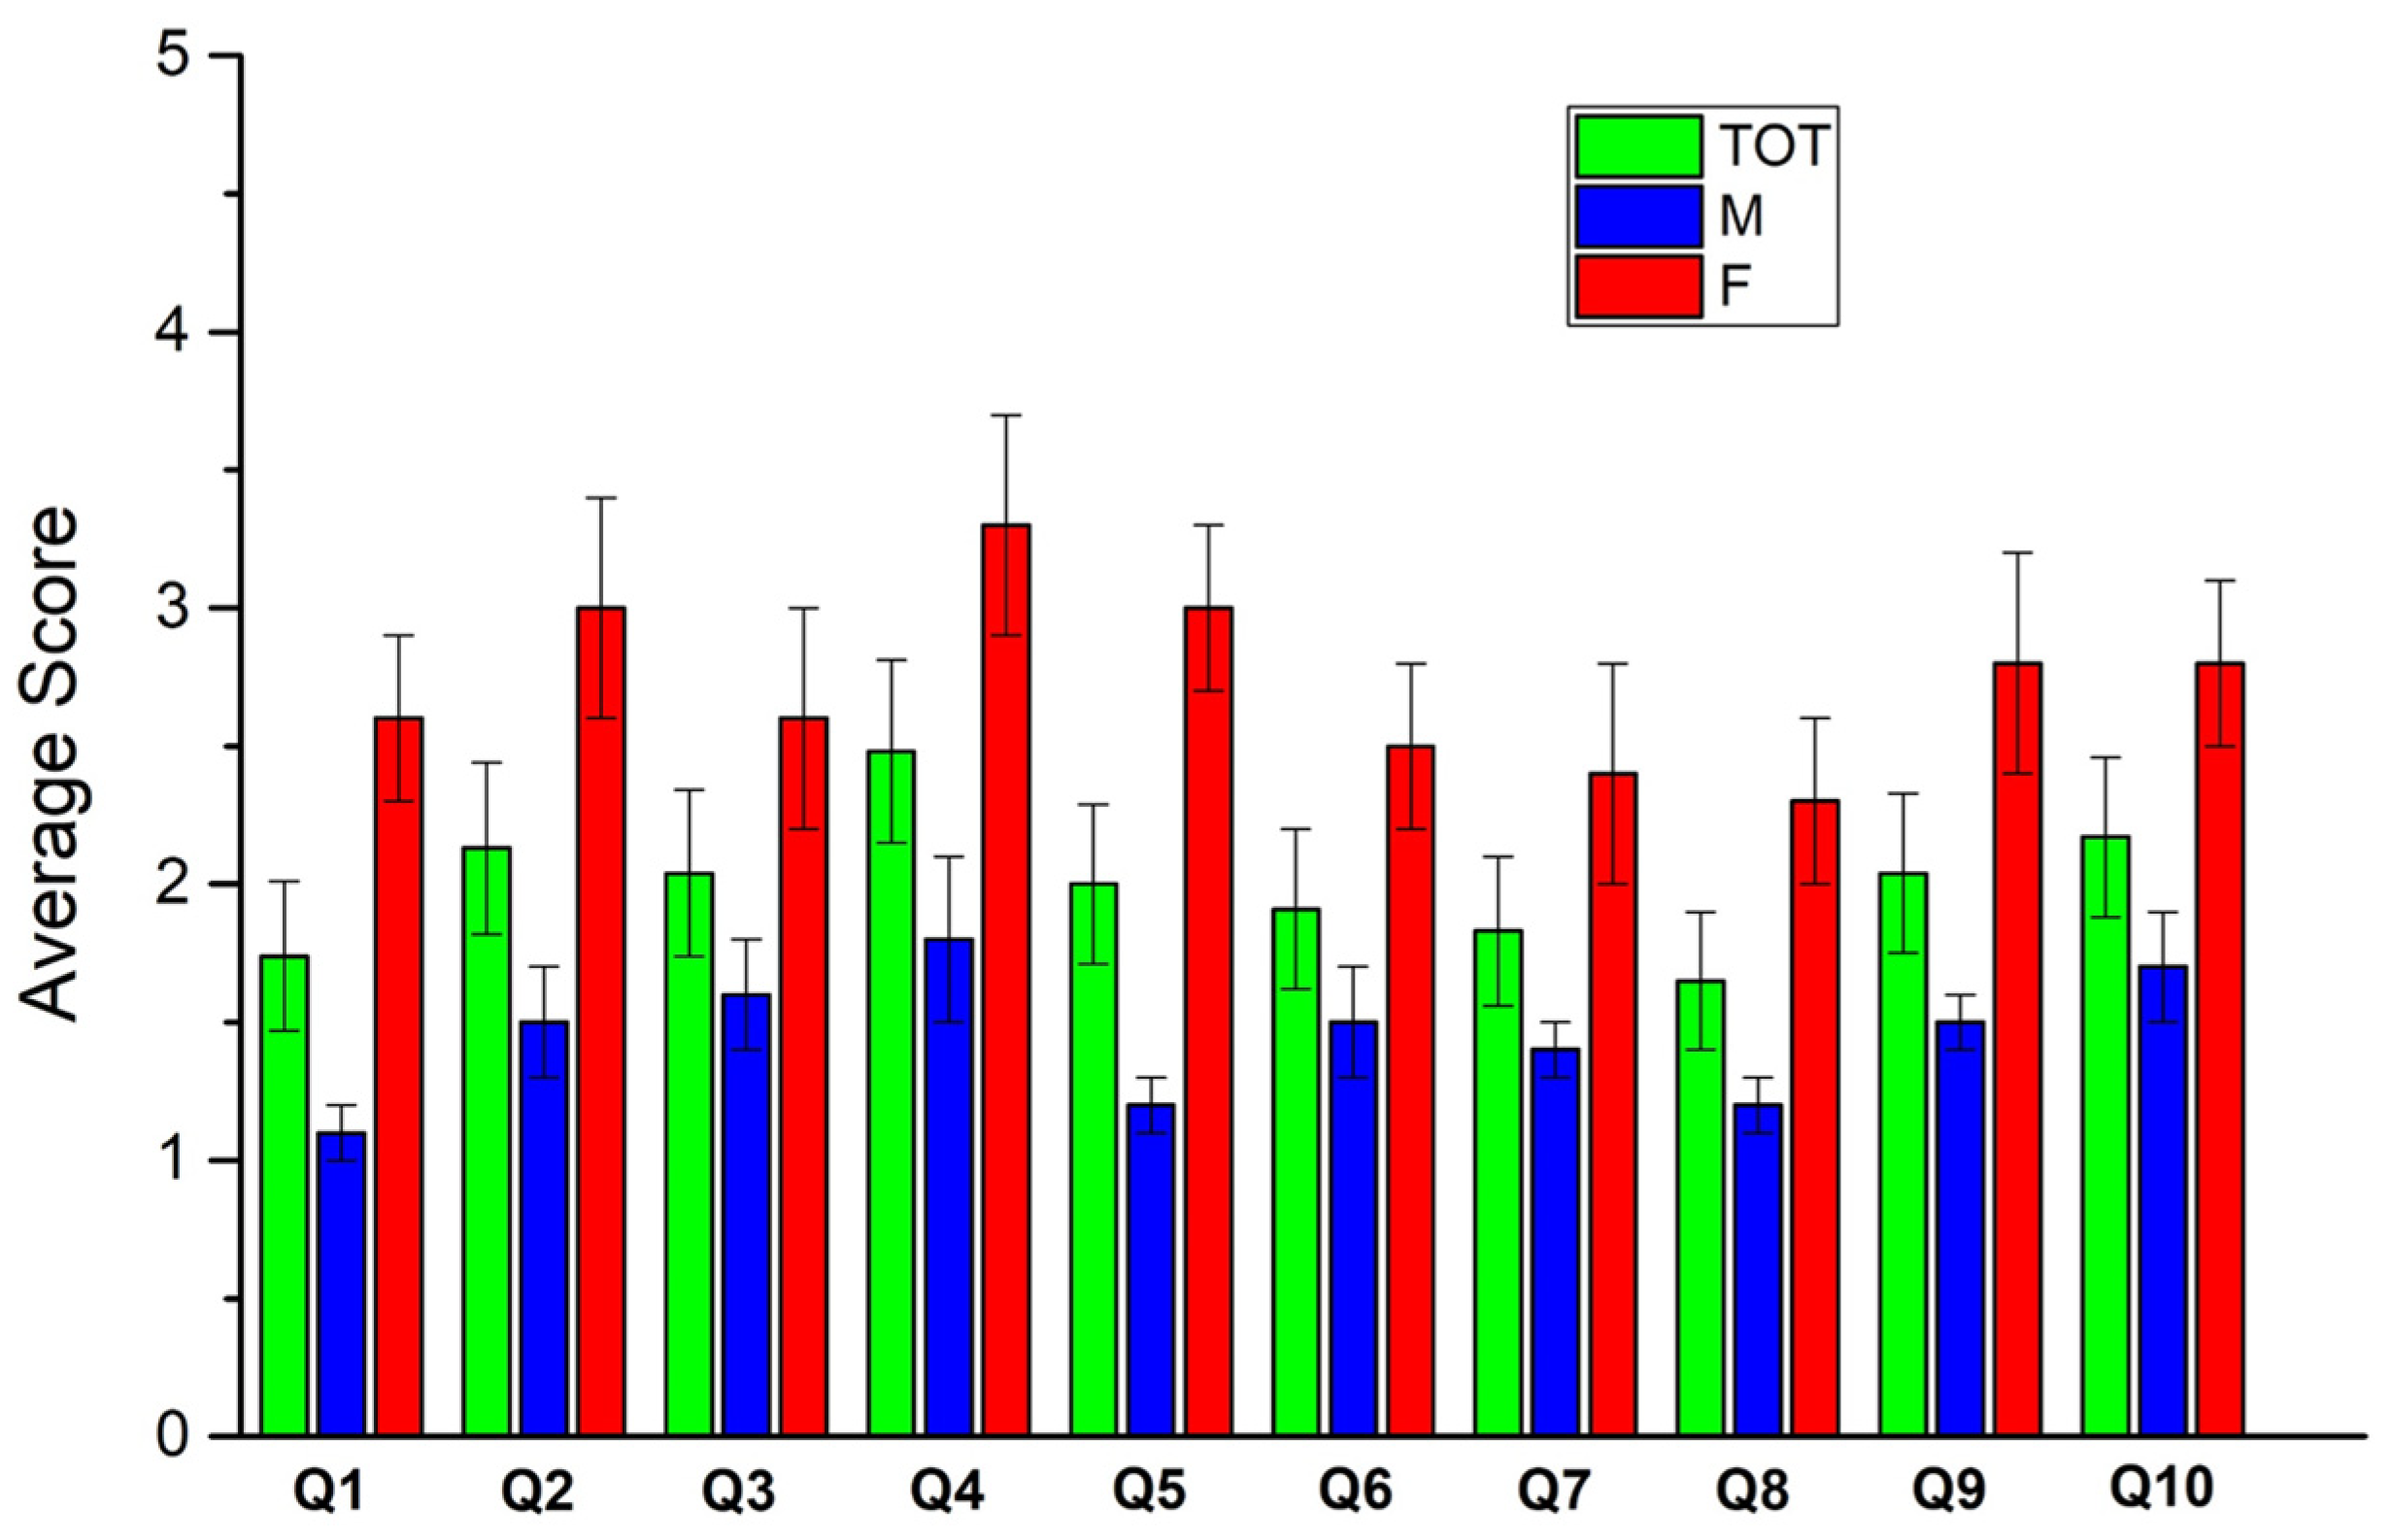
3.2. 2nd Questionnaire
3.3. Comparison of the Two Questionnaires
- total FAS score (p < 0.001), as well as mental (p = 0.004) and physical (p < 0.001) subsets;
- items 1 (p < 0.001), 2 (p < 0.001), 3 (p = 0.007), 4 (p = 0.014), 5 (p = 0.009), 8 (p = 0.007), 9 (p = 0.004)
- total FAS score (p < 0.001), as well as mental (p = 0.009) and physical (p < 0.001) subsets;
- items 1 (p < 0.001), 2 (p = 0.001), 3 (p = 0.012), 4 (p = 0.021), 5 (p = 0.018), 8 (p = 0.007), 9 (p = 0.017)
3.4. Additional Outcomes
4. Discussion
- the impaired mitochondrial function of neurons resulting from SARS-CoV-2 infection that compromise neurons with high metabolism energetic: a condition affecting cognitive process and inducing “brain fog”, anergy and behavioral changes [17], and
- the proinflammatory cytokines, including interferon-gamma and interleukin-7, accumulated in the Central Nervous System, cross the blood-brain barrier in the circumventricular organs such as hypothalamus, leading to autonomic dysfunction with high fever as an acute symptom or long-lasting symptoms like alteration of the sleep-wake cycle, a cognitive dysfunction and a profound prolonged anergy [18].
5. Conclusions
Supplementary Materials
Author Contributions
Funding
Institutional Review Board Statement
Informed Consent Statement
Data Availability Statement
Acknowledgments
Conflicts of Interest
References
- Stavem, K.; Ghanima, W.; Olsen, M.K.; Gilboe, H.M.; Einvik, G. Prevalence and Determinants of Fatigue after COVID-19 in Non-Hospitalized Subjects: A Population-Based Study. Int. J. Environ. Res. Public Health 2021, 18, 2030. [Google Scholar] [CrossRef] [PubMed]
- Ladds, E.; Rushforth, A.; Wieringa, S.; Taylor, S.; Rayner, C.; Husain, L.; Greenhalgh, T. Persistent symptoms after COVID-19: Qualitative study of 114 “long COVID” patients and draft quality principles for services. BMC Health Serv. Res. 2020, 20, 1144. [Google Scholar] [CrossRef] [PubMed]
- Townsend, L.; Dyer, A.H.; Jones, K.; Dunne, J.; Mooney, A.; Gaffney, F.; O’Connor, L.; Leavy, D.; O’Brien, K.; Dowds, J.; et al. Persistent fatigue following SARS-CoV-2 infection is common and independent of severity of initial infection. PLoS ONE 2020, 15, e0240784. [Google Scholar] [CrossRef] [PubMed]
- Persson, P.; Persson, A.B. Fatigue. Acta Physiol. 2016, 218, 3–4. [Google Scholar] [CrossRef] [Green Version]
- Klok, F.A.; Boon, G.J.; Barco, S.; Endres, M.; Geelhoed, J.M.; Knauss, S.; Rezek, S.A.; Spruit, M.A.; Vehreschild, J.; Siegerink, B. The Post-COVID-19 Functional Status scale: A tool to measure functional status over time after COVID-19. Eur. Respir. J. 2020, 56, 2001494. [Google Scholar] [CrossRef] [PubMed]
- Rudroff, T.; Fietsam, A.C.; Deters, J.R.; Bryant, A.D.; Kamholz, J. Post-COVID-19 Fatigue: Potential Contributing Factors. Brain Sci. 2020, 10, 1012. [Google Scholar] [CrossRef]
- Michielsen, H.J.; De Vries, J.; Van Heck, G.L. Psychometric qualities of a brief self-rated fatigue measure: The Fatigue Assessment Scale. J. Psychosom. Res. 2003, 54, 345–352. [Google Scholar] [CrossRef]
- De Kleijn, W.P.; De Vries, J.; Wijnen, P.A.; Drent, M. Minimal (clinically) important differences for the Fatigue Assessment Scale in sarcoidosis. Respir. Med. 2011, 105, 1388–1395. [Google Scholar] [CrossRef] [PubMed] [Green Version]
- SIAARTI Guidelines—Care Path for Patients with COVID-19 Disease. Available online: www.siaarti.it (accessed on 26 October 2021).
- Hendriks, C.; Drent, M.; Elfferich, M.; de Vries, J. The Fatigue Assessment Scale: Quality and availability in sarcoidosis and other diseases. Curr. Opin. Pulmon. Med. 2018, 24, 495–503. [Google Scholar] [CrossRef] [PubMed]
- Mann, H.B.; Whitney, D.R. On a test of whether one of two random variables is stochastically larger than the other. Ann. Math. Stat. 1947, 18, 50–60. [Google Scholar] [CrossRef]
- Wessa, P. Cronbach alpha (v1.0.6) in Free Statistics Software (v1.2.1). Office for Research Development and Education. 2021. Available online: https://www.wessa.net/rwasp_cronbach.wasp/ (accessed on 7 October 2021).
- Available online: www.socscistatistics.com/tests/mannwhitney (accessed on 7 October 2021).
- Faul, F.; Erdfelder, E.; Lang, A.G.; Buchner, A. G*Power 3: A flexible statistical power analysis program for the social, behavioral, and biomedical sciences. Behav. Res. Methods 2007, 39, 175–191. [Google Scholar] [CrossRef] [PubMed]
- Available online: www.statskingdom.com/320ShapiroWilk.html (accessed on 7 October 2021).
- Nikhra, V. Living with ‘Long COVID-19’: The long-term complications and sequelae. Int. J. Clin. Virol. 2021, 5, 011–021. [Google Scholar] [CrossRef]
- Stefano, G.B.; Ptacek, R.; Ptackova, H.; Martin, A.; Kream, R.M. Selective Neuronal Mitochondrial Targeting in SARS-CoV-2 Infection Affects Cognitive Processes to Induce ‘Brain Fog’ and Results in Behavioral Changes that Favor Viral Survival. Med. Sci. Monit. 2021, 27, e930886. [Google Scholar] [CrossRef] [PubMed]
- Perrin, R.; Riste, L.; Hann, M.; Walther, A.; Mukherjee, A.; Heald, A. Into the looking glass: Post-viral syndrome post COVID-19. Med. Hypotheses. 2020, 144, 110055. [Google Scholar] [CrossRef] [PubMed]
- Brodin, P. Immune determinants of COVID-19 disease presentation and severity. Nat. Med. 2021, 27, 28–33. [Google Scholar] [CrossRef]
- Ortona, E.; The Long COVID Kids study group; Buonsenso, D.; Carfi, A.; Malorni, W. Long COVID: An estrogen-associated autoimmune disease? Cell Death Discov. 2021, 7, 77. [Google Scholar] [CrossRef] [PubMed]
- Morgul, E.; Bener, A.; Atak, M.; Akyel, S.; Aktaş, S.; Bhugra, D.; Ventriglio, A.; Jordan, T.R. COVID-19 pandemic and psychological fatigue in Turkey. Int. J. Soc. Psychiatry 2020, 67, 128–135. [Google Scholar] [CrossRef] [PubMed]
- Vaes, A.W.; Machado, F.V.; Meys, R.; Delbressine, J.M.; Goertz, Y.M.; Van Herck, M.; Houben-Wilke, S.; Franssen, F.M.; Vijlbrief, H.; Spies, Y.; et al. Care Dependency in Non-Hospitalized Patients with COVID-19. J. Clin. Med. 2020, 9, 2946. [Google Scholar] [CrossRef]
- Vitacca, M.; Carone, M.; Clini, E.M.; Paneroni, M.; Lazzeri, M.; Lanza, A.; Privitera, E.; Pasqua, F.; Gigliotti, F.; Castellana, G.; et al. Joint Statement on the Role of Respiratory Rehabilitation in the COVID-19 Crisis: The Italian Position Paper. Respiration 2020, 99, 493–499. [Google Scholar] [CrossRef] [PubMed]

| Characteristic | Total (%) | Male (%) | Female (%) |
|---|---|---|---|
| Patients | 23 (100) | 13 (56.5) | 10 (43.5) |
| Place of care | |||
| Hospital | 14 (60.9) | 10 | 4 |
| Home | 9 (39.1) | 3 | 6 |
| Age (years) | M (59) SD (10) | M (61) SD (10) | M (57) SD (9) |
| range | 37–76 | 46–76 | 37–67 |
| Body-mass index | M (28.0) SD (4.9) | M (26.8) SD (3.6) | M (29.5) SD (6.0) |
| No Comorbidities | 9 (39.1) | 4 | 5 |
| Single Comorbidity | 9 (39.1) | 5 | 4 |
| Several Comorbidities | 5 (21.8) | 4 | 1 |
| Comorbidities | |||
| Arterial hypertension | 5 (21.8) | 2 | 3 |
| Atrial fibrillation | 1 (4.3) | 1 | -- |
| Ischemic cardiopathy | 4 (17.4) | 3 | 1 |
| Bronchial Asthma | 2 (8.7) | 2 | -- |
| Dislypidemy | 2 (8.7) | 1 | 1 |
| Hipothyroidism | 1 (4.3) | -- | 1 |
| OSAS * | 3 (13.0) | 2 | 1 |
| Diabetes mellitus | 1 (4.3) | 1 | -- |
| COPD ** | 1 (4.3) | 1 | -- |
| Smoking habit | |||
| Previous Smokers | 13 (56.5) | 7 | 6 |
| No Smokers | 10 (43.5) | 6 | 4 |
| N | Item |
|---|---|
| 1 | I am bothered by fatigue |
| 2 | I get tired very quickly |
| 3 | I don’t do much during the day |
| 4 | I have enough energy for everyday life |
| 5 | Physicall, I feel exhausted |
| 6 | I have problems starting things |
| 7 | I have problems thinking clearly |
| 8 | I feel no desire to do anything |
| 9 | Mentally, I feel exhausted |
| 10 | When I am doing something, I can concentrate very quickly |
| Answer | Score for Items 1, 2, 3, 5, 6, 7, 8, 9 | Score for Items 4, 10 |
|---|---|---|
| Never | 1 | 5 |
| Sometimes | 2 | 4 |
| Regularly | 3 | 3 |
| Often | 4 | 2 |
| Always | 5 | 1 |
| M | F | Total | |
|---|---|---|---|
| increased | 0 | 4 | 4 |
| reduced | 13 | 6 | 19 |
Publisher’s Note: MDPI stays neutral with regard to jurisdictional claims in published maps and institutional affiliations. |
© 2021 by the authors. Licensee MDPI, Basel, Switzerland. This article is an open access article distributed under the terms and conditions of the Creative Commons Attribution (CC BY) license (https://creativecommons.org/licenses/by/4.0/).
Share and Cite
Serafini, A.; Tagliaferro, A.; Balbi, F.; Bordo, A.; Bernardi, S.; Berta, G.; Trucco, L.; Perretta, E.; Gualco, E.; Zoccali, P.; et al. Screening of a Small Number of Italian COVID-19 Syndrome Survivors by Means of the Fatigue Assessment Scale: Long COVID Prevalence and the Role of Gender. COVID 2021, 1, 518-527. https://doi.org/10.3390/covid1030044
Serafini A, Tagliaferro A, Balbi F, Bordo A, Bernardi S, Berta G, Trucco L, Perretta E, Gualco E, Zoccali P, et al. Screening of a Small Number of Italian COVID-19 Syndrome Survivors by Means of the Fatigue Assessment Scale: Long COVID Prevalence and the Role of Gender. COVID. 2021; 1(3):518-527. https://doi.org/10.3390/covid1030044
Chicago/Turabian StyleSerafini, Antonella, Alberto Tagliaferro, Francesco Balbi, Alberto Bordo, Stefano Bernardi, Giorgio Berta, Lorenzo Trucco, Enrico Perretta, Elisa Gualco, Patrizia Zoccali, and et al. 2021. "Screening of a Small Number of Italian COVID-19 Syndrome Survivors by Means of the Fatigue Assessment Scale: Long COVID Prevalence and the Role of Gender" COVID 1, no. 3: 518-527. https://doi.org/10.3390/covid1030044
APA StyleSerafini, A., Tagliaferro, A., Balbi, F., Bordo, A., Bernardi, S., Berta, G., Trucco, L., Perretta, E., Gualco, E., Zoccali, P., & De Michelis, C. (2021). Screening of a Small Number of Italian COVID-19 Syndrome Survivors by Means of the Fatigue Assessment Scale: Long COVID Prevalence and the Role of Gender. COVID, 1(3), 518-527. https://doi.org/10.3390/covid1030044