Article

Investigation of Corrosion and Fouling in a Novel Biocide-Free Antifouling Coating on Steel

by
Polyxeni Vourna
1,*,
Pinelopi P. Falara
2 and
Nikolaos D. Papadopoulos
3
1
Institute of Nanoscience and Nanotechnology, National Centre for Scientific Research “Demokritos”, 15341 Athens, Greece
2
School of Chemical Engineering, National Technical University of Athens, 9 Iroon Polytechniou Str., Zografou, 15772 Athens, Greece
3
Department of Research and Development, BFP Advanced Technologies G.P., 11633 Athens, Greece
*
Author to whom correspondence should be addressed.
Micro 2025, 5(3), 34; https://doi.org/10.3390/micro5030034
Submission received: 25 April 2025 / Revised: 7 July 2025 / Accepted: 11 July 2025 / Published: 15 July 2025

Abstract

Antifouling coatings are integral to the maritime economy. The efficacy of the applied painting system is closely correlated with susceptibility to fouling and the adhesion strength of contaminants. A fouled hull might result in an elevated fuel consumption and journey expenses. Biofouling on ship hulls also has detrimental environmental consequences due to the release of biocides during maritime travel. Therefore, it is imperative to develop eco-friendly antifouling paints that inhibit the robust adhesion of marine organisms. This study aimed to assess a biocide-free antifouling coating formulated with polymers intended to diminish molecular adhesion interactions between marine species’ adhesives and the coating. The evaluation included laboratory corrosion experiments in artificial seawater and the immersion of samples in a marine environment in Attica, Greece, for varying durations. The research indicates that an antifouling coating applied to naval steel in an artificial seawater solution improves corrosion resistance by more than 60%. The conductive polymer covering, comprising polyaniline and graphene oxide, diminishes corrosion current values, lowers the corrosion rate, and enhances corrosion potentials. The impedance parameters exhibit analogous behavior, with the coating preventing water absorption and displaying corrosion resistance. The coating serves as a low-permeability barrier, exhibiting exceptional durability for naval steel over time, with an operational performance up to 98%.

1. Introduction

The protection of naval steels in the marine environment presents a considerable problem in the advancement of fouling control coatings [1]. Naval steels are employed in many military and commercial vessels, particularly in patrol ships [2]. The application of conventional copper-based antifouling coatings on metal hulls is prevalent; however, their use on steel surfaces has been restricted due to apprehensions about galvanic corrosion [3]. Naval steel is susceptible to increased galvanic corrosion when in direct contact with an electrolyte, such as seawater, due to its inferior position in the galvanic series compared to copper, especially in the presence of dissimilar metals [4].
The use of copper-free antifouling (AF) coatings has led to a reduced efficacy and durability, requiring more frequent dockings and reapplications for steel vessels, along with regular in-water cleaning [5,6,7]. The described situation presents challenges for vessels at sea or those required to remain docked for prolonged durations [8]. The implementation of biocide-free systems, including fouling-release coatings made from silicone, fluoropolymers, and hydrogels, aims to enhance the operational efficiency of dynamic vessels necessitating frequent movement. Nonetheless, these devices are susceptible to considerable fouling when utilized in static conditions or tropical climates [9].
The accumulation of marine biofouling on structures and equipment in marine environments can lead to considerable consequences, particularly for the shipping sector. These consequences encompass increased fuel consumption [10], reduced speed and range capabilities [11], and the possible spread of marine pests [12]. Subsequent to the extensive ban on tributyltin (TBT) as a biocide in marine environments [13,14], copper oxide (Cu2O) has become the primary antifouling biocide utilized in marine coatings [15,16]. Copper oxide antifouling paints have proven effective in preventing fouling on a substantial segment of the global steel hull fleet, provided they are applied at an optimal thickness and receive regular maintenance and replenishment [17]. Therefore, it is reasonable to propose that copper-based antifouling systems, often utilized on steel hulls, may provide enhanced protection against fouling in comparison to the currently approved alternatives. Recent research [18] and certain coating manufacturers suggest that modern copper-based antifouling coatings do not contain metallic copper. They comprise cuprous and cupric oxide. Consequently, it is asserted that these coatings can be applied over an epoxy barrier layer on naval steels without detrimental effects. It is essential that materials used for marine applications comply with stricter standards to protect the environment, aquatic organisms, and human health [19,20,21]. Consequently, there exists a substantial demand for nonbiocidal antifouling coatings.
This study evaluated an experimental antifouling paint system for its antifouling and anticorrosion efficacy. The analyzed paint was a non-biocidal, fouling-resistant amphiphilic nanostructured coating, formulated from polymers intended to reduce molecular adhesive forces between marine species’ adhesives and the coating. The ultimate objective is to develop surfaces exhibiting compositional (chemical) heterogeneity at the nanoscale via the thermodynamically induced phase segregation of polymer assemblies, subsequently followed by in situ cross-linking.
The innovation of the experimental formulations stems from their focus on biofouling at its fundamental stage, particularly before the onset of the primary biofilm’s formation. The early stages of colonization can be significantly obstructed due to the increased in-plane conductivity caused by the altered graphene oxide (GO) sheets [22]. The incorporation of photocatalytically active titania (TiO2) nanoparticles can augment the coating’s ability to resist fouling on the surface plane [23,24,25]. The presence of electrical anisotropy concurrently enables charge dissipation, hence limiting electrostatic attractions and hindering the early adsorption of bacteria and germs due to their negatively charged outer surface. The inquiry conducted in this study was to provide a detailed anticorrosion and antifouling analysis for a full evaluation of the efficacy of a novel biocide-free antifouling coating.

2. Materials and Methods

2.1. Materials

Ferric chloride (FeCl3), sodium hydroxide (NaOH), ferrous sulfate heptahydrate (FeSO4 · 7H2O), aniline monomer (MW = 93.13 g·mol−1), ammonium persulfate (APS, Mw = 228.2 g·mol−1), N-phenyl-1,4-phenylenediamine (C6H5NHC6H4NH2, Mw = 184.26 g·mol−1), dichloromethane (CH2Cl2, Mw = 84.93 g·mol−1), succinic anhydride ((CH2CO)2O, Mw = 100.07 g·mol−1), ethanol (C2H5OH), acetone (CH3COCH3, ≥99.5%), methanol (CH3OH, ≥99.9%), 37% and 10% Hydrochloric acid (HCl), diethyl ether ((CH3CH2)2O, ≥90.0%), oleic acid (CH3(CH2)7CH=CH(CH2)7COOH, ≥99.0%) 98% sulfuric acid (H2SO4), graphite flakes (CAS Number: 7782-42-5), sodioum nitrad (NaNO3, ≥99.0%), Potassium permanganate (KMnO4, ≥99.0%), Hydrogen peroxide solution (H2O2, 30% (w/w) in H2O), and titanium(IV) isopropoxide (Ti[OCH(CH3)2]4, ≥99.999%) were purchased from Sigma-Aldrich Co., Marousi, Greece. All the chemicals were of analytical purity and used without further purification unless noted.

2.2. Coating Preparation

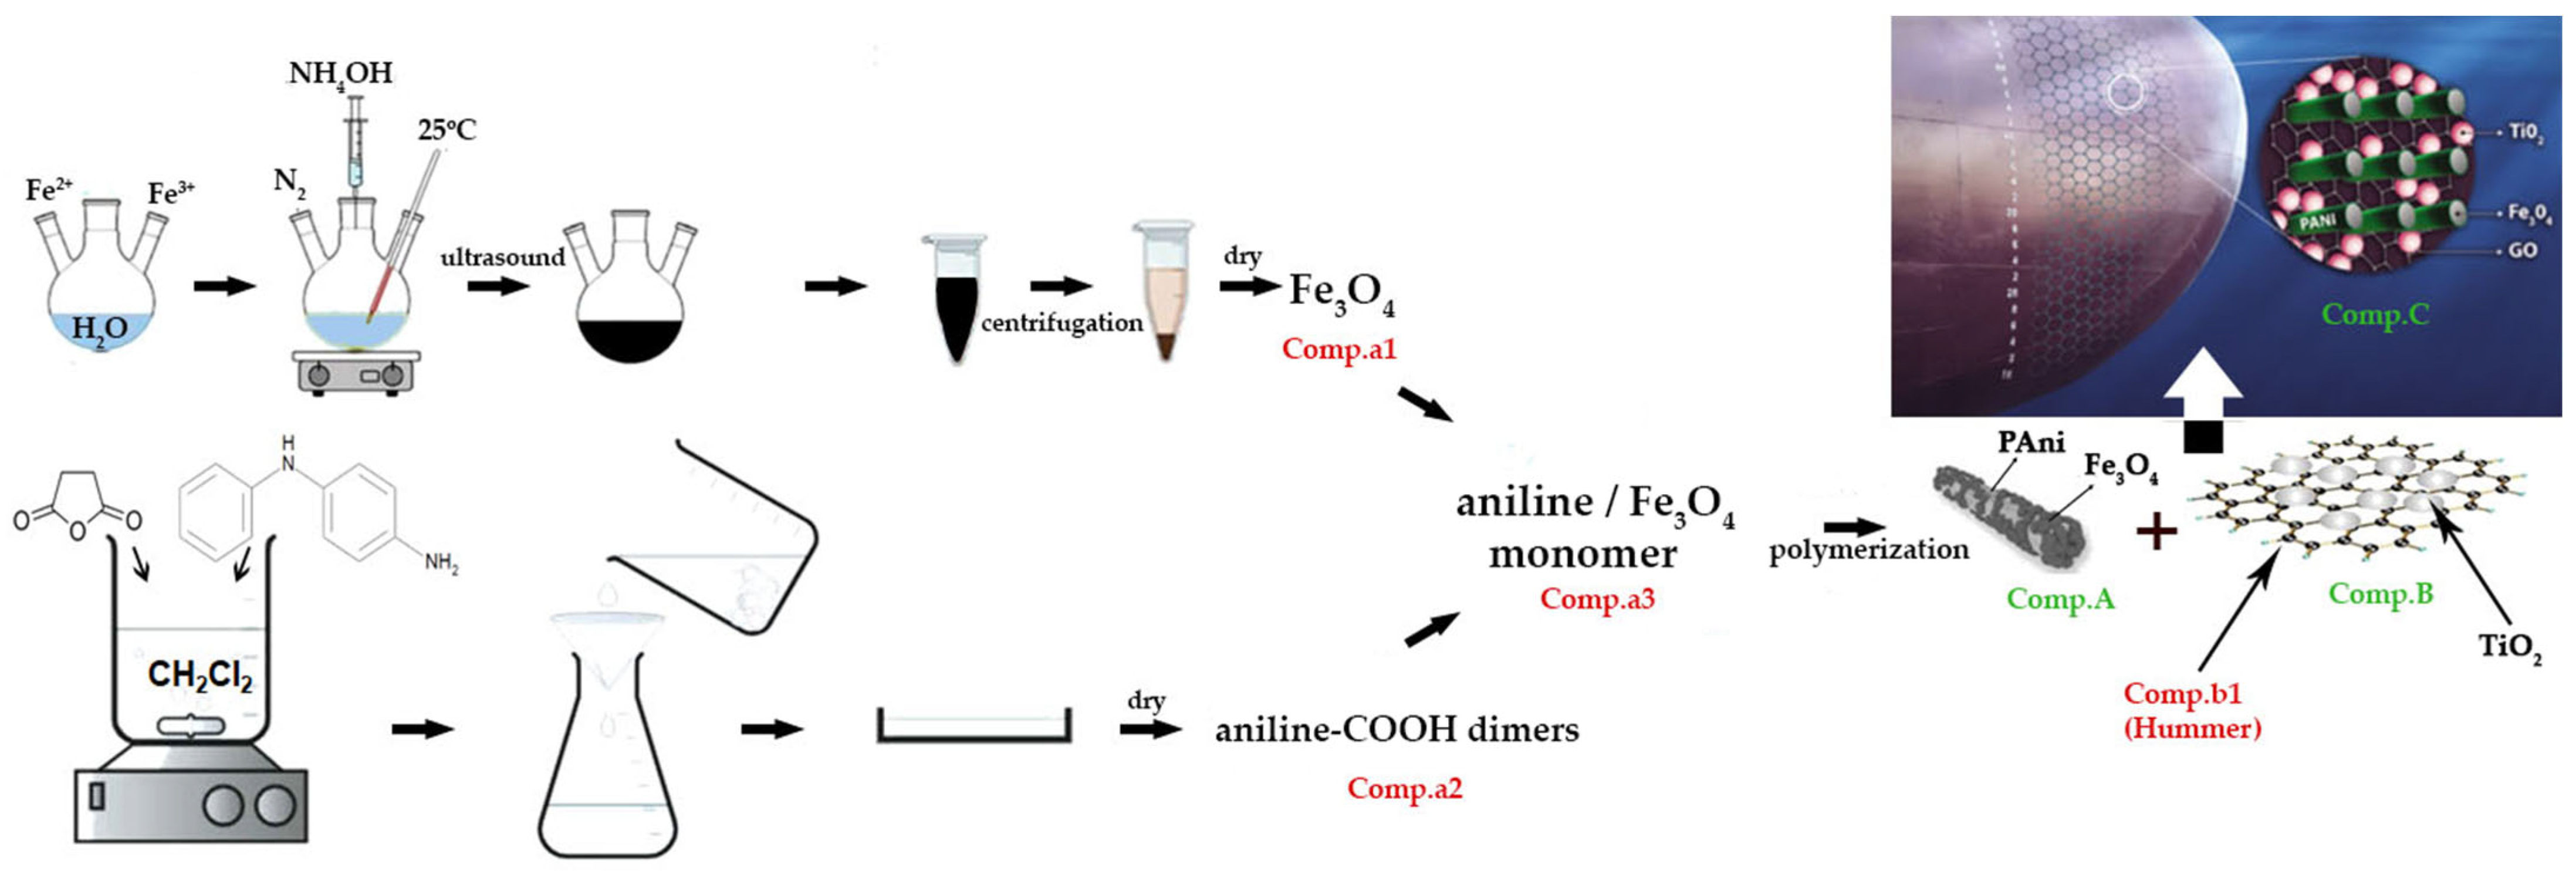
2.2.1. Synthesis Procedure of the Antifouling Coating

This study established the components of a coating system utilizing a novel suspension for the preparation of metallic surfaces. The development of the nanocomposite components and subsequently the film coating was executed. A composite nanostructure was specifically designed, comprising (a) a water-soluble resin, (b) modified conductive polyaniline nanorods (PAni) integrated with magnetite nanoparticles (Fe3O4), and (c) connected graphene oxide (GO) flakes with photocatalytic titania (TiO2).
Τhe synthesis process of the proposed final antifouling coating, illustrated in Figure 1, comprised three phases: Comp.A, Comp.B, and Comp.C. The initial phase of the synthesis aimed to modify polyaniline (PAni) utilizing magnetite (Fe3O4) nanoparticles (NPs) and comprised a four-step process. The synthesis of Fe3O4 NPs through co-precipitation from divalent and trivalent iron salts was performed, utilizing ultrasound in the presence of ammonia (Comp.a1 in Figure 1). The functionalization of carboxylic acid dimer aniline (Comp.a2 in Figure 1) and its subsequent mixing in an acidic environment at ambient temperatures with the magnetite nanoparticles supplied in Comp.a1 was monitored. Subsequent to the mixing process, aniline cores externally decorated with magnetite were generated (Comp.a3). The initial phase involved the polymerization of the synthesized oligomers to produce polyaniline nanorods (PAni), which were externally decorated with magnetite nanoparticles (Comp.A). The second stage entailed the modification of graphene oxide (GO) sheets with titanium oxide (TiO2) nanoparticles adhering to the anatase crystal structure (Comp.B). Consequently, graphene oxide (GO) sheets synthesized via the modified Hummers method (Comp.b1) were combined in an acidic medium with titanium isopropoxide (Comp.b2). The final formulation of the suggested antifouling coating included a 1:2 ratio mixture of Comp.A and Comp.B in a water-soluble resin, along with the incorporation of additives (Comp.C).

2.2.2. Description of Synthesis Steps

Synthesis of Magnetite (Fe3O4) Nanoparticles (Comp.a1)
In this study magnetic magnetite nanoparticles were synthesized by the co-precipitation of inorganic iron salts in the presence of an oleic acid (OA) surfactant.
An amount of 100 mL of deoxygenated water was heated to 70 °C for 30 min and subsequently cooled fast to room temperature using an ice bath. Then, 25 mL of the resultant solvent was combined with 0.85 mL of 37% fumed HCl, followed by the sequential dissolving of 5.2 g of FeCl3 and 2.78 g of FeSO4, with continuous stirring of the solution. Separately, 375 mmol of NaOH was dissolved in 250 mL of purified, deoxygenated water, and the solution was permitted to cool to 55 °C. Subsequently, 50 mL of acetone was added as a mediator for organic-to-aqueous phase transfer, along with 3.00 mL OA. The emergence of white foam was noted, facilitating the formation of sodium oleate. Mixing of the two solutions was carried out in five repetitive steps, each involving the addition of 5 mL of the first solution and 2 mL of OA in droplets to the second solution, culminating in the co-precipitation of Fe2+ and Fe3+ ions. Magnetic nanoparticles were promptly generated as a black precipitate, which was retrieved using magnetic separation. An additional quantity of deoxygenated water was added, and the solution was de-centrifuged following centrifugation at 6000 rpm, a process repeated thrice. The sludge was subjected to ultrasonic irradiation at 300 kHz using a Q500 sonicator (Qsonica, Newtown, CT, USA) and 55 °C for 60 min. Ultrasound radiation enhances the production rate of Fe3O4 nanoparticles by facilitating the rapid development of magnetite crystal nuclei. In the next stage, 500 mL of HCl solution was introduced to the precipitate to neutralize the surface anionic charge of the magnetite nanoparticles. The cationic colloidal nanoparticles were subsequently isolated using centrifugation and ultimately gathered in an Abderhalden apparatus, where drying occurred at 85 °C and 30 mm Hg for 3 h utilizing barium oxide.
Synthesis of Aniline–Carboxylic Acid Dimer (C6H5NH2-COOH Dimer) (Comp.a2)
An amount of 50mL of dichloromethane (CH2Cl2) was added to a three-necked round-bottom flask. Subsequently, 0.9 g of N-phenyl-1,4-phenylenediamine (C6H5NHC6H4NH2) and 0.5 g of succinic anhydride ((CH2CO)2O) was added to the flask at room temperature while ensuring continuous agitation. Stirring persisted until a pale gray precipitate was generated (about 5 h). Subsequent to the filtration of the solution, the precipitate was washed with diethyl ether until the filtrate became colorless. The product was subjected to vacuum drying for 12 h at room temperature.
Synthesis of Aniline–Magnetite Monomer (Comp.a3)
An amount of 200 mg of Comp.a2 was dissolved in 22 mL of acetone and water and mixed with 2.86 mg of Comp.a1 under continuous vigorous stirring at 80 °C for roughly 1 h. The stable suspension was progressively cooled to room temperature and then sequentially cleaned with acetone and ethanol.
Synthesis of Polyaniline (PAni) Nanorods Integrated with Magnetite (Fe3O4) Nanoparticles (Comp.A)
An amount of 40 mL of 0.1 M HCl solution and 500 mg of Comp.a3, together with 500 mg of aniline, was added to a beaker while being continuously stirred at 0 °C. Then, 122 g of ammonium persulfate (APS) was introduced into 40 mL of 0.1 M HCl, and the resultant solution was added dropwise to the system for a duration of 10 min. The mixture was stirred for 4 h, and the resulting precipitate was filtered and washed in succession three times with distilled water and methanol. The products were subjected to vacuum drying at 50 °C for 24 h.
Synthesis of Graphene Oxide (GO) Sheets (Comp.b1)
An amount of 50 mL of 98% H2SO4 was mixed with graphite flakes and NaNO3 in a 1:1 weight ratio. The mixture was maintained in an ice bath at 0–2 °C with continuous stirring for 30 min. Then, 6 g of KMnO4 was added precisely and gradually to maintain the reaction temperature below 15 °C. The ice bath was removed, and the mixture was stirred at 40 °C. The mixture was stirred for 48 h to provide a viscous brown paste, which was then diluted by the progressive dropwise addition of 100 mL of water. When the reaction was raised to 100 °C, 210 mL of water was added to the solution under continuous stirring. Then, 12 mL of H2O2 was included to produce a yellow solution. The mixture was purified using washing and centrifugation with 10% HCl and deionized water, respectively, for ten consecutive cycles.
Modified Graphene Oxide (GO) Sheets with Titania (TiO2) (Comp.B)
An amount of 9 mg of Comp.b1 was added to 60 mL of ethanol via ultrasonication for 60 min, and then 1.5 mL of Ti[OCH(CH3)2]4 was included under stirring at ambient temperature for 30 min. A solution of distilled water and 1 M HCl with a 30:1 volume ratio was added. The solution was agitated in a nitrogen atmosphere for 24 h at ambient temperature. The product underwent centrifugation and was cleaned with distilled water. The nanocomposite was subsequently dried at 80 °C in a convection oven.
Synthesis of Antifouling Coating (AF Coating)
The final formulation of the suggested antifouling coating included a 1:2 ratio mixture of Comp.A and Comp.B in a water-soluble resin (nonionic poly ethylene oxide, PEO), along with the incorporation of additives.

2.2.3. Characterization of Nanocomposites

The microstructural analysis of the developing nanocomposites (Comp.A, Comp.B, Comp.C) of the antifouling coating involved the utilization of various observational methods, analytical techniques, and tests, focused on metallographic characterization and assessment of the chemical composition of the nanostructures. The employed techniques and methodologies included metallographic characterization via scanning electron microscopy (SEM, JEOL 6380 LV microscope, Tokyo, Japan) and transmission electron microscopy (TEM, JEOL 2100 HR microscope, Tokyo, Japan).
For the SEM analysis, the nanocomposites were deposited as thin films on graphite adhesive tape. A dispersion of the generated fine particles in dimethylformamide (DMF) was prepared utilizing the ultrasonic method for the TEM investigation. A droplet of the dispersion solution was deposited onto a copper grid (200 mesh). The micrographs were captured at an accelerating electron voltage of 200 kV.

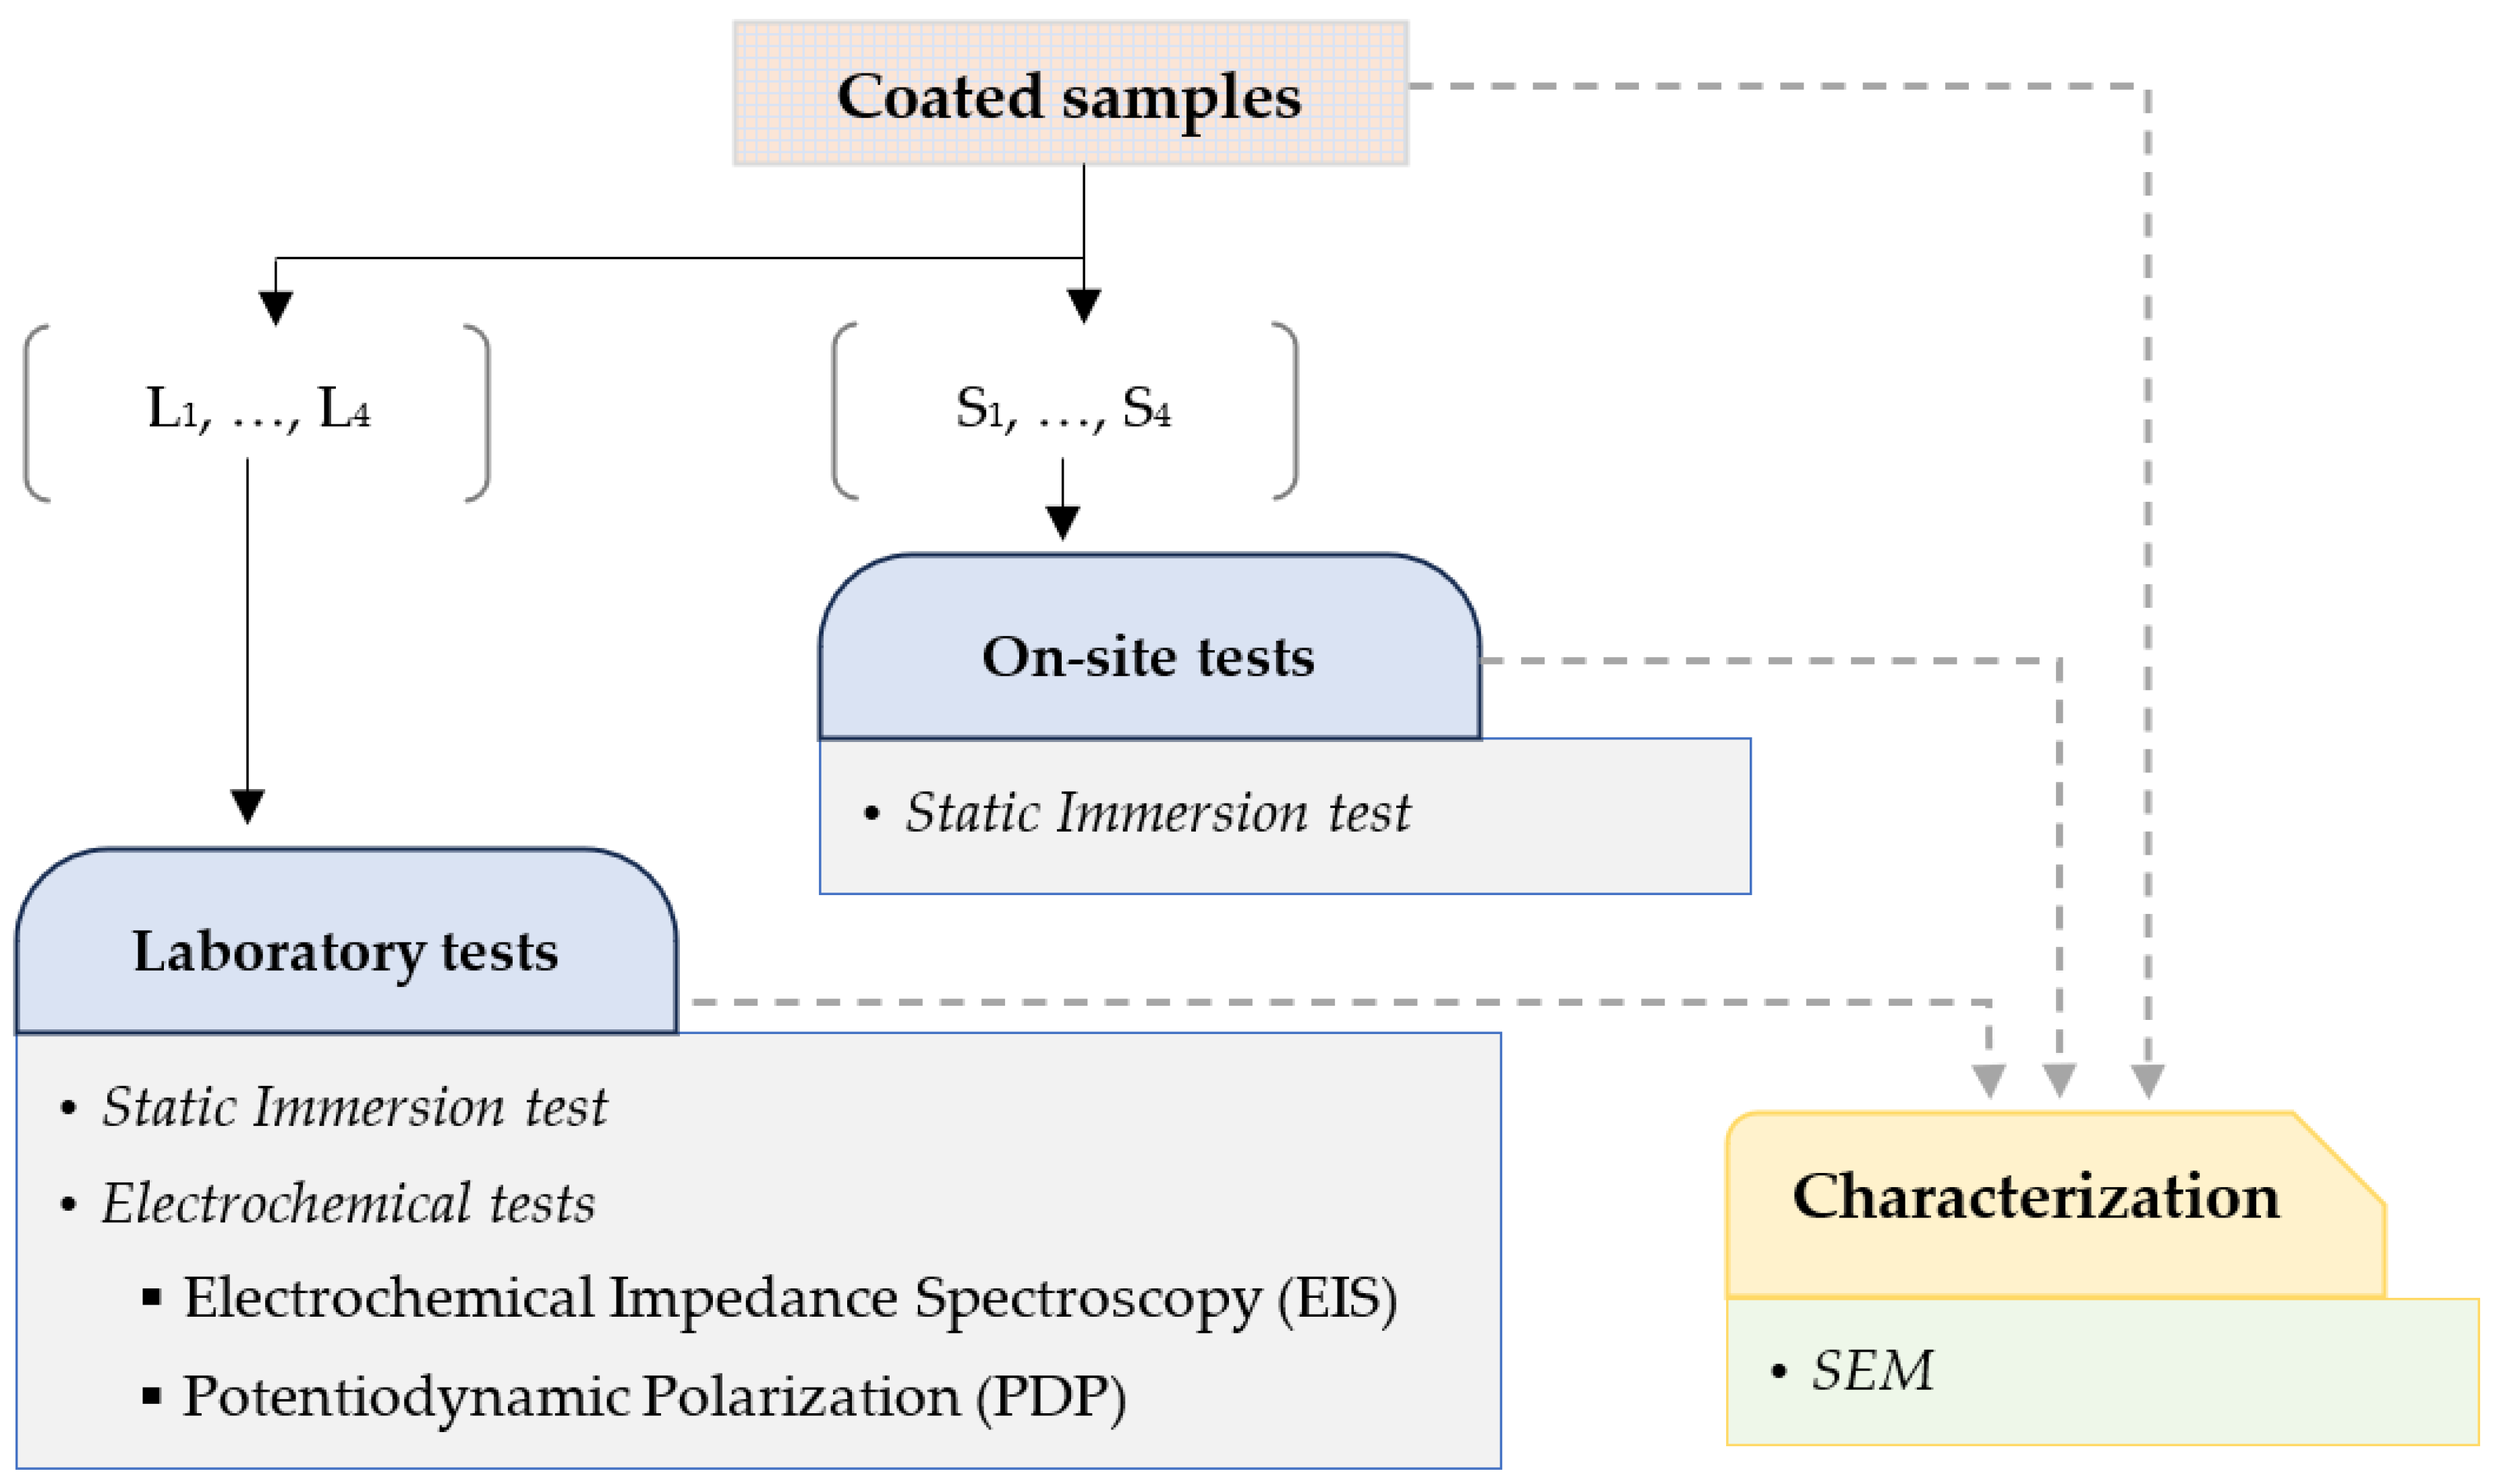
2.2.4. Panel Preparation

The microstructural characterization of the antifouling coating was followed by the application of paints to samples of naval steel (AH36) (Figure 2a) to evaluate their corrosion resistance. Rectangular samples of naval steel were cut using a cutting machine (Discotome 50, Struers, Inc., Willich, Germany) with water cooling. Then the samples were cleaned with deionized water and ethanol. The specimens, after drying at room temperature, were manually covered with two layers of the antifouling paint without an initial primer application (Figure 2b).
Two sets of coated steel panels were prepared: one set for corrosion assessments in controlled laboratory conditions and another set for evaluating corrosion resistance in situ under actual seawater conditions (Figure 3).
Four coated coupons, each measuring 4 cmL × 4 cmW × 0.5 cmT, were cut for corrosion evaluations in the laboratory. Three of the coated samples underwent static immersion testing in artificial seawater (ASW) [26] (Figure 4a), while the remaining samples were subsequently evaluated using electrochemical methods (Figure 4b). All measurements were conducted at room temperature.
To conduct the static immersion tests, the chemical composition of the ASW was determined according to ASTM D1141 specifications [27], while the total volume of ASW was ascertained using ASTM G 31-72 rules [28]. Five containers were utilized, each holding identical quantities and compositions of ASW. One coupon was submerged in each container (Figure 4a) for varying durations: 1, 7, and 12 weeks. The coupons were carefully taken out of their container at the end of the allotted time, and they were analyzed in the SEM after air drying.
Electrochemical experiments were also carried out on a weekly basis after 1, 5, and 12 weeks of total immersion in artificial seawater [26]. Electrochemical impedance spectroscopy (EIS) and potentiodynamic polarization (PDP) were carried out using a potentiostat and a three-electrode electrochemical cell (Figure 4b), with a graphite rod serving as the reference electrode (RE) and silver–silver chloride (SCE)/(Ag/AgCl) as the counter electrode (CE). The steel specimens, whether uncorroded (0 weeks of immersion) or corroded (1, 7, and 12 weeks of immersion), served as the working electrode (WE). A new working electrode was used for each run.
Open circuit potential (OCP) was monitored and recorded for a duration of 12 weeks to confirm that the system had attained a stable state before proceeding with further measurements. The potential dynamic polarization test (PDP) was conducted by applying a polarization voltage of −0.25 V downstream and 0.25 V upstream, relative to the open circuit potential (OCP), with a scan rate of 0.5 mV/s. Electrochemical impedance spectroscopy (EIS) experiments were conducted by applying a sinusoidal voltage of ±10 mV and obtaining impedance responses in a frequency range of 100 mHz to 10 kHz, with reference to the open circuit potential (OCP).
At the end of December 2024, one uncoated and three coated steel sheets were submerged at a depth of roughly 1 m in the sea for varying immersion durations of 1, 7, and 12 weeks. The selected location was next to the coastlines of Rafina (Figure 5). The surfaces exhibiting micro- and macro-biofouling were retrieved from the marine environment and maintained in the laboratory at ambient temperature for five days. The designation of the samples was based on the letter S and the period of immersion. The surface of the captured panels was cleansed of its existing fouling level [12]. The samples were examined metallographically by SEM to observe the topographical relief of the corroded surface of the steels.
The estimation of microfouling and macrofouling percentages using SEM images necessitated the integration of image analysis with a knowledge of fouling types. Microfouling includes bacterial films, biofilms, and diminutive organic/inorganic particles, generally less than 10 µm in size. Macrofouling encompasses larger organisms or structures, including algae, barnacles, and fungal hyphae above 10 µm. Utilizing Image-Pro Analyzer [29] on high-resolution SEM images, which encompassed both micro and macro scales, the contrast was enhanced and noise was minimized to differentiate fouling from the substrate. The surface was manually segmented into fouled and unfouled sections. The proportion of microfouling (tiny particles, biofilm texture) and macrofouling (bigger structures) was determined from the isolated fouling zone.

3. Results

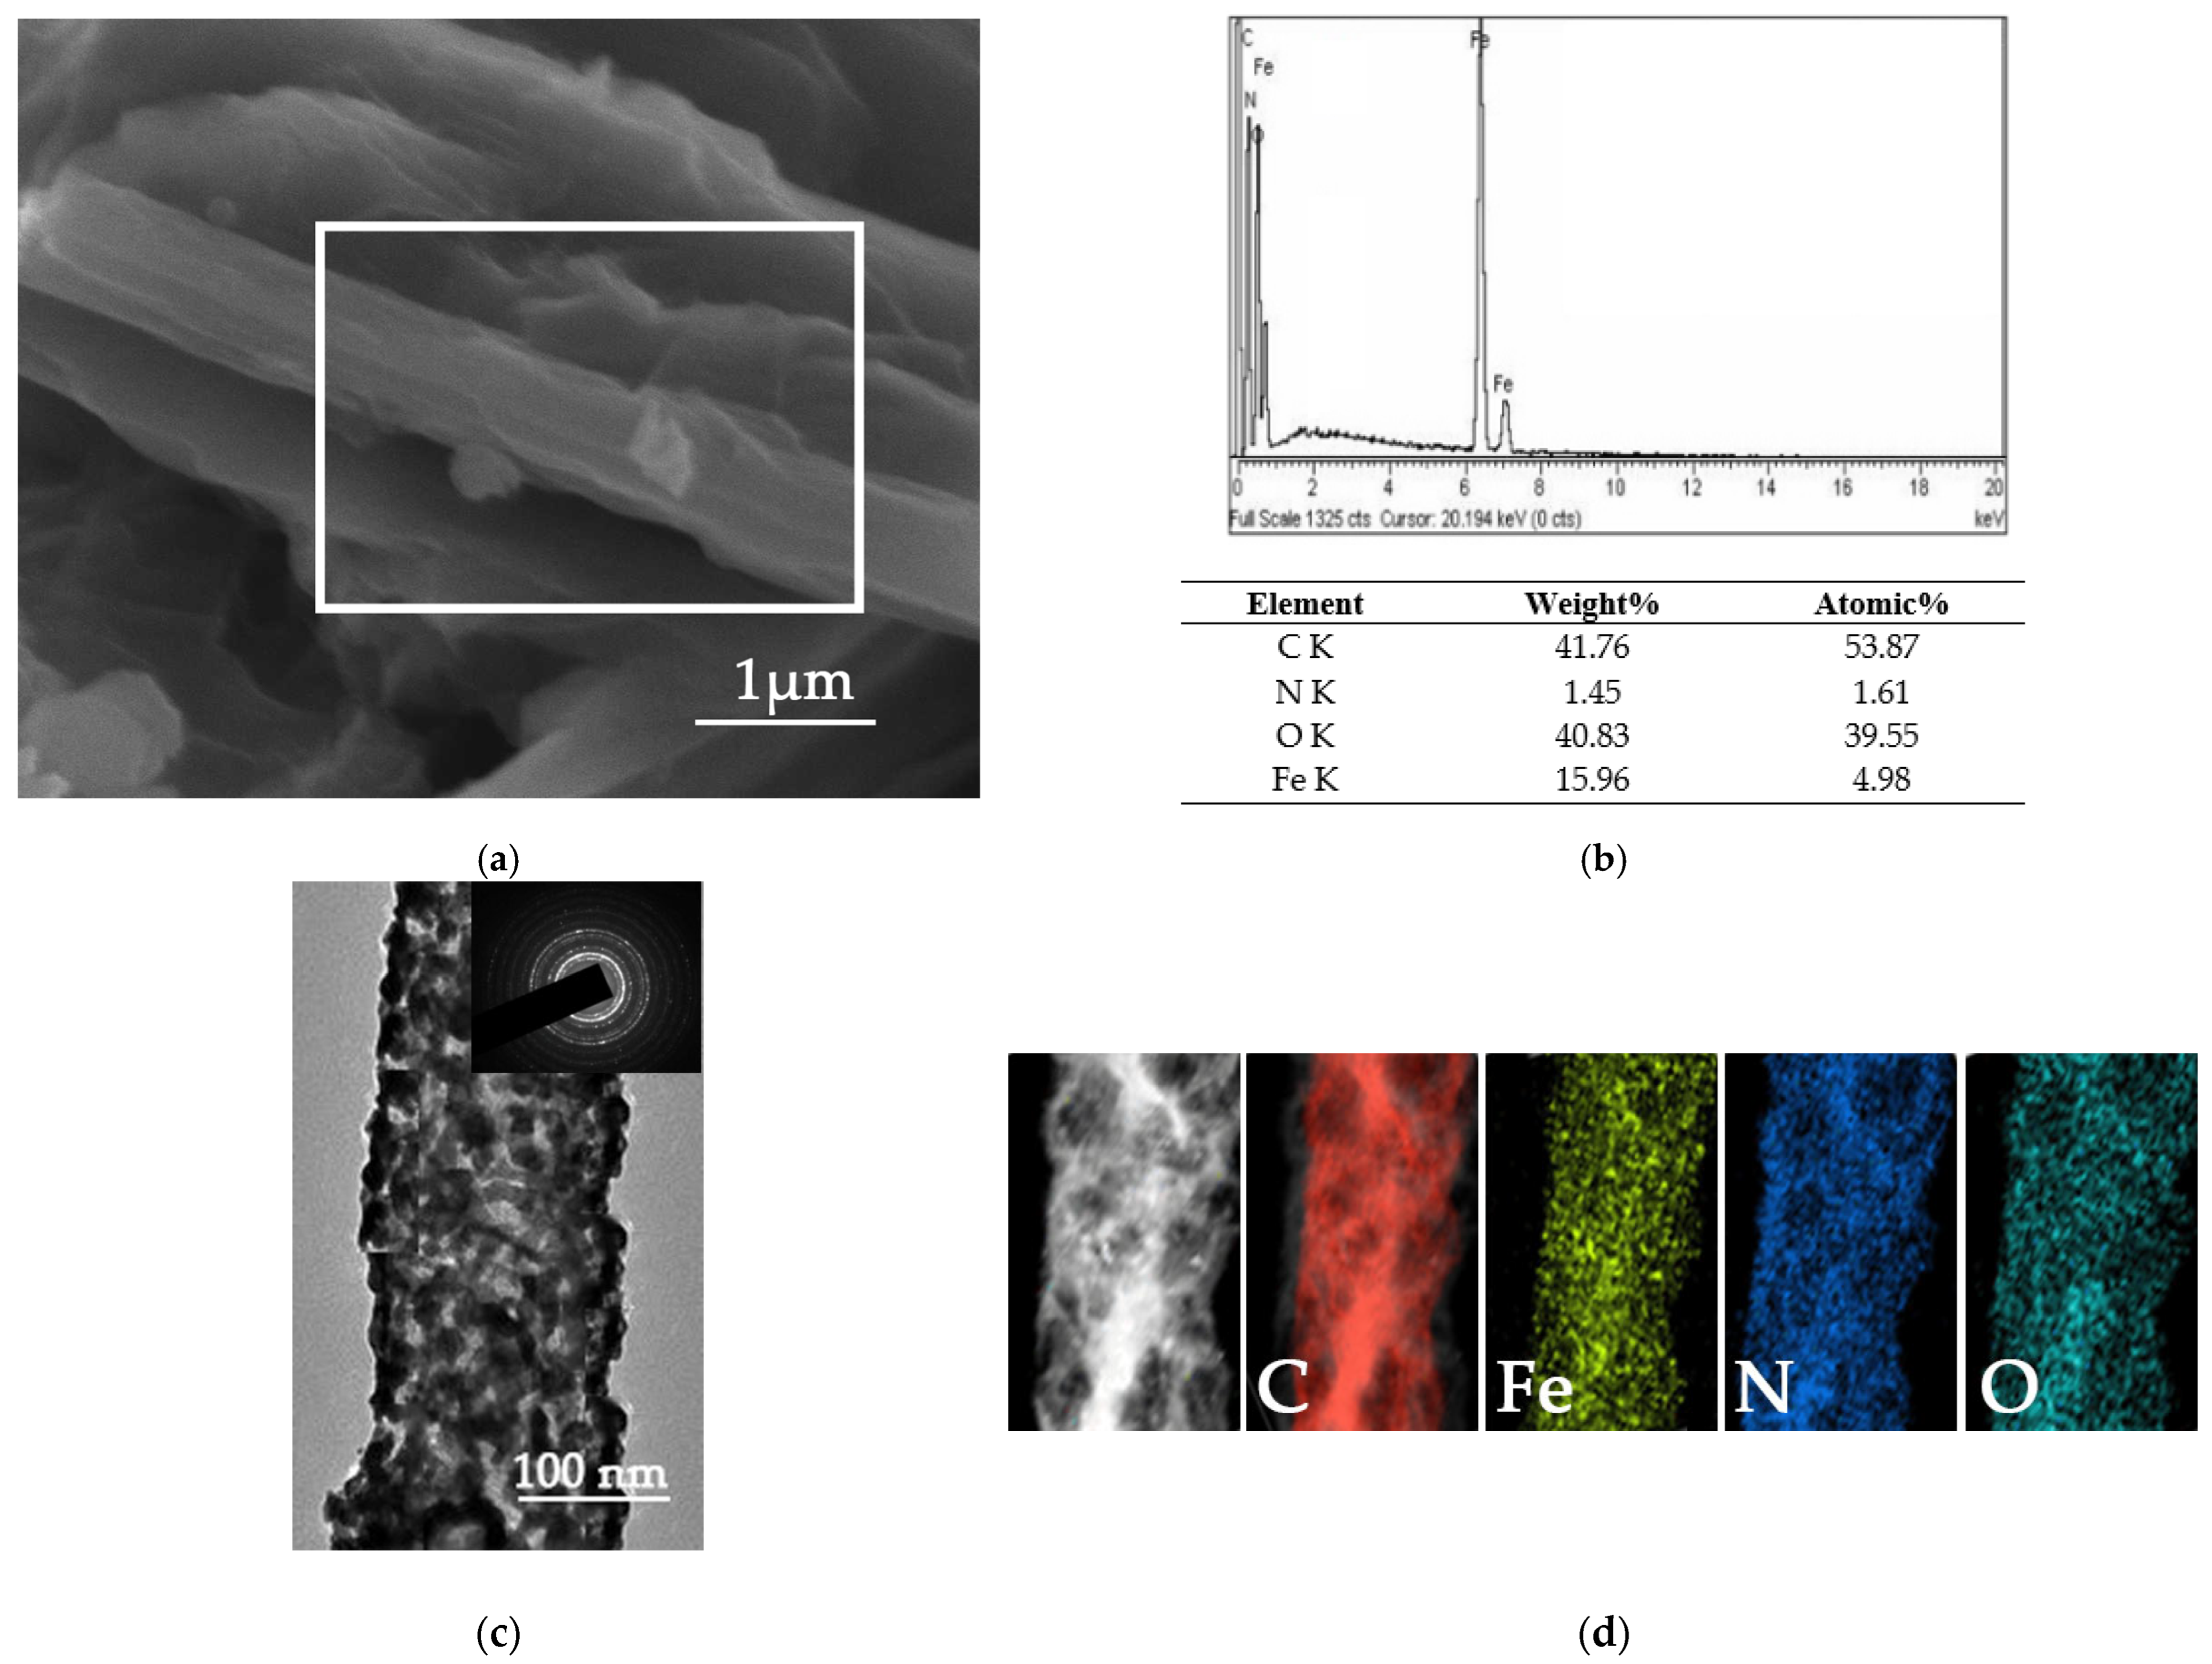
3.1. Microstructural and Morphological Characterization of the Nanocomposites

3.1.1. Characterization of Polyaniline (Pani)/Magnetite Nanocomposite (Fe3O4 NPs)

Magnetite nanoparticles (Comp.a1 in Figure 1) display a spherical shape with diminutive surfaces (Figure 6a). The mean diameter of the aggregates was ascertained to be approximately 92 nm. Generalized chemical microanalysis verified the identification peaks of iron and oxygen (inset image in Figure 6a). The sphericity of the Fe3O4 NPs is distinctly evident in the TEM micrographs (Figure 6b). The luminous points noted in the electron diffraction pattern of the chosen Selected Area Electron Diffraction (SAED) region demonstrate the crystalline characteristics of the synthesized nanoparticles (inset image in Figure 6b). The mean diameter of Comp.a1 was approximated at 11 nm.
The polymerization of Comp.a3 results in the creation of polyaniline nanorods (PAni) externally decorated with magnetite NPs. The PAni/Fe3O4 nanocomposite (Comp.A) displays distinct nanorod structures, heterogeneously orientated with differing average diameters (Figure 7a). Micro-area chemical composition analysis conducted using EDS (shown by the white rectangular shape in Figure 7a) verified the identification peaks of iron, oxygen, carbon, and nitrogen (Figure 7b). The element composition presented in the table of Figure 7b was determined as the average of three EDS area scan analyses.
Figure 7c illustrates the modification of PAni nanorods with magnetite in a bright-field picture obtained by TEM. The propensity for magnetite nanoparticles (14 nm) to increase in average diameter due to aggregation on the surface of PAni nanorods is a direct result of their elevated surface tension, attributable to their spherical morphology and diminutive size. The SAED pattern (inset image in Figure 7c) exhibits a ring configuration, signifying the polycrystalline characteristics of magnetite. Subsequent to modification, the cubic lattice of spinel magnetite (Fe3O4) was verified. The scanning TEM image and corresponding elemental map (Figure 7d) further revealed that Fe and O elements were uniformly distributed throughout the whole PAni nanorods. All the observations confirmed the successful synthesis of PAni/Fe3O4.

3.1.2. Characterization of Modified Graphene Oxide (GO) with Titanium Dioxide (TiO2)

The characterization of modified graphene oxide (GO) with titanium dioxide (TiO2) (Comp.B in Figure 1) reveals an irregular, heterotropically oriented sheet-like shape characterized by prominent folds, attributed to the entrapment of TiO2 forms (Figure 8a). Micro-area chemical composition analysis conducted using EDS (shown by the white rectangular shape in Figure 8a) revealed the presence of carbon and high-purity titania (TiO2) in the modified graphene oxide with titania (Figure 8b). The existence of carbon is ascribed to graphene, whilst oxygen and titanium are ascribed to titanium dioxide. The element composition presented in the table of Figure 8b was determined as the average of three EDS area scan analyses.
The layering of the GO structure is seen in the bright-field TEM pictures (Figure 8c). TiO2 is a rod-shaped nanoparticle. The compact arrangement of nanocrystalline titanium oxide is defined by a uniform distribution. The modification of graphene oxide with titania has been confirmed to influence the clustered growth of the graphene oxide lattice and the discrete dispersion of titanium nanoparticles. The SAED pattern for TiO2 (inset image in Figure 8c) exhibited a polycrystalline structure. The distance of each diffraction ring from the center determined the phase of the anatase. The elemental map (Figure 8d) further revealed that Ti and O elements were uniformly distributed throughout the whole GO matrix. All the observations confirmed the successful synthesis of GO/TiO2.

3.1.3. Characterization of the Final Antifouling Coating

Bright-field images in the TEM (Figure 9) reveal the robust bridging and cross-linking mechanism of the PANI/Fe3O4 nanocomposite (Comp.A) with the modified GO/TiO2 (Comp.B). The progressive ejection of polyaniline nanorods from the GO/TiO2 matrix is distinctly observable in an enlarged strain field. No augmentation in the average diameter of the polyaniline nanorods externally decorated with magnetite NPs was noted, indicating an absence of interaction between the nanocomposite and the modified GO/TiO2. This phenomenon can be ascribed to the heightened density of hetero-interfaces between the nanorods and the graphene oxide lattice, resulting in an intrinsic conductive spatial network.

3.2. Corrosion Tests of Antifouling Coating

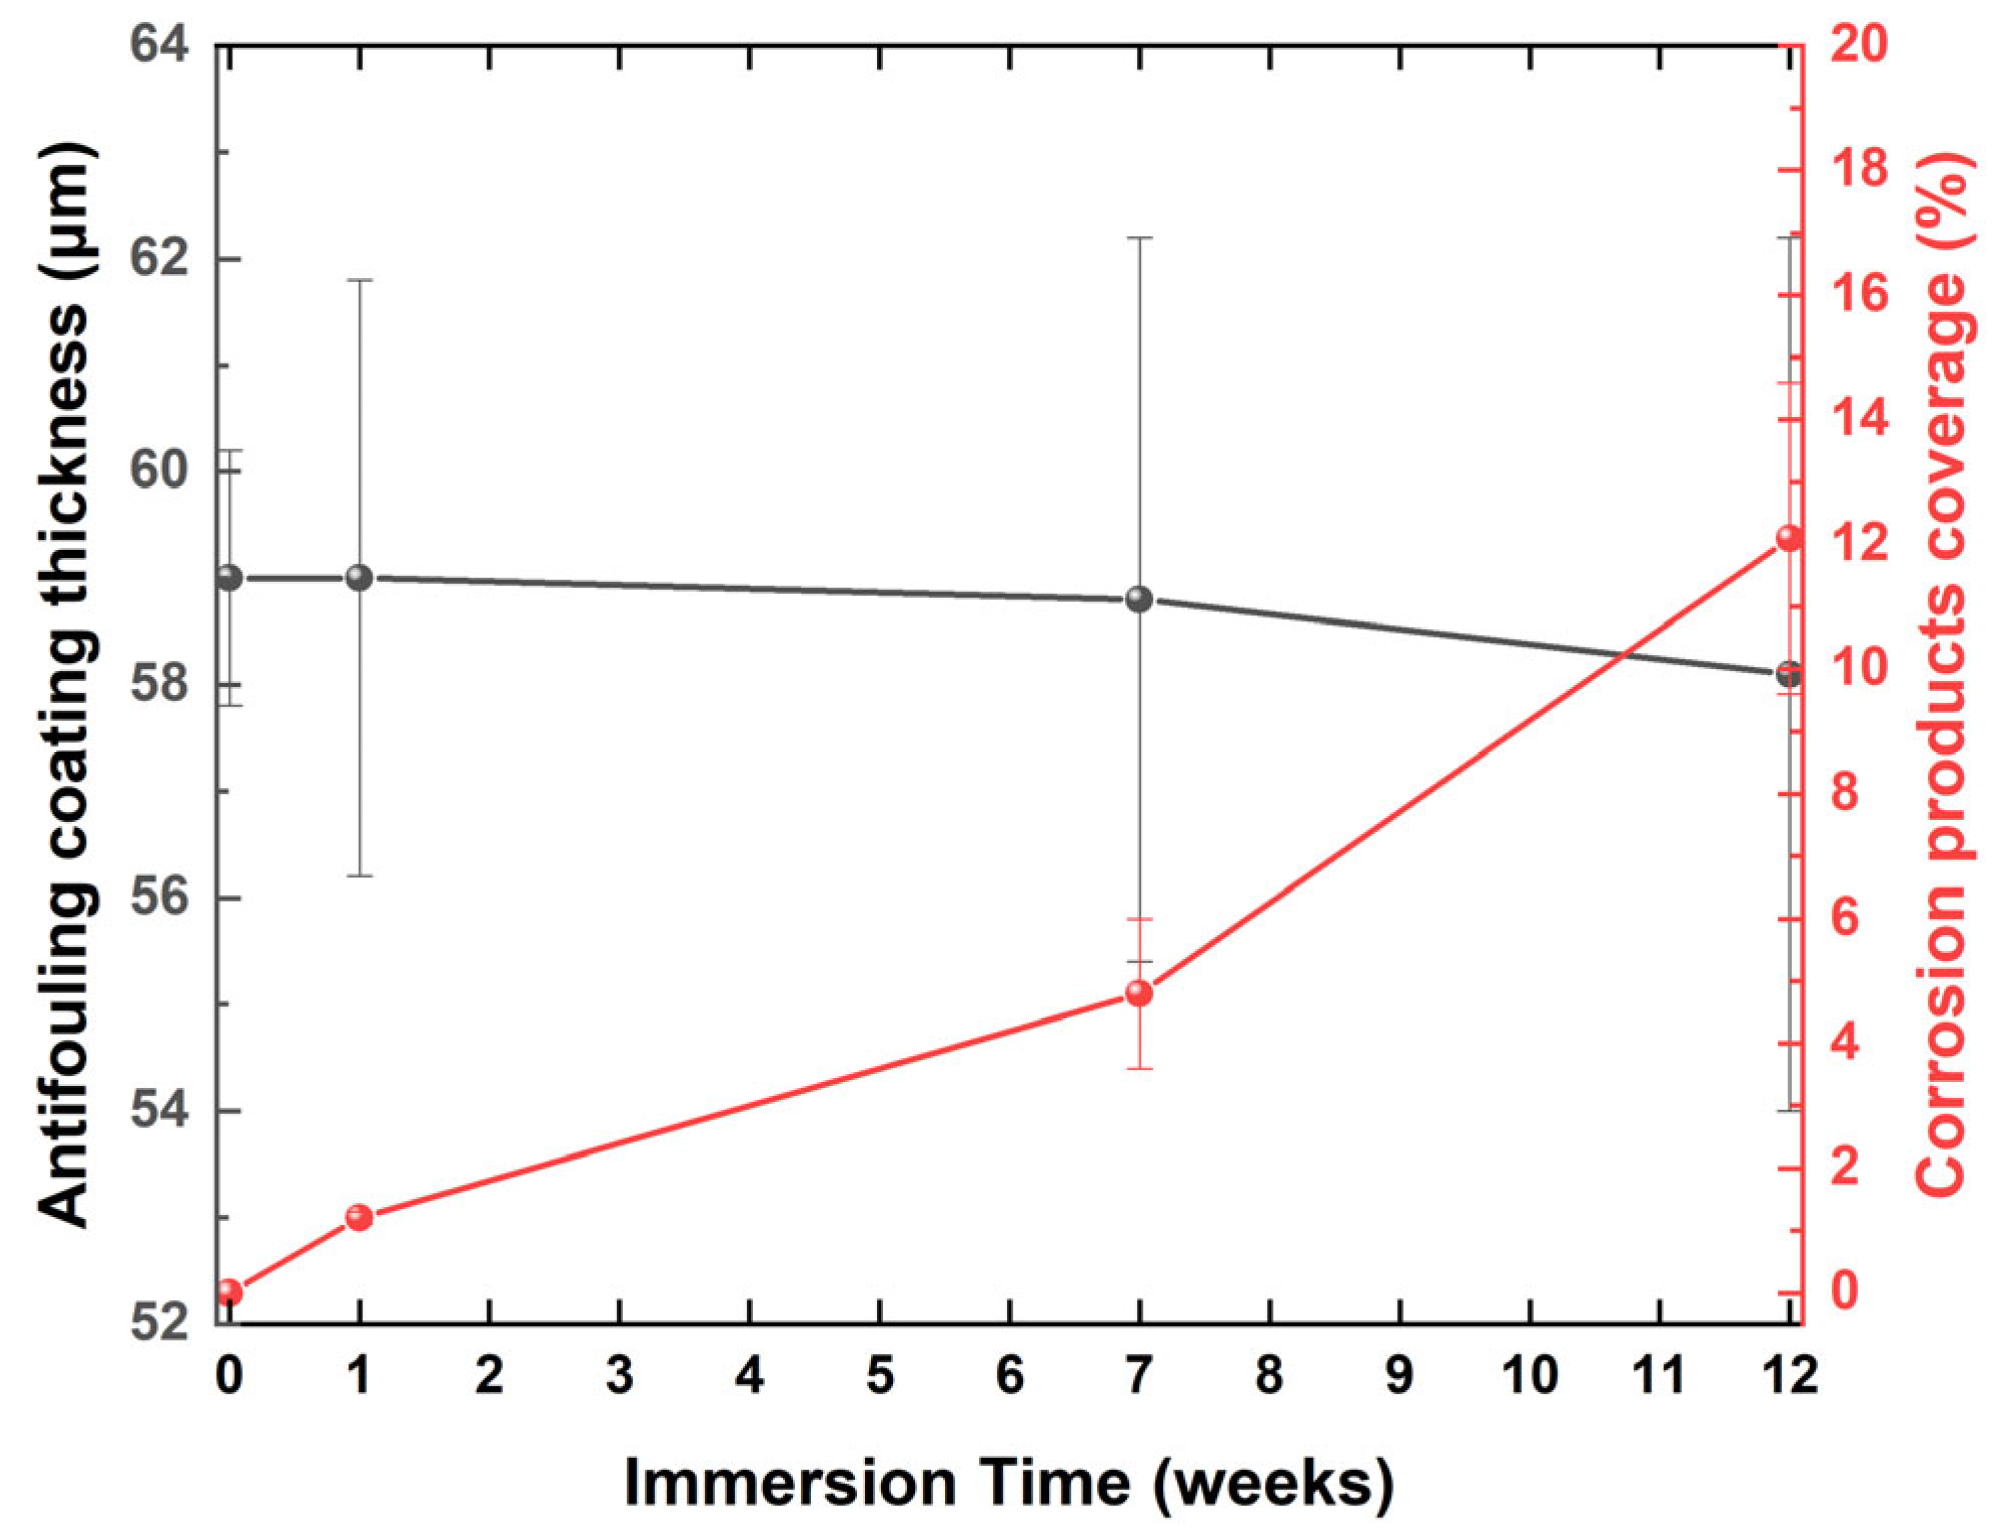
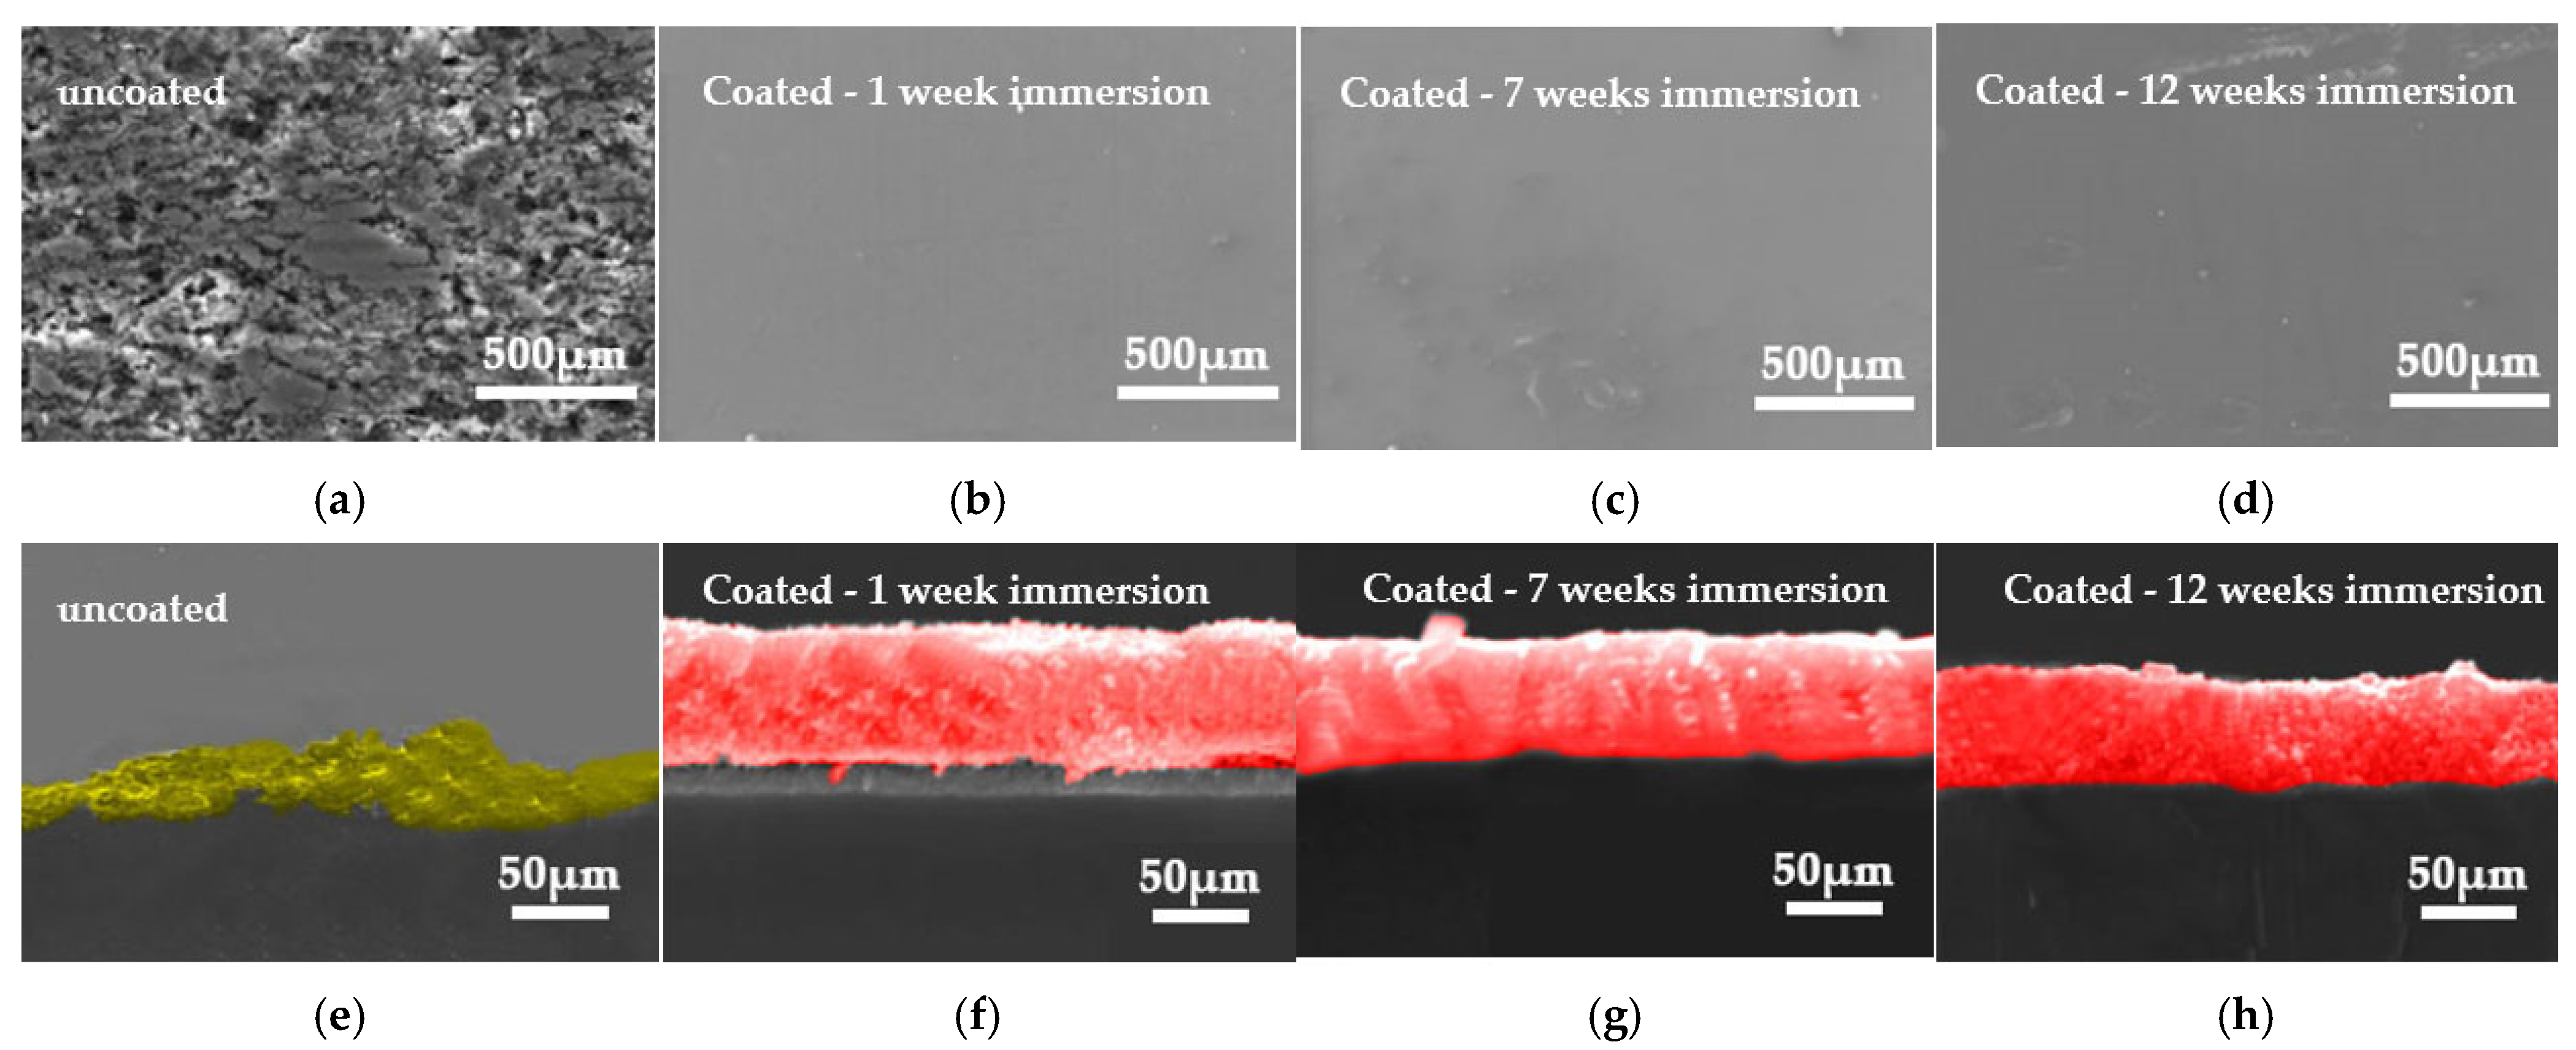
3.2.1. Static Immersion Tests

Figure 6 presents low-magnification SEM images of the surfaces of the coated steel samples prior to (Figure 10a–c) and subsequent to (Figure 10d–f) the laboratory static immersion test in ASW. The images provide definitive proof that, despite 12 weeks of continuous exposure of the coated specimen in ASW (Figure 10f), the corrosion products exhibit a minimal surface area. The surface of the coating exhibits no holes or cracks for both short (Figure 10d) and medium immersion durations (Figure 10e). Over a 12-week period in ASW, the specimen displays spatially localized corrosion products on its surface, while a significant area of the coated layer remains exposed (Figure 10f).
The coherence of the coating with the substrate is apparent in the cross-sectional pictures (Figure 10g–i), indicating excellent adhesion qualities to the steel substrate, even without a priming or tie coat layer. No flaws, voids, or microcracks are present throughout the whole coating after one week in the ASW (Figure 10g). Comparable behavior is also demonstrated during a 7-week residence in ASW (Figure 10h). With an extended immersion duration in ASW, the coating thickness diminishes (Figure 10i), which may also be due to the depletion of the water-soluble resin. The coating retains its solidity despite the accumulation of corrosion products on the surface (Figure 10f).
The EDS element mapping on the surface of the coated samples did not provide accurate data about the distribution of corrosion elements (iron and oxygen), since their participation percentages also encompassed contributions from the AF coating, leading to inflated values. Likewise, the EDS element distribution along an EDS line scan in standard SEM cross-sectional images, owing to the minimal involvement of corrosion products and the presence of iron and oxygen in the AF coating matrix (which decorates the surface of PAni), did not produce representative corrosion outcomes.
Consequently, XRD measurements were conducted on the corrosion products to identify their chemical composition (Figure 11), and the surface coverage percentage of corrosion products was estimated through the analysis of Figure 10d–f using Image-Pro Analyzer 10 software (Figure 12) [29]. Figure 12 further illustrates the variation in antifouling coating thickness relative to the time immersed in ASW. The coating thickness is calculated as the average of 15 measurements taken from cross-sectional SEM images.
Identification of the XRD diffraction peaks for the corrosion products on the coated surface after five weeks in ASW revealed the presence of three Fe(III)-oxyhydroxides, namely goethite (α-FeO(OH)), aka-ganeite (β-FeO(OH)), and lepidocrocite (γ-FeO(OH)). After 12 weeks in ASW, crystalline solid phases of maghemite (Fe2O3) emerged on the surface. After one week of immersion, only the diffraction peaks of aka-ganeite and lepidocrocite were observed. Their intensity was diminished, suggesting that the concentration of these rust products was reduced or their crystallinity was inferior.
The steel/coating interface exhibited no corrosion products after 12 weeks of immersion in seawater, underscoring the superior barrier properties of the antifouling coating, while any corrosion products observed on the surface resulted from the dissolution of iron ions from the antifouling coating matrix. The substances generated on the coating surface and at the steel/coating interface were identified mostly as loosely bound precipitates, as they were readily detached during drying.
The coating thickness diminished gradually (Figure 12), with slight variations at each measurement point (low standard deviation). The measurements of coating thickness excluded the corrosion products on its surface. The reduction in thickness is attributable to the dissolution of a portion of the AF-coated resin in the ASW. Cross-sectional images reveal that, despite 12 weeks of immersion in ASW, the adhesion to the steel substrate remained exemplary, with no cracking or flaking that could facilitate the development of a corrosion layer at the steel/coating interface. Furthermore, corrosion products were spatially confined to the coating surface, as indicated by the low percentage of corrosion coverage values.
In areas where a decrease in coating thickness was seen, it is likely that weakly adhered corrosion precipitates were eliminated during the removal of the coating. Consequently, it is posited that the proportion of surface area covered by corrosion products remained minimal. This behavior illustrates the superior anti-adhesion characteristics of the coating.

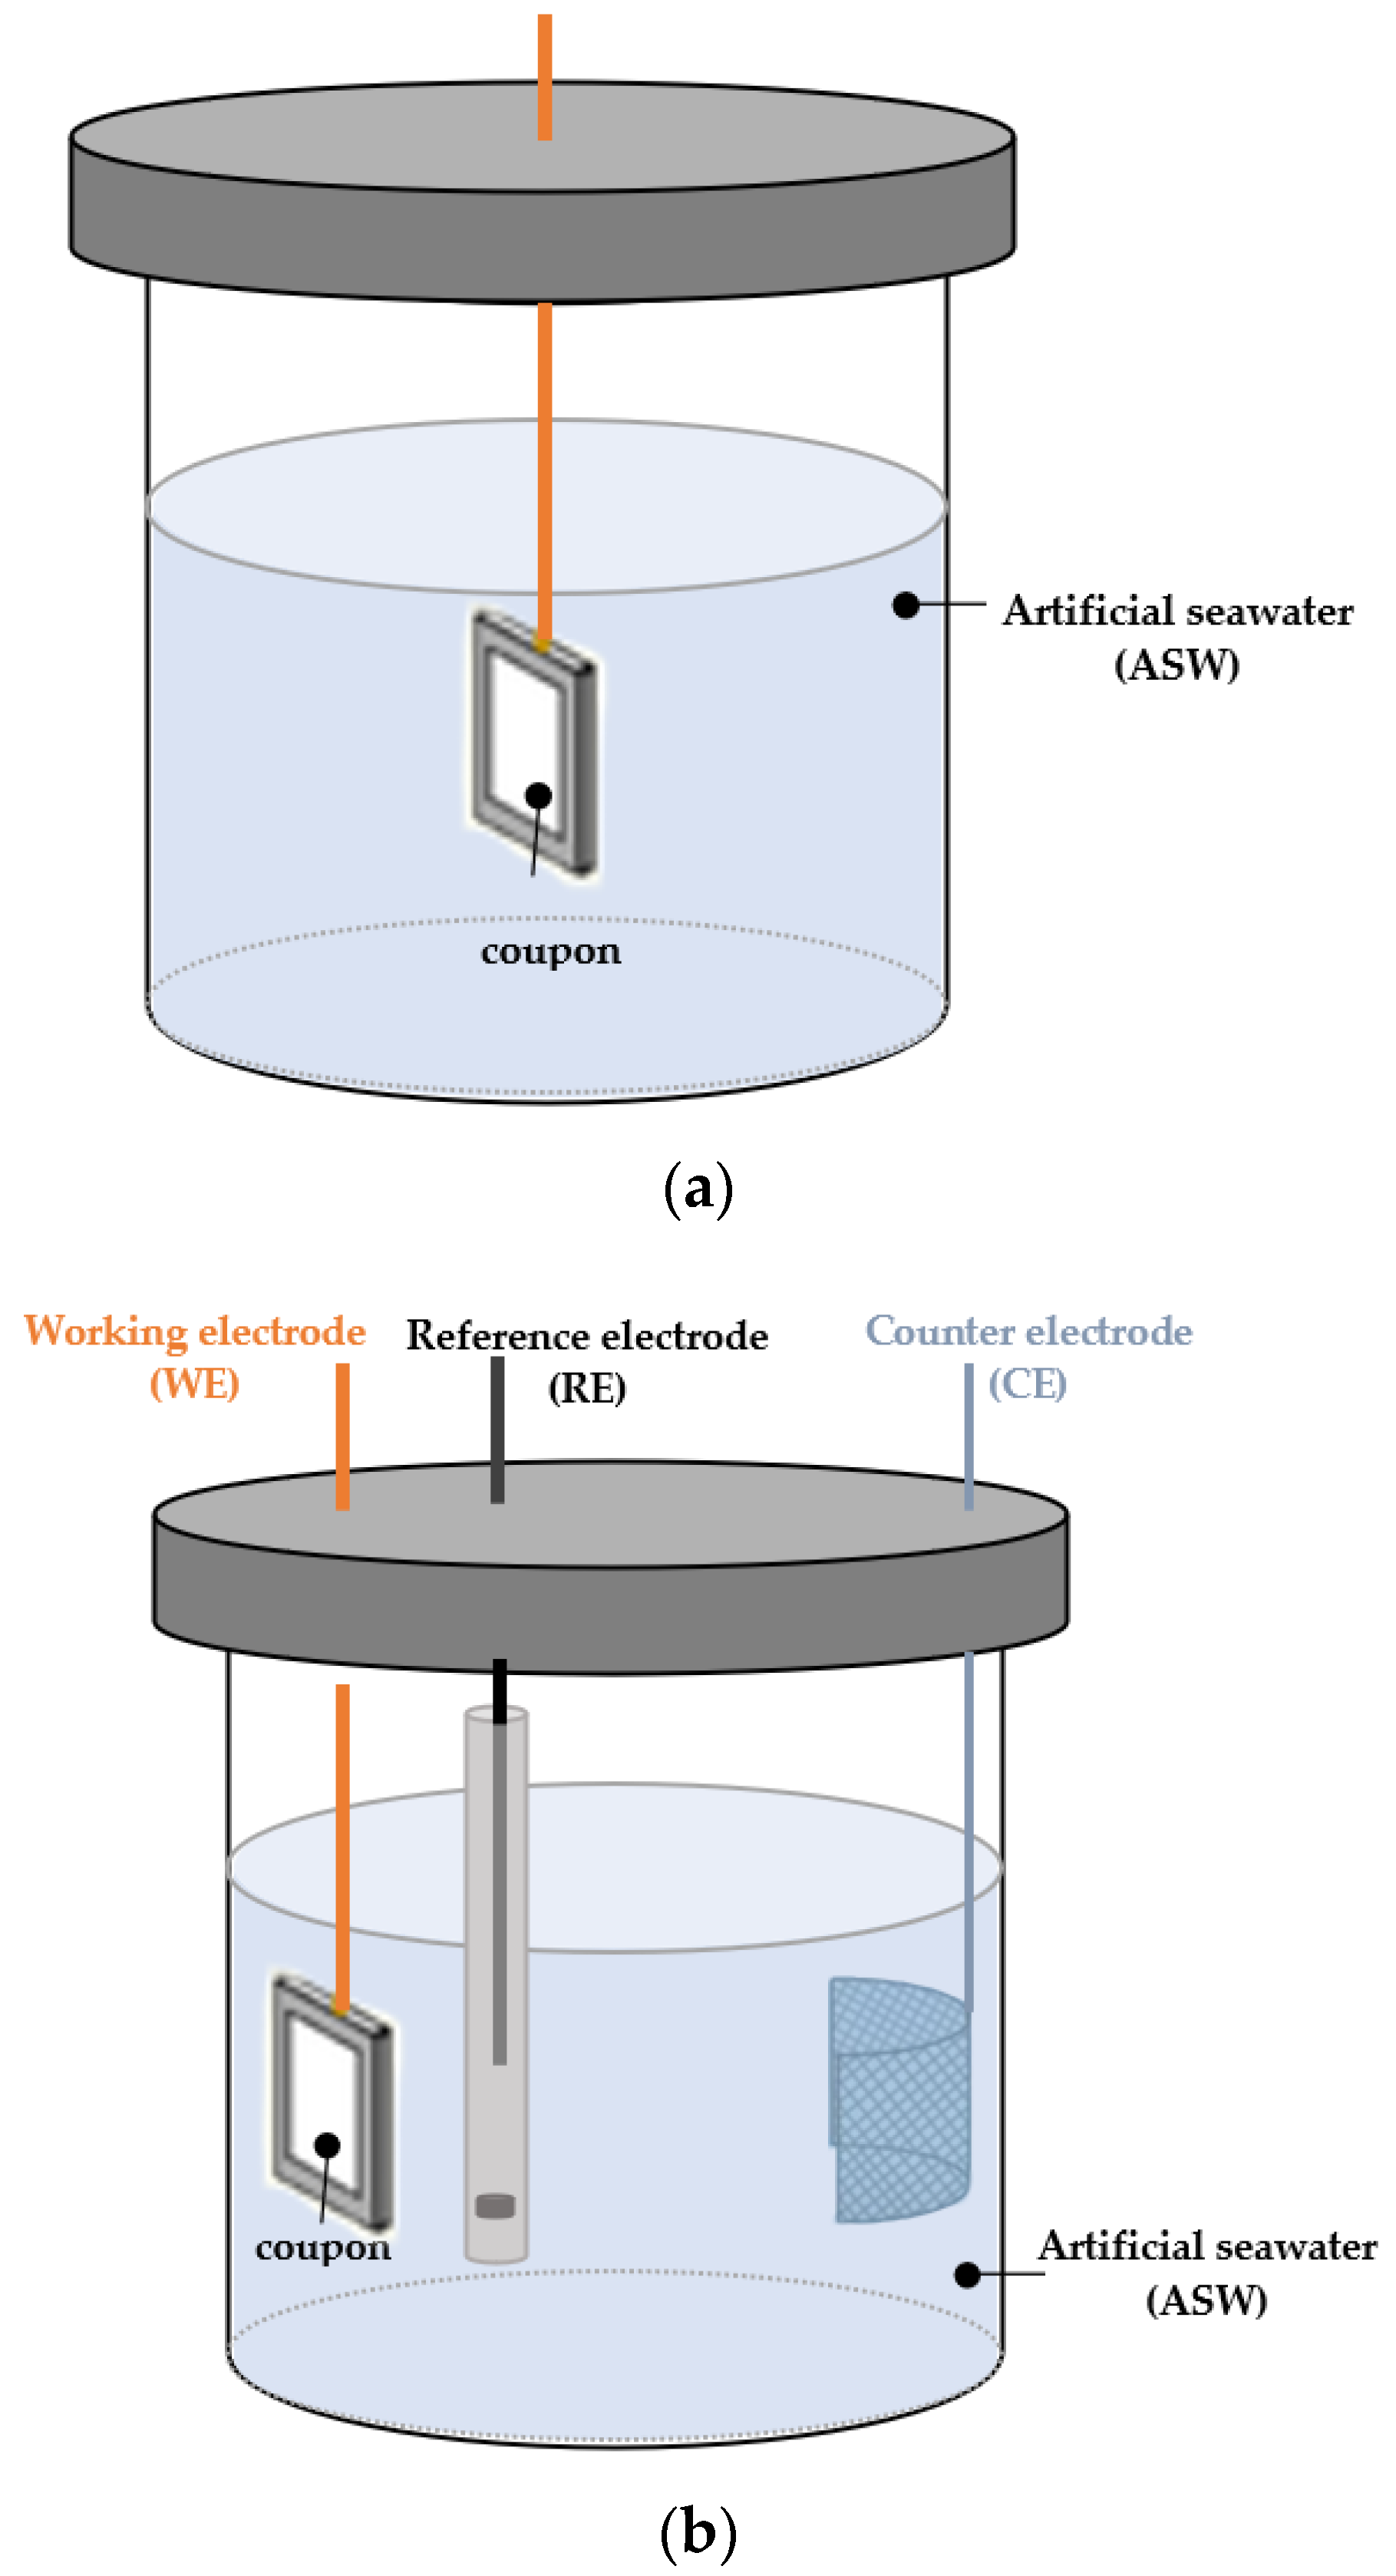
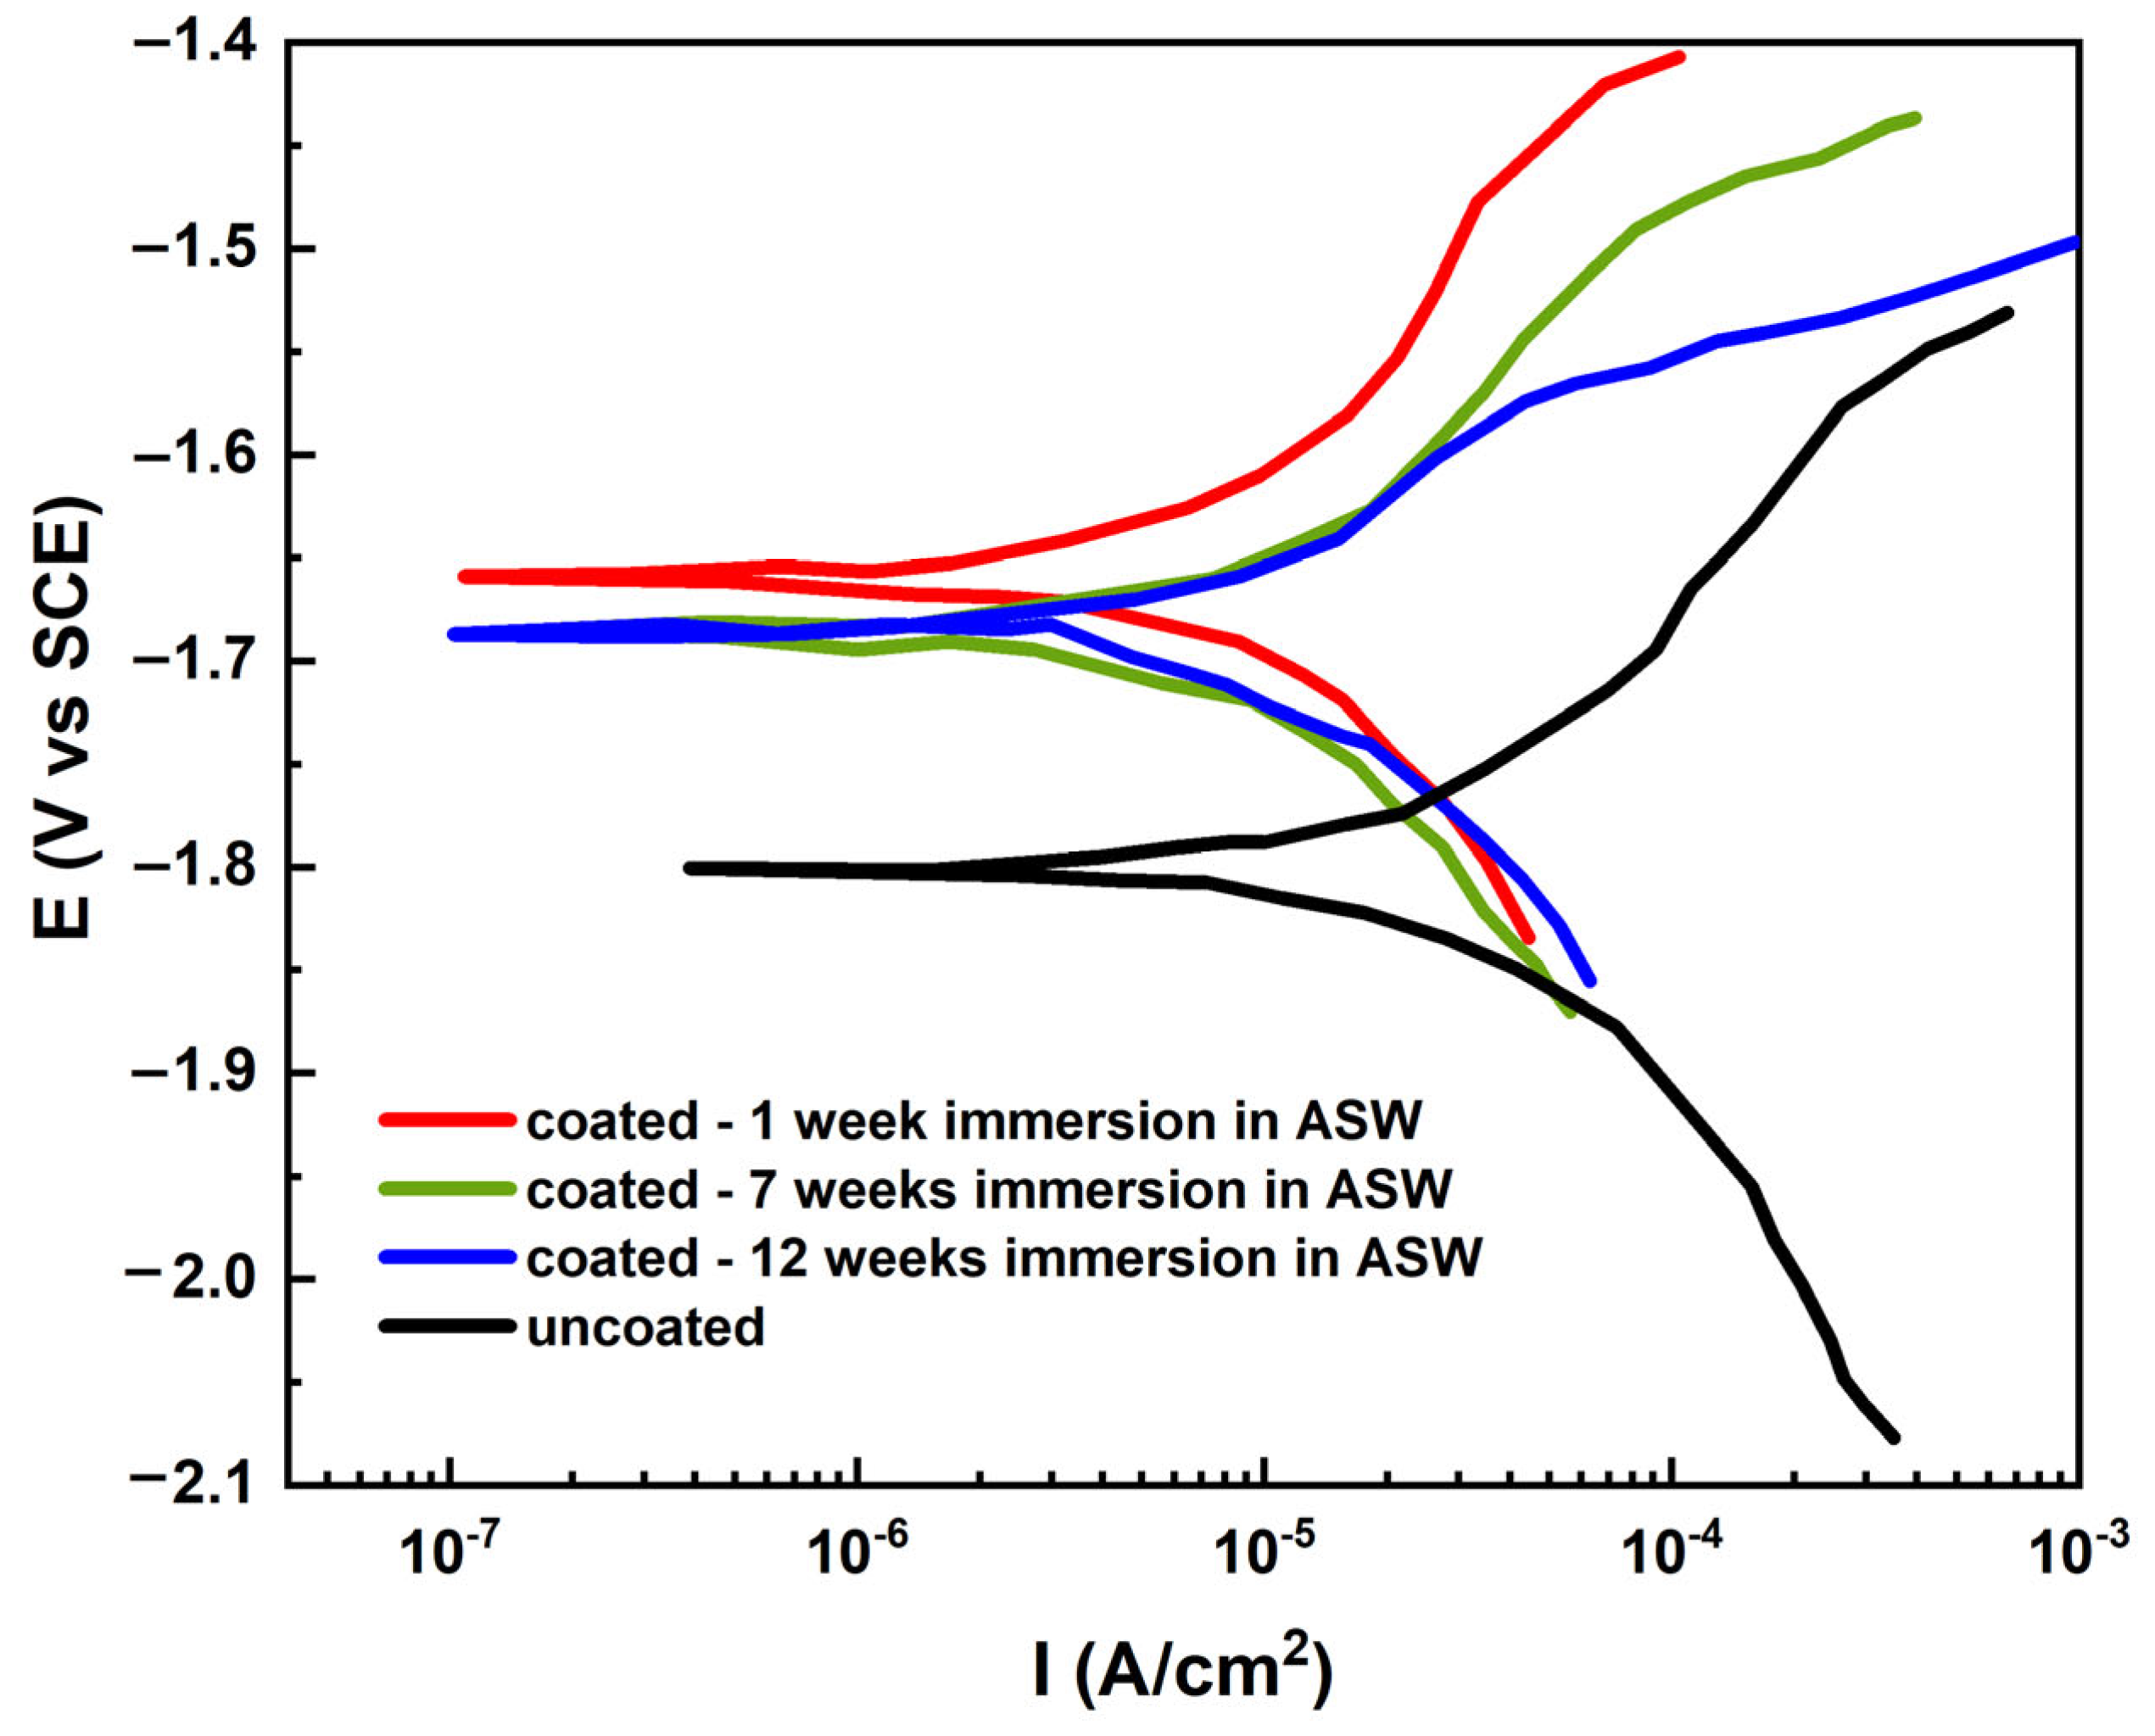
3.2.2. Potentiodynamic Polarization (PDS) Tests

The naval steels with the antifouling coating were analyzed by measuring their potentiodynamic curves after varying immersion durations in artificial seawater, as illustrated in Figure 13. An uncoated sample of steel was examined for comparative analysis. The potentiodynamic curves of the coated samples clearly shifted to the left, with a less negative direction compared to those of the uncoated sample. Consequently, the corrosion potential values increase, and the curves correspond with diminished current density values across most of their range.
By utilizing CorrView v.36a software in Rp mode, it was possible to fit the polarization curves (Figure 13) and analyze the corrosion behavior. Rp mode allows for the determination of parameters like corrosion potential (ECORR), corrosion current density (ICORR), and polarization resistance (Rp), which are crucial in understanding a coated steel’s corrosion characteristics.
Table 1 indicated that the ECORR of the steel samples shifted to higher positive values with the application of the antifouling coating. The values of ECORR, ICORR, and Rp for the coated samples did not exhibit a monotonic decrease with increasing immersion time. Following one week of immersion in ASW, the ECORR of the coated sample rose by over 142 mV to −1.659 V, ICORR diminished to one-sixth of the ICORR of the uncoated sample at around 4.00 µA/cm2, and the Rp increased threefold to 6494 ohm/cm2 in comparison to the uncoated sample. The Rp had a modest decline; however, ICORR and ECORR grew throughout the subsequent six weeks of immersion. Upon extending the immersion duration to 12 weeks, the ECORR increased by only 1 mV, the Rp was increased by 13%, and the ICORR was diminished by almost 1.13 times in comparison to the coated sample immersed for 7 weeks. Despite the one-week immersion coated sample exhibiting the highest corrosion resistance, the positive ECORR value, along with the reduced corrosion current, signifies the excellent barrier properties of the antifouling coating even after prolonged exposure to artificial seawater.
Figure 14 presents the SEM images of the surface (Figure 14a–d) and the associated cross-section (Figure 14e–h) of the samples following the corrosion potentiodynamic tests. The surface of the uncoated naval steel (Figure 14a) exhibits a pronounced topographic relief, characterized by notable cleavages and cavitation. The presence of heterotopically oriented exfoliations with an expanded morphology indicates material loss upon contact between the exposed metal surface and the ASW under laboratory settings. The SEM cross-sectional image (Figure 14e) confirms that the surface exhibits significant porosity. The corrosion product’s thickness is characterized by the presence of cracks directed transversely to the sample surface.
After the shipbuilding steel was coated with antifouling material and submerged in seawater for a week, the coating’s surface remained largely unblemished (Figure 14b). The cross-sectional image (Figure 14f) corroborates the superior barrier properties demonstrated by the coated specimens. Following seven weeks in ASW, the coating network exhibited a continuous and homogeneous distribution, with minor, dispersed circular flaws present on its surface (Figure 14c,g). The decrease in coating thickness (Figure 14g) is attributable not to corrosion but to material loss resulting from the dissolving of the resin in the ASW solution.
Ultimately, following 12 weeks of exposure to ASW, spatially confined, small-diameter pits, lacking significant depth, were detected on the surface of the coated specimen (Figure 14d). The coating maintained a high degree of coherence to the substrate, exhibiting neither fractures nor porosity linked to potential capillary processes (Figure 14h). Thus, the inferior barrier properties of the antifouling coating are reaffirmed.
No EDS element mapping was conducted for the statically immersed coated steel samples due to the minimal presence of corrosion products on the surface and the existence of magnetite in the coating. In the potentiodynamic corroded samples, even after 12 weeks in seawater, no corrosion layer formed at the steel/coating interface due to the lack of capillary phenomena within the coating. The superior barrier properties of the coating are also validated in the case of potentiodynamic corroded materials.
The XRD patterns of the samples did not reveal diffraction peaks corresponding to precipitated corrosion particles on the surfaces of the tested coated samples, owing to their low volume fraction. Consequently, Raman measurements were conducted on the surfaces of the materials (Figure 15).
Lepidocrocite (γ-FeO(OH)) was discovered at all residence times. During a one-week immersion period, γ-FeO(OH) exhibited Raman peaks at 224 cm−1 [30], 303 cm−1 [31], and 523 cm−1 [32]. At 7 weeks of immersion in ASW, lepidocrocite exhibited bands at 140 cm−1 [32], 250 cm−1 [31], and 375 cm−1 [32]. Ultimately, during a 12-week period of immersion, γ-FeO(OH) was detected at peaks of 150 cm−1 [30], 250 cm−1 [31], 380 cm−1 [33], and 654 cm−1 [34].
The corrosion inhibition efficiency (n%) of the coating was calculated the using the formula
n   ( % )   =   1 I C O R R   ( c o a t e d ) I C O R R   ( u n c o a t e d ) · 100 % ,
where ICORR (coated) represents the corrosion current of the sample with antifouling paint, and ICORR (uncoated) denotes the corrosion current of the uncoated sample.
The corrosion inhibition efficiency of the samples immersed for 1 week, 7 weeks, and 12 weeks, as determined from the potentiodynamic polarization data, was 82.49%, 63.10%, and 67.32%, respectively. The rise in the degree of coating protection percentage from 7 weeks to 12 weeks of immersion indicates the corrosion resistance properties of the antifouling paint, even in harsh aquatic environments like seawater.

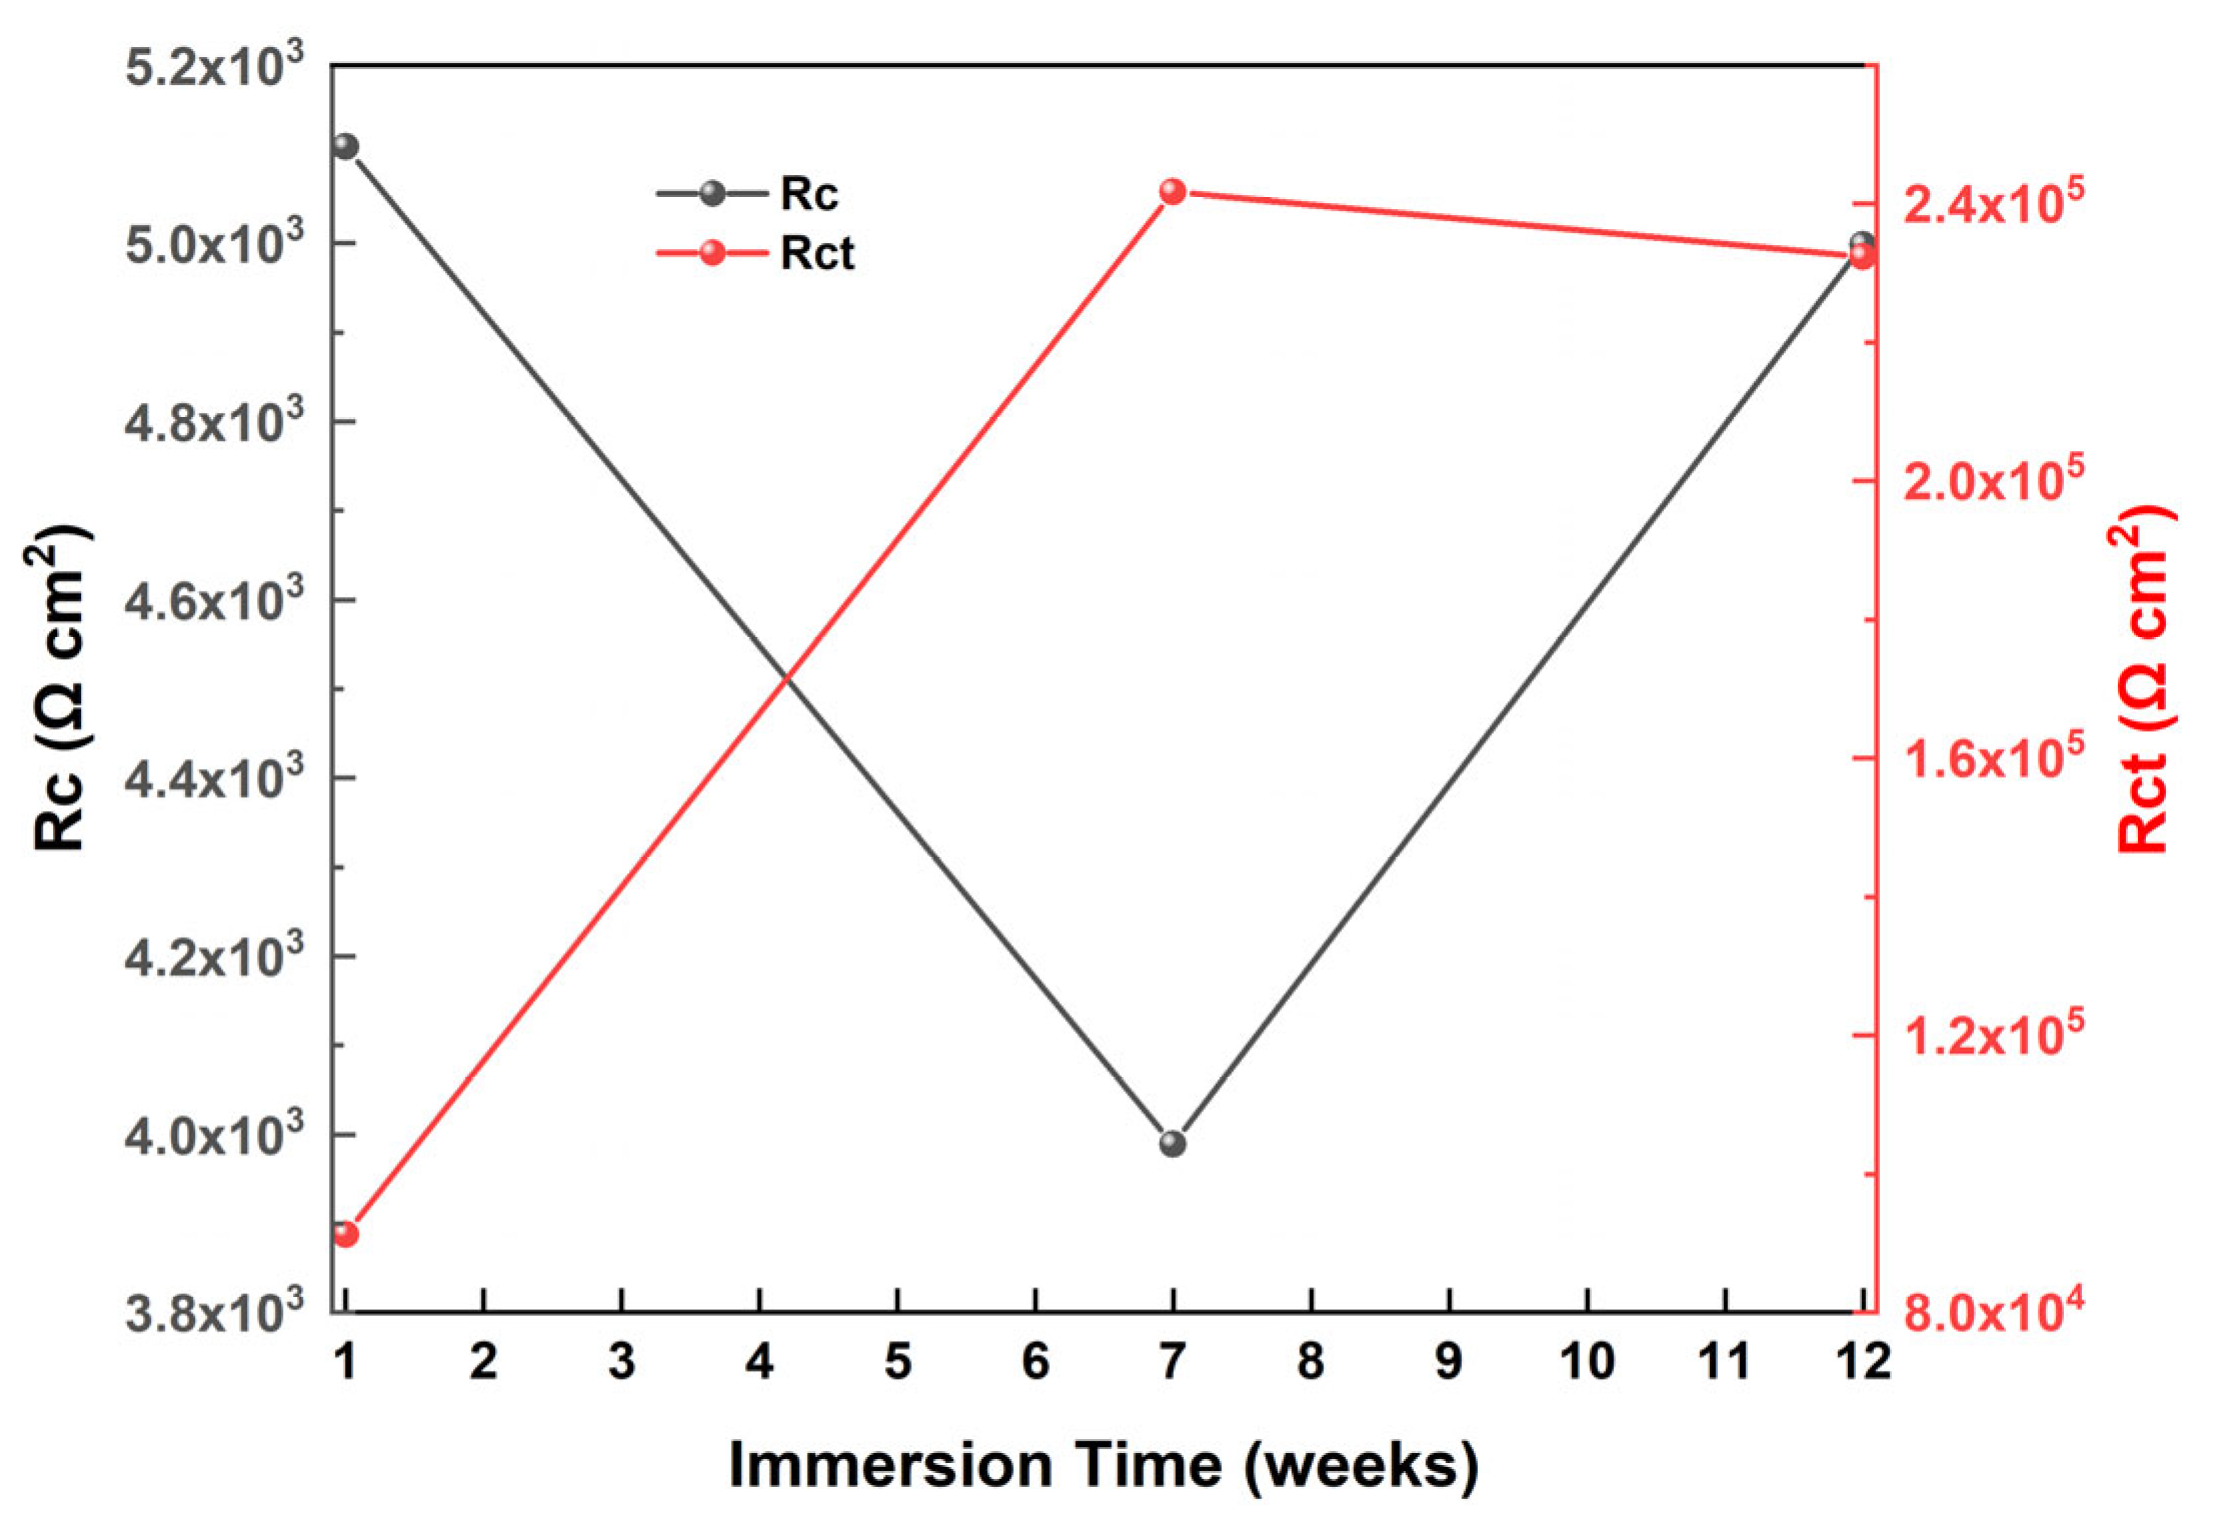
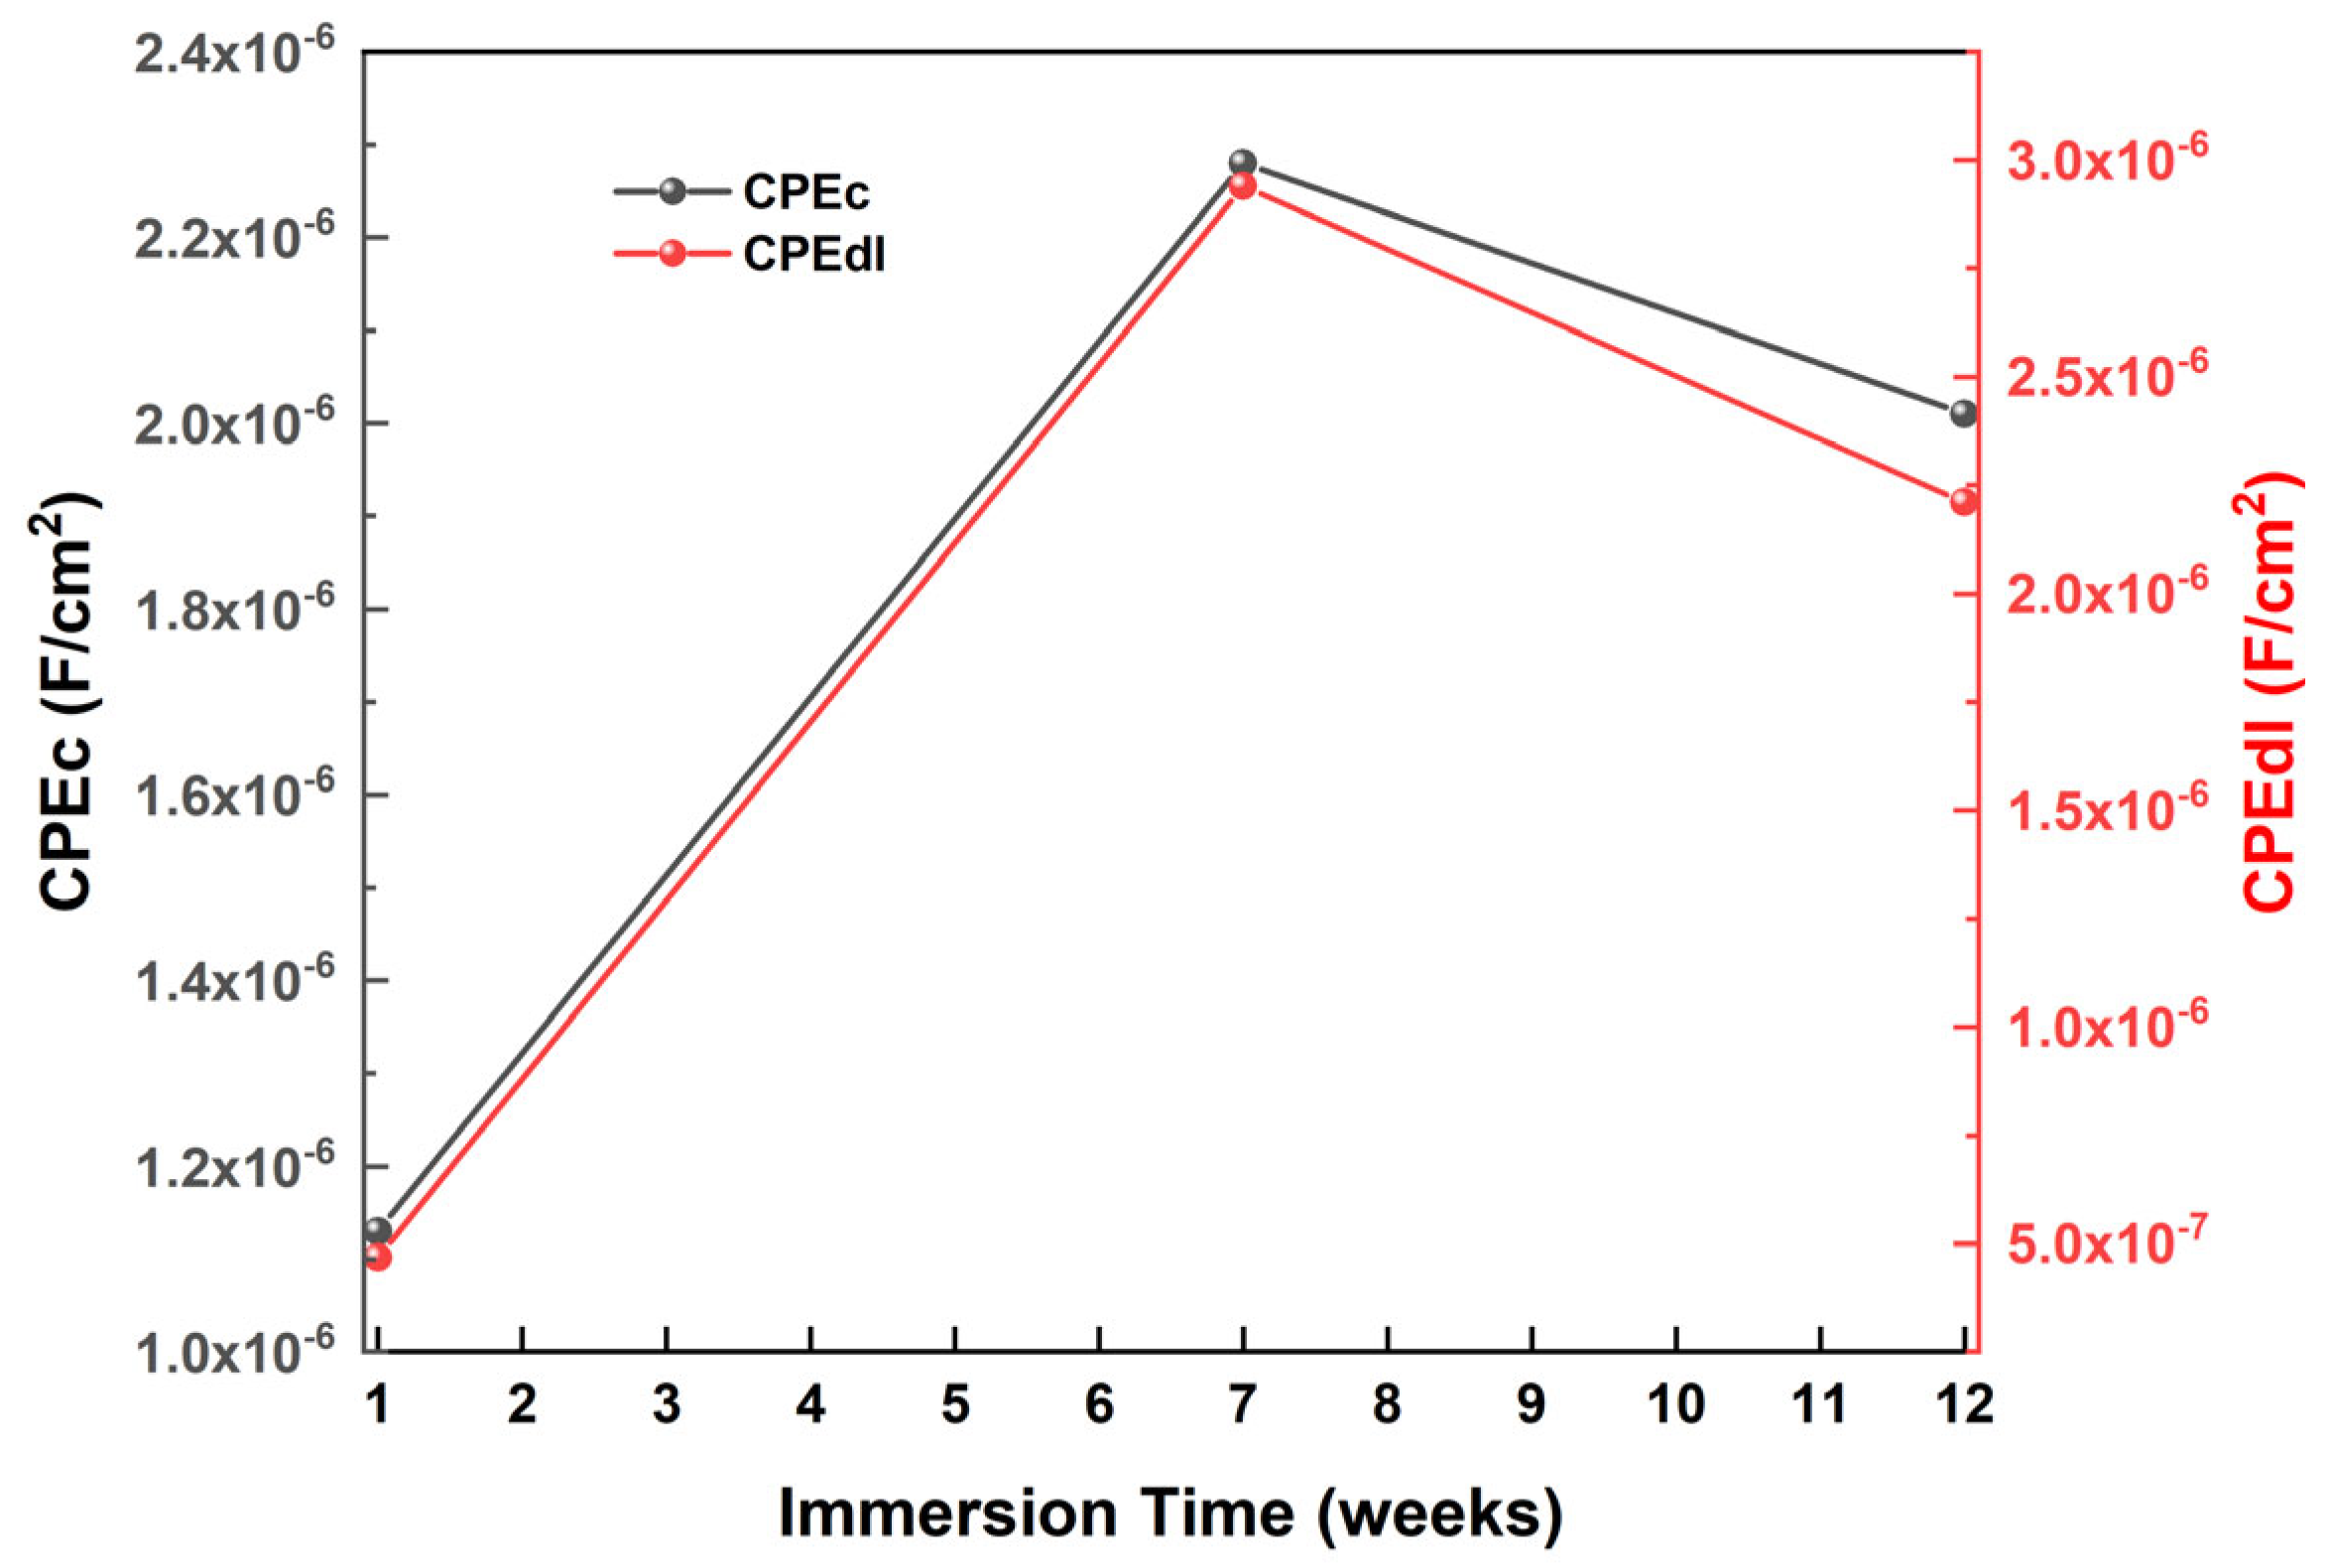
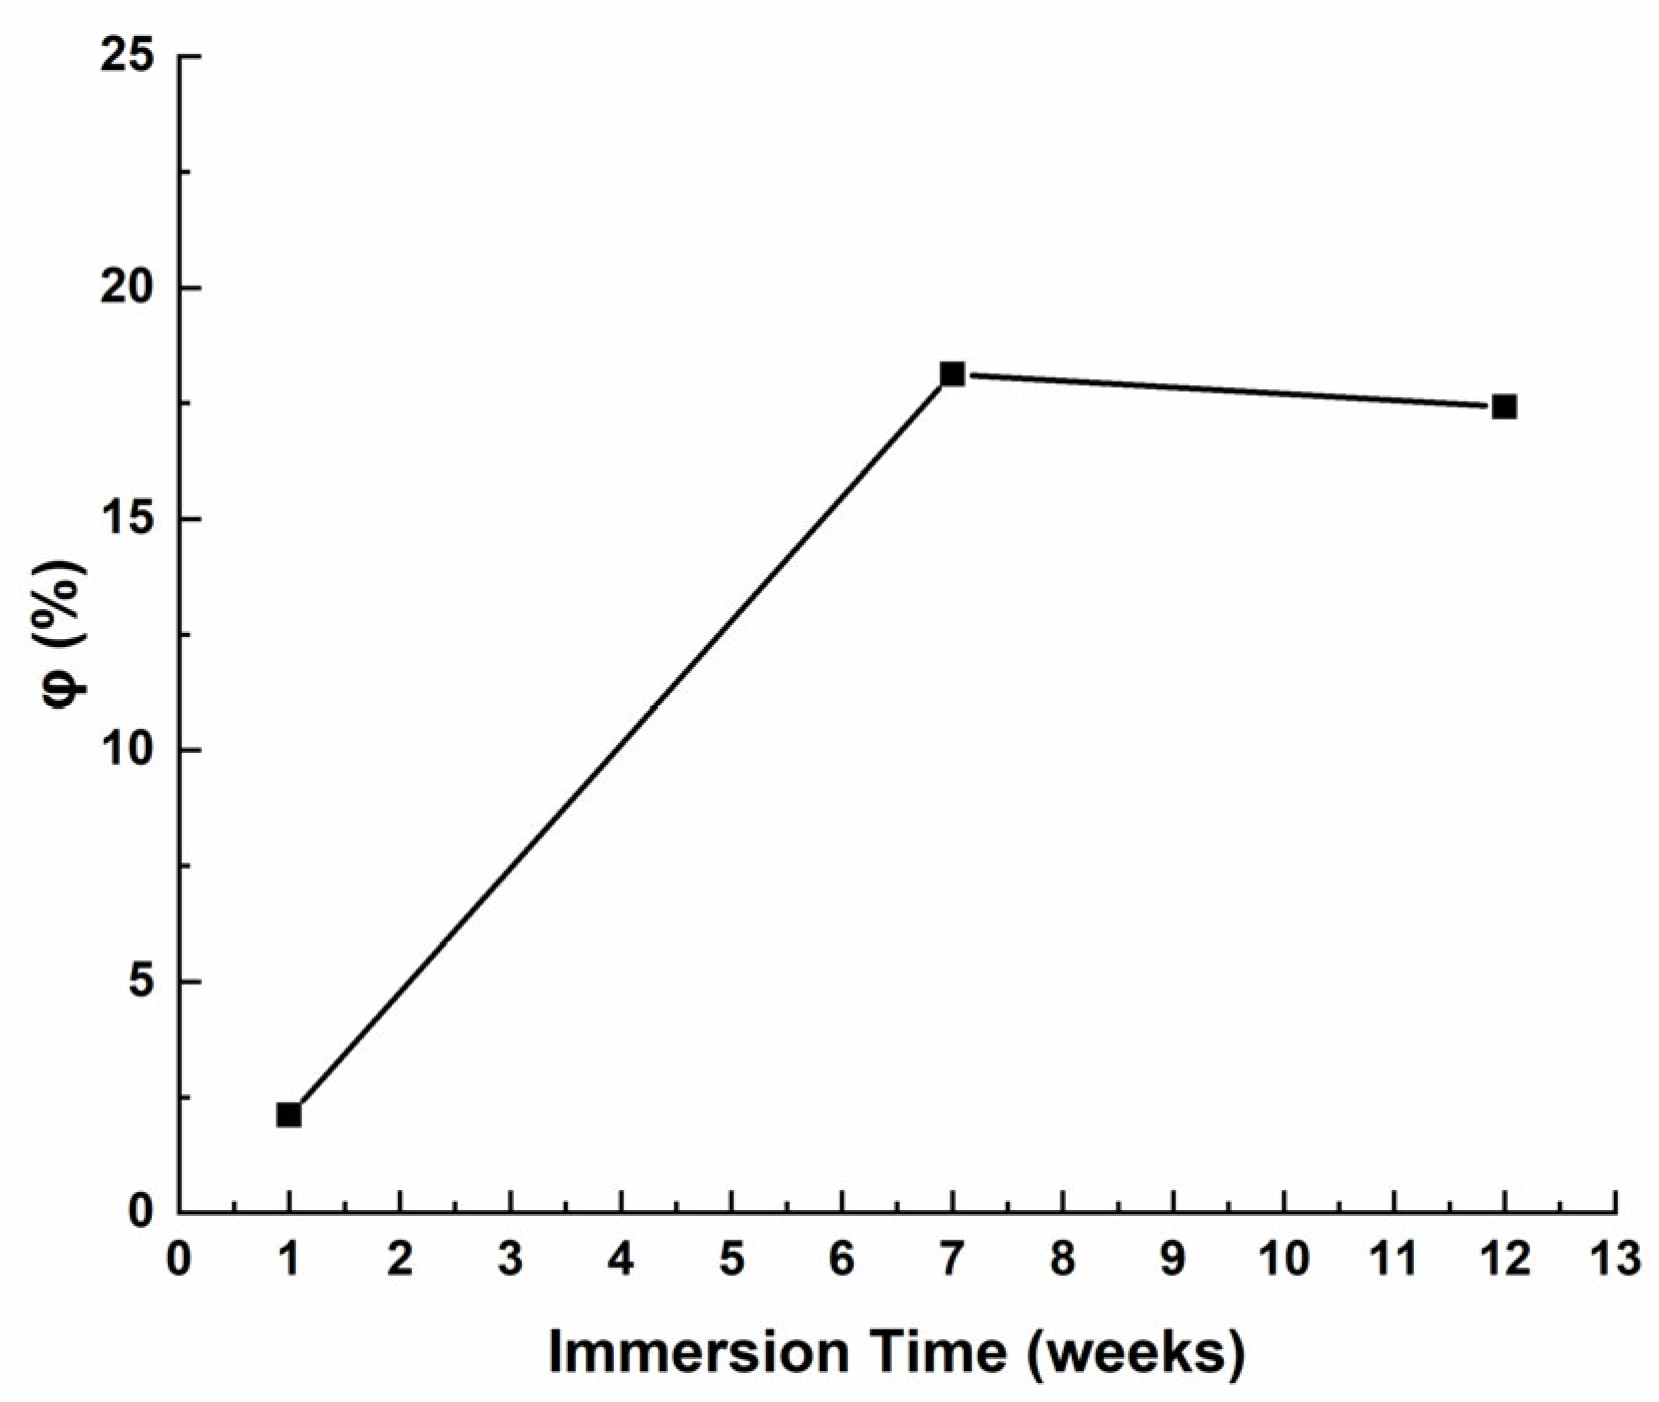
3.2.3. Electrochemical Impedance Spectroscopy (EIS) Tests

The corrosion behaviors of steel samples with antifouling coatings in artificial seawater were examined using electrochemical impedance spectroscopy at open circuit potential, as illustrated in the Nyquist impedance plot (Figure 16).
The uncoated steel sample’s plot can be represented by the electrical equivalent circuit depicted in Figure 17a [22,35,36]. It comprises the electrolyte resistance (Rs), the charge transfer resistance (Rct), and the phase element (CPEdl) that represents the double layer. The Nyquist impendence plot of the coated samples can by modeled by the electrical equivalent circuit shown in Figure 17b [23,35,36]. It consists of the electrolyte resistance (Rs), the charge transfer resistance (Rct), the double layer capacitance (CPEdl), the coating capacitance (CPEc), and the coating resistance (Rc). The parameter values for the optimal fit of the experimental impedance plots (Figure 16) for uncoated and coated steel samples are presented in Table 2.
The coating resistance RC and the constant phase element CPEC are critical factors for assessing the protective efficacy of coatings. The non-monotonic variations in RC and CPEC values in Table 2 with increasing immersion time in ASW indicate the effective barrier properties of the antifouling coating against corrosion. Specifically, whereas the value of RC is elevated after one week of immersion in ASW, it subsequently diminishes until the immersion duration reaches 7 weeks, signifying the diffusion of the electrolyte into the coatings. Integrating the aforementioned data with the rise in CPEC over this timeframe elucidates that the corrosion protection of the antifouling coating diminishes. For the steel substrate, a behavior of steadily declining corrosion resistance would obviously have disastrous results. Nonetheless, from the seventh to the twelfth week of immersion in ASW, the value of RC rises, signifying a reduction in the formation of electrolyte pathways within the coating composite and, consequently, an augmentation in the quantity of electrolyte solution retained on the coating’s surface. The reduction in CPEC at 12 weeks of ASW validates the diminished electrolyte absorption by the coating, hence indicating the excellent corrosion prevention characteristics of the antifouling coating.
The analysis of Rct value variations reveals an increase of around 15 times compared to the uncoated sample. The persistent rise in Rct signifies the excellent protection provided by the coating against metal corrosion. The significant reduction in double-layer capacitance values in the coated sample (from 797 μF/cm2 to 0.468 μF/cm2) signifies a diminished likelihood of corrosion at the coating/steel interface, implying that the electrochemical charge transfer process of the antifouling coating is highly impeded under the examined conditions.
Figure 18 displays a SEM picture illustrating the corrosion features of the samples for each immersion duration in ASW. The SEM micrograph of the uncoated substrate, after immersion in ASW solution, exhibits a consistent cracked corrosion layer (Figure 18a). The general corrosion is identified by the presence of flocculent precipitates uniformly distributed across the sample’s surface (Figure 18e). The antifouling coating exhibits a homogenous and consistently distributed layer on the surface of the naval steel, devoid of discontinuities or cracks (Figure 18f–h). After the coated sample was immersed for one week in ASW, its morphologies exhibited significant differences (Figure 18b). No significant rusting is evident in Figure 18b. The precipitates occupy a minimal area and are distributed sporadically across the sample’s surface. Surface depressions/pits (Figure 18f) were noted; however, the surface remained safeguarded relative to the uncoated substrate, so validating the coating’s capacity for protection in maritime conditions. The coated samples exhibit discernible tiny pits in their surface morphology following electrochemical corrosion tests conducted over a 7-week immersion period (Figure 18c,g), although they remain safeguarded in comparison to the uncoated substrate (Figure 18e). The pit corrosion was minimal after 7 weeks and progressively intensified during the remaining 12 weeks of immersion (Figure 18d,h). Nonetheless, aside from the superficial modification of the topographic relief, the coating remains dense and consistent with the metallic substrate (Figure 18h). The lack of cracks or indentations, suggesting capillary phenomena, in all the covered samples affirms the excellent barrier properties of the antifouling paint. As the thickness of the aqueous resin diminishes, a more safeguarded surface is exposed, inhibiting substrate corrosion.
The coating thickness was estimated using the SEM cross-sectional images. The documented thickness value represents the mean of 15 measurements. The initial coating thickness was measured at (112.3 ± 3.2) μm, and further electrochemical corrosion studies yielded estimates of (112.1 ± 3.0) μm, (111.7 ± 3.4) μm, and (88.3 ± 8.2) μm after 1, 7, and 12 weeks of immersion, respectively.
Analysis of the corrosion products’ chemical composition via XRD (Figure 19) revealed that the samples’ surfaces initially exhibited magnetite; however, with prolonged immersion in seawater, the corrosion precipitates transitioned to lepidocrocite (γ-FeO(OH)) and, after 12 weeks, to goethite (α-FeO(OH)).
It is important to emphasize that, in instances of electrochemical corrosion in artificial seawater, a corrosion layer between the steel and the coating is nonexistent, further validating the exceptional barrier properties of the antifouling coating even after 12 weeks in ASW.

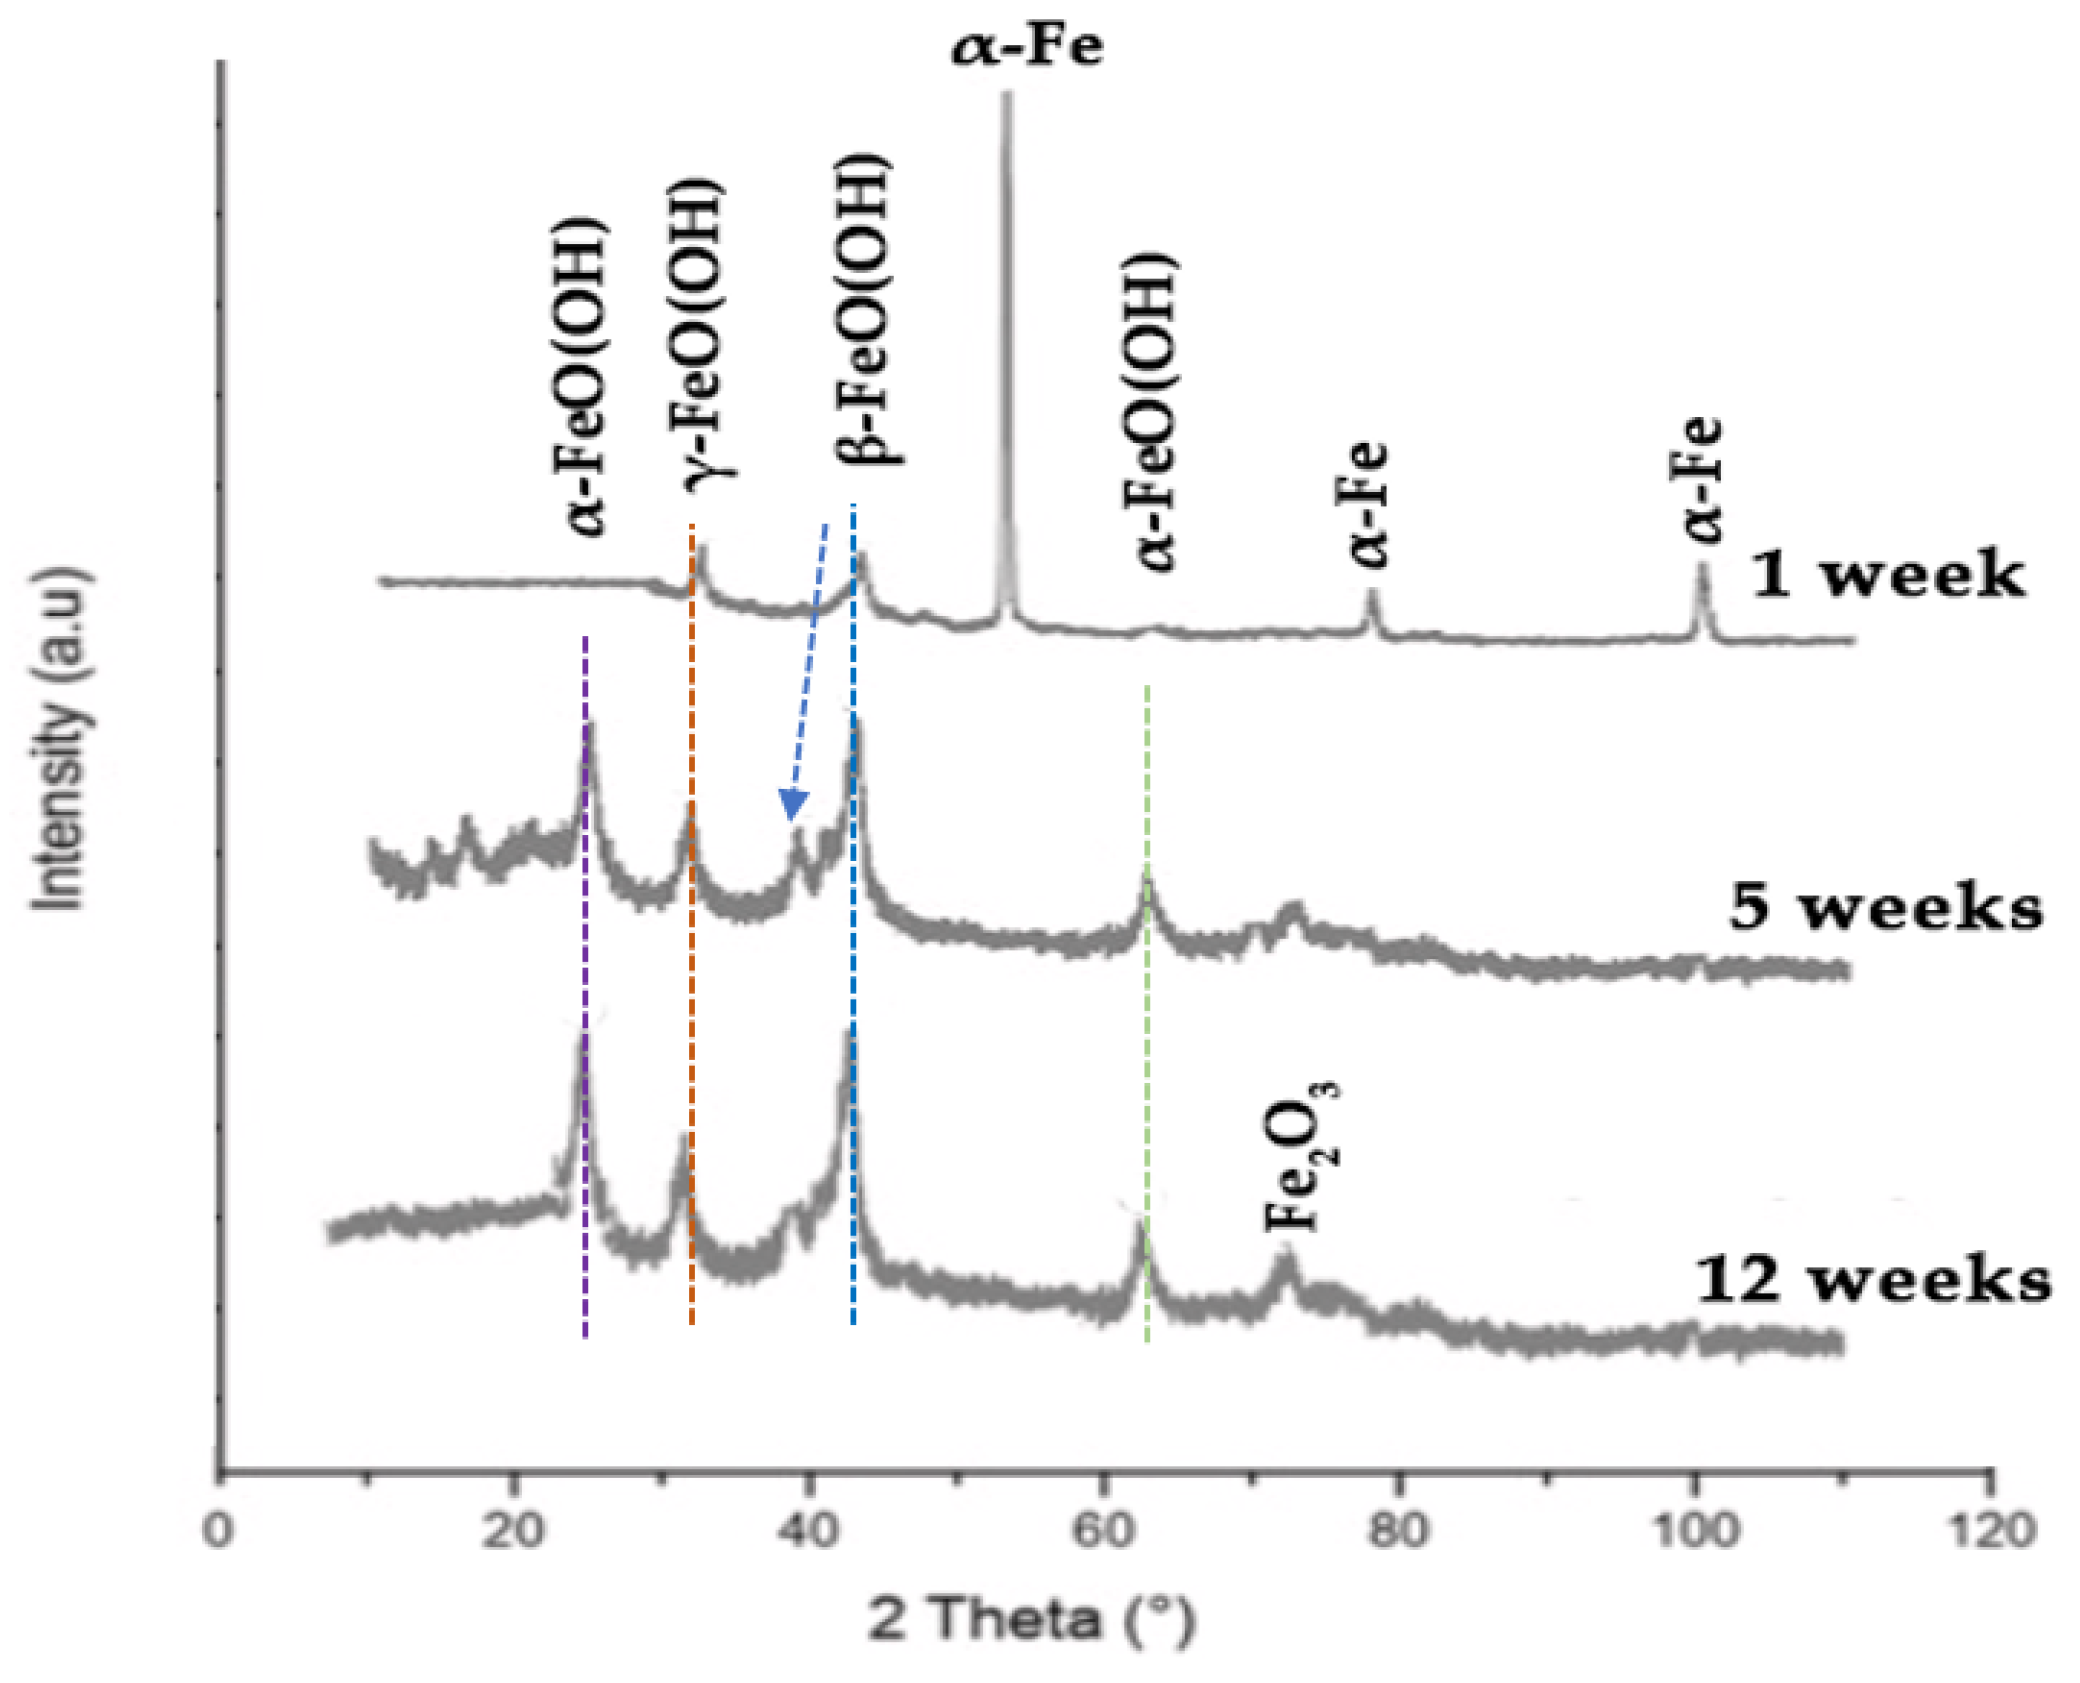
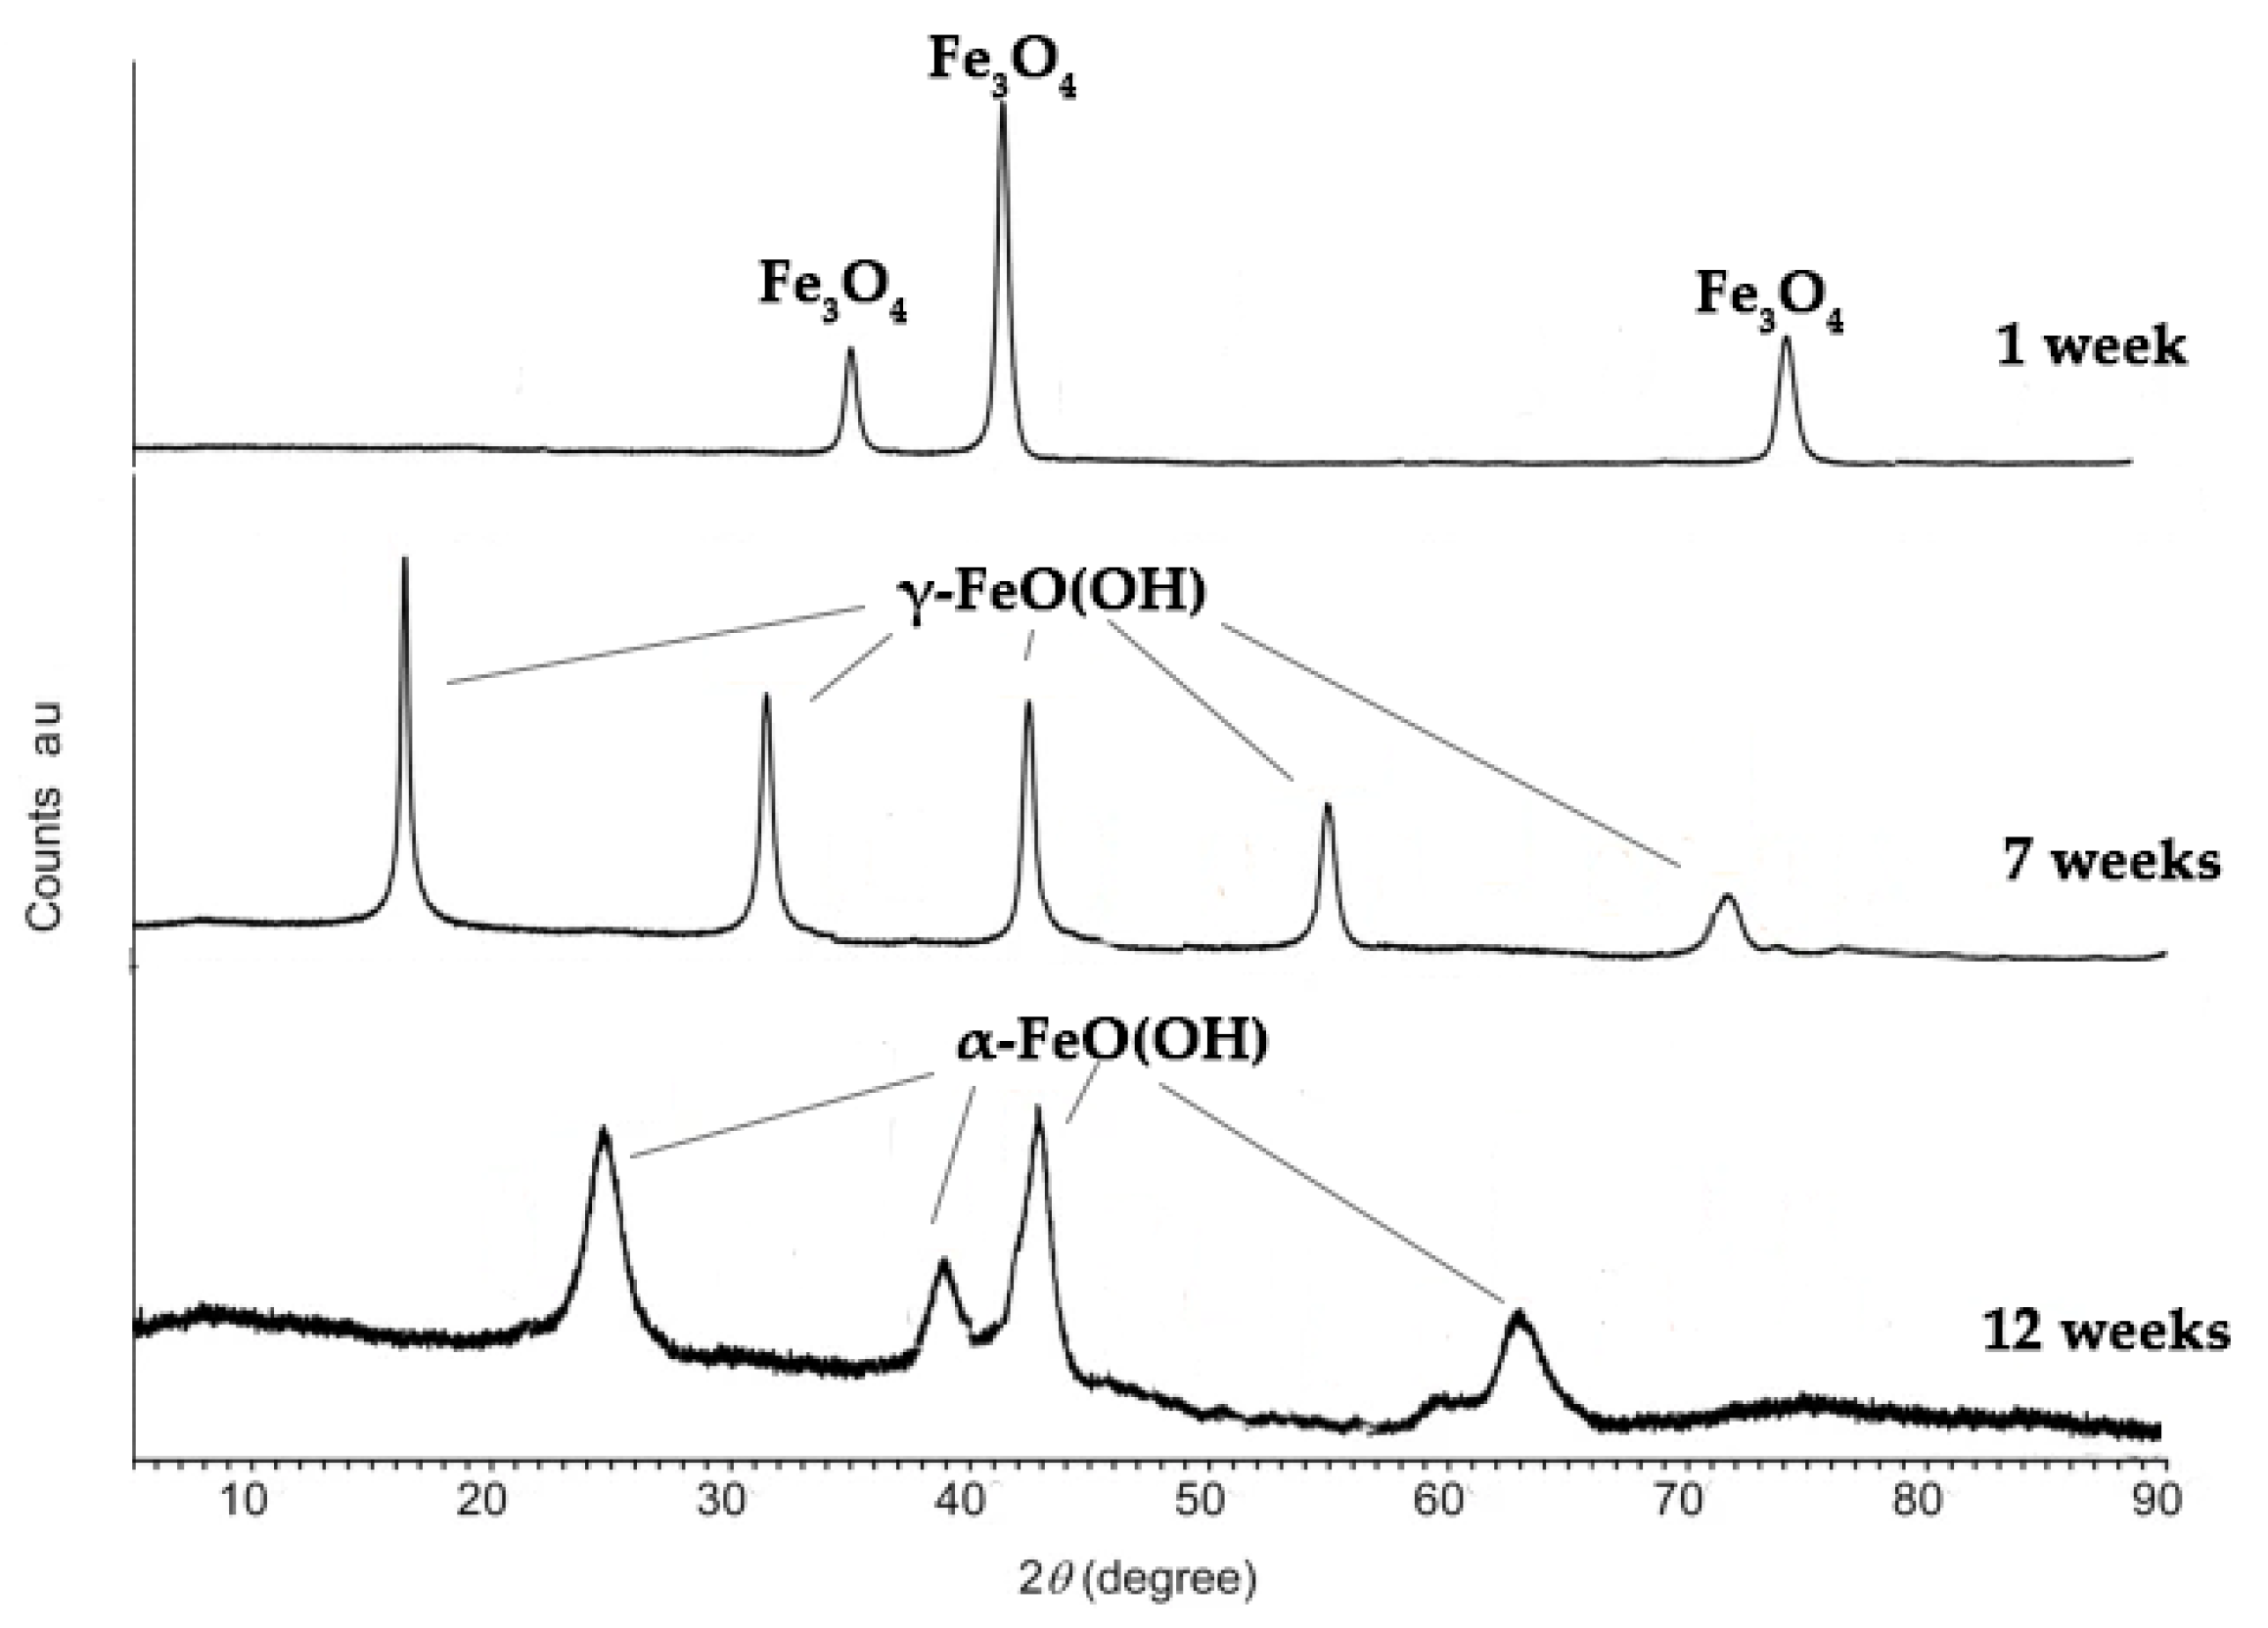
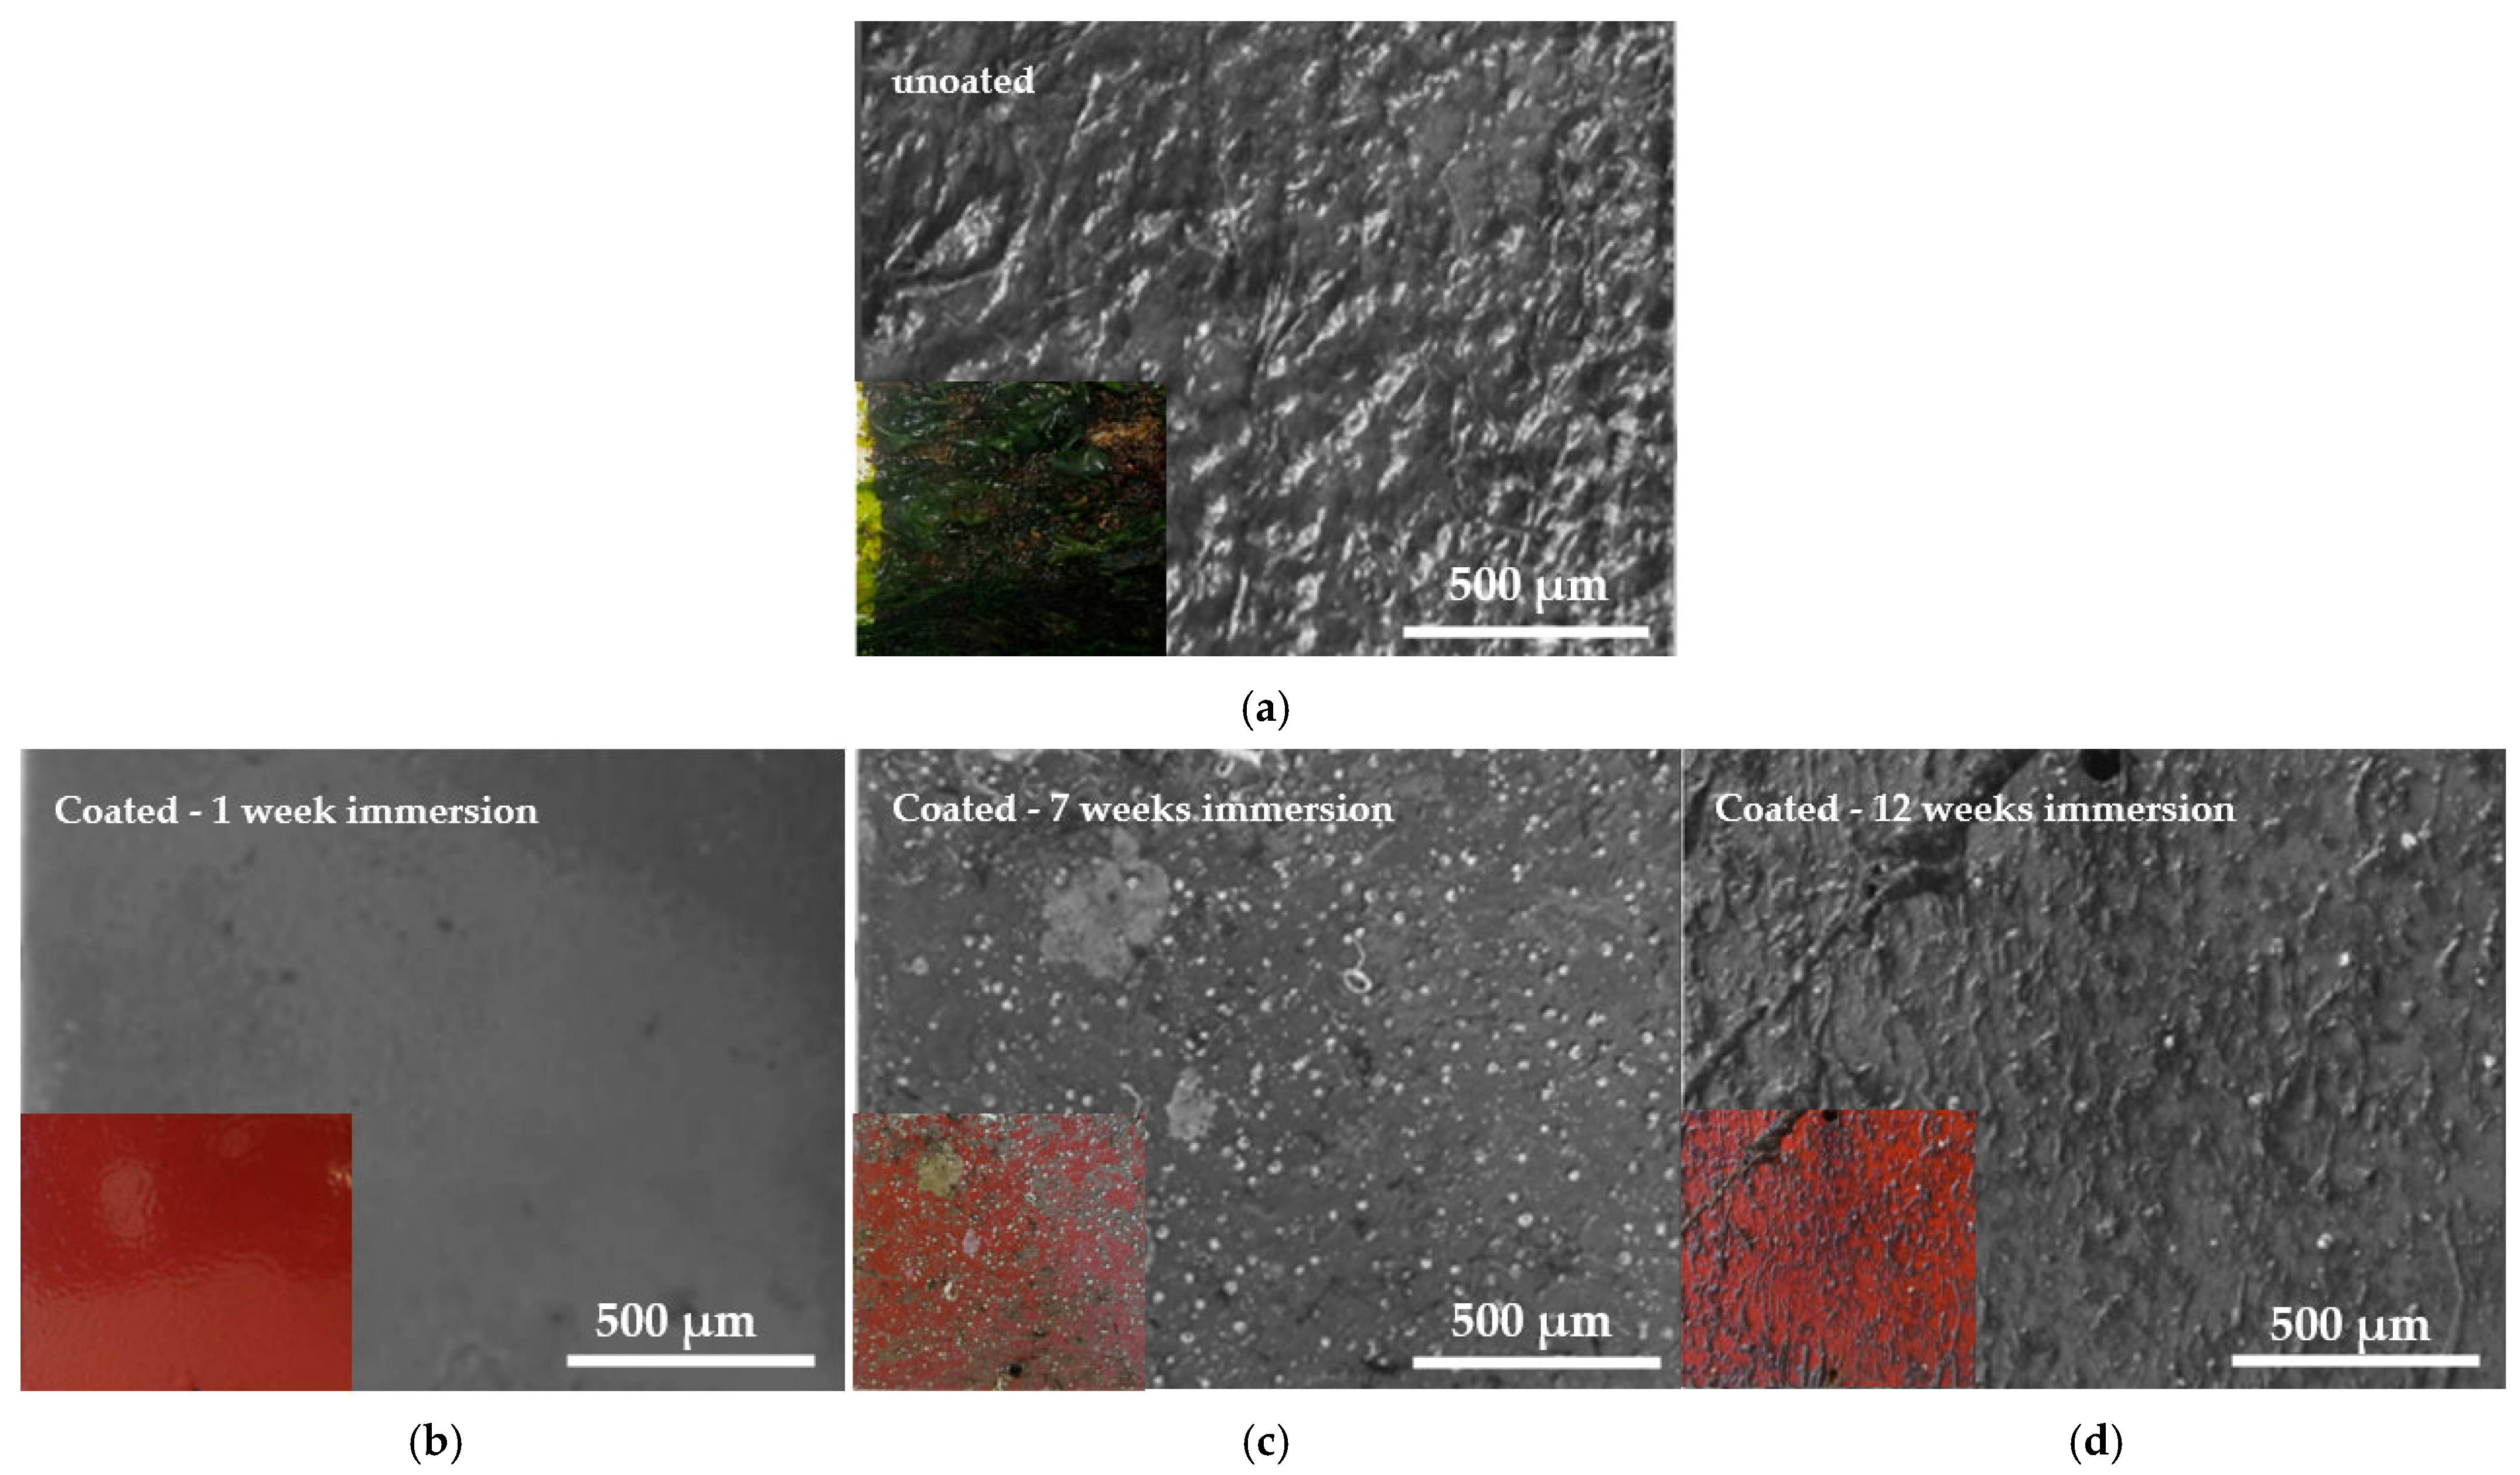
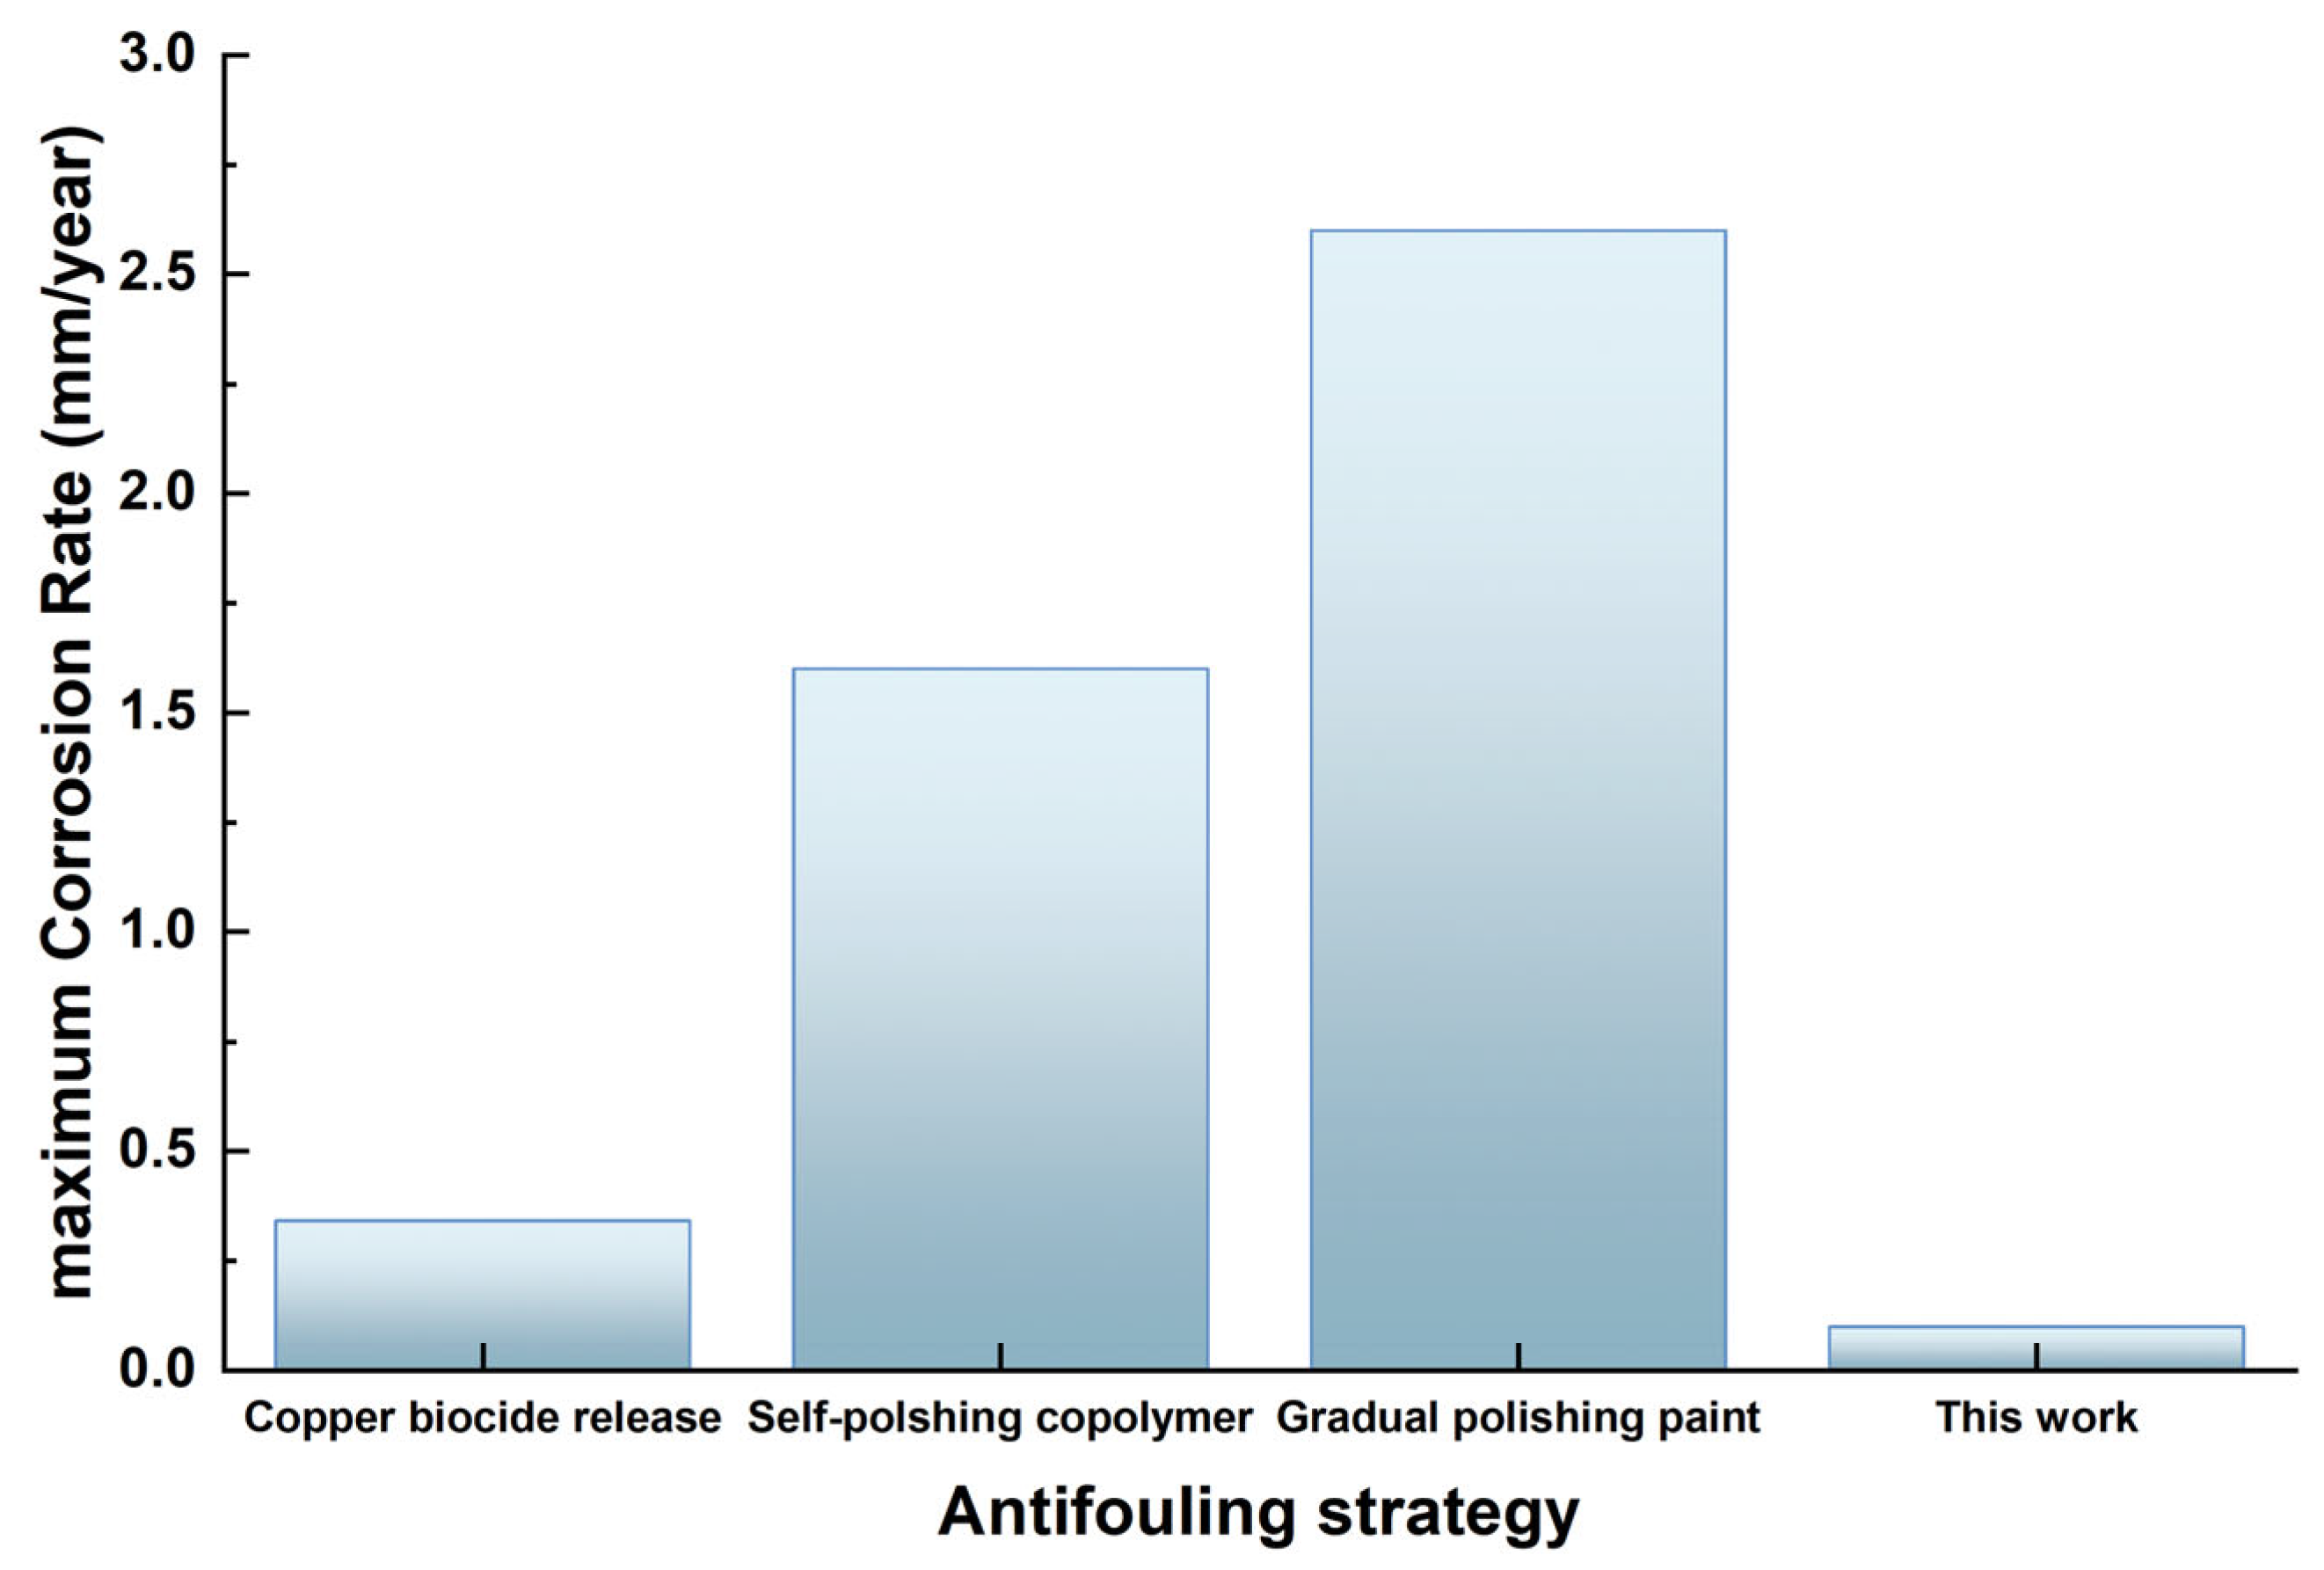
3.3. On-Site Immersion of Steels in Real Seawater

Following several days of exposure in the Rafina coast area (Figure 5), the composition and volume fraction of the biofilm varied among the coated steel samples (Figure 20 and Figure 21). An increase in the fouled surface area is evident as a result of the samples remaining in seawater; however the percentage of precipitates varied (Figure 21).
With the exception of the one-week immersed steel sample (Figure 20b), all the other steel substrates showed micro- and macro-organism deposits (Figure 21). After 7 weeks of immersion, the surface showed biofilm and bryozoan deposits (Figure 20c). At 12 weeks in seawater, the percentage of the primary micro-organism smear increased significantly, while covering a larger surface area of the steel substrate (Figure 20d). In contrast to the uncoated sample, which exhibited biofouling characterized by calcareous shells, bryozoans, tunicates, and biofilms with a coverage rate of 100% (Figure 20a), the coated samples demonstrated excellent antifouling properties, as the percentage of the fouled surface coverage did not surpass 42% even after 12 weeks of exposure to severe natural seawater conditions.
The imaging and analysis of the biofilm, along with the examination of its structure and composition, constitutes a further investigation employing confocal microscopy. Suitable fluorescent markers are employed to delineate the distribution of extracellular polymers, cells, and biofilm constituents. This will significantly aid in comprehending biofilms’ growth and will substantially enhance the development of antifouling protection.
The evaluation of biofouling in the retrieved samples was conducted by determining the Foul Resistance (FR) and the Physical Data Rating (PDR) in accordance with the standards established in ASTM D 3623 [37] and ASTM D 6990 [38]. The Overall Performance (OP) score was the minimum value between the values of FR and the PDR (Table 3).
Table 3 illustrates that the uncoated specimen experienced significant biofouling adherence, resulting in a reduction in the FR index to around 6%. The coated specimens show the maximum value of physical damage, indicating that after cleaning the macrofoulants, no residual calcareous shells remained on the coated steel, nor were any paint excavation phenomena evident. Given that an effective antifouling system is designated with an OP value exceeding 80%, it is evident that the biocide-free antifouling coating is deemed enough for the antifouling protection of naval steels.

4. Discussion

Water condensation on solid/metallic surfaces is a universal phenomenon that plays an essential role in many interfacial phenomena, such as corrosion [39]. The corrosion of naval steel in the aqueous environment of the ASW occurs because of an irreversible oxidation–reduction reaction between the iron and an oxidizing agent (either solvated protons (H+(aq)) or dissolved oxygen (O2)) that is present in the environment (Fe + 2H+ → Fe2+ + H2) [40]. The oxidation of the metal clearly entails the reduction of the oxidizing agent [41]. The oxidation–reduction process of iron in the presence of seawater can be divided into two parts: an oxidation reaction (Fe → Fe2+ + 2e) and a reduction reaction (2H+ +2e → H2). The presence or absence of dissolved oxygen results in distinct electrochemical responses [42]. Pourbaix diagrams, which utilize chemical kinetics and thermodynamics, can provide valuable insights into the corrosion of iron alloys in aqueous solutions. These diagrams reveal the equilibria between iron, its oxides, and hydroxides, as well as the potential corrosion reactions and the eventual formation of compounds that occur during the corrosion process [42,43]. Research on the development of steel corrosion products in saltwater has identified a quite intricate series of events that control the presence and synthesis of corrosion products in water solutions. This process begins with the creation of iron ions (Fe2+) [44]. When oxygen levels are high and the pH is less than 6, iron ions stay dissolved in the solution and react to generate iron hydroxide (FeOH+). The synthesis of lepidocrocite (γ-FeO(OH)) occurs when the oxidation rate of FeOH+ is rapid, whereas a sluggish oxidation rate leads to the creation of magnetite (Fe3O4) [40,45]. Magnetite is a phase that remains stable under thermodynamic conditions. However, when iron is present in an oxidation state ranging from +II to +III, it can transform into magnemite (γ-Fe2O3) at a higher level of iron oxidation [46,47]. The reoxidation of magnetite results in the creation of lepidocrocite [41]. The γ-FeO(OH) can undergo a transformation into thermodynamically unstable phases such as γ-Fe2O3, amorphous iron oxyhydroxide (FeOx(OH)3−2x), or ferrihydride (FeOOH, n H2O)). These unstable phases, due to their poor crystallization, eventually convert into the more stable polymorph of α-FeO(OH) [40,45,46,48].
In the instance of naval steel samples coated with the antifouling coating, corrosion products do not manifest at the steel/coating interface but are minimally retained at the coating/electrolyte (ASW) interface. This illustrates the superior barrier properties of the antifouling coating for steel, devoid of priming, as seen in traditional commercial antifouling paints [49].
The experimental findings of this study demonstrate that the antifouling coating serves as a corrosion-protective layer on naval steel in artificial seawater solution. After 12 weeks of static exposure in both artificial (Figure 10) and natural seawater (Figure 20), the coating retains its adhesion to the steel substrate, exhibiting no porosity within its thickness or delamination on its surface. The absence of porosity in the coating (Figure 10, Figure 14 and Figure 18) improves corrosion prevention efficacy by over 60% compared to the uncoated specimen in corrosion potentiodynamic tests. Although this percentage may appear modest, it is noteworthy that, unlike other corrosion-resistant coatings, there is no primer layer or top coat between the steel and the antifouling coating to enhance adhesion and support the coating’s corrosion resistance [50,51,52].
The alteration of the corrosion potential to a noble value (−1.684 V vs. SCE) relative to the uncoated surface (Figure 13, Table 1) is a major result of the hydrophobic coating’s corrosion protection, as it signifies the restriction of corrosive species’ diffusion to the underlying substrate. This transition in potential towards more virtuous qualities is regarded as an anodic protection. Moreover, reduced corrosion current values, coupled with more positive corrosion potentials, signify enhance corrosion resistance.
The corrosion rate for each immersion duration in ASW can be determined from the instantaneous corrosion current densities (in mm/year) using Equation (2) [53].
CR   ( mm / year ) = K 1 · I C O R R   c o a t e d ρ ·   E W
where K1 is a constant (3.27 mm·g/mA·cm·year), ρ denotes the density of naval steel (7.85 g/cm3), and EW represents the equivalent weight (27.92 g/eq by assuming n = 2 for iron oxidation). The calculations indicate that the corrosion rate of untreated naval steel is 267.61 × 10⁻³ mm/year, but the coated specimens, after 12 weeks of exposure, exhibit a corrosion rate almost three times lower at 87.46 × 10⁻³ mm/year. The corrosion rates after one and seven weeks of immersion in artificial seawater are 46.87 × 10⁻³ mm/year and 98.74 × 10⁻³ mm/year, respectively, both significantly lower than those of the uncoated steel. The antifouling layer evidently provides corrosion protection as well.
The incorporation of PAni and GO in the antifouling coating forms a conductive polymer [54,55,56] that facilitates electron transfer from the steel to the oxygen in seawater [57,58,59,60,61,62]. This reaction results in the development of a passive oxide layer at the coating/steel interface, which decreases the corrosion rate and elevates the Ecorr to more positive values (Figure 13, Table 1). The potentiodynamic polarization tests for the coated steel indicate a shift of Ecorr to a more positive value (0.117 V) (Table 1) and a nearly 35-fold decrease in the corrosion rate. The increase in Ecorr by 0.117 V vs. SCE signifies the protecting of the naval steel surface by the coating layer. Consequently, the protective efficacy of the coating layer appears to be associated with its passivation properties and barrier function.
EIS is a non-destructive technique that characterizes the organic coatings and assesses the interfacial metallic response beneath the coating. The EIS results reveal that the impedance parameters related to the interface of the antifouling paint and steel (Rct και CPEdl) exhibit analogous behavior, which also yields significant insights into the possible adhesion of corrosion products.
Figure 22 illustrates that the Rct value of the antifouling paint is approximately 145 times more than that of the uncoated naval steel, signifying that the coating effectively inhibits water absorption and exhibits corrosion resistance. In the initial 7 weeks of electrochemical corrosion, the corrosion products do not affect the antifouling coating’s surface, resulting in a rise in Rct resistance from 91.32 × 10³ to 241.70 × 10³ Ω · cm2. This signifies the antifouling coating’s effective barrier function against corrosion. Following 12 weeks of exposure to ASW, a marginal reduction of approximately 4% in the Rct value is noted, attributable to the partial reduction of the coating layer and the enhancement of surface roughness, without the coating exhibiting porosity, as demonstrated by the SEM images of the vertical cross-section of the coated samples.
The elevation in coating resistance (Rc) during prolonged ASW immersion durations signifies that the corrosion rate of the steel was minimal during this period. The resistance value closely resembles its counterpart at the early stages of corrosion, indicating that corrosion agents cannot infiltrate the coating.
The double-layer capacitance value (CPEdl) in the coated naval steel sample decreases by approximately 1700 times, indicating the advantageous anticorrosive properties provided by the antifouling coating on the steel (Figure 23). The rise in CPEdl by the seventh week of immersion is attributable to the decrease in double-layer thickness [63]. The decrease in double-layer thickness, resulting from the solubilization of the water-soluble resin and the consequent removal of the antifouling coating, leads to a reduction in the CPEdl value from 2.94 µF/cm2 to 2.21 µF/cm2, as any corrosion products previously deposited on the coating are eliminated. The examination of the variation in antifouling coating capacity indicates an initial rise in CPEc during the early phase of the immersion, succeeded by a gradual decline towards the conclusion of the experiment (12 weeks) (Figure 23).
The value of CPEc correlates with the volume percentage of water uptake (φ), as water uptake is a critical measure for assessing the durability of organic coatings [64]. The volume fraction of water can be determined using Equation (3), introduced in 1954 by Brasher and Kingsbury [65], which is founded on Hartshorn’s original work [66].
φ = 100 · log C t / C 0 log 80
where Ct represents the measured capacity of the coated sample at any time t, C0 denotes the measured capacity of the coated sample at time zero (1.03 × 10⁻⁶ F/cm2), and 80 indicates the water permeability at 25 °C.
Figure 24 displays the results of the calculations. The water permeation in the coating remains minimal for up to 12 weeks of immersion, indicating that the antifouling paint effectively resists water absorption and exhibits corrosion resistance.
The anti-corrosion efficacy of the antifouling coating was assessed by evaluating the performance of various commercial antifouling coatings generated through different antifouling approaches/strategies. As a result, samples of naval steel were coated with commercially available antifouling coatings in Greece. The coatings were subsequently subjected to laboratory corrosion testing in a 3.5% NaCl solution to further investigate the coatings’ anti-corrosion efficacy [14]. Figure 25 compares the antifouling coating’s corrosion rate (CR) to that of other antifouling coatings marketed in Greece.
The aforementioned comparison validates the excellent corrosion resistance of the coating. It is important to highlight that the coated samples employing commercial antifouling coatings were larger than those in the present study, and the immersion procedure occurred at different intervals.
The results obtained under in situ immersion conditions indicate that the coating serves as an efficient barrier with negligible permeability to the steel surface. The coated samples exhibit an enhancement in the Foul Resistance parameter from 6% to 98% following 12 weeks in natural saltwater. Indeed, following an extended multi-week duration, no traces of calcareous shells or paint loss were detected when the surface was rinsed with water. Therefore, the fouling protection efficacy of the coating demonstrates remarkable durability for naval steel over an extended duration. The efficient antifouling system, with an OP value exceeding 80%, indicates that the biocide-free coating is sufficient for the antifouling protection of naval steels.
The results indicate that the antifouling coating exhibits superior antifouling efficacy and corrosion resistance. However, evaluating the long-term efficacy of the antifouling coating under adverse sea conditions is crucial, as an inadequate broad-spectrum performance may become evident. Extensive field assessments under diverse water, temperature, and pH conditions are crucial for assessing the coating’s degradation over time. The imaging of the biofilm, coupled with structural analysis and chemical composition examination via confocal microscopy, will significantly enhance the comprehension of biofilm growth and improve the synthesis methodology of the antifouling coating.
Equally significant is the necessity for a comprehensive investigation into the long-term efficacy of the coating in corrosive settings. Comprehending the dissolution mechanism of the antifouling coating resin in the aqueous marine environment is essential, as it significantly impacts the Overall Performance and longevity of the antifouling coating. The utilization of standardized methods, such as ISO 2812-2:2018 [67], will objectively assess the stability of the resin and its resistance to dissolution, so confirming or refuting the long-term high performance of the coating.
Furthermore, the intricacy of the coating system’s production must be alleviated to guarantee that the refining system’s production remains efficient and cost-effective. Verification of adherence to stringent environmental safety requirements is essential to mitigate any long-term ecological repercussions.

5. Conclusions

Organic coatings are extensively employed to mitigate the corrosion of metal substrates, and numerous initiatives have been undertaken to assess their efficacy in both natural and artificial corrosion conditions.
This study demonstrates that this antifouling coating serves as a corrosion-protective layer on naval steel in artificial seawater solution. Following 12 weeks of static exposure, the coating maintains its adhesion to the steel substrate, displaying no porosity throughout its thickness or delamination on its surface. The lack of porosity in the coating enhances corrosion resistance by more than 60% relative to the uncoated specimen in corrosion potentiodynamic assessments. The antifouling coating’s corrosion protection yields diminished corrosion current values and elevated corrosion potentials, indicating improved corrosion resistance.
The integration of PAni and GO in the antifouling coating creates a conductive polymer that enables electron transmission from the steel to the oxygen in saltwater. This reaction leads to the formation of a passive oxide layer at the coating/steel interface, which reduces the corrosion rate and increases the ECORR to more positive values.
The EIS study reveals that the impedance parameters related to the interface of the antifouling paint and steel (Rct και CPEdl) demonstrate similar behavior, providing valuable insights into the potential adherence of corrosion products. The Rct value of the antifouling paint is roughly 145 times greater than that of untreated naval steel, indicating that the coating efficiently prevents water absorption and demonstrates corrosion resistance. The double-layer capacitance value (CPEdl) in the coated naval steel sample is diminished by almost 1700 times, demonstrating the beneficial anticorrosive capabilities conferred by the antifouling coating on the steel.
The comparison of the anti-corrosion properties of the antifouling coating against commercial antifouling coatings demonstrated superior corrosion resistance, with no calcareous deposits or paint degradation seen after 12 weeks in natural saltwater. The biocide-free coating functions as an effective barrier with low permeability to the steel surface, exhibiting remarkable endurance for naval steel over a prolonged period.
However, evaluating its long-term efficacy under adverse sea conditions is crucial. Extensive field assessments under various conditions are necessary to assess the coating’s degradation over time. Imaging biofilms, structural analysis, and chemical composition examination via confocal microscopy can improve the synthesis methodology of the antifouling coating. Furthermore, a comprehensive investigation into the long-term efficacy of the coating in corrosive settings is essential. Standardized methods like ISO 2812-2:2018 can objectively assess the resin’s stability and resistance to dissolution. The intricacy of the coating system’s production must be reduced to ensure efficient and cost-effective refining. Ensuring adherence to stringent environmental safety requirements is also essential to mitigate long-term ecological repercussions.

6. Patents

There is one patent resulting from the work reported in this manuscript: WO2024224120A1, Electrically anisotropic antifouling coatings, BFP Advanced Technologies, 2024.

Author Contributions

Conceptualization, P.V. and N.D.P.; methodology, P.V. and N.D.P.; investigation, P.V.; data curation, P.P.F. and P.V.; writing—original draft preparation, P.V. and P.P.F.; supervision, N.D.P.; project administration, P.V. and N.D.P.; funding acquisition, N.D.P. All authors have read and agreed to the published version of the manuscript.

Funding

This research has been co-financed by the European Regional Development Fund of the European Union and Greek national funds through the Operational Program Competitiveness, Entrepreneurship, and Innovation, under the title RESEARCH—CREATE—INNOVATE (project code: T2EDK-00868).

Institutional Review Board Statement

Not applicable.

Informed Consent Statement

Not applicable.

Data Availability Statement

Data are contained within the article.

Acknowledgments

The authors acknowledge precious help and technical assistance from colleagues working on nanotechnology processes for the solar energy conversion and environmental protection lab of INN/NCSRD.

Conflicts of Interest

The authors declare no conflicts of interest.

Abbreviations

The following abbreviations are used in this manuscript:
AFantifouling
TBTtributyltin
GOgraphene oxide
PAnipolyaniline
NPsnanoparticles
DMFdimethylformamide
ASWartificial seawater
SEMscanning electron microscopy
TEMtransmission electron microscopy
EISelectrochemical impedance spectroscopy
PDPpotentiodynamic polarization
OCPopen circuit potential
REreference electrode
CEcounter electrode
WEworking electrode
SAEDSelected Area Electron Diffraction
ncorrosion inhibition efficiency
Rselectrolyte resistance
Rctcharge transfer resistance
CPEdlDouble-layer capacitive phase element
CPEccoating capacitance
Rccoating resistance
FRFoul Resistance
PDRPhysical Data Rating
OPOverall Performance
ECORRcorrosion potential
ICORRcorrosion current density
βaanodic Tafel slope
βccathodic Tafel slope
CRcorrosion rate
φvolume percentage of water uptake

References

  1. Jalaie, A.; Afshaar, A.; Mousavi, S.B.; Heidari, M. Investigation of the Release Rate of Biocide and Corrosion Resistance of Vinyl-, Acrylic-, and Epoxy-Based Antifouling Paints on Steel in Marine Infrastructures. Polymers 2023, 15, 3948. [Google Scholar] [CrossRef] [PubMed]
  2. Shi, X.; Liang, H.; Li, Y. Review of Progress in Marine Anti-Fouling Coatings: Manufacturing Techniques and Copper- and Silver-Doped Antifouling Coatings. Coatings 2024, 14, 1454. [Google Scholar] [CrossRef]
  3. Lloyd, G. Rules for Classification and Construction, In Ship Technology; Bulgarian Register of Shipping: Varna, Bulgaria, 2012. [Google Scholar]
  4. Chasse, K.R.; Scardino, A.J.; Swain, G.W. Corrosion and Fouling Study of Copper-Based Antifouling Coatings on 5083 Aluminum Alloy. Prog. Org. Coat. 2020, 141, 105555. [Google Scholar] [CrossRef]
  5. Castelli, F.; Delucchi, M.; Valenza, F.; Garaventa, F.; Faimali, M.; Turturro, T.; Benedetti, A. Behavior of Biocide-Free Foul Control Paints for Ships’ Hulls in the Immediate Proximity of ICCP Anodes. J. Coat. Technol. Res. 2024, 21, 383–399. [Google Scholar] [CrossRef]
  6. Liang, H.; Shi, X.; Li, Y. Technologies in Marine Antifouling and Anti-Corrosion Coatings: A Comprehensive Review. Coatings 2024, 14, 1487. [Google Scholar] [CrossRef]
  7. Kanthasamy, R.; Algarni, M.; Peng, L.C.; Zakaria, N.A.; Zwawi, M. The Effects of Solvent on Superhydrophobic Polyurethane Coating Incorporated with Hydrophilic SiO2 Nanoparticles as Antifouling Paint. Polymers 2023, 15, 1328. [Google Scholar] [CrossRef] [PubMed]
  8. Li, L.; Hong, H.; Cao, J.; Yang, Y. Progress in Marine Antifouling Coatings: Current Status and Prospects. Coatings 2023, 13, 1893. [Google Scholar] [CrossRef]
  9. Kumar, A.; Mishra, V.; Negi, S.; Kar, S. A Systematic Review on Polymer-Based Superhydrophobic Coating for Preventing Biofouling Menace. J. Coat. Technol. Res. 2023, 20, 1499–1512. [Google Scholar] [CrossRef]
  10. El-Wahab, H.A.; Al-Shareef, H.F. Novel Antifouling Paint Formulation Based on Ca2Cr2O5 and CaMnO3 NPs as a Protective Pigment. Sci. Rep. 2024, 14, 24474. [Google Scholar] [CrossRef] [PubMed]
  11. Monty, J.P.; Dogan, E.; Hanson, R.; Scardino, A.J.; Ganapathisubramani, B.; Hutchins, N. An Assessment of the Ship Drag Penalty Arising from Light Calcareous Tubeworm Fouling. Biofouling 2016, 32, 451–464. [Google Scholar] [CrossRef] [PubMed]
  12. Schultz, M.P.; Bendick, J.A.; Holm, E.R.; Hertel, W.M. Economic Impact of Biofouling on a Naval Surface Ship. Biofouling 2011, 27, 87–98. [Google Scholar] [CrossRef] [PubMed]
  13. Papadopoulos, N.; Vourna, P.; Falara, P.; Vourna, P. A Modern Approach Towards Efficient Antifouling Coating Technologies. Nanotechnol. Adv. Mater. Sci. 2023, 6, 1–4. [Google Scholar] [CrossRef]
  14. Falara, P.P.; Papadopoulos, N.D.; Vourna, P. Microstructure and Performance of Antibiofouling Coatings on High-Strength Steel Substrates Immersed in the Marine Environment. Micro 2022, 2, 277–294. [Google Scholar] [CrossRef]
  15. Thomas, M.C.; Waugh, G.; Vanwonterghem, I.; Webster, N.S.; Rinke, C.; Fisher, R.; Luter, H.M.; Negri, A.P. Protecting the Invisible: Establishing Guideline Values for Copper Toxicity to Marine Microbiomes. Sci. Total Environ. 2023, 904, 166658. [Google Scholar] [CrossRef] [PubMed]
  16. Soon, Z.Y.; Jung, J.-H.; Loh, A.; Yoon, C.; Shin, D.; Kim, M. Seawater Contamination Associated with In-Water Cleaning of Ship Hulls and the Potential Risk to the Marine Environment. Mar. Pollut. Bull. 2021, 171, 112694. [Google Scholar] [CrossRef] [PubMed]
  17. Wu, S.; Wu, S.; Xing, S.; Wang, T.; Hou, J.; Zhao, Y.; Li, W. Research Progress of Marine Anti-Fouling Coatings. Coatings 2024, 14, 1227. [Google Scholar] [CrossRef]
  18. Bagley, F.; Atlar, M.; Charles, A.; Anderson, C. The Use of Copper-Based Antifoulings on Aluminium Ship Hulls. Ocean. Eng. 2015, 109, 595–602. [Google Scholar] [CrossRef]
  19. Brooks, S.; Waldock, M. The Use of Copper as a Biocide in Marine Antifouling Paints. In Advances in Marine Antifouling Coatings and Technologies; Elsevier: Amsterdam, The Netherlands, 2009; pp. 492–521. ISBN 978-1-84569-386-2. [Google Scholar]
  20. Liu, D.; Shu, H.; Zhou, J.; Bai, X.; Cao, P. Research Progress on New Environmentally Friendly Antifouling Coatings in Marine Settings: A Review. Biomimetics 2023, 8, 200. [Google Scholar] [CrossRef] [PubMed]
  21. Cao, Z.; Cao, P. Research Progress on Low-Surface-Energy Antifouling Coatings for Ship Hulls: A Review. Biomimetics 2023, 8, 502. [Google Scholar] [CrossRef] [PubMed]
  22. Yang, C.-W.; Lee, M.-L.; Liu, W.-R.; Thairiyarayar, C.B.; Liu, W.-R.; Chen, T.-Y.; Lee, C.-Y. Conductive Additives Effects on NCA–LFMP Composite Cathode in Water-Based Binder for High-Safety Lithium-Ion Batteries. Micro 2023, 3, 739–748. [Google Scholar] [CrossRef]
  23. Alshibeh Alwattar, N.; Vacandio, F.; Vassalo, L.; Djenizian, T.; Coulomb, B.; Boudenne, J.-L. Effects of Mode of Preparation of Titanium Dioxide Nanotube Arrays on Their Photocatalytic Properties: Application to p-Nitroaniline Degradation. Micro 2023, 3, 369–381. [Google Scholar] [CrossRef]
  24. Ribeiro, B.; Offoiach, R.; Monteiro, C.; Morais, M.R.G.; Martins, M.C.L.; Pêgo, A.P.; Salatin, E.; Fedrizzi, L.; Lekka, M. Electrodeposition of Zn and Cu Nanoparticles into TiO2 Nanotubes on Ti6Al4V: Antimicrobial Effect against S. Epidermidis and Cytotoxicity Assessment. Micro 2024, 4, 97–116. [Google Scholar] [CrossRef]
  25. Whitehead, K.A.; Brown, M.; Caballero, L.; Lynch, S.; Edge, M.; Hill, C.; Verran, J.; Allen, N.S. Nano-Titania Photocatalysis and Metal Doping to Deter Fungal Growth on Outdoor and Indoor Paint Surfaces Using UV and Fluorescent Light. Micro 2025, 5, 5. [Google Scholar] [CrossRef]
  26. Vourna, P.; Papadopoulos, N.D.; Falara, P.P.; Hristoforou, E. Barkhausen Noise Emission of Naval Steel: The Impact of Seawater Corrosion Coverage and Depth. NDT E Int. 2025, 151, 103319. [Google Scholar] [CrossRef]
  27. Committee D-19. D 1141-52 Standard Specifications for Substitute Ocean Water. In Manual on Industrial Water and Industrial Waste Water; ASTM: West Conshohocken, PA, USA, 1960; pp. 398–399. ISBN 978-0-8031-6884-8. [Google Scholar]
  28. ASTM G31-21; Standard Practice for Laboratory Immersion Corrosion Testing of Metals. ASTM: West Conshohocken, PA, USA, 2004.
  29. IMAGE-PRO® DISCOVERY: The Enhanced Image Analysis Solution from the Image-Pro Family; Media Cybernetics: Rockville, MD, USA, 2020.
  30. Criado, M.; Martínez-Ramirez, S.; Bastidas, J.M. A Raman Spectroscopy Study of Steel Corrosion Products in Activated Fly Ash Mortar Containing Chlorides. Constr. Build. Mater. 2015, 96, 383–390. [Google Scholar] [CrossRef]
  31. Neff, D.; Bellot-Gurlet, L.; Dillmann, P.; Reguer, S.; Legrand, L. Raman Imaging of Ancient Rust Scales on Archaeological Iron Artefacts for Long-term Atmospheric Corrosion Mechanisms Study. J. Raman Spectrosc. 2006, 37, 1228–1237. [Google Scholar] [CrossRef]
  32. Das, S.; Hendry, M.J. Application of Raman Spectroscopy to Identify Iron Minerals Commonly Found in Mine Wastes. Chem. Geol. 2011, 290, 101–108. [Google Scholar] [CrossRef]
  33. Thibeau, R.J.; Brown, C.W.; Heidersbach, R.H. Raman Spectra of Possible Corrosion Products of Iron. Appl. Spectrosc. 1978, 32, 532–535. [Google Scholar] [CrossRef]
  34. Shi, J.; Ming, J.; Wu, M. Electrochemical Behavior and Corrosion Products of Cr-Modified Reinforcing Steels in Saturated Ca(OH)2 Solution with Chlorides. Cem. Concr. Compos. 2020, 110, 103587. [Google Scholar] [CrossRef]
  35. Zhang, H.; Kong, F.; Chen, Y.; Zhao, X.; Tang, Y.; Zuo, Y. Degradation of Two Anti-Corrosion and Anti-Fouling Coating Systems in Simulated Diurnal Cycling Immersion. Coatings 2023, 13, 389. [Google Scholar] [CrossRef]
  36. Xue, Y.; Wang, S.; Bi, P.; Zhao, G.; Jin, Y. Super-Hydrophobic Co–Ni Coating with High Abrasion Resistance Prepared by Electrodeposition. Coatings 2019, 9, 232. [Google Scholar] [CrossRef]
  37. ASTM D3623-78a(2020); ASTM 3626: Test Method for Testing Antifouling Panels in Shallow Submergence. D01 Committee ASTM International: West Conshohocken, PA, USA, 2020. [CrossRef]
  38. ASTM D6990-20; ASTM D 6990: Practice for Evaluating Biofouling Resistance and Physical Performance of Marine Coating Systems. D01 Committee ASTM International: West Conshohocken, PA, USA, 2020. [CrossRef]
  39. Song, S.; Latag, G.V.; Mondarte, E.A.Q.; Chang, R.; Hayashi, T. Experimental Characterization of Water Condensation Processes on Self-Assembled Monolayers Using a Quartz Crystal Microbalance with Energy Dissipation Monitoring. Micro 2022, 2, 513–523. [Google Scholar] [CrossRef]
  40. Oh, S.J.; Cook, D.C.; Townsend, H.E. Characterization of Iron Oxides Commonly Formed as Corrosion Products on Steel. Hyperfine Interact. 1998, 112, 59–66. [Google Scholar] [CrossRef]
  41. Alcántara, J.; Fuente, D.D.L.; Chico, B.; Simancas, J.; Díaz, I.; Morcillo, M. Marine Atmospheric Corrosion of Carbon Steel: A Review. Materials 2017, 10, 406. [Google Scholar] [CrossRef] [PubMed]
  42. Zouarhi, M. Bibliographical Synthesis on the Corrosion and Protection of Archaeological Iron by Green Inhibitors. Electrochem 2023, 4, 103–122. [Google Scholar] [CrossRef]
  43. Sherif, E.-S.M.; Erasmus, R.M.; Comins, J.D. In Situ Raman Spectroscopy and Electrochemical Techniques for Studying Corrosion and Corrosion Inhibition of Iron in Sodium Chloride Solutions. Electrochim. Acta 2010, 55, 3657–3663. [Google Scholar] [CrossRef]
  44. Misawa, T.; Hashimoto, K.; Shimodaira, S. The Mechanism of Formation of Iron Oxide and Oxyhydroxides in Aqueous Solutions at Room Temperature. Corros. Sci. 1974, 14, 131–149. [Google Scholar] [CrossRef]
  45. Dwivedi, D.; Lepková, K.; Becker, T. Carbon Steel Corrosion: A Review of Key Surface Properties and Characterization Methods. RSC Adv. 2017, 7, 4580–4610. [Google Scholar] [CrossRef]
  46. Cui, Z.; Chen, S.; Wang, L.; Man, C.; Liu, Z.; Wu, J.; Wang, X.; Chen, S.; Li, X. Passivation Behavior and Surface Chemistry of 2507 Super Duplex Stainless Steel in Acidified Artificial Seawater Containing Thiosulfate. J. Electrochem. Soc. 2017, 164, C856–C868. [Google Scholar] [CrossRef]
  47. Sherif, E.-S. A Comparative Study on the Electrochemical Corrosion Behavior of Iron and X-65 Steel in 4.0 Wt % Sodium Chloride Solution after Different Exposure Intervals. Molecules 2014, 19, 9962–9974. [Google Scholar] [CrossRef] [PubMed]
  48. Pusparizkita, Y.M.; Fardilah, V.A.; Aslan, C.; Jamari, J.; Bayuseno, A.P. Understanding of Low-Carbon Steel Marine Corrosion through Simulation in Artificial Seawater. Aimsmates 2023, 10, 499–516. [Google Scholar] [CrossRef]
  49. Lagerström, M.; Butschle, M.; Larsson, A.I.; Cachot, J.; Dam-Johansen, K.; Schackmann, M.; Le Bihanic, F. Investigation of Critical Copper Release Rates for Dose Optimization of Antifouling Coatings. Prog. Org. Coat. 2025, 198, 108928. [Google Scholar] [CrossRef]
  50. Sahoo, B.N.; Thomas, P.J.; Thomas, P.; Greve, M.M. Antibiofouling Coatings For Marine Sensors: Progress and Perspectives on Materials, Methods, Impacts, and Field Trial Studies. ACS Sens. 2025, 10, 1600–1619. [Google Scholar] [CrossRef] [PubMed]
  51. Kordas, G. Novel Antifouling and Self-Healing Eco-Friendly Coatings for Marine Applications Enhancing the Performance of Commercial Marine Paints. In Engineering Failure Analysis; Thanapalan, K., Ed.; IntechOpen: London, UK, 2020; ISBN 978-1-78985-945-4. [Google Scholar]
  52. Chen, Q.; Zhang, Z.; Qi, Y. Construction of a Novel Environmentally-Friendly Long-Term Antifouling Coating with a Double-Layer Structure Regulated by Phenylmethyl Silicone Oil and Verification of the Static Antifouling Performance of the Coating. Surf. Interfaces 2025, 56, 105519. [Google Scholar] [CrossRef]
  53. Zeng, Z.; Lillard, R.S.; Cong, H. Effect of Salt Concentration on the Corrosion Behavior of Carbon Steel in CO2 Environment. Corrosion 2016, 72, 805–823. [Google Scholar] [CrossRef] [PubMed]
  54. Ture, S.A.; Pattathil, S.D.; Zing, B.Z.; Abbaraju, V. Fluorescence Sensing of Some Important Nitroaromatic Compounds by Using Polyaniline Ag Composite. Micro 2023, 3, 224–238. [Google Scholar] [CrossRef]
  55. Ichikawa, M.; Otaki, M.; Goto, H. Polyaniline Hybrids with Biological Tissue, and Biological Polymers as Physiological—Electroactive Materials. Micro 2023, 3, 172–191. [Google Scholar] [CrossRef]
  56. Kharade, P.M.; Thombare, J.V.; Dhasade, S.S.; Deokar, S.S.; Salunkhe, D.J.; Tamboli, M.S.; Patil, S.S. Spongy-Network-like Polyaniline Thin Films as Electrodes for a Supercapacitor. Micro 2022, 2, 541–548. [Google Scholar] [CrossRef]
  57. Guo, Y.; Qi, Y.; Zhang, C.; Zhang, S.; Zhang, Z. The Effect of Conductive Polyaniline on the Anti-Fouling and Electromagnetic Properties of Polydimethylsiloxane Coatings. Polymers 2023, 15, 2944. [Google Scholar] [CrossRef] [PubMed]
  58. Ren, X.; Wang, X.; Yang, X.; Hu, M.; Xie, H.H.; Wang, C. Carbon Dots Modified PANI Nanocomposites in Acrylic Resin Coatings for Enhancing the Anticorrosion and Antifouling Properties. Polym. Compos. 2023, 44, 5121–5131. [Google Scholar] [CrossRef]
  59. Li, J.; Bi, J.; Wang, X.; Wang, H.; Huang, X.; Li, Y.; Wang, G. Antifouling and Anticorrosion Properties of Coatings Based on Polyaniline Doped with Dodecyl Benzene Sulfonic Acid. Int. J. Electrochem. Sci. 2022, 17, 22039. [Google Scholar] [CrossRef]
  60. Tian, S.; Zhang, J.; Liu, S.; Li, J.; Pu, J.; Hao, Y.; Ying, G.; Xue, Q.; Lu, G. An Integrated Anti-Fouling and Anti-Corrosion Coating Enabled by rGO/AgNPs and Amphiphilic Networks. Engineering 2024, 42, 223–234. [Google Scholar] [CrossRef]
  61. Smitha, V.S.; Swargy, A.; Digilarani, M.; Vimala, T.; Resmi, T.R. Antifouling Behavior of Titania–Silica-Reduced Graphene Oxide Nanocomposites as Coatings for Marine Applications. New J. Chem. 2024, 48, 16202–16214. [Google Scholar] [CrossRef]
  62. Luo, S.; Li, H.; Wu, M.; Tan, Y.; Liu, F.-Q. Promote the Controlled-Released of Cu Ions Using Galvanic Corrosion to Achieve High-Efficiency Antifouling Coating. Prog. Org. Coat. 2025, 200, 108990. [Google Scholar] [CrossRef]
  63. Korek, E.-M.; Teotia, R.; Herbig, D.; Brederlow, R. Electrochemical Impedance Spectroscopy for Ion Sensors with Interdigitated Electrodes: Capacitance Calculations, Equivalent Circuit Models and Design Optimizations. Biosensors 2024, 14, 241. [Google Scholar] [CrossRef] [PubMed]
  64. Chaudhari, S.; Patil, P.P. Inhibition of Nickel Coated Mild Steel Corrosion by Electrosynthesized Polyaniline Coatings. Electrochim. Acta 2011, 56, 3049–3059. [Google Scholar] [CrossRef]
  65. Brasher, D.M.; Kingsbury, A.H. Electrical Measurements in the Study of Immersed Paint Coatings on Metal. I. Comparison between Capacitance and Gravimetric Methods of Estimating Water-uptake. J. Appl. Chem. 1954, 4, 62–72. [Google Scholar] [CrossRef]
  66. Hartshorn, L.; Megson, N.J.L.; Rushton, E. The Structure and Electrical Properties of Protective Films. J. Soc. Chem. Ind. 1937, 56, 266–270. [Google Scholar]
  67. ISO 2812-2:2018; Paints and Varnishes—Determination of Resistance to Liquids Part 2: Water Immersion Method. ISO: Geneva, Switzerland, 2018.
Figure 1. The synthesis process of the antifouling coating.
Micro 05 00034 g001
Figure 2. Samples of naval steel (a) before and (b) after coating with the antifouling coating.
Micro 05 00034 g002
Figure 3. Diagram illustrating the experimental protocol for corrosion evaluation.
Micro 05 00034 g003
Figure 4. Apparatus used in (a) static immersion test; (b) electrochemical tests.
Micro 05 00034 g004
Figure 5. European map showing the location selected for this study.
Micro 05 00034 g005
Figure 6. (a) Magnetite nanoparticles observed in a secondary electron picture using SEM. The inset image displays the generalized chemical microanalysis spectrum of the magnetite nanoparticles as determined by EDS. (b) Magnetite nanoparticles observed in a bright-field ΤΕΜ image. The inset image illustrates the SAED detection of magnetite.
Micro 05 00034 g006
Figure 7. (a) SEM image of nanocomposite of PAni/Fe3O4. (b) Indicative area chemical microanalysis spectrum and the composition table of PAni/Fe3O4 as determined by EDS. (c) Bright-field image of PAni/Fe3O4 byΤΕΜ. The inset image illustrates the SAED detection of magnetite and (d) an element mapping image.
Micro 05 00034 g007
Figure 8. (a) SEM image of modified graphene oxide (GO) with titanium dioxide (TiO2). (b) Indicative area chemical microanalysis spectrum and the composition table of GO/TiO2 as determined by EDS. (c) Bright-field image of GO/TiO2 byΤΕΜ. The inset image illustrates the SAED detection of titanium dioxide and (d) an element mapping image.
Micro 05 00034 g008
Figure 9. TEM image of produced antifouling coating.
Micro 05 00034 g009
Figure 10. SEM micrographs of coated steel surface (ac) before and (df) after immersion in ASW and (gi) the corresponding cross-section.
Micro 05 00034 g010
Figure 11. XRD diffraction peaks of corrosion products on the steel surface following 1, 7, and 12 weeks of static immersion in ASW.
Micro 05 00034 g011
Figure 12. Variations in the thickness of the antifouling coating and the percentage coverage of corrosion products on the surface of coated naval steel during immersion in ASW under static immersion testing. Zero immersion time denotes the condition prior to the static immersion tests.
Micro 05 00034 g012
Figure 13. Potentiodynamic polarization curves of coated steels after different immersion times in ASW solution.
Micro 05 00034 g013
Figure 14. SEM micrographs from the surface of (a) uncoated sample and (bd) coated steel and (eh) the corresponding cross-sections, after potentiodynamic polarization tests. The corrosion products on the uncoated steel surface are seen in yellow, whilst the coating layer is represented in red.
Micro 05 00034 g014
Figure 15. Raman analysis of corrosion products on the steel surface following (a) 1; (b) 7 and; (c) 12 weeks of potentiodynamic polarization tests in ASW.
Micro 05 00034 g015
Figure 16. Nyquist impedance plot of the uncoated and coated naval steel samples for different immersion times in ASW solution. The solid lines represent the fitted curves.
Micro 05 00034 g016
Figure 17. Electrical equivalent circuit of (a) the uncoated and (b) coated naval steel.
Micro 05 00034 g017
Figure 18. SEM micrographs from the surface of (a) an uncoated sample and (bd) coated steel and (eh) the corresponding cross-sections, after electrochemical impedance spectroscopy tests. The corrosion products on the uncoated steel surface are seen in yellow, whilst the coating layer is represented in red.
Micro 05 00034 g018
Figure 19. XRD diffraction peaks of corrosion products on the steel surface following 1, 7, and 12 weeks of electrochemical corrosion in ASW.
Micro 05 00034 g019
Figure 20. SEM micrographs of (a) 1 week immersed uncoated sample and (b) 1, (c) 7, and (d) 12 weeks immersed coated samples in seawater on Rafina coast.
Micro 05 00034 g020
Figure 21. Total fouling organism coverage recorded following immersion in ASW for different durations.
Micro 05 00034 g021
Figure 22. Variations of coating resistance (Rc) and charge transfer resistance (Rct) values relative to immersion time in artificial seawater.
Micro 05 00034 g022
Figure 23. Variations in double-layer capacitance value (CPEdl) and coating capacitance relative to immersion time in artificial seawater.
Micro 05 00034 g023
Figure 24. Variations in volume percentage of water uptake (φ) relative to immersion time in artificial seawater.
Micro 05 00034 g024
Figure 25. Comparative analysis of the maximum corrosion rate values of the antifouling coating vs. commercially available alternatives.
Micro 05 00034 g025
Table 1. Polarization fitting results for coated and uncoated steel in ASW solution.
Immersion Time
(Weeks)
ECORR
(V vs. SCE)
ICORR
(µA/cm2)
Rp
(Ω/cm2)
uncoated−1.80123.011121
1−1.6594.036494
7−1.6838.493072
12−1.6847.523477
Table 2. Electrochemical fitting results for coated and uncoated steel in ASW solution.
Immersion Time
(Weeks)
RS
(Ω⬝cm2)
RC
(Ω⬝cm2)
CPEC
(F/cm2)
Rct
(Ω ⬝ cm2)
CPEdl
(F/cm2)
uncoated8.42--6.32 × 1027.97 × 10−4
110.7551081.13 × 10−691.32 × 1034.68 × 10−7
723.8239892.28 × 10−624.17 × 1042.94 × 10−6
1211.6849982.01 ×10−623.23 × 1042.21 × 10−6
Table 3. Summary of fouling resistance index and physical wear rate of antifouling coating.
Immersion Time
(Weeks)
FR
(%)
PDR
(%)
OP
(%)
uncoated6.191006.19
193.1910093.19
798.8710098.87
1299.8710099.87
Disclaimer/Publisher’s Note: The statements, opinions and data contained in all publications are solely those of the individual author(s) and contributor(s) and not of MDPI and/or the editor(s). MDPI and/or the editor(s) disclaim responsibility for any injury to people or property resulting from any ideas, methods, instructions or products referred to in the content.

