Article

Dielectric Behaviour and Electrical Conductivity of α-BiNbO4 and β-BiNbO4 Ceramics

1
CFisUC, Physics Department, University of Coimbra, Rua Larga, 3004-516 Coimbra, Portugal
2
I3N and Physics Department, University of Aveiro, 3810-193 Aveiro, Portugal
*
Author to whom correspondence should be addressed.
Micro 2022, 2(4), 549-563; https://doi.org/10.3390/micro2040036
Submission received: 31 August 2022 / Revised: 16 September 2022 / Accepted: 19 September 2022 / Published: 21 September 2022
(This article belongs to the Section Microscale Materials Science)

Abstract

:
In this work, orthorhombic (α-BiNbO4) and triclinic bismuth niobate (β-BiNbO4) ceramics were prepared by a wet chemical route. The structure of the obtained powders was characterised by X-ray diffraction and the morphology by scanning electron microscopy. The dielectric measurements were performed in the radiofrequency region, at different temperatures, using the impedance spectroscopy technique. The α-BiNbO4 sample presented a temperature-dependent relaxation process, with the corresponding activation energy being calculated through the Arrhenius equation. The AC conductivity dependence on the frequency was in agreement with Jonscher’s universal power. The conduction mechanism in the α-BiNbO4 compound is governed by two processes, which can be ascribed to a hopping transport mechanism. The correlated barrier hopping model until 280 K and the non-overlapping small polaron tunnelling model above 280 K are the most suitable models to describe the conductivity of this sample. In the β-BiNbO4 compound, the motion of mobile charge carriers involves localised hopping between neighbouring sites.

Graphical Abstract

1. Introduction

The research on inorganic materials properties has been a persistent mission in the development of functional materials. Since the close relation between structure, morphology and physical properties is well recognised, a number of studies have been conducted to understand the formation mechanisms from both theoretical and experimental points of view to improve the synthesis of enhanced functional materials [1].
In the past few decades, some types of ABO4 oxides have been receiving considerable attention, largely due to their capacity to combine chemical elements in this basic formula, allowing an extensive array of structures and phases with completely different functionalities, with their relevance already proven in a wide range of technological applications [2,3,4,5].
Bismuth niobate, BiNbO4, which belongs to the family of A3+B5+O4 compounds, has been in the scope of researchers due to its excellent photocatalysts and dielectric properties [6,7,8,9]. It is antiferroelectric at room temperature but converts to ferroelectric at 360 °C and paraelectric after 570 °C [10].
At ambient pressure, BiNbO4 exists in two polymorphs: the orthorhombic phase α-BiNbO4, space group Pnna, and the triclinic phase β-BiNbO4, space group P1. At room temperature, the β-BiNbO4 phase is predominant. It transitions to α-BiNbO4 at temperatures between 500 and 750 °C, with the opposite transition from the α phase to the β phase occurring at ≈1020 °C. This last transition is reported as irreversible, at least in powders [4,8,11,12,13].
Aiming for different potential applications of α-BiNbO4 and β-BiNbO4 ceramics, the knowledge of their properties is essential to predict the system performance. Therefore, the measurement of the dielectric properties is fundamental for the characterisation of these materials [14].
According to [15], the dielectric studies of bismuth niobate have been mainly focused on the microwave frequency regime, which means that the dielectric behaviour in the radiofrequency range is not so well documented.
Through the analysis of the AC conductivity measurements, we sought to identify the type of conduction process that governs the electrical properties of the α-BiNbO4 and β-BiNbO4 polymorphs.
Since it is presumed that the ionic motion in ionically conducting materials is responsible for this type of conduction, AC conductivity data have been extensively applied to study the nature of this motion [16]. Additionally, it can be considered a valuable resource to obtain information about the imperfection states present in the system [17].
There are different theoretical models that can be applied to determine the electrical conduction mechanisms of a material. Amongst these models, the correlated barrier hopping, non-overlapping small polaron tunnelling, quantum mechanical tunnelling, overlapping large polaron tunnelling and atomic hopping models can be highlighted [17,18,19,20].
The aforementioned models have been applied to study the mechanisms of electric conduction in several types of materials, namely, ionic conductive glasses, ionic or electronic conducting polymers, organic semiconductors, amorphous semiconductors and nonstoichiometric or highly defective crystals. Usually, the AC conductivity shows a similar behaviour in all of these disordered materials, being usually controlled by deep electronic states in the vicinity of the Fermi level [19]. The alternating electric field applied to the material induces the transition of charges on deep or shallow defect centres. Consequently, these charges will follow the frequency, migrating long-range or short-range distances within the material. The AC conductivity, particularly in the long-range migration, will also be influenced by temperature, since the increase in the temperature promotes the increase in the mobility of the charge carriers, which is reflected by an increase in the σac values [18,19,21].
In this research, the BiNbO4 ceramics were prepared by a wet chemical technique, the sol–gel method, and heat-treated at 850 and 1050 °C. The structural characterisation was performed by X-ray diffraction and the morphology was studied through scanning electron microscopy.
The complex permittivity measurements were performed as a function of the temperature (200–370 K), in a frequency range from 100 Hz to 1 MHz. To study the relaxation mechanism observed in the sample heat-treated at 850 °C, where pure α-BiNbO4 was identified, the permittivity formalism was applied.
The AC conductivity spectra were found to follow Jonscher’s power law at different temperatures, with the conduction processes in α-BiNbO4 and β-BiNbO4 being identified.

2. Experimental

BiNbO4 powders were prepared using the citrate route of the sol–gel method. Besides the starting materials, bismuth nitrate (Bi(NO3)3·5H2O) and niobium chloride (NbCl5), citric acid and ethylene glycol were used as a chelating agent and reaction medium, respectively, as described in our previous work [22]. The samples were heat-treated at 850 and 1050 °C, with a heating rate of 5 °C/min and a dwell time of 4 h.
The flow chart for the preparation of the samples is shown in Figure 1.
The structural characterisation of the prepared samples was performed by X-ray diffraction, where the patterns’ data were obtained on an Empyrean diffractometer (CuK α radiation, λ = 1.54060 Å) at room temperature. Intensity data were collected by the step counting method (step 0.02° in 1 s) in the 2θ angle range of 10–60°. Moreover, Rietveld refinement was carried out to confirm the crystal structure and obtain additional structural information on these compounds.
The samples’ morphology was studied by scanning electron microscopy, employing a TESCAN-Vega III microscope. To improve the surface electrical conduction and avoid charge accumulation, the samples were covered with carbon before microscopic observation.
The impedance spectroscopy characterisation was performed in the frequency range of 100 Hz to 1 MHz, using a Network Analyzer Agilent 4294A in the Cp-Rp (Capacitance in parallel with Resistance) configuration.
The measurements were performed in the temperature range between 200 and 370 K, using a nitrogen bath cryostat setup. During these measurements, the samples, with the opposite sides previously painted with silver conducting paste were kept in a helium atmosphere to improve the heat transfer and eliminate the moisture.
The real part, ε′, and the imaginary part, ε″, of the complex permittivity were calculated using Equation (1) [23]:
ε * = ε i ε = C p d A ε 0 i d ω R p A ε 0
where A represents the electrode area, d the sample thickness, ω the angular frequency and ε0 the empty space dielectric constant.

3. Results and Discussion

3.1. Structural Characterisation

The crystalline phases present in the sintered pellets were identified by the X-ray diffraction patterns, as shown in Figure 2. The crystalline nature of the prepared powders can be revealed by the sharp and high-intensity peaks. In the sample heat-treated at 850 °C, pure α-BiNbO4 was identified, with peaks consistent with the standard ICDD code 04-010-5422 [24]. The sample heat-treated at 1050 °C was proved to be single-phase β-BiNbO4, according to the ICDD code 04-013-6357 [25].
The structural parameters, presented in Table 1, were obtained by fitting the experimental data from XRD using the Rietveld structural refinement software PROFEX [26]. The calculated cell lengths and angles show good agreement with the reference data. Moreover, since one of the most pertinent properties that can be obtained from peak width analysis is the crystallite size, D, this parameter was estimated and is also presented in Table 1. As one can see, the phase transformation from orthorhombic to triclinic bismuth niobate and the increase in the treatment temperature had some influence on the crystallite size, with an increase of about 18%.
The Rietveld fitting parameters, assembled in the same table, show the quality of the fitting [27] and the consistency of the obtained results.

3.2. Morphological Characterisation

The SEM micrographs of the samples, recorded with magnifications of 10 kX and 1 kX, respectively, are shown in Figure 3.
The micrograph of α-BiNbO4 clearly reveals that the sample consists of very small, homogenous, randomly oriented and uniform (in shape and size) grains. The β-BiNbO4 sample presents a completely different morphology, where the coalescence phenomena are perfectly visible.
The average grain size of the α-BiNbO4 sample was measured by the Heyn Lineal Intercept method. The intercept method involves an actual count of the number of grains or grain boundaries intersected by one or more straight lines sufficiently long to yield at least 50 intercepts. The average grain diameter per line is obtained by the ratio between the line length and the magnification [28].
The line configuration, number of grains intersected and grain average diameter per line, assembled in Table 2, culminated in an average grain size of 497 nm.
Since the crystallite size obtained by the broadening of the diffraction peaks is smaller than the average grain size estimated by microscopy, it can be stated that the grains observed are composed of several crystallites.

3.3. Dielectric Properties

The frequency dependence of the dielectric constant, ε′, of the studied samples, at different temperatures, in the frequency range of 100 Hz to 1 MHz is shown in Figure 4.
As one can see, the dielectric constant of α-BiNbO4 increases with the temperature and decreases with the frequency. In the β-BiNbO4 sample, a similar temperature dependence is observable; however, higher values of the dielectric constant and its stability with the frequency are also visible.
The frequency dependence of the dielectric losses, ε″, in the same temperature and frequency range, is shown in Figure 5. The ε″ values decrease with the frequency in both samples; however, in the β-BiNbO4, this decrease is more abrupt. Moreover, in the α-BiNbO4 sample, the ε″ curve recorded at 360 K exhibits a maximum, which may indicate the occurrence of a relaxation process.
To better understand the relaxation phenomenon, the frequency dependence of the dielectric losses of the α-BiNbO4 sample, at temperatures between 345 and 370 K, is shown in Figure 6a. As the temperature increases, the position of the peaks shifts to higher frequencies. The activation energy for the relaxation mechanism, Ea, can be obtained from the values of the frequency where ε″ is maximum, fmax, as a function of the temperature. Assuming that the process is activated by temperature [23],
f m a x = f 0 e E a k B T
where f0 represents a pre-exponential factor and kB is the Boltzmann constant.
The logarithmic depiction of the relaxation frequency as a function of the inverse of temperature, shown in the inset of Figure 6a, permits the calculation of the activation energy. For this sample, the obtained activation energy estimated from the Arrhenius plot is 0.22 eV.
The Nyquist plot, for the pure α-BiNbO4 sample, is depicted in Figure 6b. The relaxation mechanism for each temperature has a shape of a decentred semicircle, which is a profile that confirms that the simple Debye model is inappropriate to depict the relaxation phenomena. If the Nyquist plot is given by a semicircle centred in the ε′ axis, the Debye model is suitable to describe the relaxation phenomenon. However, if the relaxation process has a shape of a decentred symmetric semicircle, with the centre located below the ε′ axis, the Debye model should be replaced by the Cole–Cole model. On the other hand, if the semicircle is asymmetric in relation to the imaginary axis, the Cole–Davidson model is the most suitable one [29,30]. As the inset highlights, the semicircle is symmetric, having its centre located below the ε′ axis, which indicates that the Cole–Cole model is suitable to study this relaxation phenomenon. The semicircle can be attributed to the contribution of the bulk effect, whereas the straight line, visible at low frequencies, is due to the DC conductivity, σdc, effect [31].

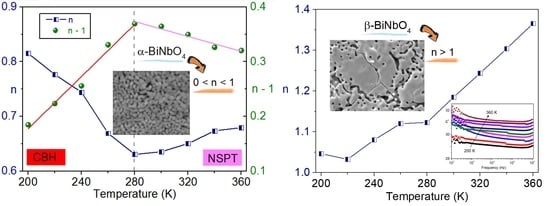
3.4. Conductivity Study

The AC conductivity, σac, was extracted from the dielectric data using Equation (3) [32]:
σ A C = ε 0 ω ε
Figure 7 shows the frequency dependence of the AC conductivity at different temperatures for the sintered ceramics. The σac curves are characterised by the manifestation of a plateau in the low-frequency region, for each temperature, showing the frequency-independent nature of σac. This plateau section is related to the DC conductivity, σdc, the frequency-independent conductivity. In the high-frequency region, one can see the characteristic behaviour of a semiconductor compound, since σac increases with the frequency [21].
There are two types of hopping processes that can occur due to the applied electrical field: the long-range interwell hopping of holes, which occurs between sites located in adjacent defect-potential wells and contributes to the DC part of the conductivity, and the short-range intrawell hopping holes, which occur within a defect-potential well, contributing to the pure AC conductivity. The increase in the AC conductivity at high frequencies aforementioned is attributed to this hopping mechanism [18].
As stated by the Jonscher universal power law, the electrical conductivity can be written as [1,17,33]
σ A C = σ D C + A ω n
where A is a temperature-dependent constant that expresses the strength of polarisability, and n is the power law exponent, temperature- and possibly frequency-dependent, that represents the degree of interaction between mobile ions and the lattices around them, being an essential source of information concerning the conduction mechanism model in the compound [1,17,21].
Comparing the conductivity curves of the two samples, one can see that the transition from the constant (plateau) region to the frequency-dependent region occurs at lower frequencies in the α-BiNbO4, with the point where the change in slope occurs shifting to lower frequencies with increasing temperature.
There are also some noticeable differences in the high-frequency region: the temperature dependence of the AC conductivity is much more pronounced in this sample, and the magnitude of the σac values at temperatures above 320 K is higher.
The electrical conductivity spectra were well fitted using Equation (4). Figure 7 insets show this fitting for the temperature of 300 K.
The frequency exponent n for the α-BiNbO4 sample, obtained from the aforementioned fitting, was represented as a function of temperature. Figure 8a shows two behaviours: from 200 to 280 K, region I, n decreases with the increase in temperature, which suggests that the correlated barrier hopping (CBH) is the most appropriate model to describe the conductivity in this region. For region II, 280 K ≤ T ≤ 360 K, the non-overlapping small polaron tunnelling (NSPT) model is a suitable option since n increases with increasing temperature [17,20,21].
In the CBH model, which considers the hopping of the carriers between two sites over a barrier separating them, the exponent n is described by the equation [17,20,21,34]
n = 1 6 k B T W m k B T l n ( 1 ω τ 0 )
where T represents the absolute temperature, kB the Boltzmann constant, Wm the polaron binding energy (the necessary energy to move an electron from one site to another) and τ0 the characteristic relaxation time, which is in the order of an atom vibrational period, τ0 ≈ 10−13 s.
If Wm >> kB T ln(ωτ0), Equation (5) can be reduced to
n = 1 6 k B T W m
The Wm value, 0.22 eV, was deduced from the slope of (1−n) versus temperature, represented in Figure 8b.
In the NSPT model, the n parameter is given by [19,21,35]
n = 1 + 4 W H k B T l n ( 1 ω τ 0 )
where WH represents the polaron hopping energy, which is the binding energy of the charge carrier in its localised sites. For large values of WH/(kBT), n can be reduced to
n = 1 + 4 k B T W H
The WH value, 0.49 eV, was obtained from the slope of (1−n) versus temperature, represented in Figure 8c.
In the CBH model, the conduction occurs through single polaron or bipolaron hopping process over the Coulomb barrier separating two defect centres [17,36].
According to this model, the AC conductivity is determined according to [17,20,21,35,36]
σ A C = n p h π 2 N N p ε ω R ω 6 24
NNP is given by
N N p = N T 2 e U e f f 2 k B T
for single polaron hopping, and
N N p = N T
for bipolaron hopping, where nph is the number of polarons involved in the hopping process, NT is the number of density of states, NNP is proportional to the square of the concentration of states, Ueff is the effective correlation energy (correlation between electron–phonon), ε′ is the dielectric constant and Rω is the hopping distance for conduction.
In region I (220 K < T < 280 K), the AC conductivity of the α-BiNbO4 sample can be adequately described considering only one conduction mechanism, namely single polaron hopping. Figure 9 shows that ln(σac) versus 1000/T plots are straight lines, which means that the AC conductivity varied exponentially with temperature.
For region II (T > 280 K), according to the NSPT mechanism, the AC conductivity is given by [19,35,36]
σ A C = ( π e ) 2 k B T α 1 ω [ N ( E F ) ] 2 R ω 4 12
where N(EF) is the density of states near the Fermi level, α−1 is the spatial extension of the polaron and Rω is the tunnelling distance.
The frequency exponent n for the β-BiNbO4 sample, obtained from the fitting of Equation (4), was plotted as a function of temperature, as shown in Figure 10. As one can see, n is superior to 1 in the temperature range studied. The AC conductivity mechanism of this sample could be attributed to the motion of mobile charge carriers from site to site with quantum mechanical tunnelling between asymmetric double-well potentials if the exponent n was temperature-independent or increased slightly with temperature [1,20,37]. As seen in Figure 10, the increase in the exponent n with temperature is substantial, which means that the motion involves localised hopping between neighbouring sites [38]. The type of conduction process was also identified in other ABO4 oxides [39,40].

4. Conclusions

Orthorhombic and triclinic bismuth niobate were successfully synthesised by the sol–gel method, with heat treatments of 850 and 1050 °C, respectively. Besides the different structures, the morphology of the obtained samples was also distinctive.
In the α-BiNbO4 sample, which presented an electrical relaxation phenomenon, both dielectric constant and dielectric losses decreased with the frequency. The β-BiNbO4 possesses higher dielectric constant values and is less dependent on the frequency.
The electrical conductivity curves obeyed the Jonscher universal power law in both samples, with the n exponent values being higher for β-BiNbO4.
The variation in n as a function of temperature suggested that the AC conductivity can be assigned to the correlated barrier hopping (CBH) model and the non-overlapping small polaron tunnelling (NSPT) model in the α-BiNbO4 sample, while in the β-BiNbO4 sample, the conductivity can be assigned to the motion of localised hopping between neighbouring sites.

Author Contributions

Conceptualization, S.D.; methodology, S.D.; validation, S.D., M.P.G. and L.C.C.; formal analysis, S.D.; investigation, S.D.; resources, S.D., M.P.G. and L.C.C.; data curation, S.D.; writing—original draft preparation, S.D.; writing—review and editing, S.D., M.P.G. and L.C.C.; supervision, M.P.G. and L.C.C.; project administration, M.P.G. and L.C.C. All authors have read and agreed to the published version of the manuscript.

Funding

This research received no external funding.

Institutional Review Board Statement

Not applicable.

Informed Consent Statement

Not applicable.

Data Availability Statement

The raw/processed data required to reproduce these findings cannot be shared at this time as the data also form part of an ongoing study.

Acknowledgments

Susana Devesa acknowledges the post-doctoral grant under the project “SUSpENsE-CENTRO-01-0145-FEDER-000006”. This work was partially supported by FEDER funds through the COMPETE 2020 Programme and National Funds through FCT—Portuguese Foundation for Science and Technology, under project UID/CTM/50025/2019.

Conflicts of Interest

The authors declare that they have no conflict of interest.

References

  1. Dhahri, A.; Dhahri, E.; Hlil, E.K. Electrical conductivity and dielectric behaviour of nanocrystalline La0.6Gd0.1Sr0.3Mn0.75Si0.25O3. RSC Adv. 2018, 8, 9103–9111. [Google Scholar] [CrossRef] [PubMed]
  2. Siqueira, K.P.F.; Moreira, R.L.; Dias, A. Synthesis and Crystal Structure of Lanthanide Orthoniobates Studied by Vibrational Spectroscopy. Chem. Mater. 2010, 22, 2668–2674. [Google Scholar] [CrossRef]
  3. Theissmann, R.; Ehrenberg, H.; Weitzel, H.; Fuess, H. Nanostructured cation distribution in FeNbO4: A synchrotron powder diffraction and transmission electron microscopy investigation. J. Mater. Sci. 2002, 37, 4431–4436. [Google Scholar] [CrossRef]
  4. Zhou, D.; Pang, L.-X.; Wang, H.; Yao, X. Phase composition and phase transformation in Bi(Sb,Nb,Ta)O4 system. Solid State Sci. 2009, 11, 1894–1897. [Google Scholar] [CrossRef]
  5. Hou, J.; Chen, Q.; Gao, C.; Dai, R.; Zhang, J.; Wang, Z.; Zhang, Z.; Ding, Z. Raman and luminescence studies on phase transition of EuNbO4 under high pressure. J. Rare Earths 2014, 32, 787–791. [Google Scholar] [CrossRef]
  6. Zhuk, N.A.; Shugurov, S.M.; Krzhizhanovskaya, M.G.; Belyy, V.A.; Sekushin, N.A.; Makeev, B.A.; Nekipelov, S.V.; Beznosikov, D.S.; Busargina, Y.A. The effect of CuO on the microstructure, spectral characteristics, thermal and electrical properties of BiNbO4 ceramics. J. Alloys Compd. 2020, 822, 153619. [Google Scholar] [CrossRef]
  7. Liu, Y.-J.; Zhang, J.-W.; He, D.-W.; Xu, C.; Hu, Q.-W.; Qi, L.; Liang, A.-K. Exploring the compression behavior of HP-BiNbO4 under high pressure. Chin. Phys. B 2017, 26, 116202. [Google Scholar] [CrossRef]
  8. Xu, C.; He, D.; Liu, C.; Wang, H.; Zhang, L.; Wang, P.; Yin, S. High pressure and high temperature study the phase transitions of BiNbO4. Solid State Commun. 2013, 156, 21–24. [Google Scholar] [CrossRef]
  9. Dunkle, S.S.; Suslick, K.S. Photodegradation of BiNbO4 Powder during Photocatalytic Reactions. J. Phys. Chem. C 2009, 113, 10341–10345. [Google Scholar] [CrossRef]
  10. Ayyub, P.; Multani, M.S.; Palkar, V.R.; Vijayaraghavan, R. Vibrational spectroscopic study of ferroelectric SbNbO4, antiferroelectric BiNbO4, and their solid solutions. Phys. Rev. B 1986, 34, 8137–8140. [Google Scholar] [CrossRef] [PubMed]
  11. Zhou, D.; Wang, H.; Yao, X.; Wei, X.; Xiang, F.; Pang, L. Phase transformation in BiNbO4 ceramics. Appl. Phys. Lett. 2007, 90, 172910. [Google Scholar] [CrossRef]
  12. Radha, R.; Muthurajan, H.; Rao, N.K.; Pradhan, S.; Gupta, U.; Jha, R.; Mirji, S.; Ravi, V. Low temperature synthesis and characterization of BiNbO4 powders. Mater. Charact. 2008, 59, 1083–1087. [Google Scholar] [CrossRef]
  13. Devesa, S.; Graça, M.P.; Costa, L.C. Sol-Gel Synthesis, Structural Characterization and Microwave Dielectric Properties of Bismuth Niobate Modified by Iron Inclusion. In Recent Applications in Sol-Gel Synthesis; Chandra, U., Ed.; IntechOpen: Rijeka, Croatia, 2017; p. 63. [Google Scholar]
  14. Sebastian, M.; Jantunen, H. Low loss dielectric materials for LTCC applications: A review. Int. Mater. Rev. 2008, 53, 57–90. [Google Scholar] [CrossRef]
  15. Devesa, S.; Graça MP, F.; Costa, L.C. Dielectric Properties of Bismuth Niobate Ceramics. In Bismuth—Advanced Applications and Defects Characterization; Zhou, Y., Dong, F., Jin, S., Eds.; IntechOpen: London, UK, 2018; p. 93. [Google Scholar]
  16. El-Mallah, H. AC Electrical Conductivity and Dielectric Properties of Perovskite (Pb,Ca)TiO3Ceramic. Acta Phys. Pol. A 2012, 122, 174–179. [Google Scholar] [CrossRef]
  17. Jebli, M.; Rayssi, C.; Dhahri, J.; Khirouni, K. Investigation of electrical properties and conduction mechanism using CBH model of Ba0.97La0.02Ti1−xNb4x/5O3 (x = 0.00 and 0.02) compounds. Appl. Phys. A 2020, 126, 1–16. [Google Scholar] [CrossRef]
  18. Akgul, U.; Ergin, Z.; Sekerci, M.; Atici, Y. AC conductivity and dielectric behavior of [Cd(phen)2(SCN)2]. Vacuum 2007, 82, 340–345. [Google Scholar] [CrossRef]
  19. Kahouli, A.; Sylvestre, A.; Jomni, F.; Yangui, B.; Legrand, J. Experimental and Theoretical Study of AC Electrical Conduction Mechanisms of Semicrystalline Parylene C Thin Films. J. Phys. Chem. A 2012, 116, 1051–1058. [Google Scholar] [CrossRef] [PubMed]
  20. Ben Taher, Y.; Moutia, N.; Oueslati, A.; Gargouri, M. Electrical properties, conduction mechanism and modulus of diphosphate compounds. RSC Adv. 2016, 6, 39750–39757. [Google Scholar] [CrossRef]
  21. Ncib, W.; Kharrat, A.B.J.; Saadi, M.; Khirouni, K.; Chniba-Boudjada, N.; Boujelben, W. Structural, AC conductivity, conduction mechanism and dielectric properties of La0.62Eu0.05Ba0.33Mn0.85Fe0.15O3 ceramic compound. J. Mater. Sci. Mater. Electron. 2019, 30, 18391–18404. [Google Scholar] [CrossRef]
  22. Devesa, S.; Graça, M.; Costa, L. Structural, morphological and dielectric properties of BiNbO4 ceramics prepared by the sol-gel method. Mater. Res. Bull. 2016, 78, 128–133. [Google Scholar] [CrossRef]
  23. Devesa, S.; Graça, M.; Henry, F.; Costa, L. Dielectric properties of FeNbO4 ceramics prepared by the sol-gel method. Solid State Sci. 2016, 61, 44–50. [Google Scholar] [CrossRef]
  24. Subramanian, M.; Calabrese, J. Crystal structure of the low temperature form of bismuth niobium oxide [α-BiNbO4]. Mater. Res. Bull. 1993, 28, 523–529. [Google Scholar] [CrossRef]
  25. Muktha, B.; Darriet, J.; Madras, G.; Row, T.G. Crystal structures and photocatalysis of the triclinic polymorphs of BiNbO4 and BiTaO4. J. Solid State Chem. 2006, 179, 3919–3925. [Google Scholar] [CrossRef]
  26. Doebelin, N.; Kleeberg, R. Profex: A graphical user interface for the Rietveld refinement program BGMN. J. Appl. Crystallogr. 2015, 48, 1573–1580. [Google Scholar] [CrossRef] [PubMed]
  27. Toby, B.H. R factors in Rietveld analysis: How good is good enough? Powder Diffr. 2006, 21, 67–70. [Google Scholar] [CrossRef]
  28. Standard E112-10; Standard Test Methods for Determining Average Grain Size. ASTM International: West Conshohocken, PA, USA, 2010.
  29. Zhao, C.; Zhao, C.Z.; Werner, M.; Taylor, S.; Chalker, P. Dielectric relaxation of high-k oxides. Nanoscale Res. Lett. 2013, 8, 456. [Google Scholar] [CrossRef] [PubMed]
  30. Costa, M.M.; Pires, G.F.M., Jr.; Terezo, A.J.; Graça, M.P.F.; Sombra, A.S.B. Impedance and modulus studies of magnetic ceramic oxide Ba2Co2Fe12O22 (Co2Y) doped with Bi2O3. J. Appl. Phys. 2011, 110, 34107. [Google Scholar] [CrossRef]
  31. Rouahi, A.; Kahouli, A.; Challali, F.; Besland, M.-P.; Vallée, C.; Yangui, B.; Salimy, S.; Goullet, A.; Sylvestre, A. Impedance and electric modulus study of amorphous TiTaO thin films: Highlight of the interphase effect. J. Phys. D Appl. Phys. 2013, 46, 65308. [Google Scholar] [CrossRef]
  32. Arya, S.K.; Danewalia, S.S.; Arora, M.; Singh, K. Effect of Variable Oxidation States of Vanadium on the Structural, Optical, and Dielectric Properties of B2O3–Li2O–ZnO–V2O5 Glasses. J. Phys. Chem. B 2016, 120, 12168–12176. [Google Scholar] [CrossRef] [PubMed]
  33. Badapanda, T.; Harichandan, R.K.; Nayak, S.S.; Mishra, A.; Anwar, S. Frequency and temperature dependence behaviour of impedance, modulus and conductivity of BaBi4Ti4O15 aurivillius ceramic. Process. Appl. Ceram. 2014, 8, 145–153. [Google Scholar] [CrossRef] [Green Version]
  34. Mohamed, R.I. AC conductivity and dielectric constant of poly (vinyl alcohol) doped with MnSO4. J. Phys. Chem. Solids 2000, 61, 1357. [Google Scholar] [CrossRef]
  35. Ncib, W.; Kharrat, A.B.J.; Wederni, M.; Chniba-Boudjada, N.; Khirouni, K.; Boujelben, W. Investigation of structural, electrical and dielectric properties of sol-gel prepared La0.67−xEuxBa0.33Mn0.85Fe0.15O3 (x = 0.0, 0.1) manganites. J. Alloys Compd. 2018, 768, 249–262. [Google Scholar] [CrossRef]
  36. Jellibi, A.; Chaabane, I.; Guidara, K. Experimental and theoretical study of AC electrical conduction mechanisms of Organic–inorganic hybrid compound Bis (4-acetylanilinium) tetrachlorocadmiate (II). Phys. E Low-Dimens. Syst. Nanostruct. 2016, 80, 155–162. [Google Scholar] [CrossRef]
  37. Khadhraoui, S.; Triki, A.; Hcini, S.; Zemni, S.; Oumezzine, M. Variable-range-hopping conduction and dielectric relaxation in Pr0.6Sr0.4Mn0.6Ti0.4O3±δ perovskite. J. Magn. Magn. Mater. 2014, 371, 69–76. [Google Scholar] [CrossRef]
  38. Oumezzine, E.; Hcini, S.; Rhouma, F.; Oumezzine, M. Frequency and temperature dependence of conductance, impedance and electrical modulus studies of Ni0.6Cu0.4Fe2O4 spinel ferrite. J. Alloys Compd. 2017, 726, 187–194. [Google Scholar] [CrossRef]
  39. Saranya, S.; Selvan, R.K.; Priyadharsini, N. Synthesis and characterization of polyaniline/MnWO4 nanocomposites as electrodes for pseudocapacitors. Appl. Surf. Sci. 2012, 258, 4881–4887. [Google Scholar] [CrossRef]
  40. Shanmugapriya, S.; Surendran, S.; Nithya, P. Saravanan and Selvan R K undefined Temperature dependent electrical and magnetic properties of CoWO4 nanoparticles synthesized by sonochemical method. J. Alloys Compd. 2016, 214, 57. [Google Scholar]
Figure 1. Schematic diagram for the preparation of BiNbO4 samples.
Micro 02 00036 g001
Figure 2. X-ray diffraction patterns of the BiNbO4 powders.
Micro 02 00036 g002
Figure 3. Scanning electron microscopy micrographs of the studied samples. (a) α-BiNbO4; (b) β-BiNbO4.
Micro 02 00036 g003
Figure 4. Frequency dependence of the dielectric constant at different temperatures: (a) α-BiNbO4; (b) β-BiNbO4.
Micro 02 00036 g004
Figure 5. Frequency dependence of the dielectric losses at different temperatures: (a) α-BiNbO4; (b) β-BiNbO4.
Micro 02 00036 g005aMicro 02 00036 g005b
Figure 6. (a) Frequency dependence of the dielectric losses (inset: Ln(fmax) versus 1000/T) and (b) Nyquist plot, for α−BiNbO4, at temperatures between 345 and 370 K, in steps of 5 K.
Micro 02 00036 g006aMicro 02 00036 g006b
Figure 7. Angular frequency dependence of the AC conductivity at different temperatures: (a) α-BiNbO4; (b) β-BiNbO4.
Micro 02 00036 g007
Figure 8. Temperature dependence of (a) the exponent n, (b) n−1 for the CBH mechanism and (c) n−1 for the NSPT mechanism, for α−BiNbO4.
Micro 02 00036 g008aMicro 02 00036 g008b
Figure 9. Ln(σAC) versus 1000/T, for α−BiNbO4, at different frequencies, using the CBH model.
Micro 02 00036 g009
Figure 10. Temperature dependence of the exponent n for β-BiNbO4.
Micro 02 00036 g010
Table 1. Rietveld fitting parameters, diffraction pattern fitting factors and crystallite size.
Cell Lengths
(Å)
Cell Angles
(º)
D
(nm)
R-Factorχ2
α-BiNbO4a 5.6816
b 11.7139
c 4.9838
__________110.4Rwp 8.00
Rexp 2.81
8.11
ICDD
04-010-5422 [24]
a 5.6730
b 11.7140
c 4.9780
α 90
β 90
γ 90
__________
β-BiNbO4a 5.5412
b 7.6192
c 7.9326
α 102.511
β 90.148
γ 92.814
130.6Rwp 5.21
Rexp 2.62
3.88
ICDD
04-013-6357 [25]
a 5.5376
b 7.6184
c 7.9324
α 102.565
β 90.143
γ 92.788
__________
Table 2. Calculated average grain size of the α-BiNbO4 sample.
MethodLine NumberNumber of Grains
Intersected
Grain Average Diameter per Line
(nm)
Heyn Lineal InterceptMicro 02 00036 i001138514
252503
365503
470467
Publisher’s Note: MDPI stays neutral with regard to jurisdictional claims in published maps and institutional affiliations.

