Article

Thermodynamic Constraints on the “Hidden” Folding Intermediates

by
Timur A. Mukhametzyanov
1,*,
Mikhail I. Yagofarov
1 and
Christoph Schick
2
1
A.M. Butlerov Chemical Institute, Kazan Federal University, Kremlevskaya 18, Kazan 420008, Russia
2
Institute of Physics & Competence Centre CALOR, University of Rostock, Albert-Einstein-Str. 23-24, 18059 Rostock, Germany
*
Author to whom correspondence should be addressed.
Liquids 2025, 5(3), 24; https://doi.org/10.3390/liquids5030024
Submission received: 19 May 2025 / Revised: 28 August 2025 / Accepted: 9 September 2025 / Published: 13 September 2025
(This article belongs to the Section Chemical Physics of Liquids)

Abstract

Experimental data on the folding and unfolding of small globular proteins are often well described assuming a two-state equilibrium process. It means that after careful analysis by a combination of experimental techniques, only folded and unfolded states of the protein are found to be populated under various external conditions with no detectable intermediates. One of the consequences of the two-state behavior is that the equilibrium ratio of the folded to unfolded protein states follows a simple thermodynamic relation, and the enthalpy difference between states can be obtained from the temperature dependence of the equilibrium constant. In this paper, we theoretically investigate the criteria for the two-state equilibrium behavior and discuss the thermodynamic constraint on the properties of the “hidden” folding intermediates. The literature data on the folding mechanism of lysozyme in water and glycerol, which follows a two-state equilibrium behavior but includes kinetic intermediates, is analysed in light of this constraint.

1. Introduction

Since the pioneering experiments of Anfinsen [1], the formation of the compact globular structure of proteins is viewed in terms of the thermodynamic equilibrium between the conformations of the protein molecule. That is, the native state is the most thermodynamically favorable under native conditions. The need to reconcile the enormous space of possible configurations of protein chains and experimentally observed folding kinetics led to the formulation of the folding funnel view on the energy landscape of protein microstates [2,3,4]. This view implies that folding (the formation of the native state from disordered, random chains) occurs via partially folded intermediate structures [5,6], which are identified both experimentally [7] and computationally [8]. One may possibly expect that under a gradual change in the external conditions (temperature, pH, etc.), the population of protein conformations will also change gradually, so partially folded conformations should be populated under certain conditions.
Remarkably, that is often not so, and despite the enormous configurational space available for protein molecules, the folding/unfolding equilibrium can often be described by considering only a limited number of macrostates. Especially in the case of small, single-domain globular proteins, the folding/unfolding equilibrium during temperature changes is often well described as a “two-state” transition [9]. That is, at any given temperature, a certain ratio between folded and unfolded protein molecules exists, with no appreciable intermediate population, and the properties of the protein molecules in either of the states are sufficiently uniform [10]. If this model is applicable, the folding process can be straightforwardly treated via an equilibrium constant between folded and unfolded protein macrostates. The van’t Hoff enthalpy, heat capacity change, and transition temperature (from which the entropy change can be calculated as well) can be obtained from the fit of the experimental calorimetric or spectroscopic data with the thermodynamic model for the two-state transition. On the other hand, the enthalpy of the unfolding process can be independently measured by integrating the calorimetric peak in the DSC scan of the protein. The criterion for the applicability of the two-state thermodynamic folding model is the coincidence of the values produced by both means [10]. The model is useful not only for its simplicity, but by considering the relatively large heat capacity difference between the folded and unfolded protein states, it predicts the phenomenon of cold denaturation [11]. The significance and the applicability of the thermodynamic two-state model were widely discussed in the literature [12,13,14,15,16,17]. Importantly, the thermodynamic two-state model is often misused, e.g., when the entropy for unfolding is calculated from the calorimetric enthalpy of unfolding without verification that the unfolding equilibrium is established.
A classic example of a protein following a “two-state” folding equilibrium is hen-egg lysozyme [10], which nonetheless folds via intermediates in water [18,19,20]. An intermediate was also observed during the folding of lysozyme in glycerol [21]. Molecular dynamics reveals that intermediate states are populated during the unfolding of lysozyme [22]. The addition of some organic cosolvents causes a deviation between the transition temperatures of the disruption of the tertiary protein structure and the unfolding temperature from calorimetry [23,24], implying the existence of an intermediate structure. Thus, a two-state behavior under equilibrium conditions must be compatible with both the folding funnel concept and the observed kinetic intermediates.
So, one may ask, what is the thermodynamic criterion that makes kinetic folding intermediates “hidden” in the folding/unfolding equilibrium? We discuss possible models for an apparent two-state folding equilibrium with hidden intermediate states and the thermodynamic restrictions on the properties of such intermediates. Particular attention is given to the intermediate states in the folding of lysozyme. The paper is laid out as follows: Section 2 describes the calorimetric unfolding curves for a two-state and non-two-state system in equilibrium and non-equilibrium conditions, Section 3 relates the models to the experimental observations of proteins and discusses the thermodynamic restrictions on the properties of “hidden folding” intermediates.

2. Theoretical Unfolding Curves

2.1. Equilibrium Calorimetric Curves with More than Two States

Consider the transition from the native form I1 to the unfolded protein I2 (reaction 1) and the transition with an intermediate I3 (reaction 2):
I 1 I 2 ,
I 1 I 3 I 2
Below, we show how variations in the equilibrium transition temperatures (Teq), enthalpies (ΔH(Teq)), and heat capacity steps (Δcp(Teq)) influence the calorimetric curves observed in the denaturation region. These parameters entirely describe the temperature dependences of the Gibbs energy of each transition and I1I3 fractions, considering that ΔS(Teq) = ΔH(Teq)/Teq.
An example of the curves computed for the two-state system referenced to the lowest enthalpy “folded” state ( T e q I 1 I 2 = 50 °C, H ° T e q I 1 I 2 = 500 kJ/mol, c p I 1 I 2 = 10 kJ/mol·K) and a three-state system with an additional state I 3 ( T e q I 3 I 2 = 50 °C, H ° T e q I 3 I 2 = 250 kJ/mol, c p I 3 I 2 = 5 kJ/mol·K) is presented in Figure 1. The procedure for creating the curves is described in Appendix A.
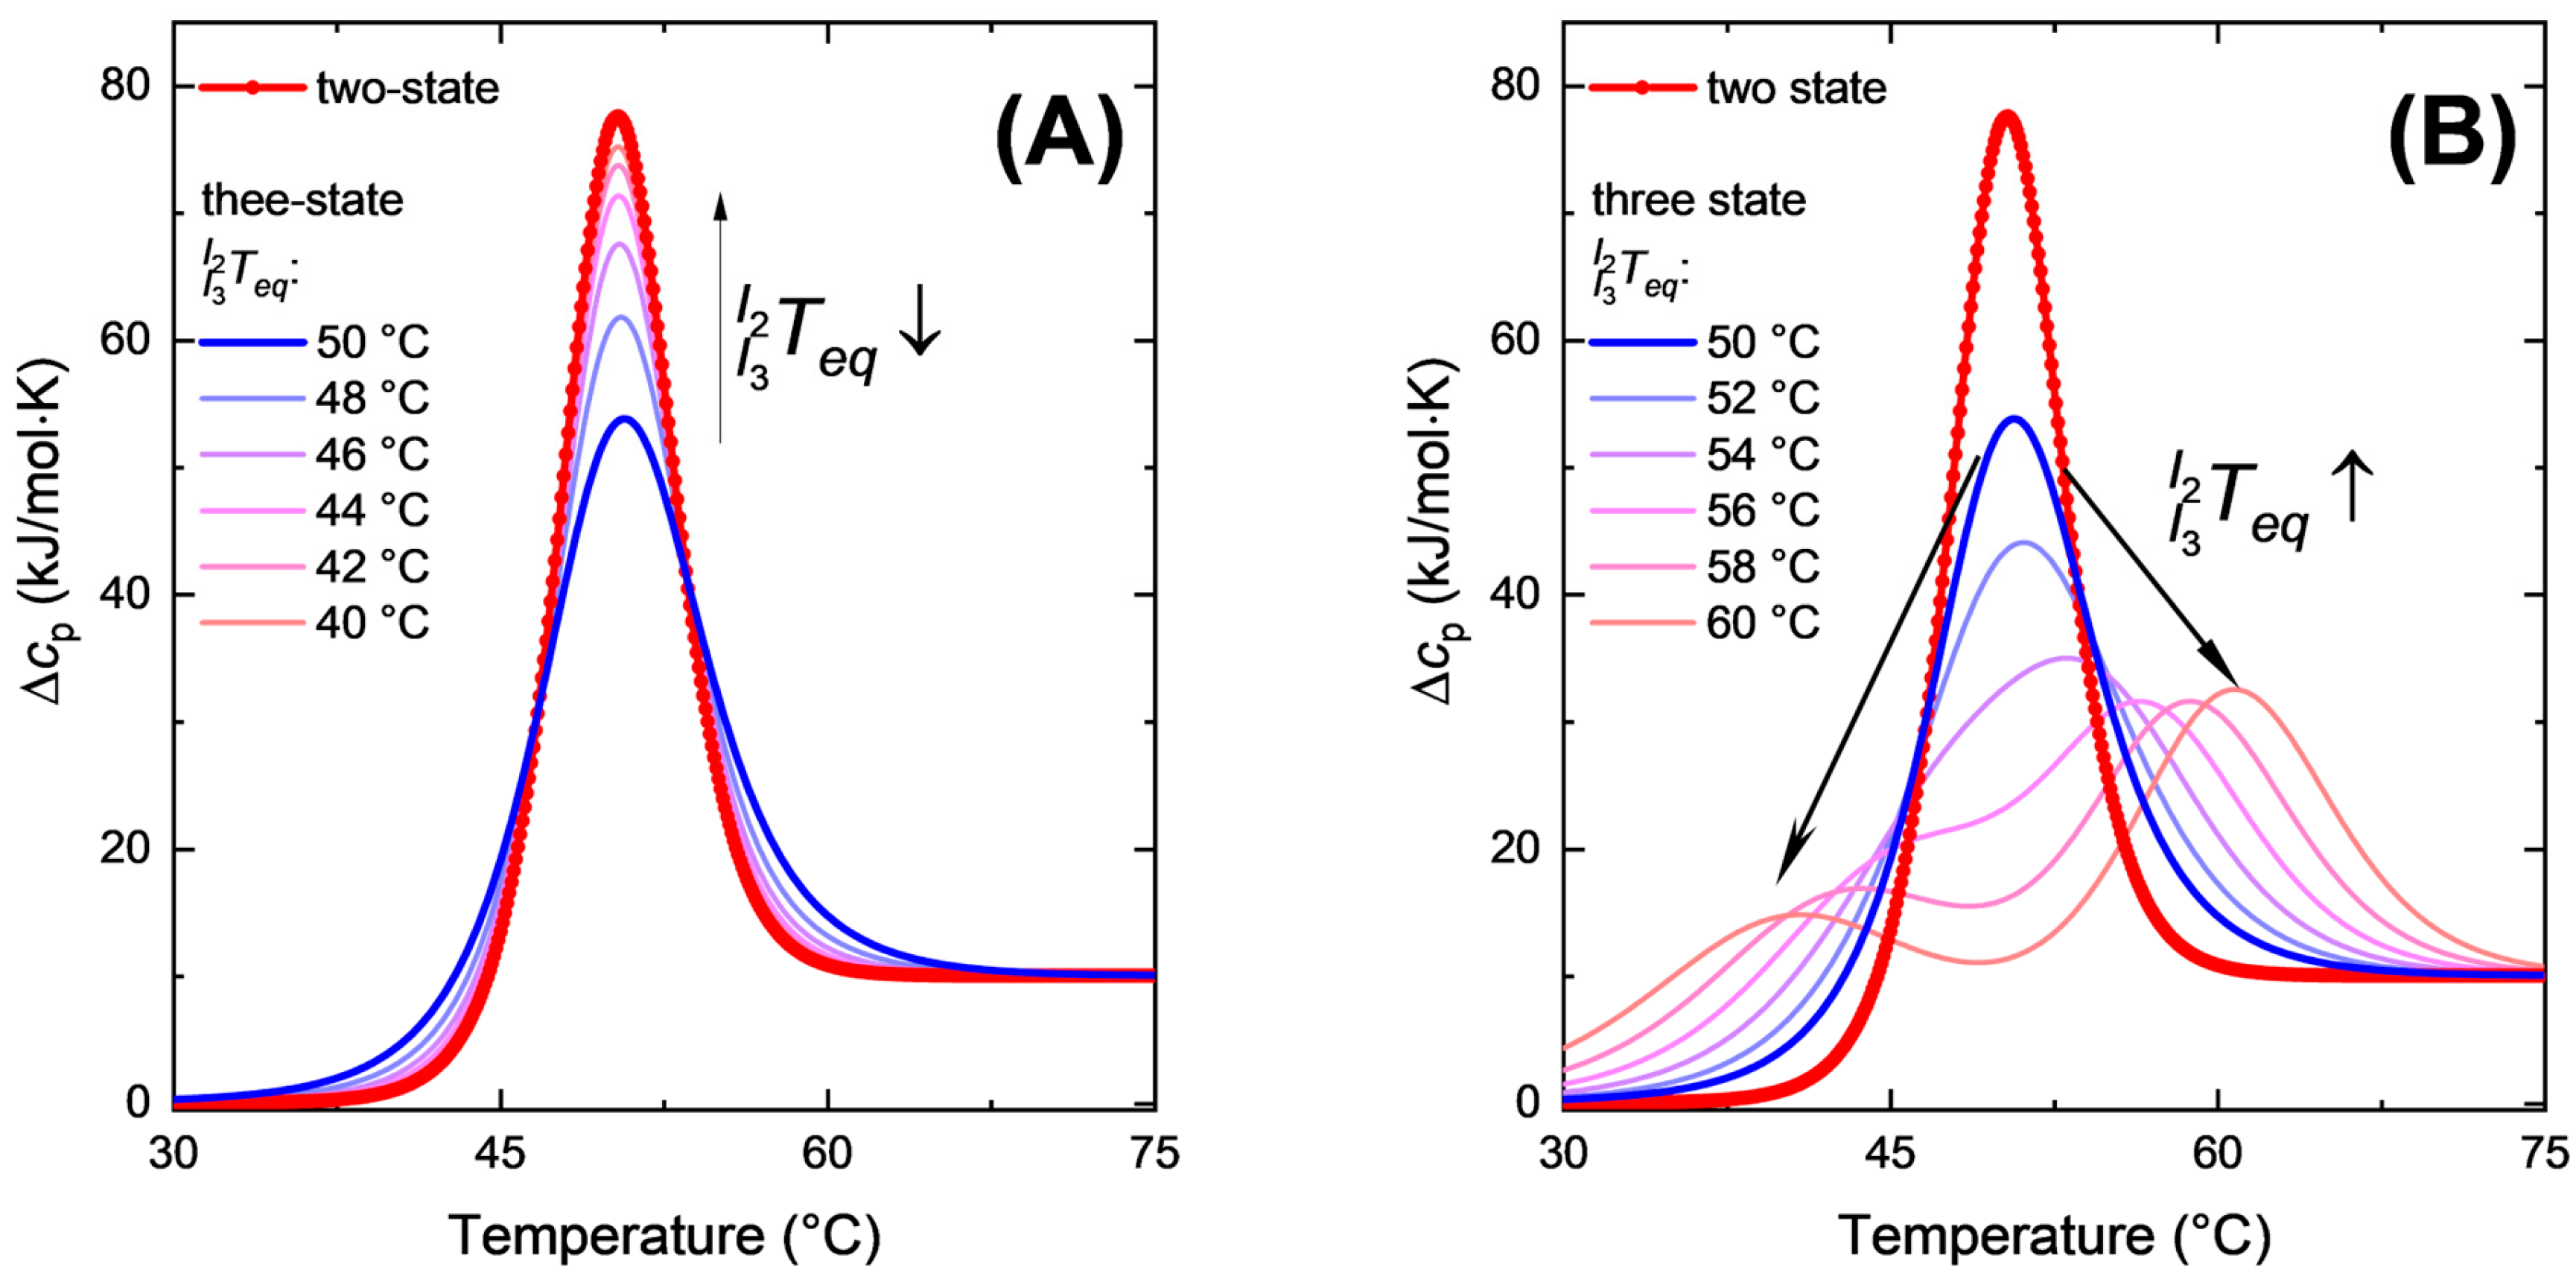
The resemblance between the equilibrium DSC curves for two- and three-state systems primarily depends on the fraction of I3. The amount of the additional state will be lower if its free energy is higher. This is equivalent to setting T e q I 3 I 2 lower, i.e., increasing the intermediate entropy relative to the native form with the enthalpy being constant. With decreasing T e q I 3 I 2 the three-state curve progressively approaches the two-state one (Figure 2A). On the contrary, if the additional state has lower free energy, i.e., its T e q I 3 I 2 is higher, its amount becomes higher in the temperature range near the transition. This results in a wider peak, which separates into two peaks if the additional state is stable enough to produce an appreciable concentration in the transition temperature region (Figure 2B).
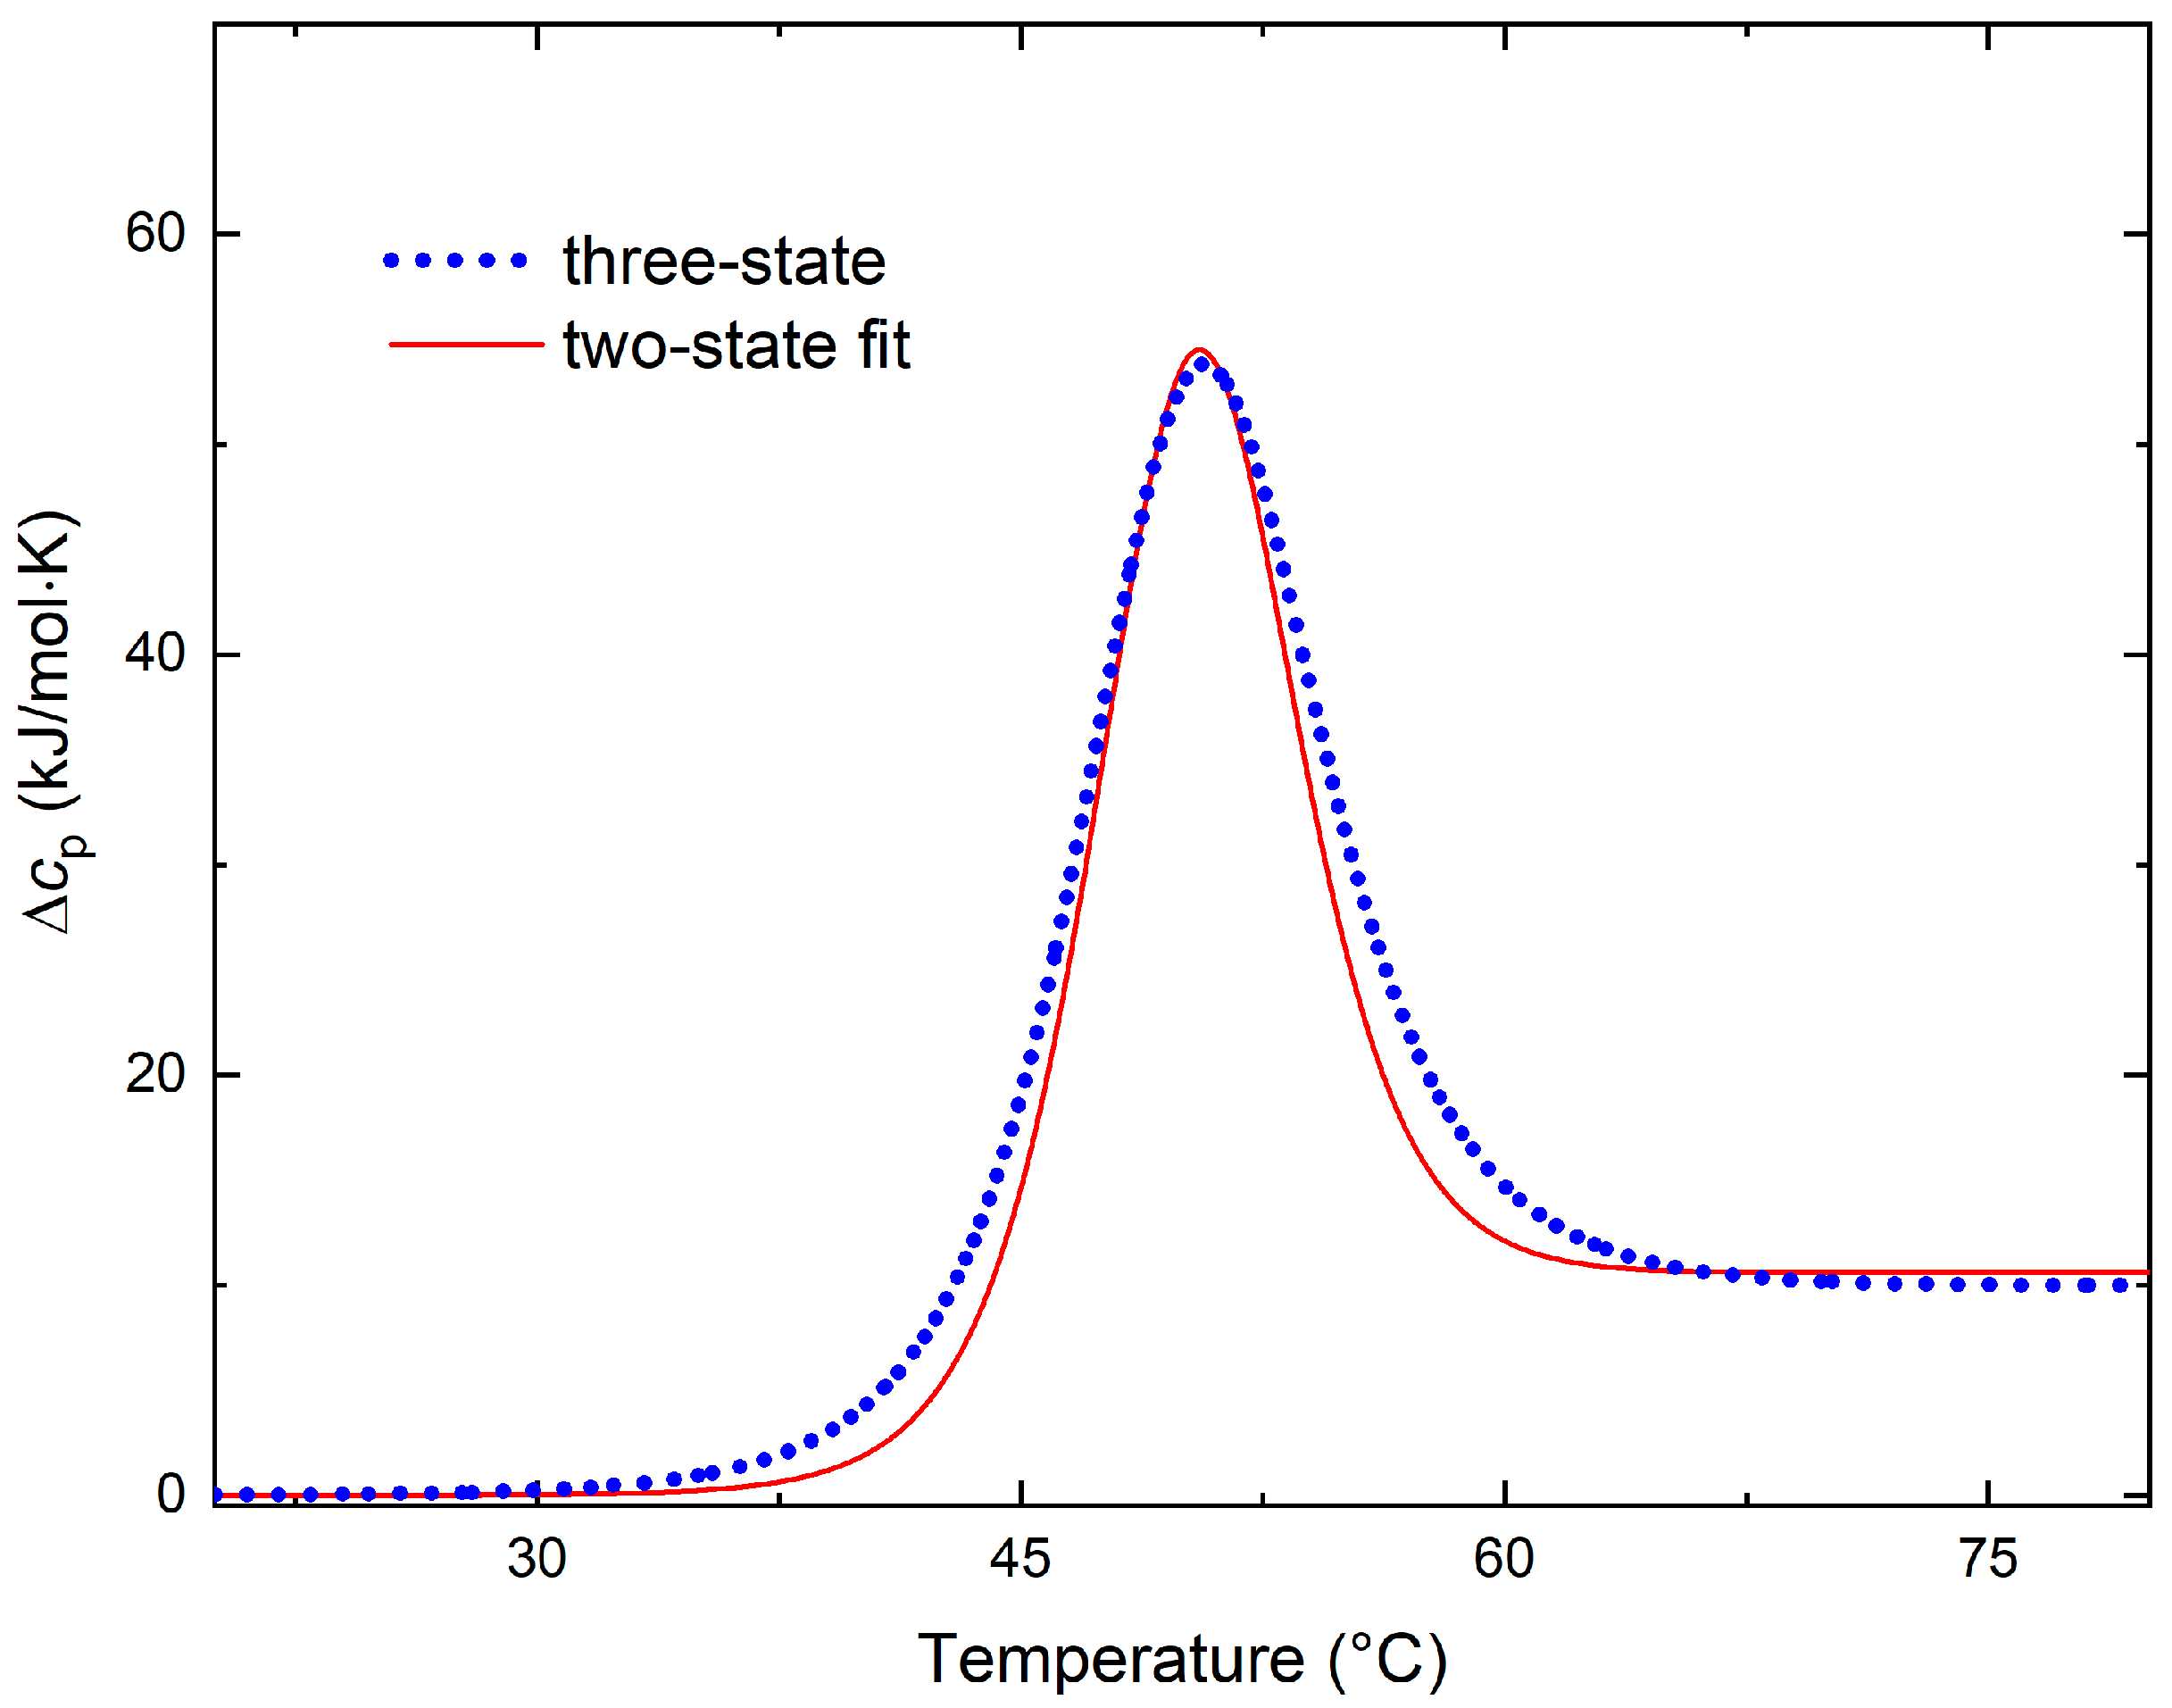
If an additional state has an enthalpy far from either of the other states and its population in the transition temperature region is significant, employing the calorimetric criterion allows one to distinguish such a system from the two-state one. The best fit of the calorimetric curve of the three-state system from the example in Figure 1 with a two-state model produces the value of the apparent unfolding enthalpy that is lower than the calorimetric enthalpy (Figure 3). The fit curve was generated by the same procedure as described above for curve generation, with T e q I 1 I 2 , H ° I 1 I 2 , and c p I 1 I 2 set as variable fit parameters.
The three-state curves become closer to a two-state one if the enthalpy of a third state is closer to either of the other states. In this case, the application of the calorimetric criterion alone may not be fruitful.
The heat capacity difference between states must be specified to generate the three-state curves in a wider temperature range. A reasonable value of the heat capacity difference can be chosen by setting it proportional to the enthalpy difference between the states (see Appendix A). Another option is setting the heat capacity difference proportional to the entropy difference. However, the shapes of the curves computed by either option are nearly the same in the transition temperature range, and either choice results in the same overall behavior.
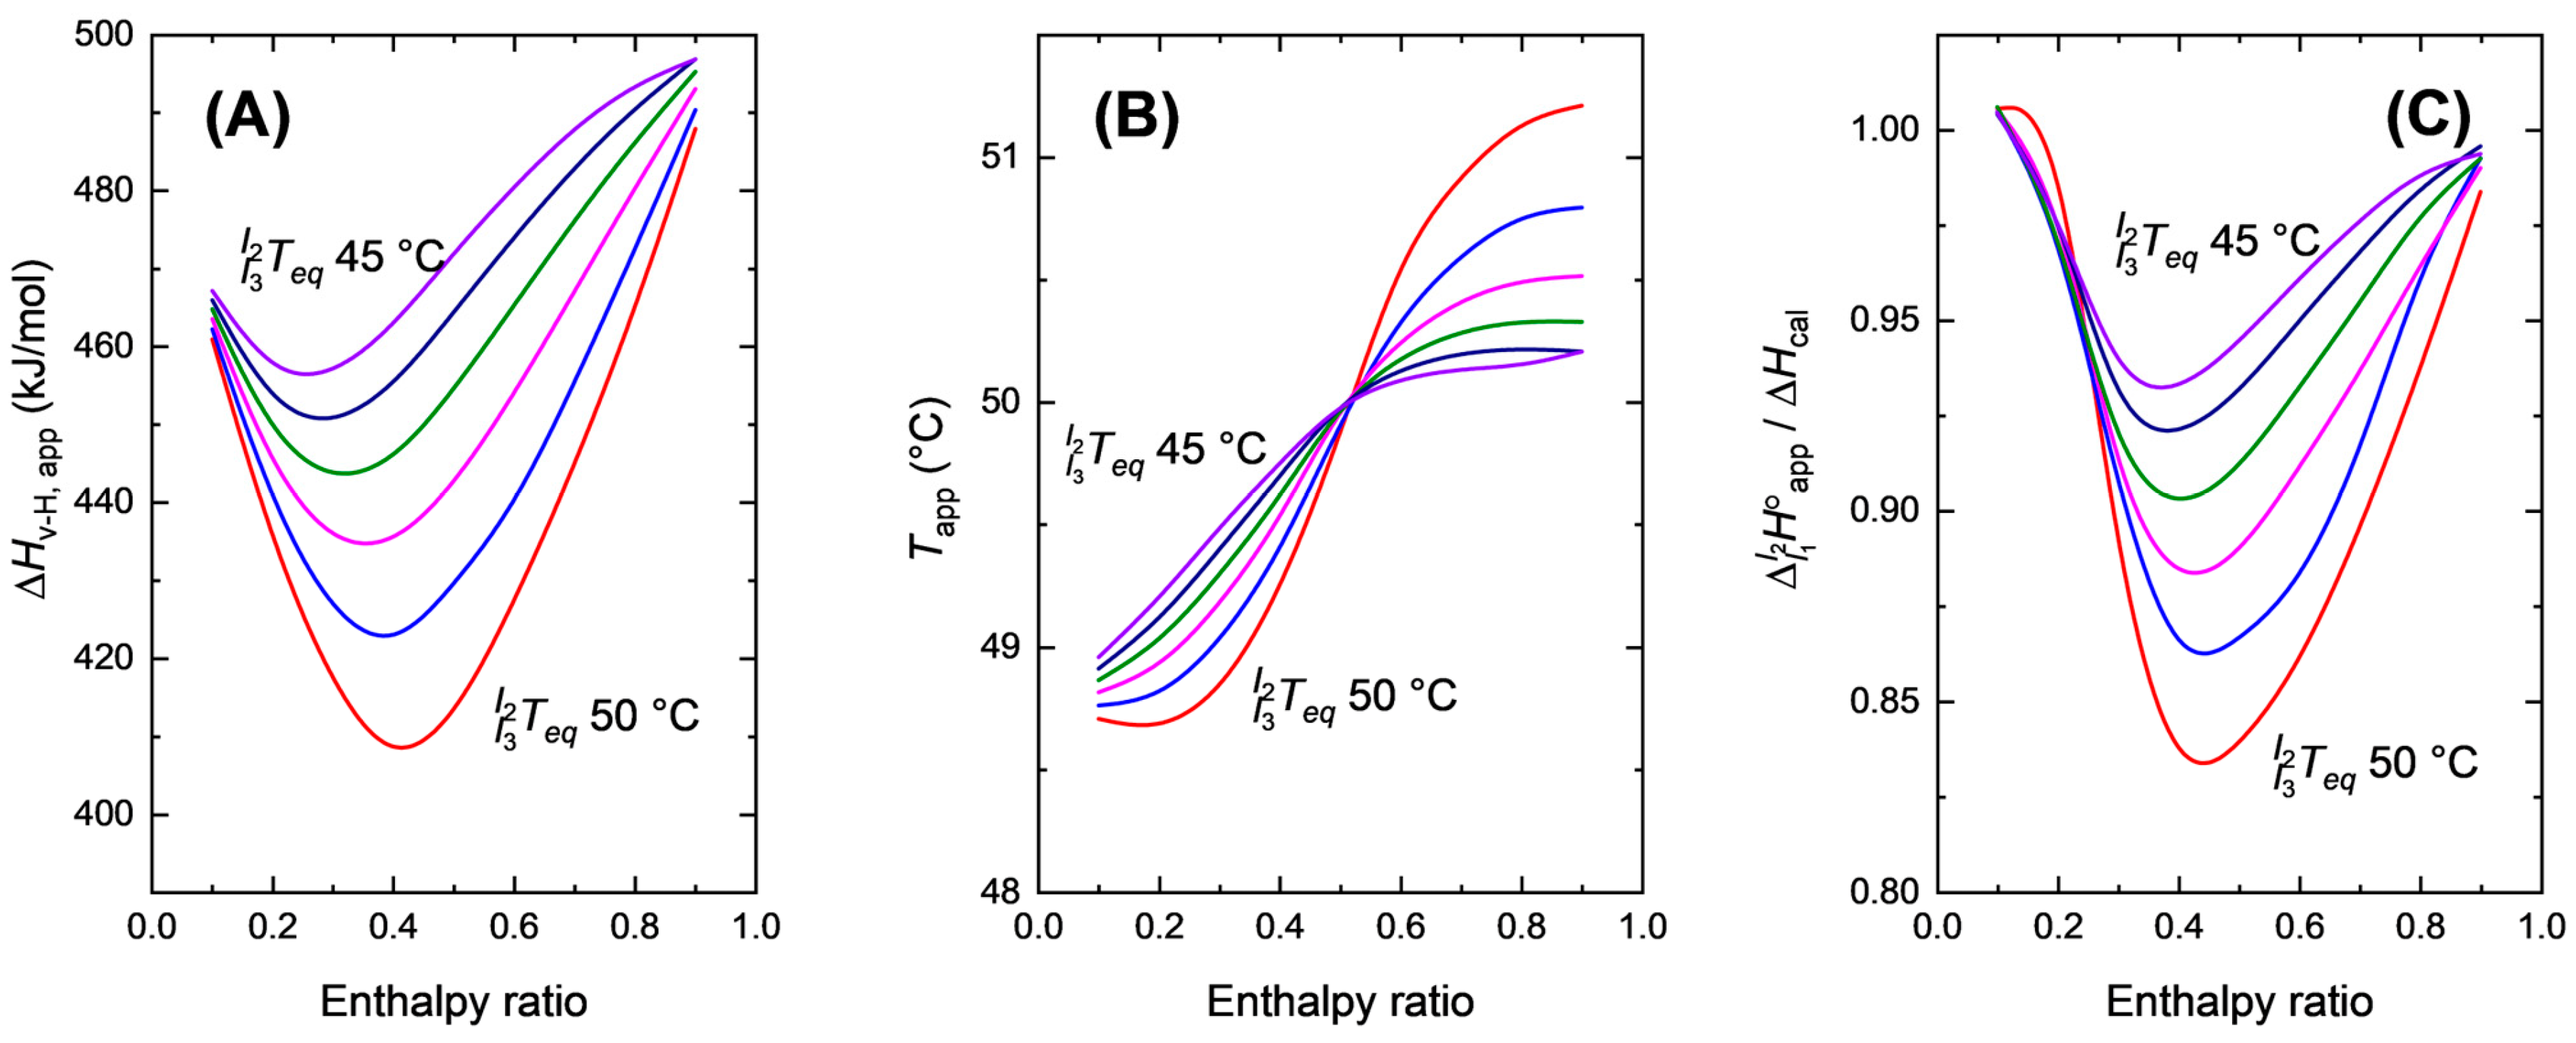
The apparent parameters of the two-state fit of the theoretical calorimetric curves generated for a three-state system with different properties of a third state and the two “major” states, as in the previous examples, are presented in Figure 4.
As can be seen from Figure 4C, the calorimetric criterion is reasonably satisfied ( H ° I 1 I 2 a p p / H c a l > 0.9) in the entire range of possible enthalpies of an additional state if it has a low enough T e q I 3 I 2 .
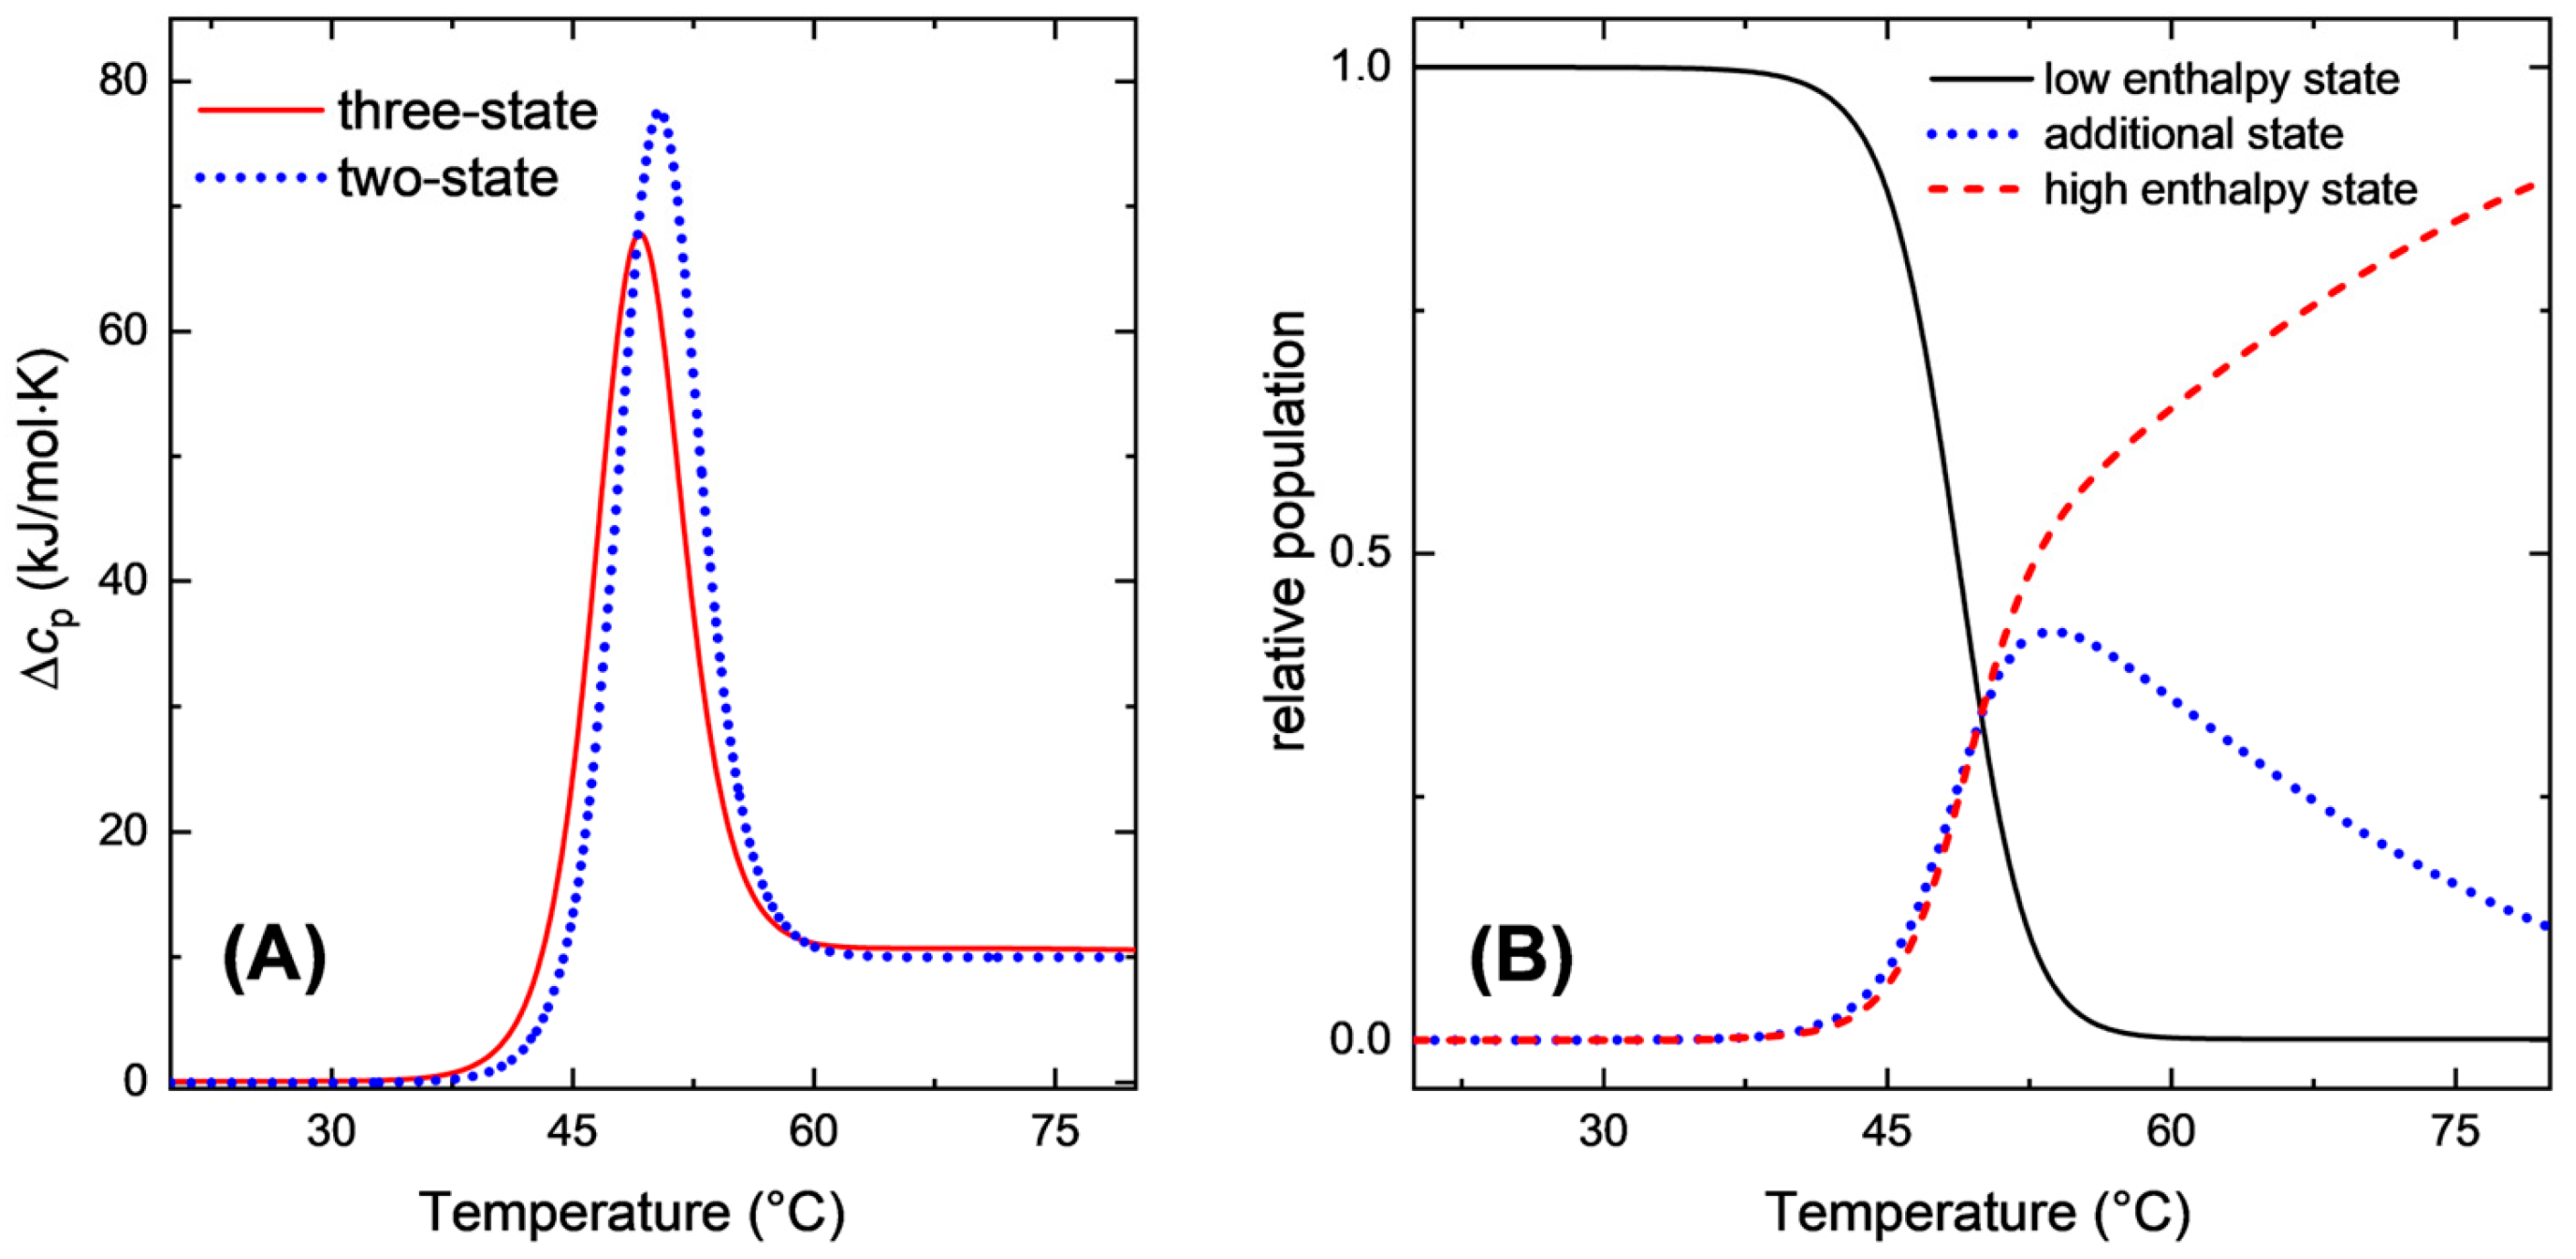
An important behavior is observed when the additional state has an enthalpy that is close to any of the “major” states. If the enthalpy of an additional state is close to that of the high enthalpy, i.e., “unfolded” state, the three-state curve deviates quite significantly from the two-state curve both in the area of the peak and the peak temperature (Figure 5, left). However, the resulting curve can be excellently fitted with a two-state model. This behavior is a result of the low enthalpy difference between the two high enthalpy states, so the corresponding equilibrium constant does not change much with the temperature, and a significant population of the additional state is present over a wide temperature range above the calorimetric peak (Figure 5B). The enthalpy uptake caused by the conversion between the states is spread over a large temperature region and “looks” like a constant excess heat capacity. The apparent fit parameters ( H ° I 1 I 2 a p p = 461 kJ/mol, H C a l = 460 kJ/mol, T e q , a p p I 1 I 2 = 48.7 °C, c p ,   a p p I 1 I 2 = 10.6 kJ/mol·K) are quite different from the thermodynamic parameters of the states used to produce the three-state theoretical curve. In this situation, there is no practical means of distinguishing a three-state system from a two-state one based on the calorimetric data alone, especially considering experimental limitations due to instrument noise, baseline quality, etc., so other methods should be used to determine the presence of additional stable conformations.
Similarly, when the enthalpy of the additional state is close to that of the low enthalpy, i.e., “folded” state, the theoretical three-state curve can be excellently fitted by a two-state one. The apparent parameters are close to the “real” properties of the transition between the two “major” states. In such systems, the population of the additional state is significant in the temperature range below the calorimetric peak.
Finally, an additional state may have both lower enthalpy and T e q than the “main” low enthalpy state. If T e q is sufficiently low, the population of the additional state is negligible, and the calorimetric curve converges to a two-state behavior. However, at low temperatures, as the entropic contribution diminishes, the population of the additional state will increase.
It must be noted that the three-state equilibrium was chosen only for its simplicity, and the model can be generalized to an arbitrary number of states, following Equation (A6), with the same results. That is, an intermediate is not populated under equilibrium during the temperature change if its T e q is lower than that of the native state.

2.2. Kinetic Behavior

The equilibrium calorimetric curves are not affected by a particular kinetic pathway of the conversion between the states. The kinetic pathway must be determined in a separate experiment. At the same time, the kinetic parameters must be compatible with the thermodynamic model. Considering that perfectly equilibrium conditions require an infinitesimally slow heating rate, here we evaluate the behavior of the model system under various heating rates, taking the kinetics of the transitions into account.
For a two-state equilibrium model, the apparent activation energy is E a , a p p = k 1 E a , 1 + k 1 E a , 1 k 1 + k 1 , where k 1 and k 1 are the rate constants of the forward and reverse reactions, E a , 1 and E a , 1 are the activation energies of the forward and reverse reactions. If the forward reaction represents the unfolding process, E a , 1 must be greater than the unfolding enthalpy in a true two-state equilibrium. At temperatures above the calorimetric peak of unfolding, i.e., when k 1 >> k 1 the apparent activation energy will tend to the value of the forward reaction.
For example, in the case of the folding intermediate, the overall equilibrium can be described by the following kinetic scheme:
I 1 k 1 k 1 I 3 k 2 k 2 I 2 .
The kinetic parameters must be chosen to be compatible with the equilibrium thermodynamic parameters.
When the conversion between the native and unfolded states takes place under conditions far from equilibrium, the process can be viewed simply as a sequential irreversible reaction, i.e.,:
I 1 k 1 I 3 k 2 I 2
where I1 and I2 are native and unfolded states, or vice versa, depending on whether the process is folding or unfolding. Different apparent activation energies may be determined depending on the technique used for monitoring the reaction. If the analytical technique only detects the population of the I1 species, the apparent activation energy of the process will tend to d ln k 1 / d T , and that may be lower than H ° I 1 I 2 . If the analytical technique only detects the population of the I2 species, the apparent activation energy of a process will be an effective value depending on both constants. If one rate constant is far greater than the other, the apparent activation energy will tend to the value corresponding to the larger rate constant.
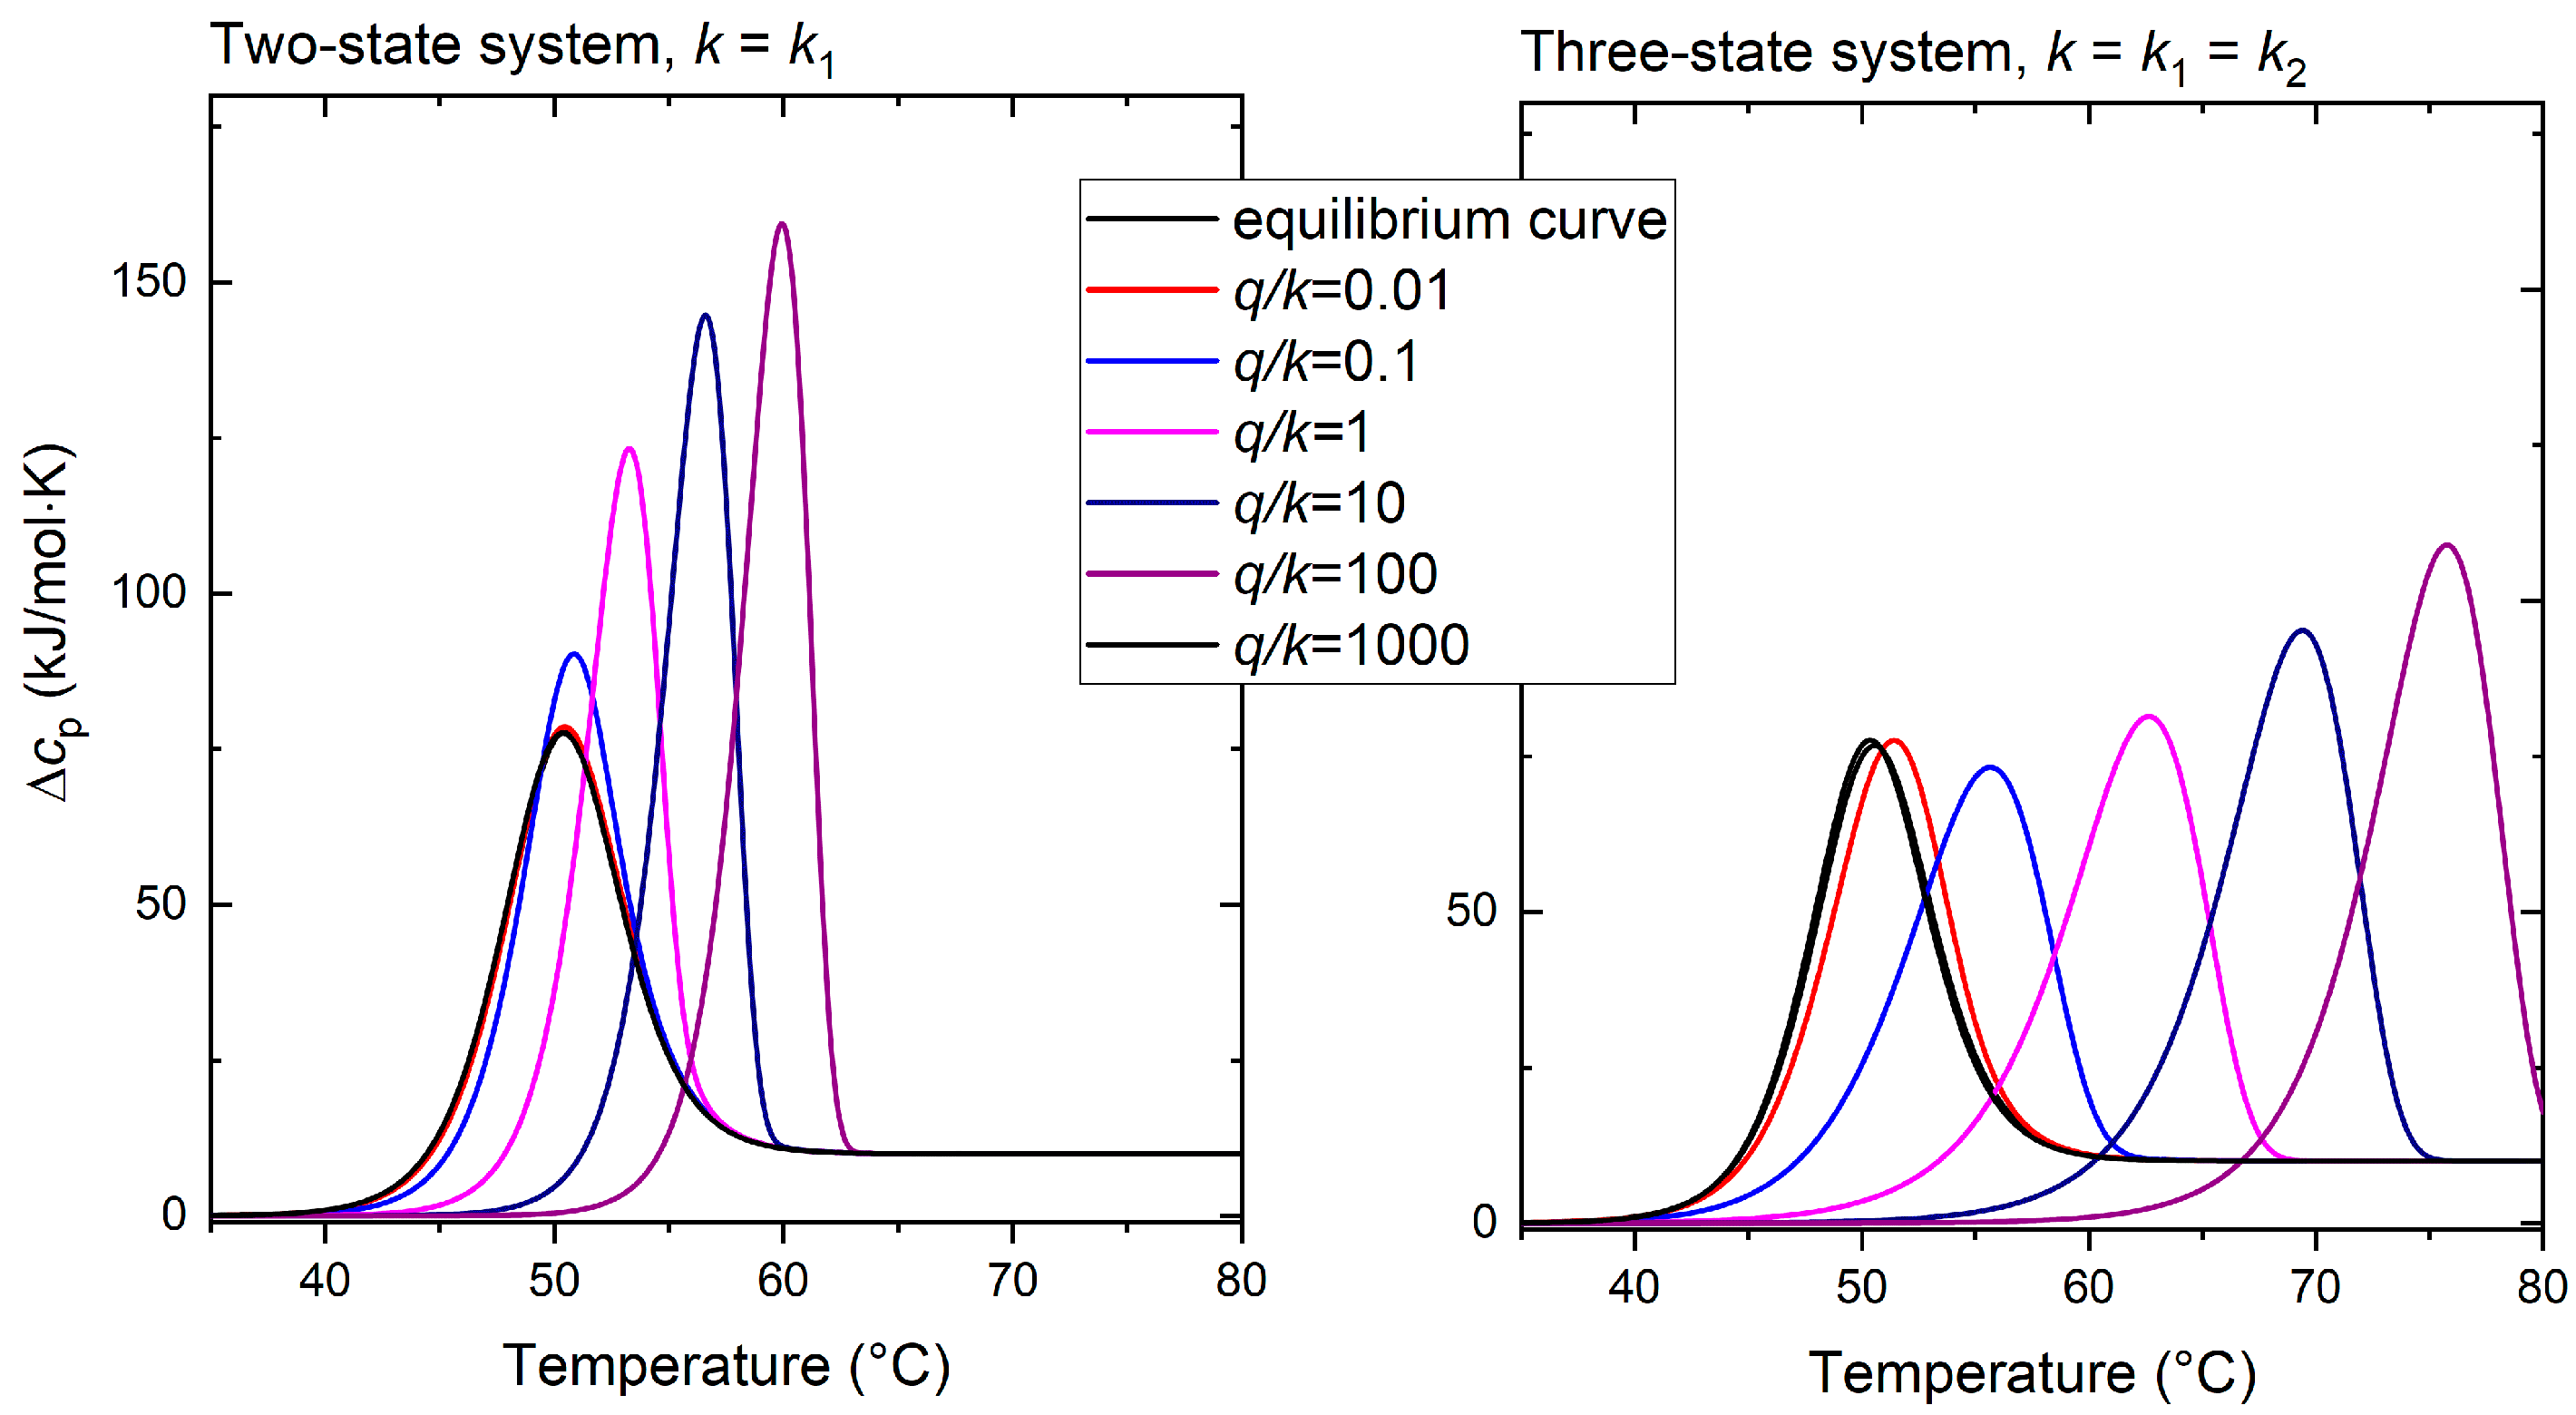
In the case of scanning calorimetry, when the temperature scanning rate is high enough that the population of states deviates from the equilibrium, the shape of the calorimetric curve becomes affected by the kinetics of the transitions taking place [25]. The numerically calculated scanning curves of the two-state system and three-state system with “hidden” intermediate (which follows reaction 4) are presented in Figure 6. The procedure for creating the curves is described in Appendix A. A lower activation energy of the conversion of the low enthalpy (folded) state into an intermediate in the case of a three-state system results in a more pronounced variation in the position of the calorimetric peak with increasing scanning rate.
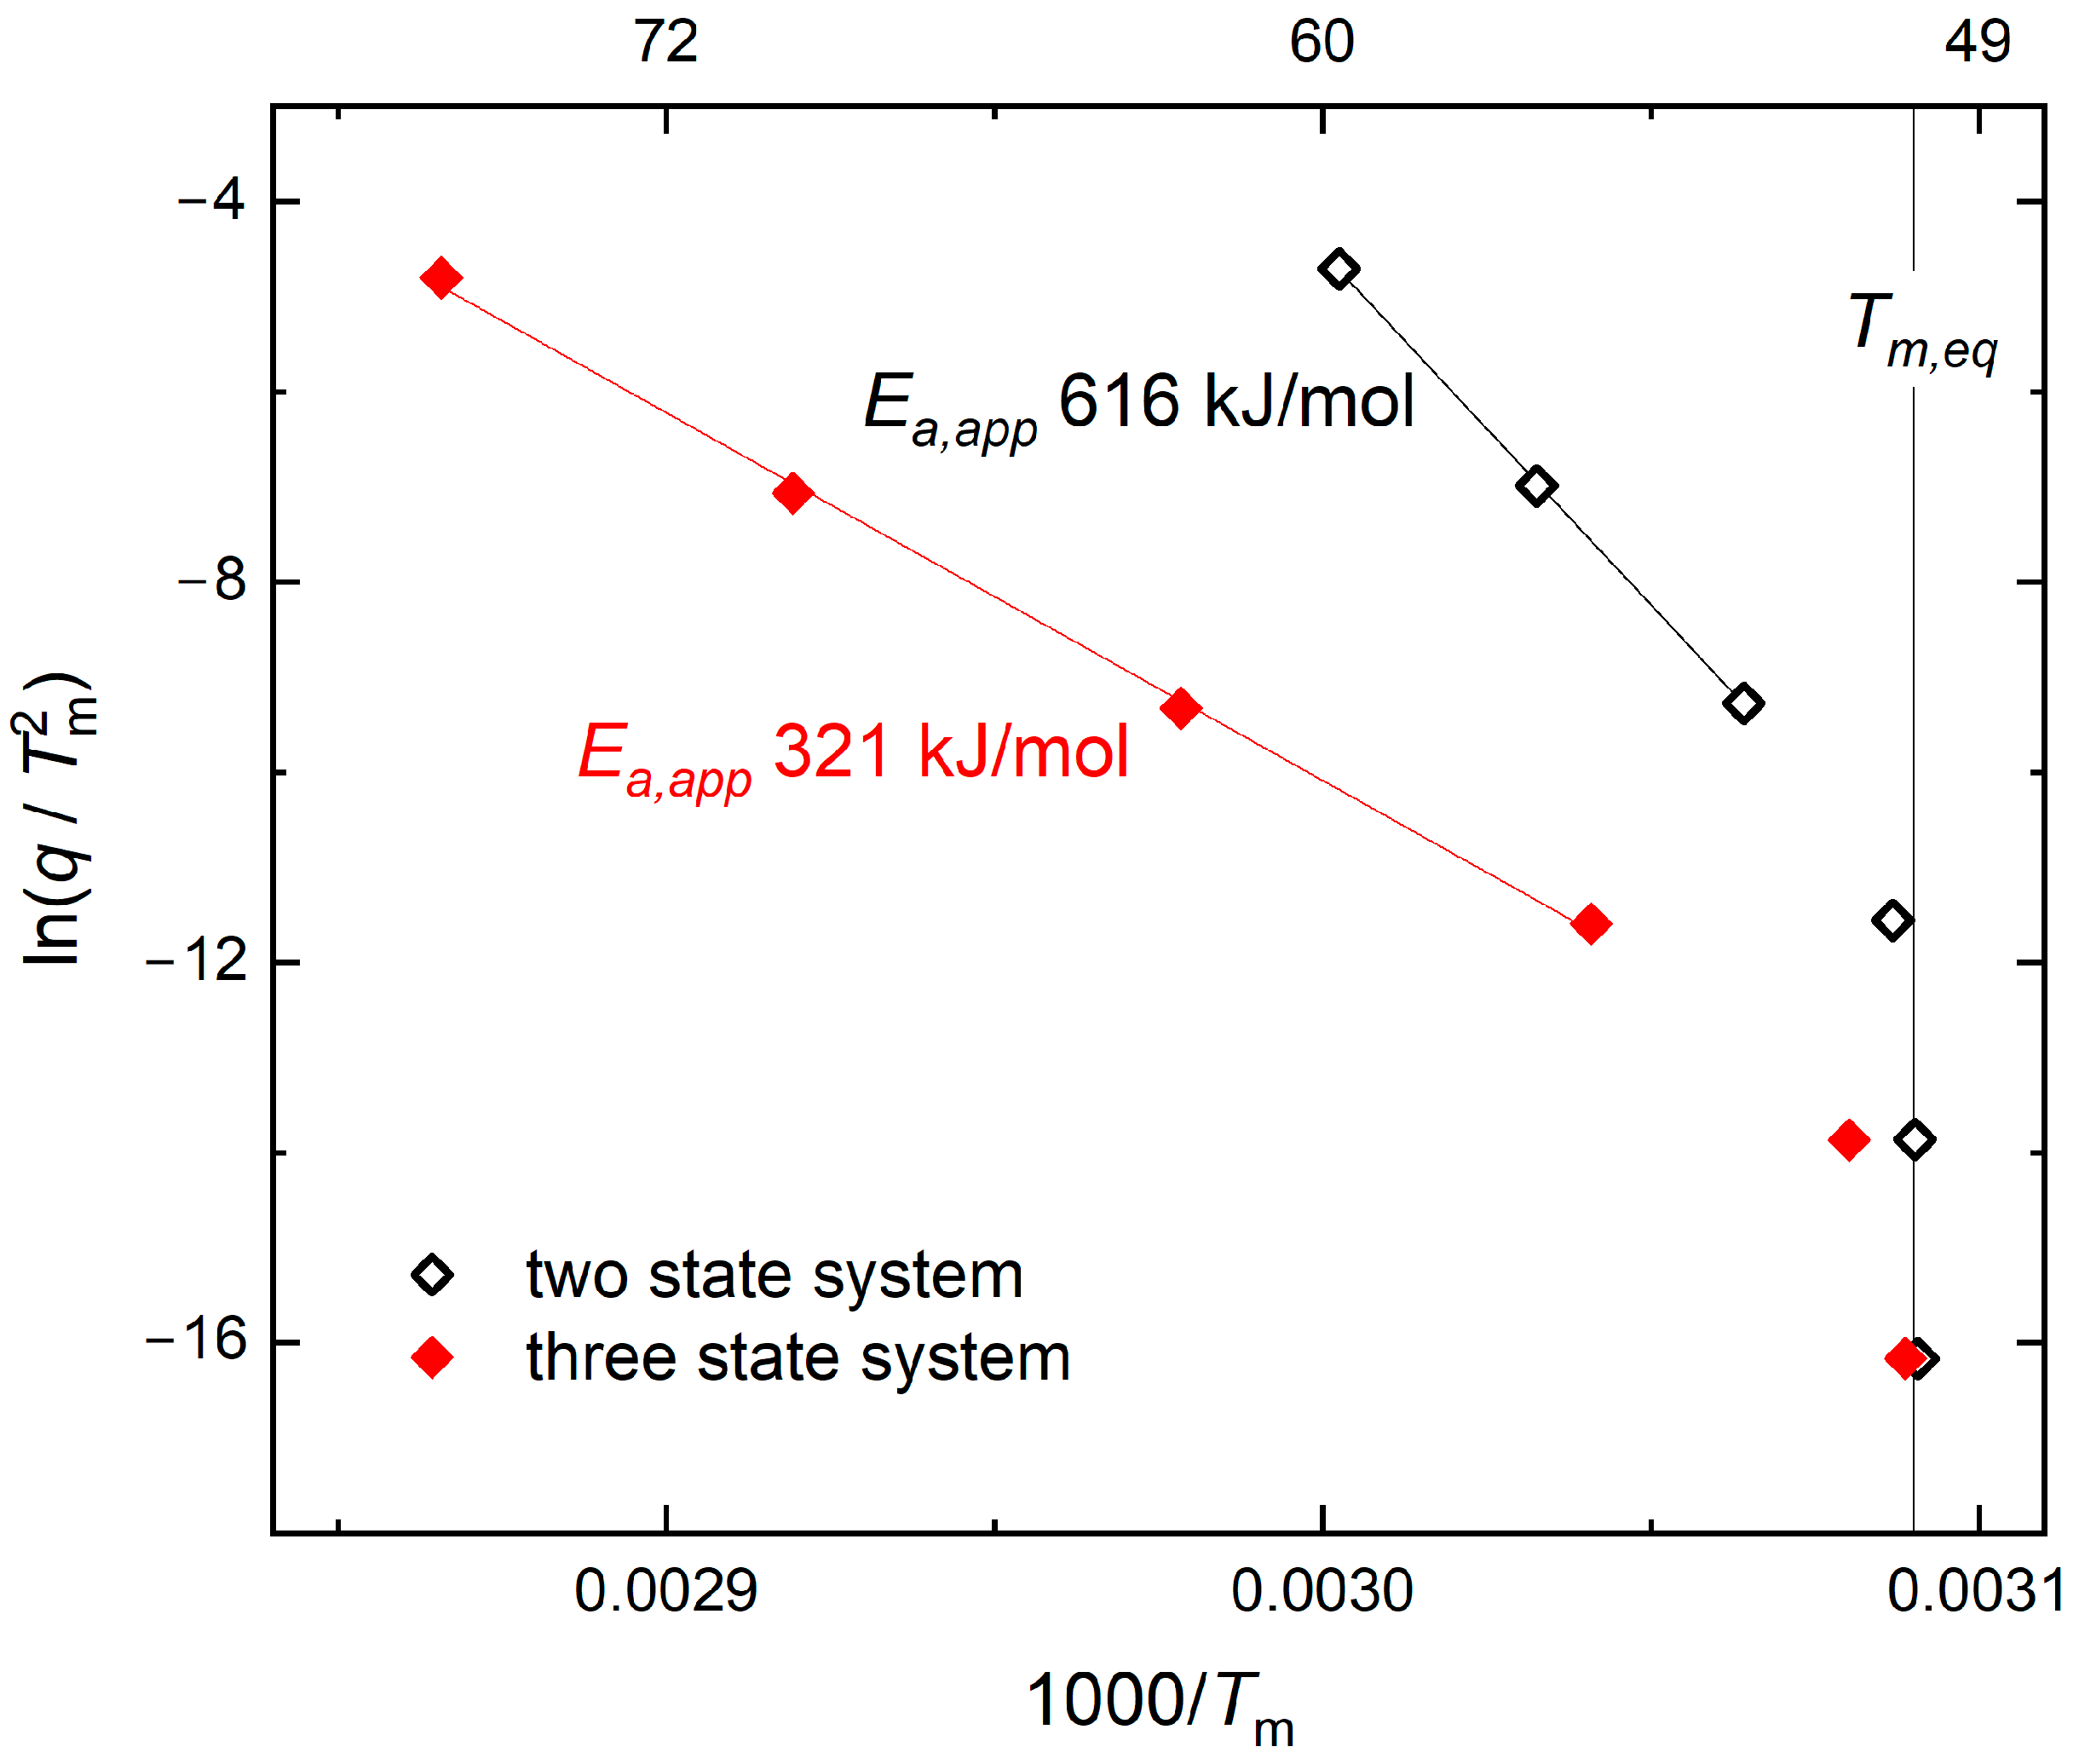
The apparent kinetic parameters determined from the scan rate dependence of the calorimetric curves tend to the corresponding model values. For example, the dependence of the position of the calorimetric peak on the scanning rate on a Kissinger plot is shown in Figure 7. The slope of the linear dependences on the Kissinger plot allows estimating the apparent activation energies of the processes [26,27]. There is an abundance of approaches for determining the kinetic parameters of processes from calorimetric curves [25,28], which is beyond the scope of the current paper. However, it must be noted that the shape of a calorimetric curve recorded in a kinetic regime will approximate that of a single-step kinetic reaction if the population of a kinetic intermediate is low.

3. Practical Considerations

Here we briefly discuss the practical evidence for hidden, i.e., not populated, folding intermediates under equilibrium conditions.

3.1. Kinetic Aspects

Inferring the folding energy landscape is notoriously difficult [29]. Typically, folding intermediates are detected in kinetic experiments. There is a large arsenal of techniques with fine enough time resolution to detect folding intermediates [30]. These provide relative populations as a function of time, from which the rate constants and relative free energies of states can be calculated. Indirect evidence for the existence of intermediates in the unfolding process (and by microscopic reversibility in folding) is the observation that the apparent activation energy of unfolding is lower than the corresponding enthalpy. This was shown in the case of lysozyme in water and water-DMSO mixtures [24] as well as in pure glycerol [27] by both spectroscopic and calorimetric techniques. The apparent activation energy of unfolding, if available from DSC data, appears to be a useful indicator for the existence of kinetic intermediates, as kinetic experiments are usually more labor-intensive. Lyubarev and Kurganov [31] present a collection of data points from DSC investigations of irreversible protein denaturation. For 9 out of 13 presented single-domain proteins, the apparent activation energies of the process are significantly lower than the corresponding enthalpy. The authors considered only an irreversible unfolding that can result from either temperature scanning in the kinetic regime or secondary processes (chemical degradation, aggregation, etc.). However, for a single-step endothermic kinetic process, the condition that the apparent activation energy must not be lower than the process enthalpy must also hold. The development of fast scanning calorimetry opens the possibility for investigating protein unfolding at very high scanning rates [21,27,32], so rapid and reliable measurements of the activation energy of unfolding may become more accessible in the future.
The equilibrium enthalpy differences between the states are usually available only at sufficiently low scanning rates, either directly via DSC [33] or indirectly using spectroscopy [34]. The enthalpy of intermediates is usually accessible only if a significant population of those states exists at equilibrium, which is not the case for a two-state system. We have explored the refolding of lysozyme in glycerol and detected a folding intermediate [21] using a novel Fast Scanning calorimetry technique. The method allowed the apparent activation energy to be determined for the unfolding of an intermediate (ca. 140 kJ/mol). The value is about 100 kJ/mol lower than that of the folded state. Notably, the data provides the estimate of the enthalpy of the intermediate, which has to be no fewer than 80% of that of a folded state (so at least 400 kJ/mol for the intermediate vs. ca. 500 kJ/mol for the folded state). The activation energies of unfolding of both the folded and the intermediate states are about 250 kJ/mol lower than their corresponding enthalpies. This implies that there is at least another “hidden” intermediate in the folding mechanism of lysozyme of glycerol, which is in agreement with the folding mechanism of lysozyme in water, which includes rapid chain collapse and the formation of native and intermediate states via parallel pathways [35].

3.2. Cold-Denaturation

The “hidden” states may become populated under certain external conditions. Due to the large heat capacity change during folding, the free energy of the folded state has a minimum, typically near room temperature, and may become positive at low temperatures, which is known as cold-denaturation [3]. It is reasonable to assume that the heat capacity change is proportional to either an enthalpy or entropy change. If a “hidden” intermediate has a lower heat capacity difference with the unfolded state than the folded state, its population may become significant at low temperatures. Interestingly, the experiments on cold denaturation of lysozyme at elevated pressures revealed a reversible conformational change in the protein into a structure that is different from the one formed after denaturation at elevated temperatures [30]. The structure was found to be similar to the one formed during the early stages of folding, possibly that of a “hidden” intermediate.
Likewise, a “hidden” state will also become significant if the solvent reduces the entropic penalty for its formation. It is reasonable to assume that the stabilization of the normally “hidden” state can be a basis for the formation of the molten-globule structures [31] at least in some situations.

3.3. Thermodynamic Aspects

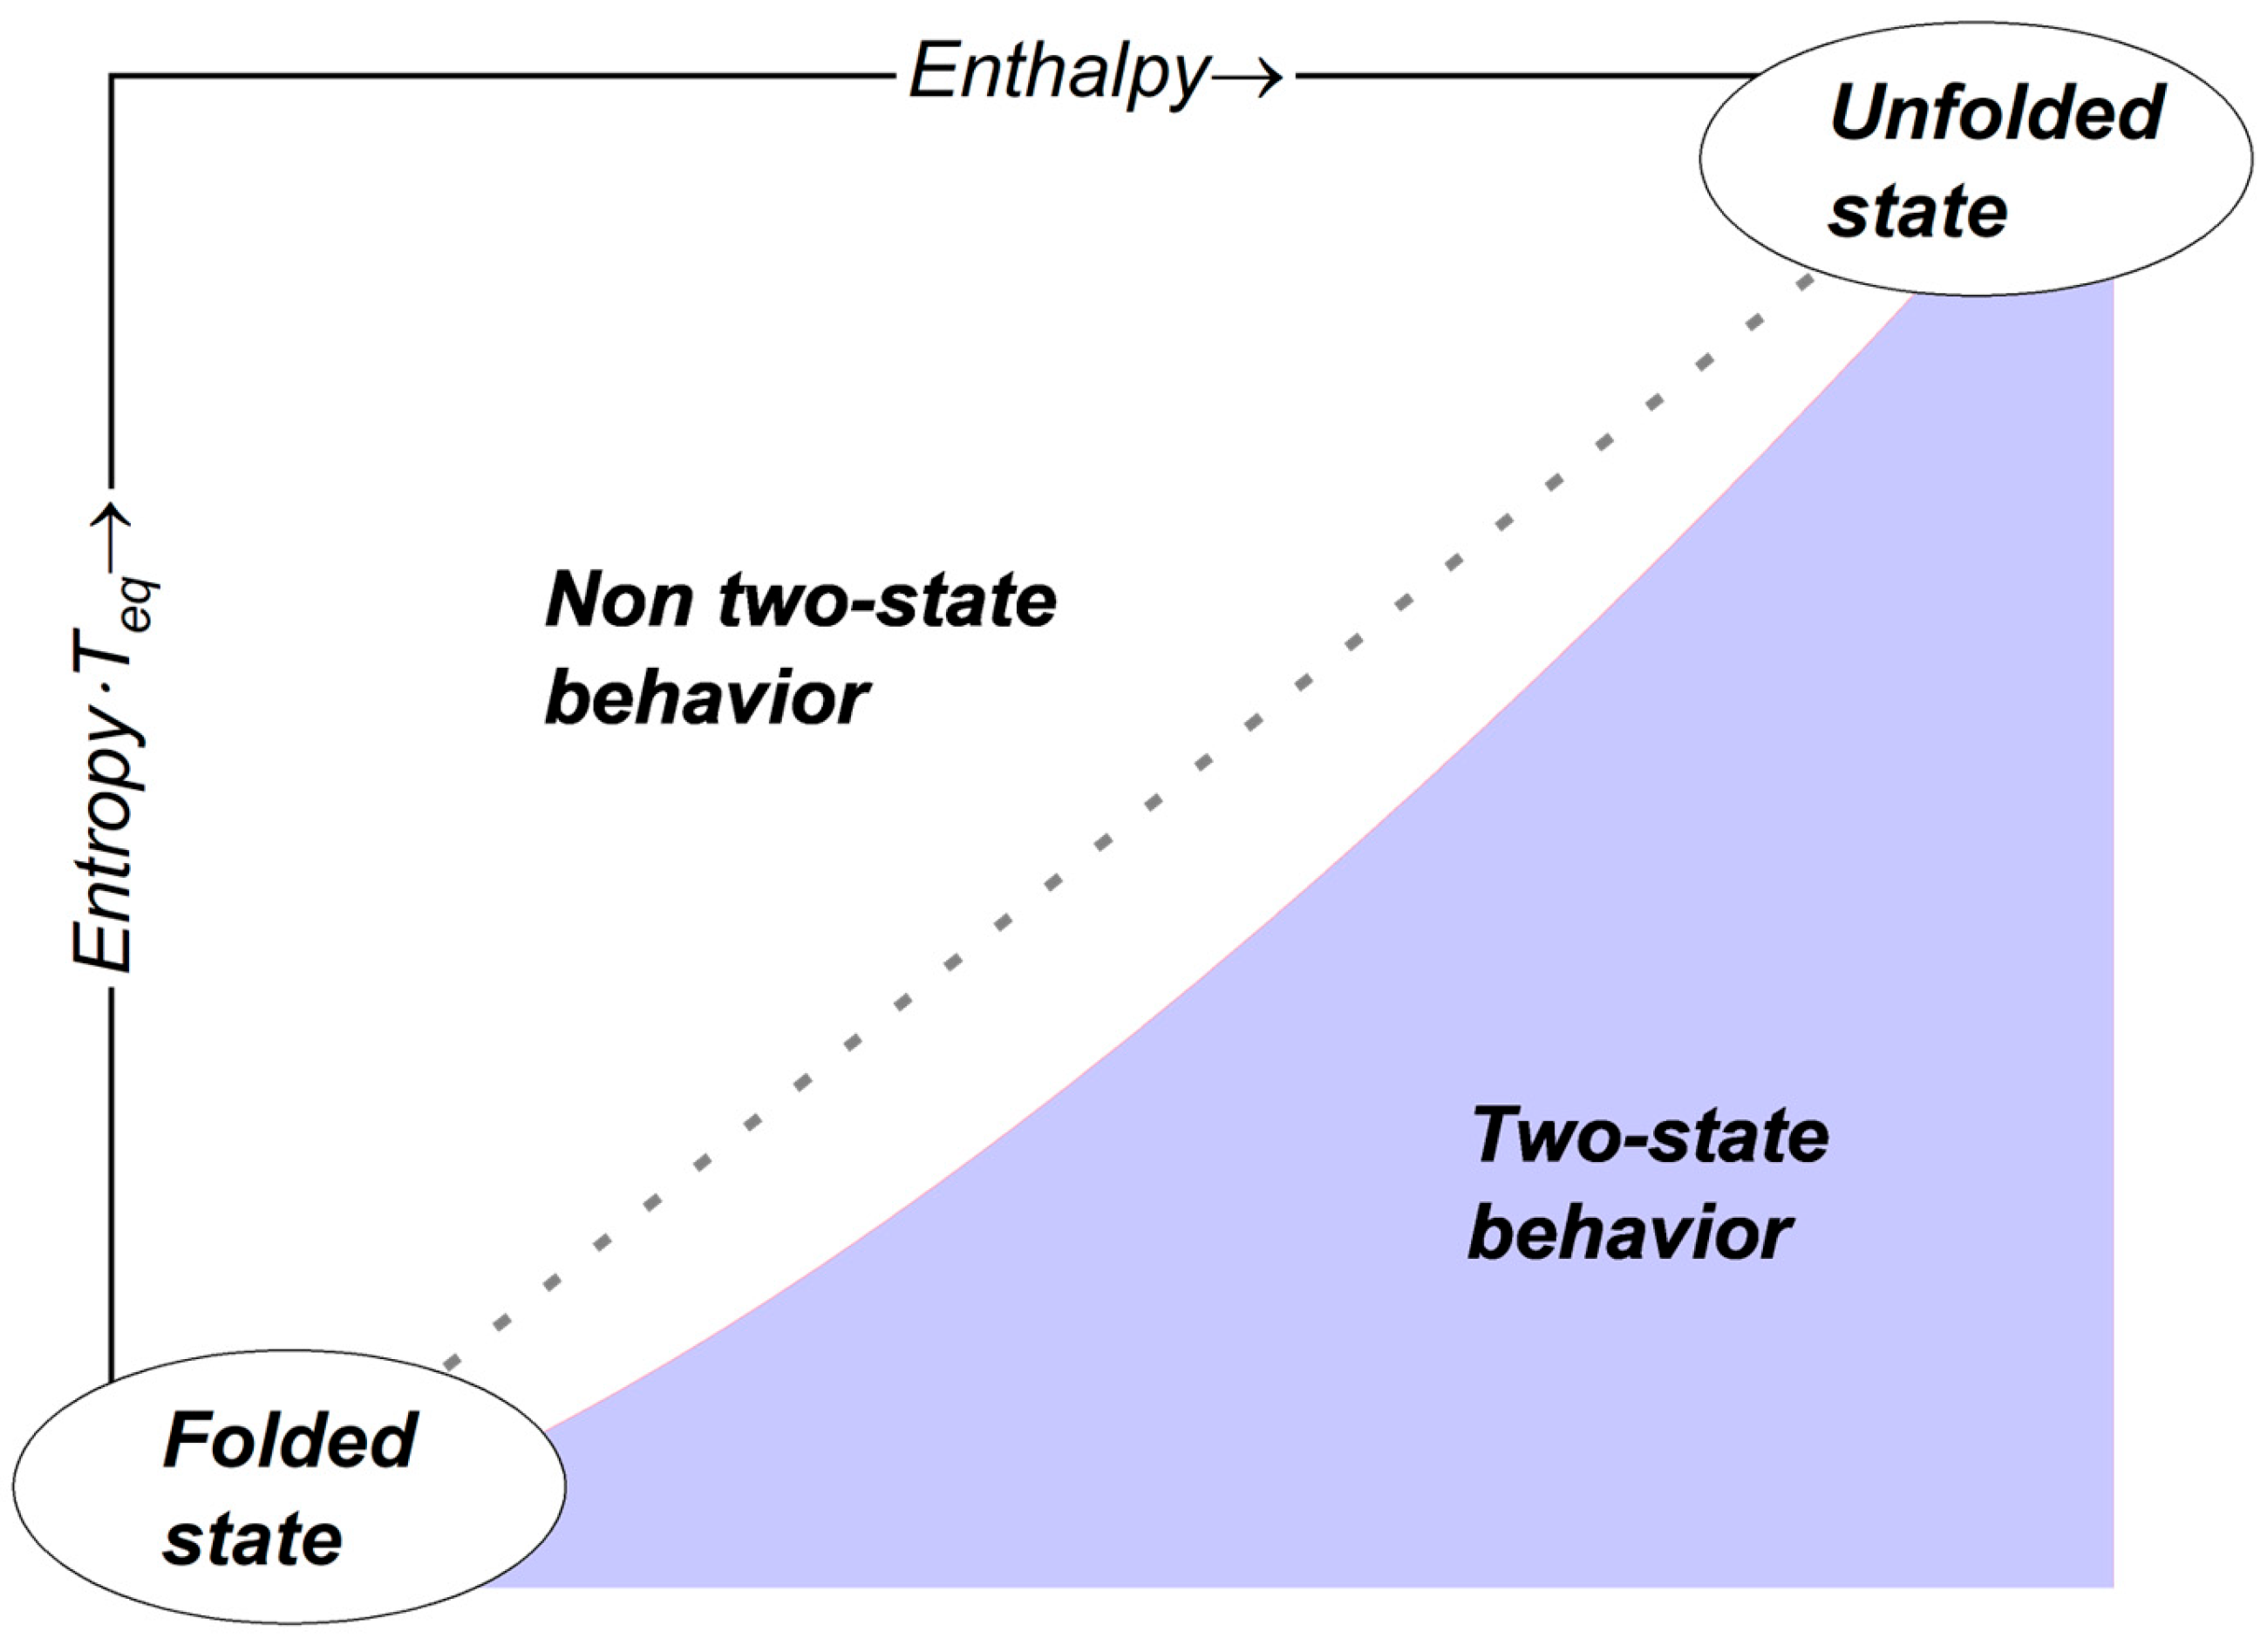
For the folding intermediates to be “hidden”, their thermal stability must be lower than that of the folded state over a wide temperature range. In the above description, the relative stability of the states was expressed as the temperature at which the free energy of the conversion between the states is zero. The inverse of this temperature is a measure of the entropic “penalty” for a given enthalpy reduction. Thus, for the multistate system to display a two-state-like behavior, the entropy loss must be greater for “hidden” intermediates than for the folded state. Schematically, this is represented in Figure 8. If the folding intermediates fall into a two-state “zone”, the system will behave like a two-state one.
This diagram can be discussed in terms of enthalpy-entropy compensation between protein forms. The phenomenon of enthalpy-entropy compensation, i.e., a linear correlation between the enthalpies and entropy changes in similar processes, is often manifested in chemistry and molecular biology [36]. Among others, its implications in protein folding have brought much attention over the last decade [37,38].
At the equilibrium temperature, the enthalpy difference between unfolded and folded forms of lysozyme in water is 494 ± 10 kJ/mol, while the entropy difference is 1.41 kJ/(mol·K) [24]. Assuming the enthalpy of the intermediate in water is in a similar relation to the folded form as was observed in glycerol, it must be ca. 400 kJ/mol. The two-state behavior will be observed if the entropy difference between the unfolded form and the intermediate is ≳1.16 kJ/(mol·K).
Recently, Solomonov and Yagofarov [39] introduced an approach for the description of the compensation relationships in chemical thermodynamics by introducing the compensated and uncompensated contributions to the entropy change:
G = H T S = H T S c o m p . T S n o n c o m p . = 0.660 · H T S n o n c o m p .
Equation (5) applies to the thermodynamic parameters of solvation and complex formation of numerous molecular compounds at 298.15 K (more than 1800 solute-solvent and donor-acceptor pairs [32,33]). The slope of the ∆G vs. ∆H relationship did not depend on the intermolecular interaction type (hydrogen bonding, charge-transfer complexation, van der Waals forces). Its variation with temperature can be considered, following [34]. On the other hand, TS(noncomp.) is the part of the Gibbs energy, which is independent of the interaction strength. It has been shown to originate from the loss of degrees of freedom during binding, solvophobic effects, or features of the chosen standard state [32].
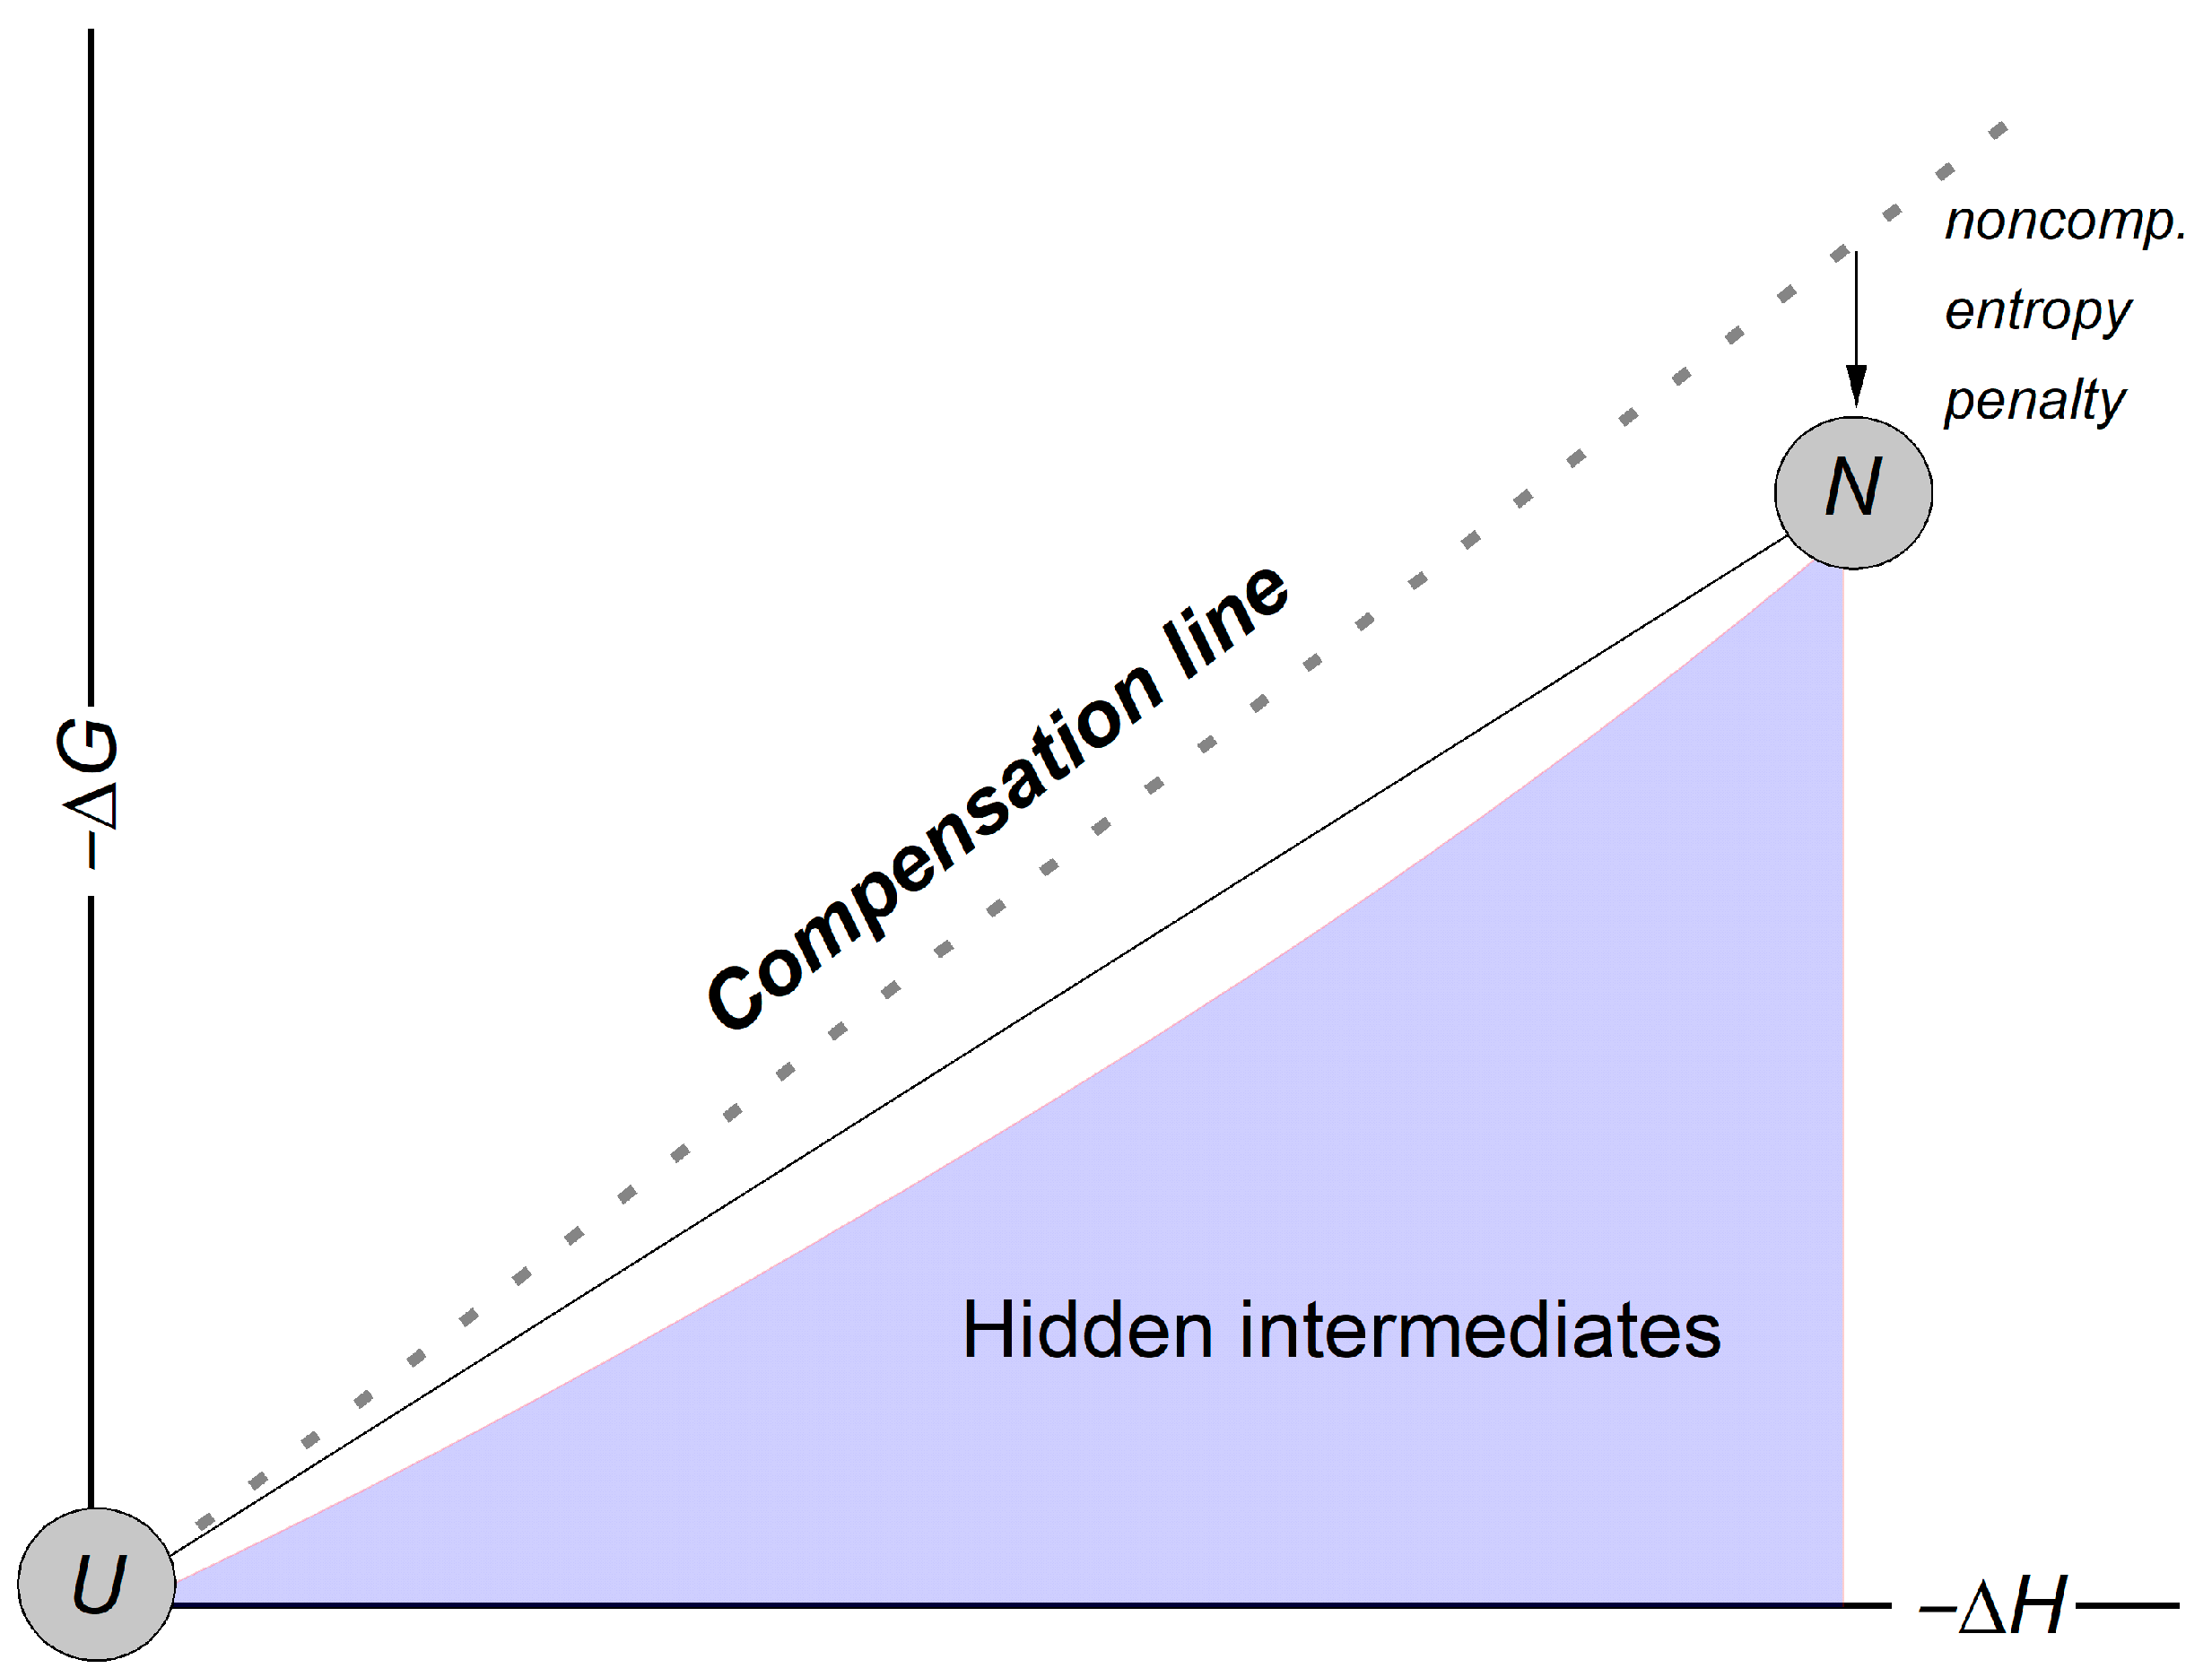
The native protein structure is maintained by a variety of intra- and intermolecular interactions that are rearranged upon unfolding. The associated thermodynamic parameters are expected to conform to Equation (5). Particularly, extraction of the non-compensated entropy term in Equation (5) can clarify the extent of hydrogen bonding network change upon folding and the nature of hydrophobic effects. The hydrophobic effects upon solvation are traditionally associated with the formation of cavities in the solvent, whose geometry depends on the solute size [40]. The use of a compensation relationship in the form of Equation (5) has previously enabled the quantification of the thermodynamic parameters of solvophobic effects upon solvation in numerous solvents, including water, and correlated these with the solute molecular volume [41,42]. The Gibbs energies of both I1 to I3 and I1 to I2 transitions include the T S n o n c o m p . term, which is the sum of contributions from each elementary denaturation step. For “hidden” intermediates formation, it is reasonable to assume that the negative entropic penalty depicted in Figure 8 is also non-compensated, i.e., does not depend on the interaction strength. The expected qualitative G vs. H relationship in a multistep denaturation process is shown in Figure 9. The deviation from the compensation line would be greater for intermediate steps than for unfolding. Quantitative analysis of such deviations might be of interest in the future.
Consideration of the two-state behavior in the context of folding funnel allows for restricting the enthalpy values of the intermediate structures, and may provide a basis for further analysis using the approach summarized by Equation (5). While in the model we explore the behavior only phenomenologically, we hope that in the future this research direction, combined with state-of-the-art computational [38,40,43,44] and experimental [45,46,47,48] methods, should further advance the understanding of the driving forces in folding.

4. Conclusions

In the present paper, we have theoretically investigated the criteria for the two-state equilibrium behavior in a system with kinetic intermediates. We demonstrate how a multistate equilibrium system can “mimic” a two-state behavior in thermal unfolding in differential scanning calorimetry. This is when “additional” states have a greater entropic “penalty” for a given enthalpy reduction from an unfolded state. Likewise, systems where two states have close enthalpies (either high or low) are virtually indistinguishable from a two-state system. However, the equilibrium thermodynamic parameters, determined by fitting the data to a two-state model, deviate from the “true” parameters of such a system.
Based on the performed theoretical analysis, we show that if two-state equilibrium behavior is experimentally confirmed using appropriate structural and calorimetric techniques, constraints can be established on the thermodynamic properties of any potential kinetic intermediates. Normally “hidden” states may become populated under certain conditions, e.g., during cold denaturation or when a protein is dissolved in a water-organic mixture.

Author Contributions

Conceptualization, T.A.M.; methodology, T.A.M.; validation, T.A.M. and M.I.Y.; writing—original draft preparation, T.A.M., M.I.Y. and C.S.; writing—review and editing, T.A.M., M.I.Y. and C.S.; visualization, T.A.M.; supervision, C.S. All authors have read and agreed to the published version of the manuscript.

Funding

This study was financially supported by the subsidy allocated to Kazan Federal University for the state assignment in the sphere of scientific activities, No. FZSM-2023–0020.

Data Availability Statement

The original contributions presented in this study are included in the article. Further inquiries can be directed to the corresponding author.

Acknowledgments

The authors would like to express their sincere gratitude to Boris Solomonov for his long-standing support and encouragement of the research conducted in the Department of Physical Chemistry at Kazan Federal University and the Fast Scanning Calorimetry laboratory.

Conflicts of Interest

The authors declare no conflicts of interest.

Appendix A

Appendix A.1. Theory

A two-state folding mechanism is described by the equilibrium NU, where N denotes the native protein and U denotes the unfolded protein, the corresponding equilibrium constant,
K U N = a N a U = γ N x N γ U x U ,
where a N and a U are the thermodynamic activities of the native and unfolded protein states at equilibrium, γ N and γ U are the activity coefficients of the native and unfolded protein states, x N and x U are the molar ratios of the native and unfolded protein states at equilibrium. In a sufficiently diluted solution, the activity coefficients of both forms can be considered equal, although this may not hold under certain important conditions, such as molecular crowding. However, for the basic model treatment, we will neglect the possible differences in the activity coefficients.
The equilibrium constant can be converted to a standard free energy difference between the protein conformations G U N ° (Gibbs energy under isobaric conditions referenced to an unfolded state), i.e.,
G ° T U N = R T ln K U N T ,
G ° T U N = H ° T U N T · S ° T , U N
where H ° T U N is the standard enthalpy change between the protein conformations, S ° T U N is the standard entropy change between the protein conformations.
The temperature variation in the above functions depends on the difference in the heat capacities of the protein conformations, c p U N :
H ° T = U N H ° U N T r e f + T r e f T c p U N d T ,
S ° T = U N S ° U N T r e f + T r e f T c p U N T d T ,
where H ° T r e f U N and S ° T r e f U N are the standard enthalpy and entropy changes expressed at an arbitrary reference temperature T r e f . It is useful to choose the reference temperature to be the one where the equilibrium constant is unity, and therefore G ° T U N = 0 , thus
S ° T r e f U N = H ° T r e f U N T r e f .
Below, we will designate a temperature under which the free energies of two particular states are equal as T e q I 1 I 2 .
Given the above, the equilibrium molar fraction of the native form can be calculated as
x N = K U N 1 + K U N = exp G U N ° T 1 + e x p G U N ° T .
In a multistate equilibrium, the molar fractions of a protein form I j in an ensemble containing n states with unique free energies (no degeneracy), with free energies referenced to a certain state I 1 , can be calculated via
x I j = K I 1 I j i = 1 n K I 1 I i = exp G I 1 I j ° T 1 + i = 2 n exp G I 1 I i ° T ,
where K I 1 I 1 1 , G I 1 I 1 ° T 0 ,
G I 1 I j ° T = H ° I 1 I j T e q I 1 I j + T e q I 1 I j T c p I 1 I j d T T S ° I 1 I j T e q I 1 I j + T e q I 1 I j T c p I 1 I j T d T .
Equation (A7) holds irrespective of the exact kinetic mechanism of folding or unfolding.
It follows from the above that in a situation where only a single state dominates under equilibrium conditions, its free energy is considerably lower than that of all the other states. While trivial, this property allows us to put limits on the H ° T I 1 I j and S ° T I 1 I j values of intermediates.
In a true chemical equilibrium case, the equilibrium constants can be expressed in terms of monomolecular rates of the forward and backward reactions, e.g., for a two-state equilibrium:
K U N = r U N r N U = k U N c U k N U c N = k U N x U k N U x N ,   c U N = c Σ x U N ,
where r U N is the rate of the folding reaction, r N U is the rate of the unfolding reaction, k U N is the rate constant of the folding reaction, k N U is the rate constant of the unfolding reaction, c U is the molarity of the unfolded protein molecules, c N is the molarity of the folded protein molecules, and c Σ is the total protein molarity.
The kinetic constants can be expressed via the Arrhenius equation or the transition theory treatment as
k i = A i · exp E A , i R T or   k i = k B T h exp S i , a p p R H i R T ,
where k i is a monomolecular rate constant of the i-th reaction (e.g., k U N or k N U ), A i , E A , i are the corresponding preexponential factor and the activation energy, H i is the activation enthalpy, S i , a p p is the apparent activation entropy.
Both E A , i and H i are positive quantities and must be larger than the enthalpy difference between the corresponding states, e.g., for a two-state equilibrium
E A , N U ,   H N U > H ° T N U .
Considering that H ° T N U values are rather large and are in the range of a few hundred kJ/mol, even for relatively small proteins, the E A , i and H i should be quite high, perhaps even unreasonably high, in a true two-state mechanism.
The restriction is lifted if the folding and unfolding are realized in a series of steps, i.e., with intermediates. The implications of the kinetic mechanisms, including two states or more, are widely discussed in the literature [16,18,49,50].
Critically, the multistep kinetic models must satisfy the microscopic reversibility principle, i.e., under equilibrium conditions, no unidirectional intermediate reactions are possible. Also, all the accessible states must be populated according to their free energies. Even if partially folded intermediates exist, but their population under native conditions is small, their detection using conventional spectroscopic techniques may not be straightforward.
On the other hand, differential scanning calorimetry provides (at least in principle) the possibility of verifying a two-state folding equilibrium.

Appendix A.2. The Calorimetric Criterion for a Two-State Folding

The equilibrium constant and, thus, the populations of states vary with temperature according to the van’t Hoff isobar
ln K T 1 p = H ° T R .
Thus, the enthalpy can be determined from the temperature variation in the equilibrium constant. As the equilibrium constant can be calculated from the equilibrium populations of the states, any technique providing such information and permitting temperature variation during the scan can be used to estimate the unfolding enthalpy. Some limitations will be discussed later.
Differential scanning calorimetry (DSC) provides a unique opportunity as it can directly measure the enthalpy evolved during unfolding (during the heating scan) or folding (during the cooling scan). DSC also allows a straightforward test for the reversibility of unfolding and can also show whether unfolding proceeds under thermodynamic or kinetic control [27].
Once it is verified that the thermal unfolding is reversible (at least to a reasonable extent) and the process is under thermodynamic control (i.e., the variation in the unfolding endotherm with the scanning rate is minimal), one can test whether the unfolding follows the two-state model using the method proposed by Privalov [2]. It is based on comparing the enthalpy calculated from the temperature variation in the equilibrium constant, i.e., the van’t Hoff enthalpy H v H , and the calorimetric enthalpy determined from the calorimetric curve, the calorimetric enthalpy H C a l .
The observed equilibrium folding constant K o b s U N at temperature T can be calculated from the calorimetric curve as
K o b s T U N = 1 T o n T c p T d T / T o n T e n d c p d T , T o n T e n d c p d T = H C a l ,
where c p T is the observed excess heat capacity in the region of the calorimetric peak after baseline subtraction, T o n and T e n d are the temperatures before and after the calorimetric peak. The temperature variation in the observed equilibrium constant can be fitted with the van’t Hoff isobar (or from the peak value of the excess heat capacity [10]). Thus, the van’t Hoff enthalpy can be calculated along with the calorimetric enthalpy from a single calorimetric curve, given that the process is under thermodynamic control.
The quantities must be equal in the case of the two-state transition. That said, Zhou et al. [12] and Freire [51] demonstrated that the calorimetric criterion for a two-state model may not hold in a true two-state equilibrium due to the inadequate baseline construction and, conversely, can be reasonably satisfied for mechanisms involving more than two states. Here, we explore the latter condition in more detail.

Appendix A.3. Calorimetric Curve Generation

The theoretical equilibrium unfolding curves were generated by calculating the molar fractions of protein forms as a function of temperature using Equation (A1). The required free energies of the states were calculated using Equation (A2), and heat capacities of the states were considered constant. The heat capacity differences between the states were considered proportional to their enthalpy differences at T e q I 1 I 2 .
Then the total enthalpy of a system referenced to a main low enthalpy state was calculated as
H T = j = 1 n x I j T H ° I 1 I j T e q I 1 I j + T e q I 1 I j T c p I 1 I j d T .
Finally, equilibrium calorimetric curves were calculated by taking the derivative of the enthalpy of the system with respect to temperature:
c p = H T T p .
The two-state fit of the theoretical calorimetric curves was performed by setting T e q I 1 I 2 , H ° I 1 I j T e q I 1 I j , and c p I 1 I 2 as variable fit parameters and minimizing the absolute difference between the fitting and fitted curves. The baseline required for evaluation of H C a l was constructed via the iterative integral method [52].
Theoretical calorimetric curves for the dynamic heating (Figure 6) were calculated by numerically integrating differential conversion rate equations for the corresponding kinetic model over varied time and temperature. The temperature-dependent rate constants were calculated with Equation (A9). The apparent activation entropies for forward and reverse reactions were calculated by solving Equation (A9) for S i , e f f R at the corresponding T e q I i I j where k i j = k j i . The values of the activation enthalpy and rate constant are specified in the figure caption. The activation enthalpy of the reverse reaction was calculated as: H I j I i T e q I i I j = H I i I j T e q I i I j H ° I i I j T e q I i I j and was kept constant at any temperature, the activation enthalpy of the forward process was varied with temperature according to H T I i I j = H ° T I i I j + H I j I i T e q I i I j . The robustness of the procedure was verified by the convergence of the dynamic calorimetric curves at low scanning rates toward the equilibrium curve.

References

  1. Anfinsen, C.B. Principles that govern the folding of protein chains. Science 1973, 181, 223–230. [Google Scholar] [CrossRef]
  2. Chan, H.S.; Dill, K.A. Protein folding in the landscape perspective: Chevron plots and non-arrhenius kinetics. Proteins Struct. Funct. Genet. 1998, 30, 2–33. [Google Scholar] [CrossRef]
  3. Dill, K.A. Polymer principles and protein folding. Protein Sci. 1999, 8, 1166–1180. [Google Scholar] [CrossRef] [PubMed]
  4. Onuchic, J.N.; Luthey-Schulten, Z.; Wolynes, P.G. Theory of Protein Folding: The Energy Landscape Perspective. Annu. Rev. Phys. Chem. 1997, 48, 545–600. [Google Scholar] [CrossRef] [PubMed]
  5. Englander, S.W. Protein Folding Intermediates and Pathways Studied by Hydrogen Exchange. Annu. Rev. Biophys. 2000, 29, 213–238. [Google Scholar] [CrossRef] [PubMed]
  6. Walters, B.T.; Mayne, L.; Hinshaw, J.R.; Sosnick, T.R.; Englander, S.W. Folding of a large protein at high structural resolution. Proc. Natl. Acad. Sci. USA 2013, 110, 18898–18903. [Google Scholar] [CrossRef]
  7. Baldwin, R.L. The Search for Folding Intermediates and the Mechanism of Protein Folding. Annu. Rev. Biophys. 2008, 37, 1–21. [Google Scholar] [CrossRef]
  8. Jain, A.; Stock, G. Identifying Metastable States of Folding Proteins. J. Chem. Theory Comput. 2012, 8, 3810–3819. [Google Scholar] [CrossRef]
  9. Kumar, S.; Tsai, C.-J.; Nussinov, R. Maximal Stabilities of Reversible Two-State Proteins. Biochemistry 2002, 41, 5359–5374. [Google Scholar] [CrossRef]
  10. Privalov, P.L.; Khechinashvili, N.N. A thermodynamic approach to the problem of stabilization of globular protein structure: A calorimetric study. J. Mol. Biol. 1974, 86, 665–684. [Google Scholar] [CrossRef]
  11. Privalov, P.L. Cold Denaturation of Protein. Crit. Rev. Biochem. Mol. Biol. 1990, 25, 281–306. [Google Scholar] [CrossRef]
  12. Zhou, Y.; Hall, C.K.; Karplus, M. The calorimetric criterion for a two-state process revisited. Protein Sci. 1999, 8, 1064–1074. [Google Scholar] [CrossRef]
  13. Knott, M.; Chan, H.S. Criteria for downhill protein folding: Calorimetry, chevron plot, kinetic relaxation, and single-molecule radius of gyration in chain models with subdued degrees of cooperativity. Proteins Struct. Funct. Bioinform. 2006, 65, 373–391. [Google Scholar] [CrossRef] [PubMed]
  14. Kaya, H.; Chan, H.S. Towards a consistent modeling of protein thermodynamic and kinetic cooperativity: How applicable is the transition state picture to folding and unfolding? J. Mol. Biol. 2002, 315, 899–909. [Google Scholar] [CrossRef] [PubMed]
  15. Kaya, H.; Chan, H.S. Polymer principles of protein calorimetric two-state cooperativity. Proteins Struct. Funct. Bioinform. 2000, 40, 637–661. [Google Scholar] [CrossRef]
  16. Akmal, A.; Muñoz, V. The nature of the free energy barriers to two-state folding. Proteins Struct. Funct. Bioinform. 2004, 57, 142–152. [Google Scholar] [CrossRef]
  17. Seelig, J.; Seelig, A. Protein Unfolding-Thermodynamic Perspectives and Unfolding Models. Int. J. Mol. Sci. 2023, 24, 5457. [Google Scholar] [CrossRef]
  18. Sánchez, I.E.; Kiefhaber, T. Evidence for Sequential Barriers and Obligatory Intermediates in Apparent Two-state Protein Folding. J. Mol. Biol. 2003, 325, 367–376. [Google Scholar] [CrossRef]
  19. Wildegger, G.; Kiefhaber, T. Three-state model for lysozyme folding: Triangular folding mechanism with an energetically trapped intermediate11Edited by A. R. Fresht. J. Mol. Biol. 1997, 270, 294–304. [Google Scholar] [CrossRef]
  20. Radford, S.E.; Dobson, C.M.; Evans, P.A. The folding of hen lysozyme involves partially structured intermediates and multiple pathways. Nature 1992, 358, 302–307. [Google Scholar] [CrossRef]
  21. Fatkhutdinova, A.; Mukhametzyanov, T.; Schick, C. Refolding of Lysozyme in Glycerol as Studied by Fast Scanning Calorimetry. Int. J. Mol. Sci. 2022, 23, 2773. [Google Scholar] [CrossRef] [PubMed]
  22. Ermakova, E.; Makshakova, O.; Zuev, Y.; Sedov, I. Beta-rich intermediates in denaturation of lysozyme: Accelerated molecular dynamics simulations. J. Biomol. Struct. Dyn. 2022, 40, 13953–13964. [Google Scholar] [CrossRef] [PubMed]
  23. Magsumov, T.; Ziying, L.; Sedov, I. Comparative study of the protein denaturing ability of different organic cosolvents. Int. J. Biol. Macromol. 2020, 160, 880–888. [Google Scholar] [CrossRef] [PubMed]
  24. Magsumov, T.; Fatkhutdinova, A.; Mukhametzyanov, T.; Sedov, I. The Effect of Dimethyl Sulfoxide on the Lysozyme Unfolding Kinetics, Thermodynamics, and Mechanism. Biomolecules 2019, 9, 547. [Google Scholar] [CrossRef]
  25. Vyazovkin, S. Isoconversional Kinetics of Thermally Stimulated Processes; Springer: Berlin/Heidelberg, Germany, 2015; ISBN 9783319141756. [Google Scholar]
  26. Kissinger, H.E. Reaction Kinetics in Differential Thermal Analysis. Anal. Chem. 1957, 29, 1702–1706. [Google Scholar] [CrossRef]
  27. Mukhametzyanov, T.A.; Sedov, I.A.; Solomonov, B.N.; Schick, C. Fast scanning calorimetry of lysozyme unfolding at scanning rates from 5 K/min to 500,000 K/min. Biochim. Biophys. Acta-Gen. Subj. 2018, 1862, 2024–2030. [Google Scholar] [CrossRef]
  28. Vyazovkin, S.; Burnham, A.K.; Criado, J.M.; Pérez-Maqueda, L.A.; Popescu, C.; Sbirrazzuoli, N. ICTAC Kinetics Committee recommendations for performing kinetic computations on thermal analysis data. Thermochim. Acta 2011, 520, 1–19. [Google Scholar] [CrossRef]
  29. Dill, K.A.; MacCallum, J.L. The Protein-Folding Problem, 50 Years on. Science 2012, 338, 1042–1046. [Google Scholar] [CrossRef]
  30. Bartlett, A.I.; Radford, S.E. An expanding arsenal of experimental methods yields an explosion of insights into protein folding mechanisms. Nat. Struct. Mol. Biol. 2009, 16, 582–588. [Google Scholar] [CrossRef]
  31. Lyubarev, A.; Kurganov, B. Analysis of DSC data relating to proteins undergoing irreversible thermal denaturation. J. Therm. Anal. Calorim. 2000, 62, 51–62. [Google Scholar] [CrossRef]
  32. Splinter, R.; van Herwaarden, A.W.; van Wetten, I.A.; Pfreundt, A.; Svendsen, W.E. Fast differential scanning calorimetry of liquid samples with chips. Thermochim. Acta 2015, 603, 162–171. [Google Scholar] [CrossRef]
  33. Ibarra-Molero, B.; Naganathan, A.N.; Sanchez-Ruiz, J.M.; Muñoz, V. Modern Analysis of Protein Folding by Differential Scanning Calorimetry. In Methods in Enzymology; Academic Press Inc.: San Diego, CA, USA, 2016; Volume 567, pp. 281–318. [Google Scholar]
  34. Pace, C.N.; Laurents, D.V. A new method for determining the heat capacity change for protein folding. Biochemistry 1989, 28, 2520–2525. [Google Scholar] [CrossRef]
  35. Bieri, O.; Kiefhaber, T. Origin of apparent fast and non-exponential kinetics of lysozyme folding measured in pulsed hydrogen exchange experiment. J. Mol. Biol. 2001, 310, 919–935. [Google Scholar] [CrossRef] [PubMed]
  36. Liu, L.; Guo, Q.-X. Isokinetic Relationship, Isoequilibrium Relationship, and Enthalpy−Entropy Compensation. Chem. Rev. 2001, 101, 673–696. [Google Scholar] [CrossRef] [PubMed]
  37. Dumas, P. Enthalpy-Entropy Compensation. bioRxiv 2025. [Google Scholar] [CrossRef]
  38. Li, J.; Hou, C.; Ma, X.; Guo, S.; Zhang, H.; Shi, L.; Liao, C.; Zheng, B.; Ye, L.; Yang, L.; et al. Entropy-Enthalpy Compensations Fold Proteins in Precise Ways. Int. J. Mol. Sci. 2021, 22, 9653. [Google Scholar] [CrossRef] [PubMed]
  39. Solomonov, B.N.; Yagofarov, M.I. The relationship between the Gibbs energies and enthalpies of hydrogen bonding and charge-transfer complex formation in non-electrolytes solutions. Is it a rule? J. Mol. Liq. 2025, 424, 127053. [Google Scholar] [CrossRef]
  40. Azizi, K.; Laio, A.; Hassanali, A. Solvation thermodynamics from cavity shapes of amino acids. Proc. Natl. Acad. Sci. USA 2023, 2, pgad239. [Google Scholar] [CrossRef]
  41. Sedov, I.A.; Stolov, M.A.; Solomonov, B.N. Solvophobic effects and relationships between the Gibbs energy and enthalpy for the solvation process. J. Phys. Org. Chem. 2011, 24, 1088–1094. [Google Scholar] [CrossRef]
  42. Solomonov, B.N.; Yagofarov, M.I. Compensation relationship in thermodynamics of solvation and vaporization: Features and applications. II. Hydrogen-bonded systems. J. Mol. Liq. 2023, 372, 121205. [Google Scholar] [CrossRef]
  43. ten Wolde, P.R.; Chandler, D. Drying-induced hydrophobic polymer collapse. Proc. Natl. Acad. Sci. USA 2002, 99, 6539–6543. [Google Scholar] [CrossRef]
  44. Azizi, K.; Laio, A.; Hassanali, A. Model Folded Hydrophobic Polymers Reside in Highly Branched Voids. J. Phys. Chem. Lett. 2022, 13, 183–189. [Google Scholar] [CrossRef] [PubMed]
  45. Lapidus, L.J. Exploring the top of the protein folding funnel by experiment. Curr. Opin. Struct. Biol. 2013, 23, 30–35. [Google Scholar] [CrossRef] [PubMed]
  46. Mallamace, F.; Corsaro, C.; Mallamace, D.; Cicero, N.; Vasi, S.; Dugo, G.; Stanley, H.E. Dynamical changes in hydration water accompanying lysozyme thermal denaturation. Front. Phys. 2015, 10, 106104. [Google Scholar] [CrossRef]
  47. Mallamace, D.; Fazio, E.; Mallamace, F.; Corsaro, C. The Role of Hydrogen Bonding in the Folding/Unfolding Process of Hydrated Lysozyme: A Review of Recent NMR and FTIR Results. Int. J. Mol. Sci. 2018, 19, 3825. [Google Scholar] [CrossRef] [PubMed]
  48. Edwards, D.T.; LeBlanc, M.-A.; Perkins, T.T. Modulation of a protein-folding landscape revealed by AFM-based force spectroscopy notwithstanding instrumental limitations. Proc. Natl. Acad. Sci. USA 2021, 118, e2015728118. [Google Scholar] [CrossRef]
  49. Kamagata, K.; Arai, M.; Kuwajima, K. Unification of the Folding Mechanisms of Non-two-state and Two-state Proteins. J. Mol. Biol. 2004, 339, 951–965. [Google Scholar] [CrossRef]
  50. Kuwajima, K. The Molten Globule, and Two-State vs. Non-Two-State Folding of Globular Proteins. Biomolecules 2020, 10, 407. [Google Scholar] [CrossRef]
  51. Freire, E. Differential scanning calorimetry. In Protein Stability and Folding Theory Practice; Humana Press: Totowa, NJ, USA, 1995; pp. 191–218. [Google Scholar]
  52. Malakhov, D.V.; Abou Khatwa, M.K. Constructinga self-consistent integral baseline by using cubic splines. J. Therm. Anal. Calorim. 2007, 87, 595–599. [Google Scholar] [CrossRef]
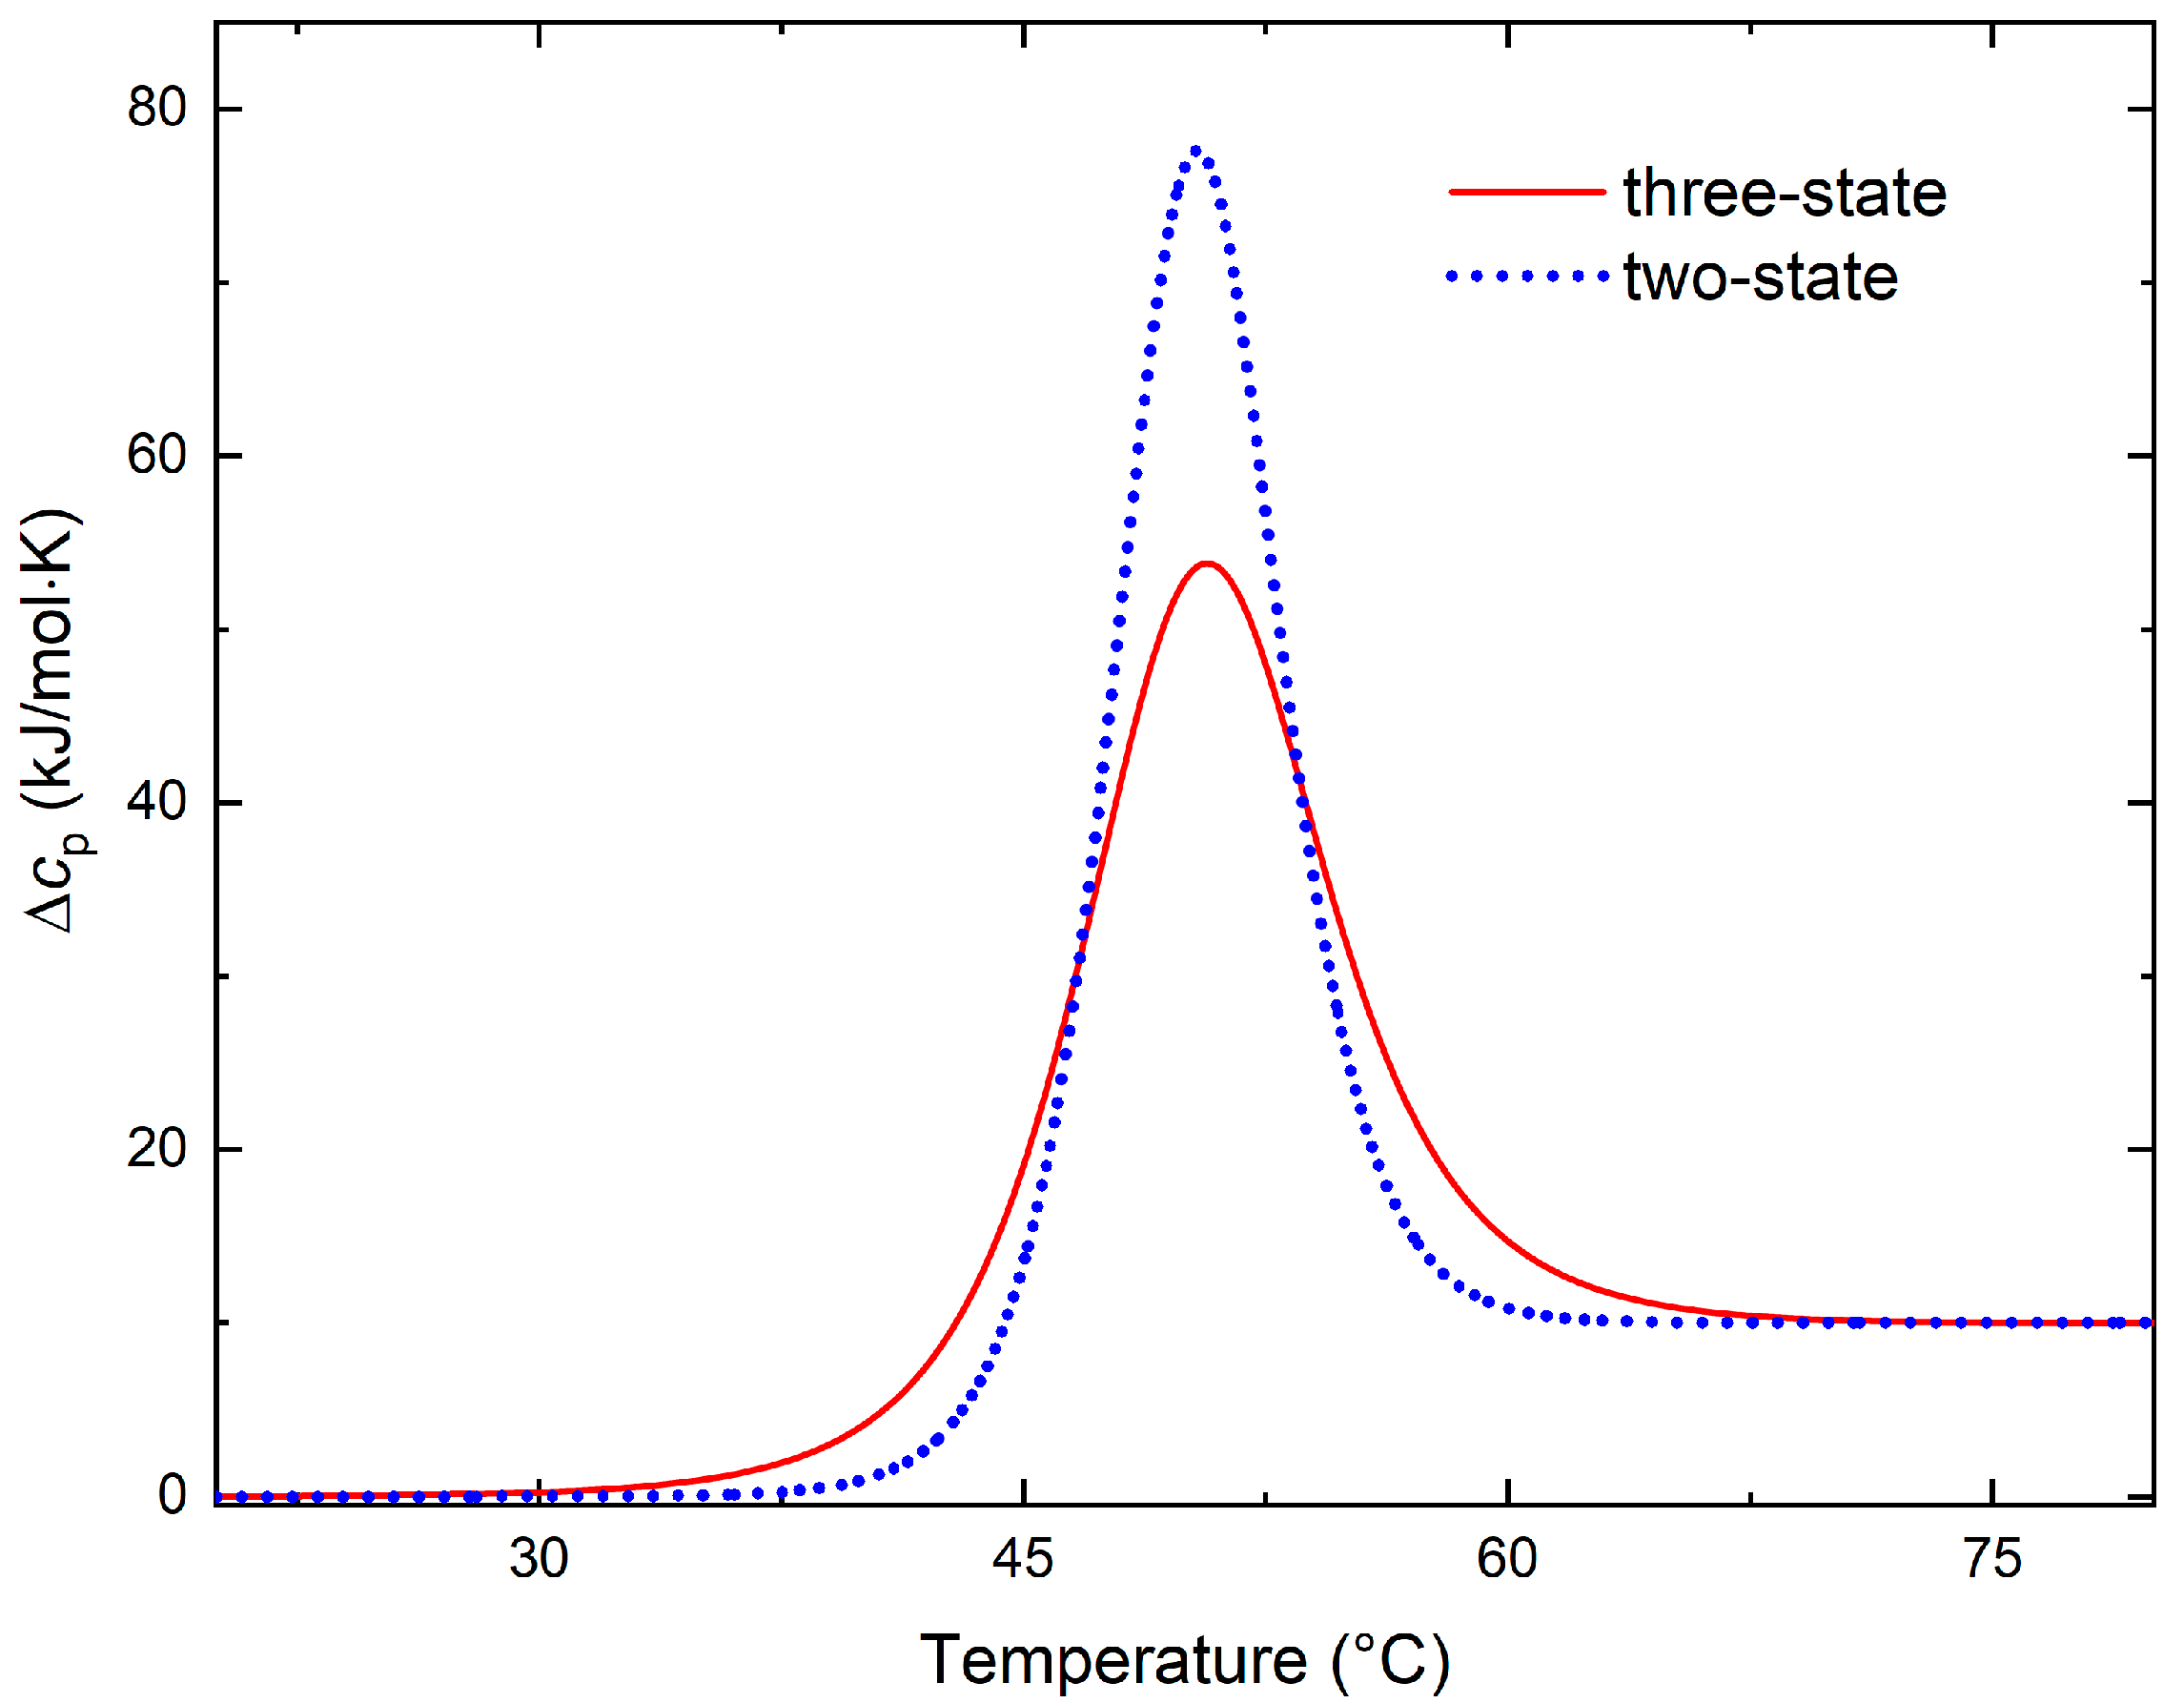
Figure 1. Theoretical equilibrium DSC curves for a two-state system ( T e q I 1 I 2 = 50 °C, H ° I 1 I 2 T e q I 1 I 2 = 500 kJ/mol, c p I 1 I 2 = 10 kJ/mol·K) and a three-state system with an additional state I3 ( T e q I 3 I 2 = 50 °C, H ° I 3 I 2 T e q I 3 I 2 = 250 kJ/mol, c p I 3 I 2 = 5 kJ/mol·K).
Liquids 05 00024 g001
Figure 2. Theoretical equilibrium DSC curves for a three-state system with an additional state I3 (A) H ° I 3 I 2 T e q I 3 I 2 = 250 kJ/mol, c p I 3 I 2 = 5 kJ/mol·K, T e q I 3 I 2 from 50 °C (blue curve) to 40 °C (pink curve) with 2 °C steps, (B) H ° I 3 I 2 T e q I 3 I 2 = 250 kJ/mol, c p I 3 I 2 = 5 kJ/mol·K, T e q I 3 I 2 from 50 °C (blue curve) to 60 °C (pink curve) with 2 °C steps, blue line corresponds to a two-state curve from Figure 1.
Liquids 05 00024 g002
Figure 3. The two-state fit (red curve) of the three-state theoretical calorimetric curve from Figure 1 (blue dots). The apparent fit parameter values are T e q , a p p I 1 I 2 = 49.96 °C, H ° I 1 I 2 a p p = 409.4 kJ/mol, c p ,   a p p I 1 I 2 = 10.5 kJ/mol·K, H C a l = 492 kJ/mol.
Liquids 05 00024 g003
Figure 4. The values of the apparent transition enthalpy (A) and temperature (B) determined by fitting a two-state model curve to theoretical curves for a three-state system vs. the ratio of the enthalpies of the “main” low enthalpy state and the enthalpy of an additional state, referenced to the enthalpy of the high enthalpy state. Graph (C) demonstrates the ratio between the apparent enthalpy difference between the two states determined by the fitting, divided by the apparent calorimetric enthalpy of the transition.
Liquids 05 00024 g004
Figure 5. Theoretical equilibrium DSC curves (A) for a two-state system ( T e q I 1 I 2 = 50 °C, H ° I 1 I 2 T e q I 1 I 2 = 500 kJ/mol, c p I 1 I 2 = 10 kJ/mol·K) and a three-state system with an additional state I3 ( T e q I 3 I 2 = 50 °C, H ° I 3 I 2 T e q I 3 I 2 = 50 kJ/mol, c p I 3 I 2 = 1 kJ/mol·K) and the corresponding equilibrium populations of states in the three-state system (B).
Liquids 05 00024 g005
Figure 6. Calorimetric curves of two-state and three-state systems at different ratios between the scanning rate q and kinetic constant k. Two-state system parameters T e q I 1 I 2 = 50 °C, H ° I 1 I 2 T e q I 1 I 2 = 500 kJ/mol, c p I 1 I 2 = 10 kJ/mol·K, H I 1 I 2 T e q I 1 I 2 = 550 kJ/mol, k 1 T e q I 1 I 2 = 1 s−1; three-state system with additional state I3 which unfolds following reaction 4, T e q I 3 I 2 = 40 °C, H ° I 3 I 2 T e q I 3 I 2 = 250 kJ/mol, c p I 3 I 2 = 5 kJ/mol·K, H I 1 I 3 T e q I 1 I 2 = 300 kJ/mol, H I 3 I 2 T e q I 3 I 2 = 300 kJ/mol, k 1 T e q I 1 I 2 = k 2 T e q I 3 I 2 = 1 s−1.
Liquids 05 00024 g006
Figure 7. Kissinger plot of the peak positions from Figure 6 with the resulting apparent activation energies of the processes. Where q is the scanning rate and Tm is the temperature of the peak on the calorimetric curve.
Liquids 05 00024 g007
Figure 8. Schematic representation of the thermodynamic restrictions on the enthalpy and entropy of the intermediates relative to the native form, leading to a two-state or non-two-state behavior. The system exhibits a particular behavior when the enthalpy and entropy of the intermediate place it within the corresponding region of the diagram. The dotted line represents the states with the same relative entropic loss.
Liquids 05 00024 g008
Figure 9. Schematic representation of the compensation relationship between free energy and enthalpy for protein folding. U represents unfolded state; N is folded state. The arrow indicates a contribution to the free energy due to noncompensated entropy.
Liquids 05 00024 g009
Disclaimer/Publisher’s Note: The statements, opinions and data contained in all publications are solely those of the individual author(s) and contributor(s) and not of MDPI and/or the editor(s). MDPI and/or the editor(s) disclaim responsibility for any injury to people or property resulting from any ideas, methods, instructions or products referred to in the content.