
Experimental Liquid Densities of Red Palm Oil at Pressures up to 150 MPa from (312 to 352) K and Dynamic Viscosities at 0.1 MPa from (293 to 353) K

 , , ,
, , ,
Abstract
1. Introduction
2. Materials and Methods
2.1. Materials
2.2. Gas Chromatography–Flame Ionization Detector (GC-FID)
2.3. High-Performance Liquid Chromatography (HPLC)
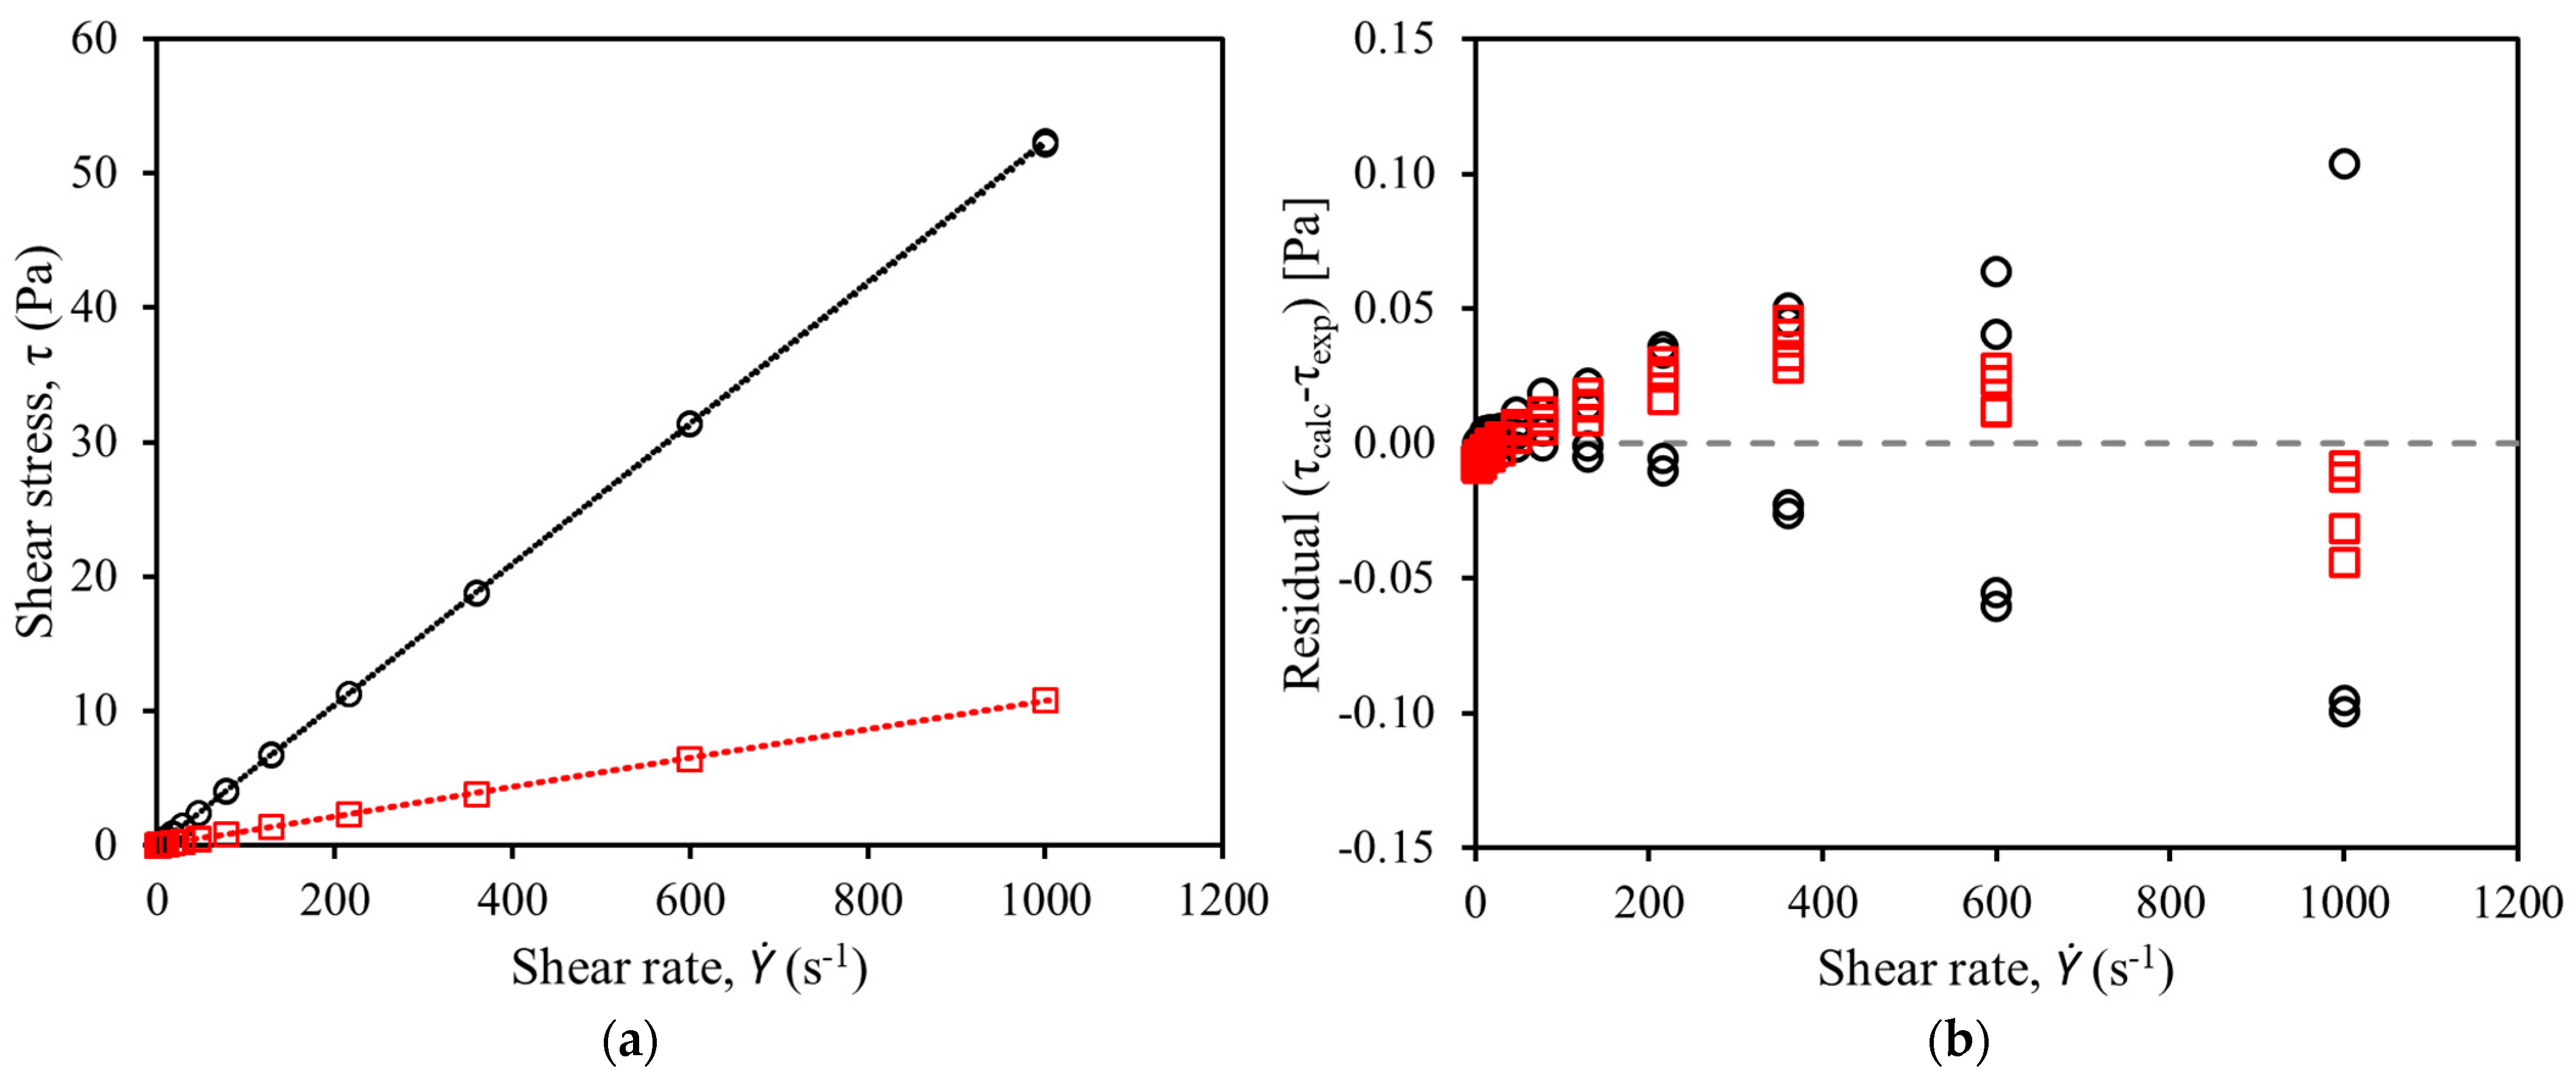
2.4. Rheology
2.5. Measurements of Density and Viscosity at Atmospheric Pressure
2.6. Viscosity Model
2.7. Measurement of Density at High Pressure
2.8. Tait Equation
2.9. Perturbed-Chain Statistical Associating Fluid Theory (PC-SAFT) Equation
2.10. Objective Function
2.11. Optimal Parameter Analysis
3. Results and Discussion
3.1. Characterization of Red Palm Oil
3.2. High-Pressure Densities of Red Palm Oil (RPO)
4. Conclusions
Supplementary Materials
Author Contributions
Funding
Data Availability Statement
Acknowledgments
Conflicts of Interest
References
- Gao, Z.; Zhu, Y.; Jin, J.; Jin, Q.; Wang, X. Chemical-Physical Properties of Red Palm Oils and Their Application in the Manufacture of Aerated Emulsions with Improved Whipping Capabilities. Foods 2023, 12, 3933. [Google Scholar] [CrossRef] [PubMed]
- Han, L.; Li, L.; Li, B.; Zhao, L.; Liu, G.; Liu, X.; Wang, X. Effect of High Pressure Microfluidization on the Crystallization Behavior of Palm Stearin—Palm Olein Blends. Molecules 2014, 19, 5348–5359. [Google Scholar] [CrossRef] [PubMed]
- Ferrari, G.; Mustafa, W.; Donsì, F. Use of agri-food residues for oil structuring and functionalization. Chem. Eng. Trans. 2017, 57, 1831–1836. [Google Scholar] [CrossRef]
- Hoe, B.C.; Chan, E.S.; Nagasundara Ramanan, R.; Ooi, C.W. Recent development and challenges in extraction of phytonutrients from palm oil. Compr. Rev. Food Sci. Food Saf. 2020, 19, 4031–4061. [Google Scholar] [CrossRef]
- Folayan, A.J.; Anawe, P.A.L.; Aladejare, A.E.; Ayeni, A.O. Experimental investigation of the effect of fatty acids configuration, chain length, branching and degree of unsaturation on biodiesel fuel properties obtained from lauric oils, high-oleic and high-linoleic vegetable oil biomass. Energy Rep. 2019, 5, 793–806. [Google Scholar] [CrossRef]
- Anitescu, G.; Bruno, T.J. Liquid Biofuels: Fluid Properties to Optimize Feedstock Selection, Processing, Refining/Blending, Storage/Transportation, and Combustion. Energy Fuels 2011, 26, 324–348. [Google Scholar] [CrossRef]
- Geacai, S.; Iulian, O.; Nita, I. Measurement, correlation and prediction of biodiesel blends viscosity. Fuel 2015, 143, 268–274. [Google Scholar] [CrossRef]
- Anitescu, G.; Bruno, T.J. Fluid properties needed in supercritical transesterification of triglyceride feedstocks to biodiesel fuels for efficient and clean combustion—A review. J. Supercrit. Fluids 2012, 63, 133–149. [Google Scholar] [CrossRef]
- Jasiok, B.; Lowe, A.R.; Postnikov, E.B.; Feder-Kubis, J.; Chorążewski, M. High-Pressure Densities of Industrial Lubricants and Complex Oils Predicted by the Fluctuation Theory-Based Equation of State. Ind. Eng. Chem. Res. 2018, 57, 11797–11803. [Google Scholar] [CrossRef]
- Kok, S.L.; Lee, W.J.; Smith, R.L.; Suleiman, N.; Jom, K.N.; Vangnai, K.; Bin Sharaai, A.H.; Chong, G.H. Role of virgin coconut oil (VCO) as co-extractant for obtaining xanthones from mangosteen (Garcinia mangostana) pericarp with supercritical carbon dioxide extraction. J. Supercrit. Fluids 2021, 176, 105305. [Google Scholar] [CrossRef]
- Regueira, T.; Lugo, L.; Fandiño, O.; López, E.R.; Fernández, J. Compressibilities and viscosities of reference and vegetable oils for their use as hydraulic fluids and lubricants. Green. Chem. 2011, 13, 1293–1302. [Google Scholar] [CrossRef]
- Gross, J.; Sadowski, G. Perturbed-Chain SAFT: An Equation of State Based on a Perturbation Theory for Chain Molecules. Ind. Eng. Chem. Res. 2001, 40, 1244–1260. [Google Scholar] [CrossRef]
- Brühl, L. Official Methods and Recommended Practices of the American Oil Chemist’s Society, Physical and Chemical Characteristics of Oils, Fats and Waxes, Section I. Ed. The AOCS Methods Editor and the AOCS Technical Department. 54 pages. AOCS Press, Champaign, 1996. Lipid/Fett 1997, 99, 197. [Google Scholar] [CrossRef]
- Lee, W.J.; Tan, C.P.; Sulaiman, R.; Smith, R.L.; Chong, G.H. Microencapsulation of red palm oil as an oil-in-water emulsion with supercritical carbon dioxide solution-enhanced dispersion. J. Food Eng. 2018, 222, 100–109. [Google Scholar] [CrossRef]
- Rodenbush, C.M.; Hsieh, F.H.; Viswanath, D.S. Density and Viscosity of Vegetable Oils. J. Am. Oil Chem. Soc. 1999, 76, 1415–1419. [Google Scholar] [CrossRef]
- Ikeda, M.; Aniya, M. Understanding the Vogel–Fulcher–Tammann law in terms of the bond strength–coordination number fluctuation model. J. Non-Cryst. Solids 2013, 371–372, 53–57. [Google Scholar] [CrossRef]
- Harris, K.R. Temperature and Pressure Dependence of the Viscosities of Krytox GPL102 Oil and Di(pentaerythritol) Hexa(isononanoate). J. Chem. Eng. Data 2015, 60, 1510–1519. [Google Scholar] [CrossRef]
- Doolittle, A.K. Studies in Newtonian Flow. II. The Dependence of the Viscosity of Liquids on Free-Space. J. Appl. Phys. 1951, 22, 1471–1475. [Google Scholar] [CrossRef]
- Opdam, J.; Gandhi, P.; Kuhnhold, A.; Schilling, T.; Tuinier, R. Excluded volume interactions and phase stability in mixtures of hard spheres and hard rods. Phys. Chem. Chem. Phys. 2022, 24, 11820–11827. [Google Scholar] [CrossRef]
- Hiraga, Y.; Kato, A.; Sato, Y.; Smith, R.L. Densities at Pressures up to 200 MPa and Atmospheric Pressure Viscosities of Ionic Liquids 1-Ethyl-3-methylimidazolium Methylphosphate, 1-Ethyl-3-methylimidazolium Diethylphosphate, 1-Butyl-3-methylimidazolium Acetate, and 1-Butyl-3-methylimidazolium Bis(trifluoromethylsulfonyl)imide. J. Chem. Eng. Data 2015, 60, 876–885. [Google Scholar] [CrossRef]
- Iguchi, M.; Hiraga, Y.; Sato, Y.; Aida, T.M.; Watanabe, M.; Smith, R.L. Measurement of High-Pressure Densities and Atmospheric Viscosities of Ionic Liquids: 1-Hexyl-3-methylimidazolium Bis(trifluoromethylsulfonyl)imide and 1-Hexyl-3-methylimidazolium Chloride. J. Chem. Eng. Data 2014, 59, 709–717. [Google Scholar] [CrossRef]
- Machida, H.; Sato, Y.; Smith, R.L. Pressure–volume–temperature (PVT) measurements of ionic liquids ([bmim+][PF6−], [bmim+][BF4−], [bmim+][OcSO4−]) and analysis with the Sanchez–Lacombe equation of state. Fluid. Phase Equilibria 2008, 264, 147–155. [Google Scholar] [CrossRef]
- Machida, H.; Taguchi, R.; Sato, Y.; Smith, R.L. Measurement and Correlation of High Pressure Densities of Ionic Liquids, 1-Ethyl-3-methylimidazolium l-Lactate ([emim][Lactate]), 2-Hydroxyethyl-trimethylammonium l-Lactate ([(C2H4OH)(CH3)3N][Lactate]), and 1-Butyl-3-methylimidazolium Chloride ([bmim][Cl]). J. Chem. Eng. Data 2010, 56, 923–928. [Google Scholar] [CrossRef]
- Taguchi, R.; Machida, H.; Sato, Y.; Smith, R.L. High-Pressure Densities of 1-Alkyl-3-methylimidazolium Hexafluorophosphates and 1-Alkyl-3-methylimidazolium Tetrafluoroborates at Temperatures from (313 to 473) K and at Pressures up to 200 MPa. J. Chem. Eng. Data 2009, 54, 22–27. [Google Scholar] [CrossRef]
- Mimoune, Z.; Anoune, I.; Madani, H. Implementation of PC-SAFT for Predicting thermodynamic properties of pure refrigerants and vapor-liquid equilibria of refrigerants binary mixtures. Fluid. Phase Equilibria 2023, 573, 113868. [Google Scholar] [CrossRef]
- de Almeida, E.S.; da Silva Damaceno, D.; Carvalho, L.; Victor, P.A.; dos Passos, R.M.; de Almeida Pontes, P.V.; Cunha-Filho, M.; Sampaio, K.A.; Monteiro, S. Thermal and Physical Properties of Crude Palm Oil with Higher Oleic Content. Appl. Sci. 2021, 11, 7094. [Google Scholar] [CrossRef]
- Esteban, B.; Riba, J.-R.; Baquero, G.; Rius, A.; Puig, R. Temperature dependence of density and viscosity of vegetable oils. Biomass Bioenergy 2012, 42, 164–171. [Google Scholar] [CrossRef]
- Freitas, S.V.D.; e Silva, F.A.; Pastoriza-Gallego, M.J.; Piñeiro, M.M.; Lima, Á.S.; Coutinho, J.A.P. Measurement and Prediction of Densities of Vegetable Oils at Pressures up to 45 MPa. J. Chem. Eng. Data 2013, 58, 3046–3053. [Google Scholar] [CrossRef]
- Kim, N.H.; Jung, S.Y.; Park, Y.A.; Lee, Y.J.; Jo, J.Y.; Lee, S.M.; Oh, Y.H. Fatty acid composition and characterisation of commercial vegetable oils with chemometric approaches. Int. Food Res. J. 2020, 27, 270–279. [Google Scholar]
- Revelou, P.K.; Xagoraris, M.; Alexandropoulou, A.; Kanakis, C.D.; Papadopoulos, G.K.; Pappas, C.S.; Tarantilis, P.A. Chemometric Study of Fatty Acid Composition of Virgin Olive Oil from Four Widespread Greek Cultivars. Molecules 2021, 26, 4151. [Google Scholar] [CrossRef]
- Chen, J.; Zhang, L.; Guo, X.; Qiang, J.; Cao, Y.; Zhang, S.; Yu, X. Influence of triacylglycerol structure on the formation of lipid oxidation products in different vegetable oils during frying process. Food Chem. 2025, 464, 141783. [Google Scholar] [CrossRef] [PubMed]
- Indelicato, S.; Bongiorno, D.; Pitonzo, R.; Di Stefano, V.; Calabrese, V.; Indelicato, S.; Avellone, G. Triacylglycerols in edible oils: Determination, characterization, quantitation, chemometric approach and evaluation of adulterations. J. Chromatogr. A 2017, 1515, 1–16. [Google Scholar] [CrossRef]
 ) calculated minus experimental density values (residuals). Symbols: (blue,
  ) 352 K; (red,
  ) 342 K; (yellow,
  ) 332 K; (purple,
  ) 322 K; (green,
  ) 312 K. Lines: (⸺) Tait equation correlation, (- - -) 95% confidence interval, (-∙-) mean.
) calculated minus experimental density values (residuals). Symbols: (blue, ) 352 K; (red, ) 342 K; (yellow, ) 332 K; (purple, ) 322 K; (green, ) 312 K. Lines: (⸺) Tait equation correlation, (- - -) 95% confidence interval, (-∙-) mean.
) 312 K. Lines: (⸺) Tait equation correlation, (- - -) 95% confidence interval, (-∙-) mean.
) calculated minus experimental density values (residuals). Symbols: (blue, ) 352 K; (red, ) 342 K; (yellow, ) 332 K; (purple, ) 322 K; (green, ) 312 K. Lines: (⸺) Tait equation correlation, (- - -) 95% confidence interval, (-∙-) mean.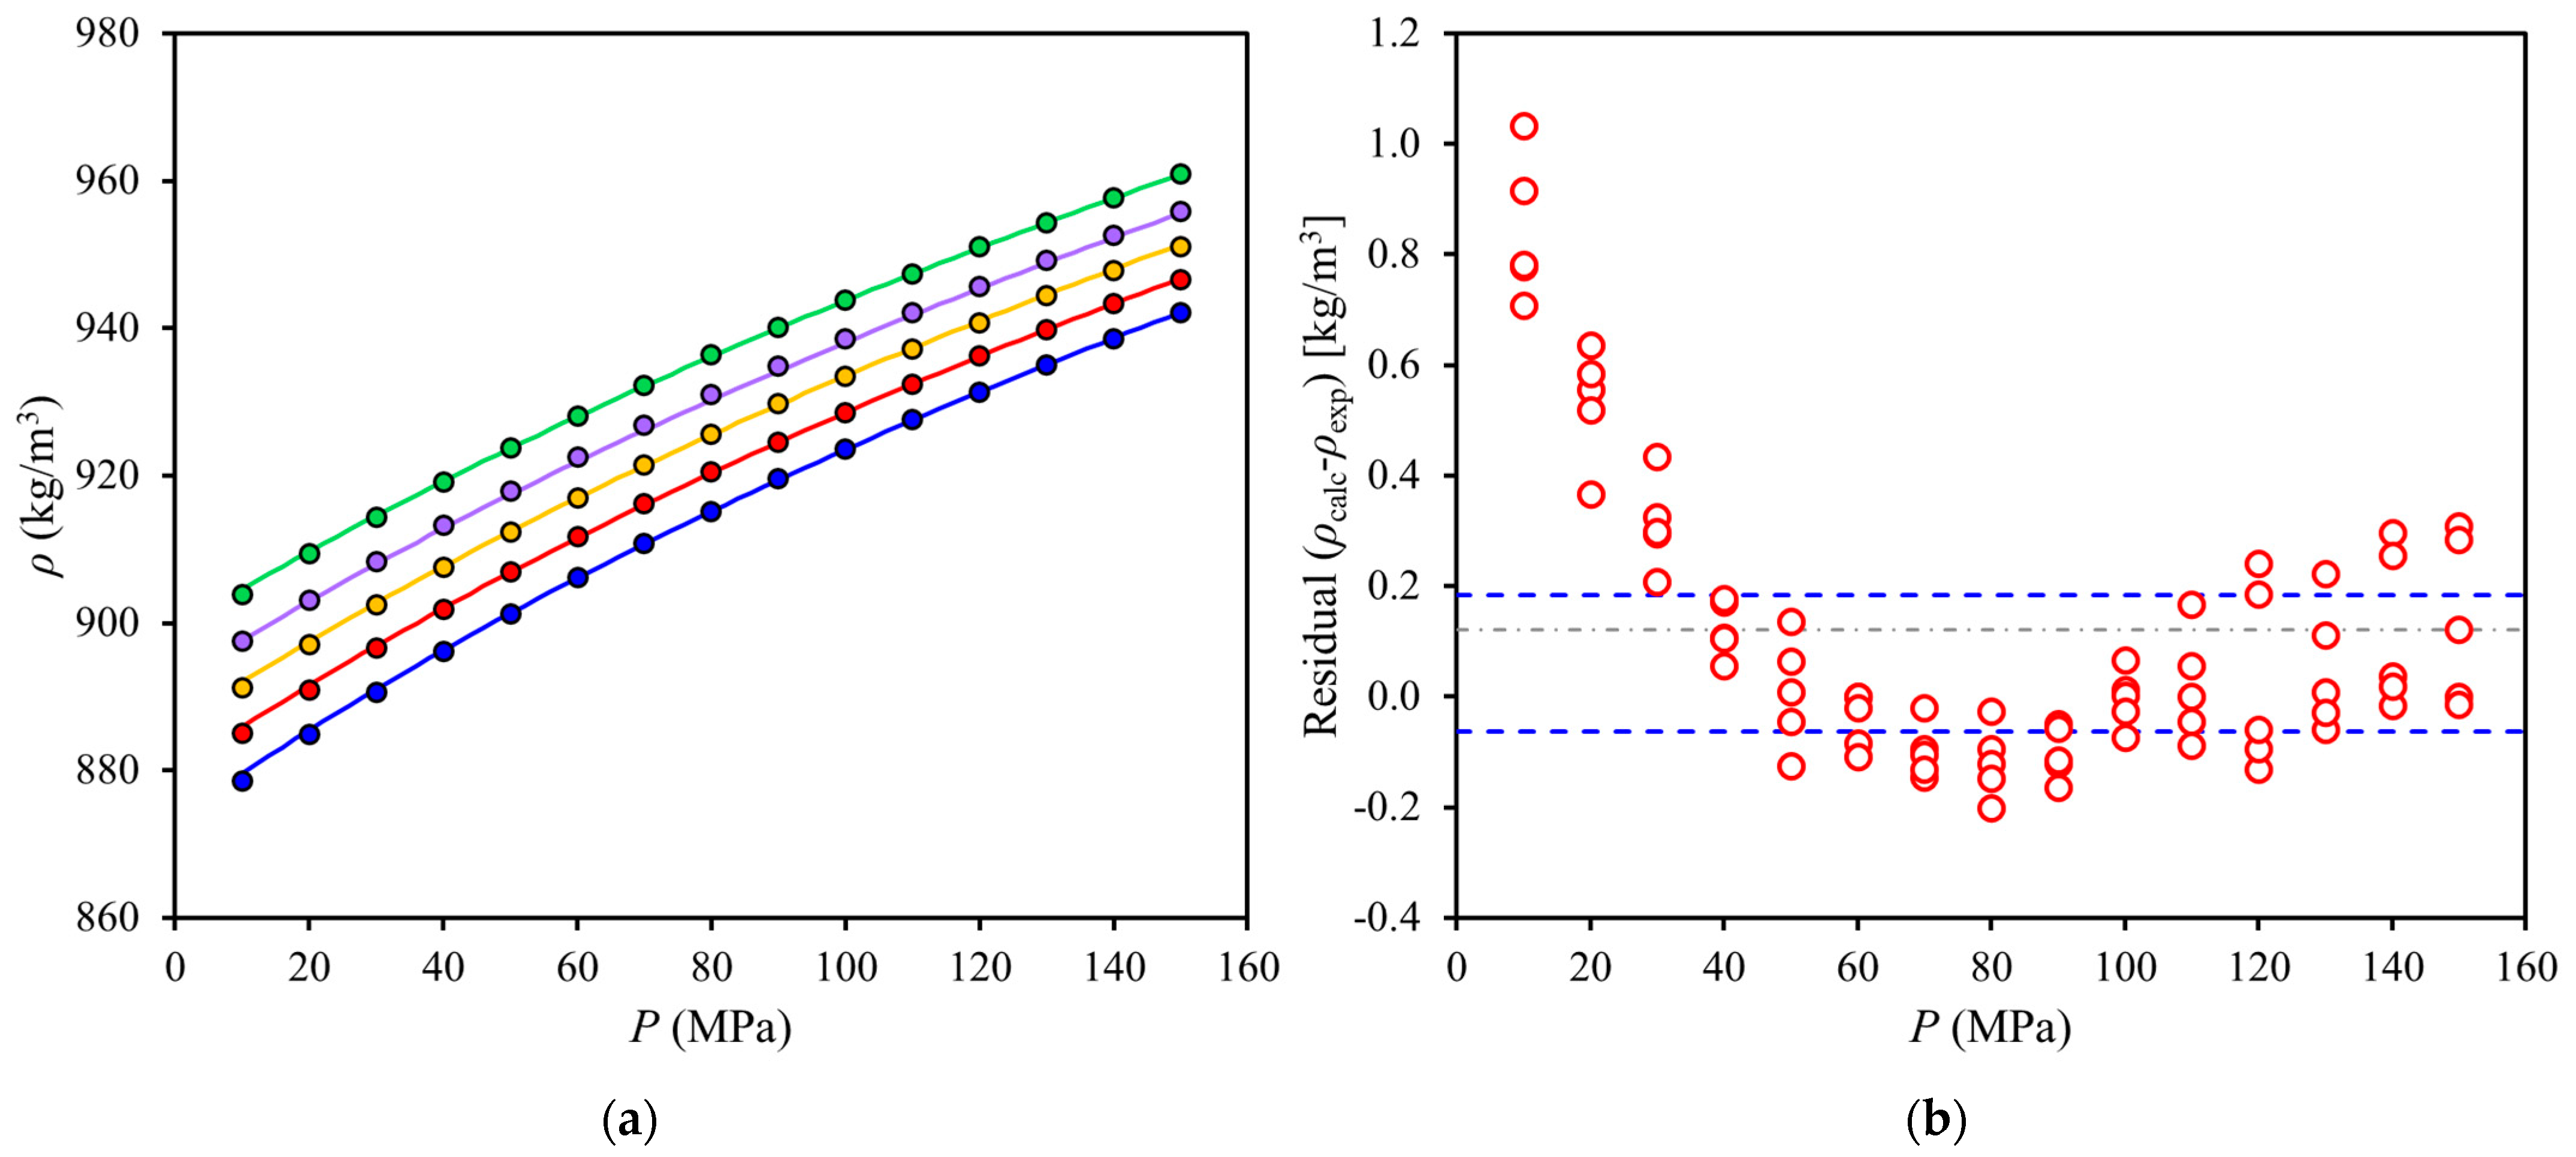
 ) calculated minus experimental density values (residuals). Symbols: (blue,
  ) 352 K; (red,
  ) 342 K; (yellow,
  ) 332 K; (purple,
  ) 322 K; (green,
  ) 312 K. Lines: (⸺) PC-SAFT correlation, (- - -) 95% confidence interval, (-∙-) mean.
) calculated minus experimental density values (residuals). Symbols: (blue, ) 352 K; (red, ) 342 K; (yellow, ) 332 K; (purple, ) 322 K; (green, ) 312 K. Lines: (⸺) PC-SAFT correlation, (- - -) 95% confidence interval, (-∙-) mean.
) 312 K. Lines: (⸺) PC-SAFT correlation, (- - -) 95% confidence interval, (-∙-) mean.
) calculated minus experimental density values (residuals). Symbols: (blue, ) 352 K; (red, ) 342 K; (yellow, ) 332 K; (purple, ) 322 K; (green, ) 312 K. Lines: (⸺) PC-SAFT correlation, (- - -) 95% confidence interval, (-∙-) mean.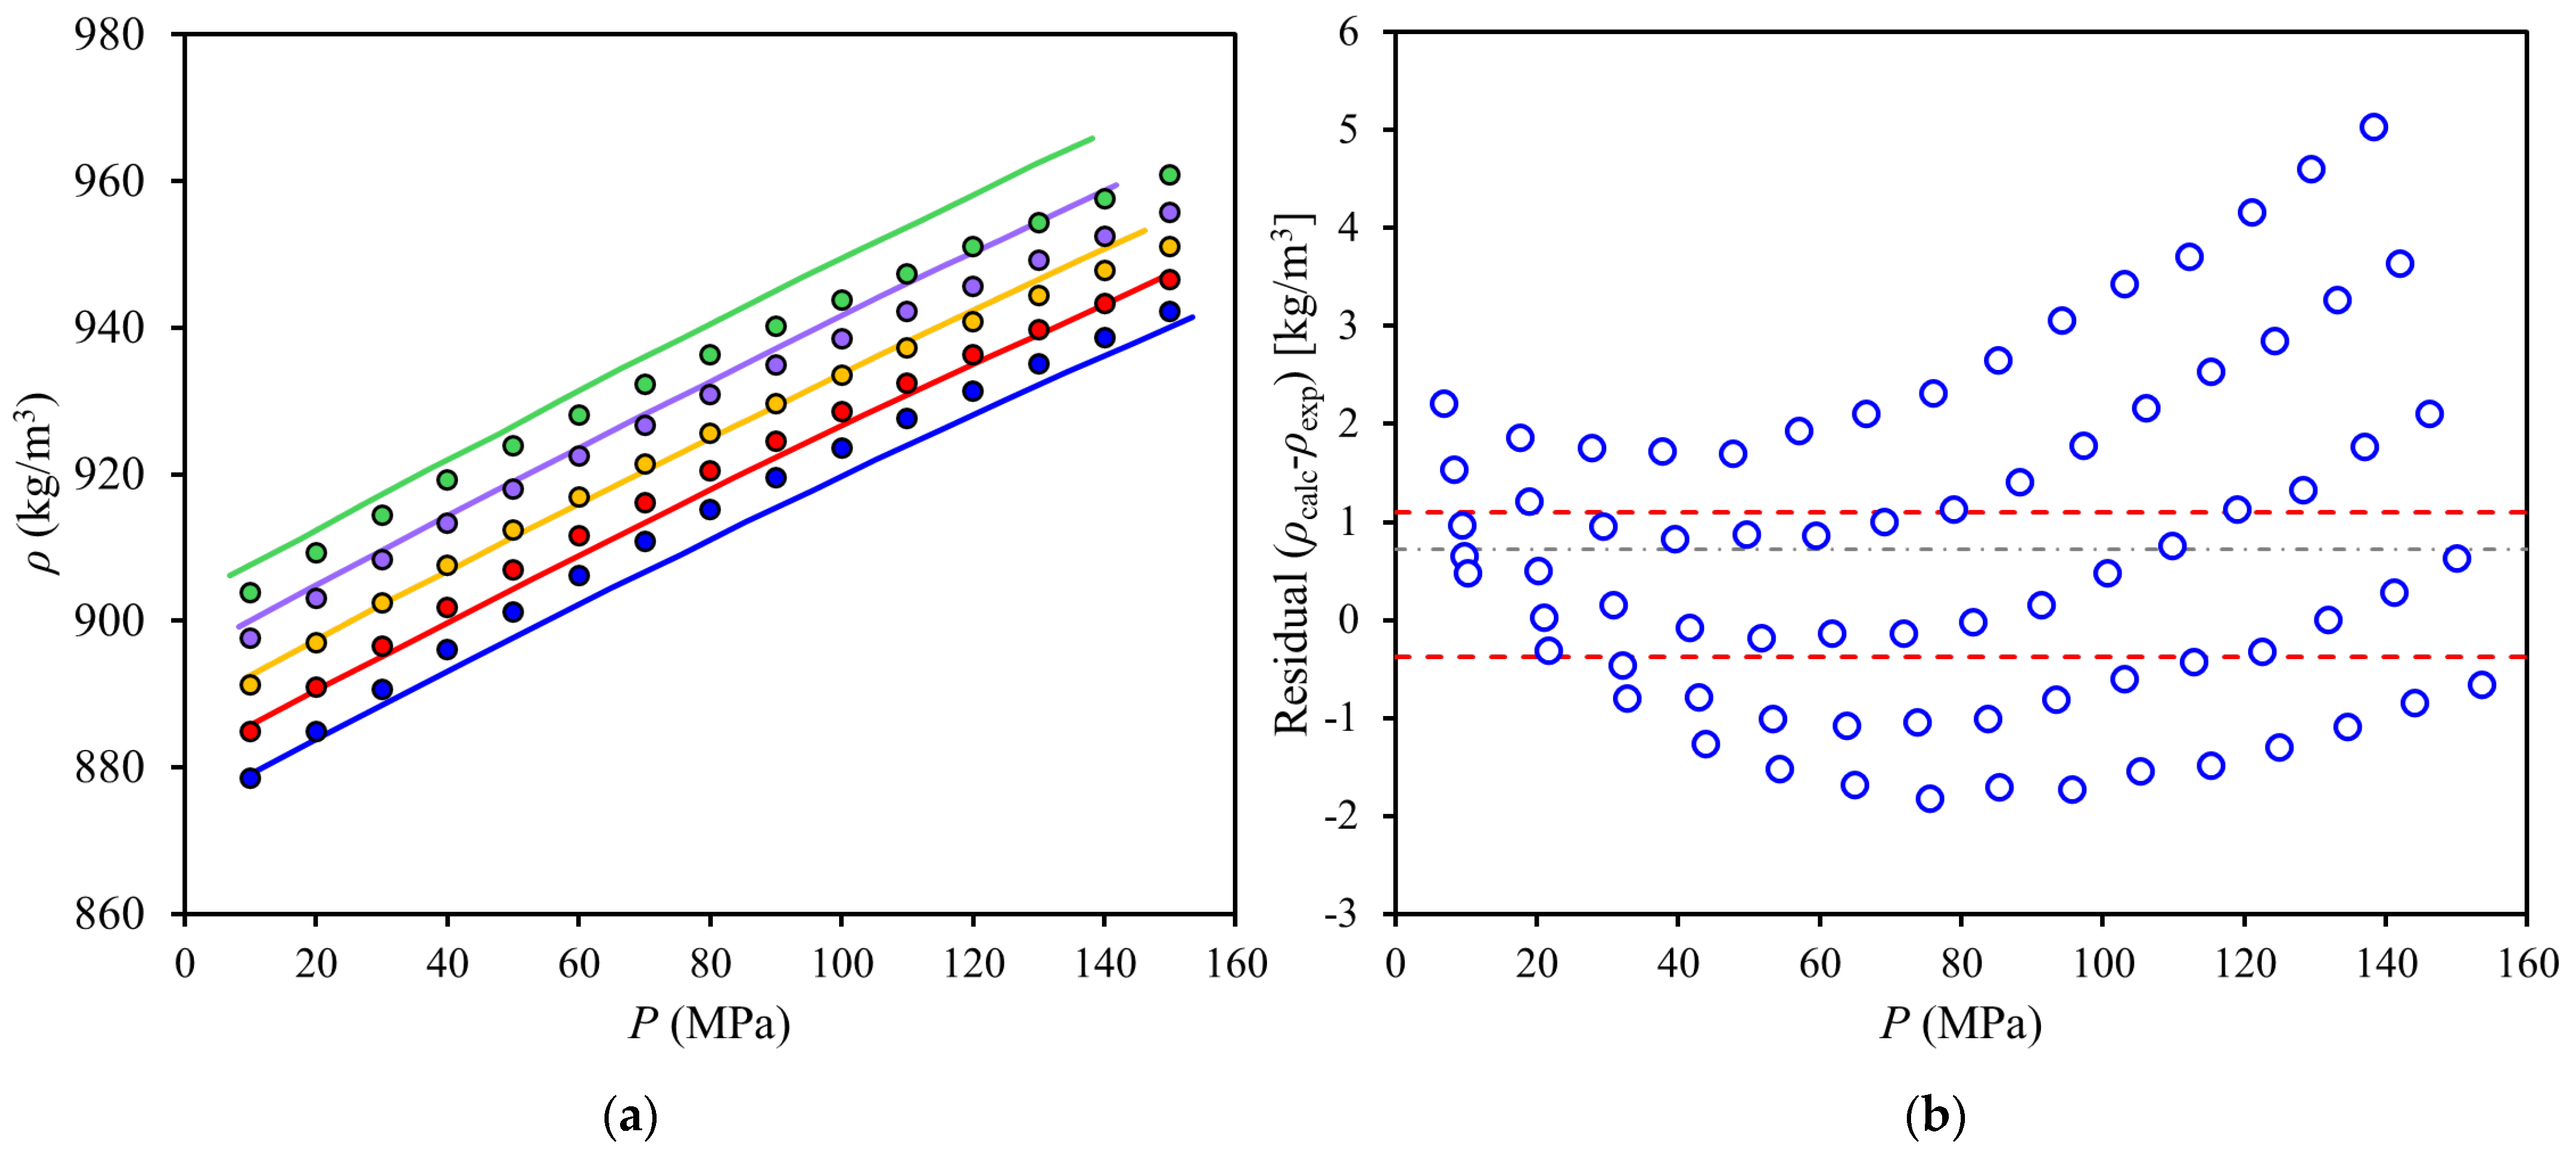

| Fatty Acid Content (%) | ||||||||||||||
|---|---|---|---|---|---|---|---|---|---|---|---|---|---|---|
| Oils | Mw (g mol−1) | C8:0 | C10:0 | C12:0 | C14:0 | C16:0 | C16:1 | C18:0 | C18:1 | C18:2 | C18:3 | C20:0 | C22:0 | C24:0 |
| RPO | 866.10 | 0.03 | 0.04 | 0.32 | 0.90 | 21.60 | 0.26 | 3.20 | 56.60 | 16.00 | 0.40 | 0.50 | 0.10 | 0.10 |
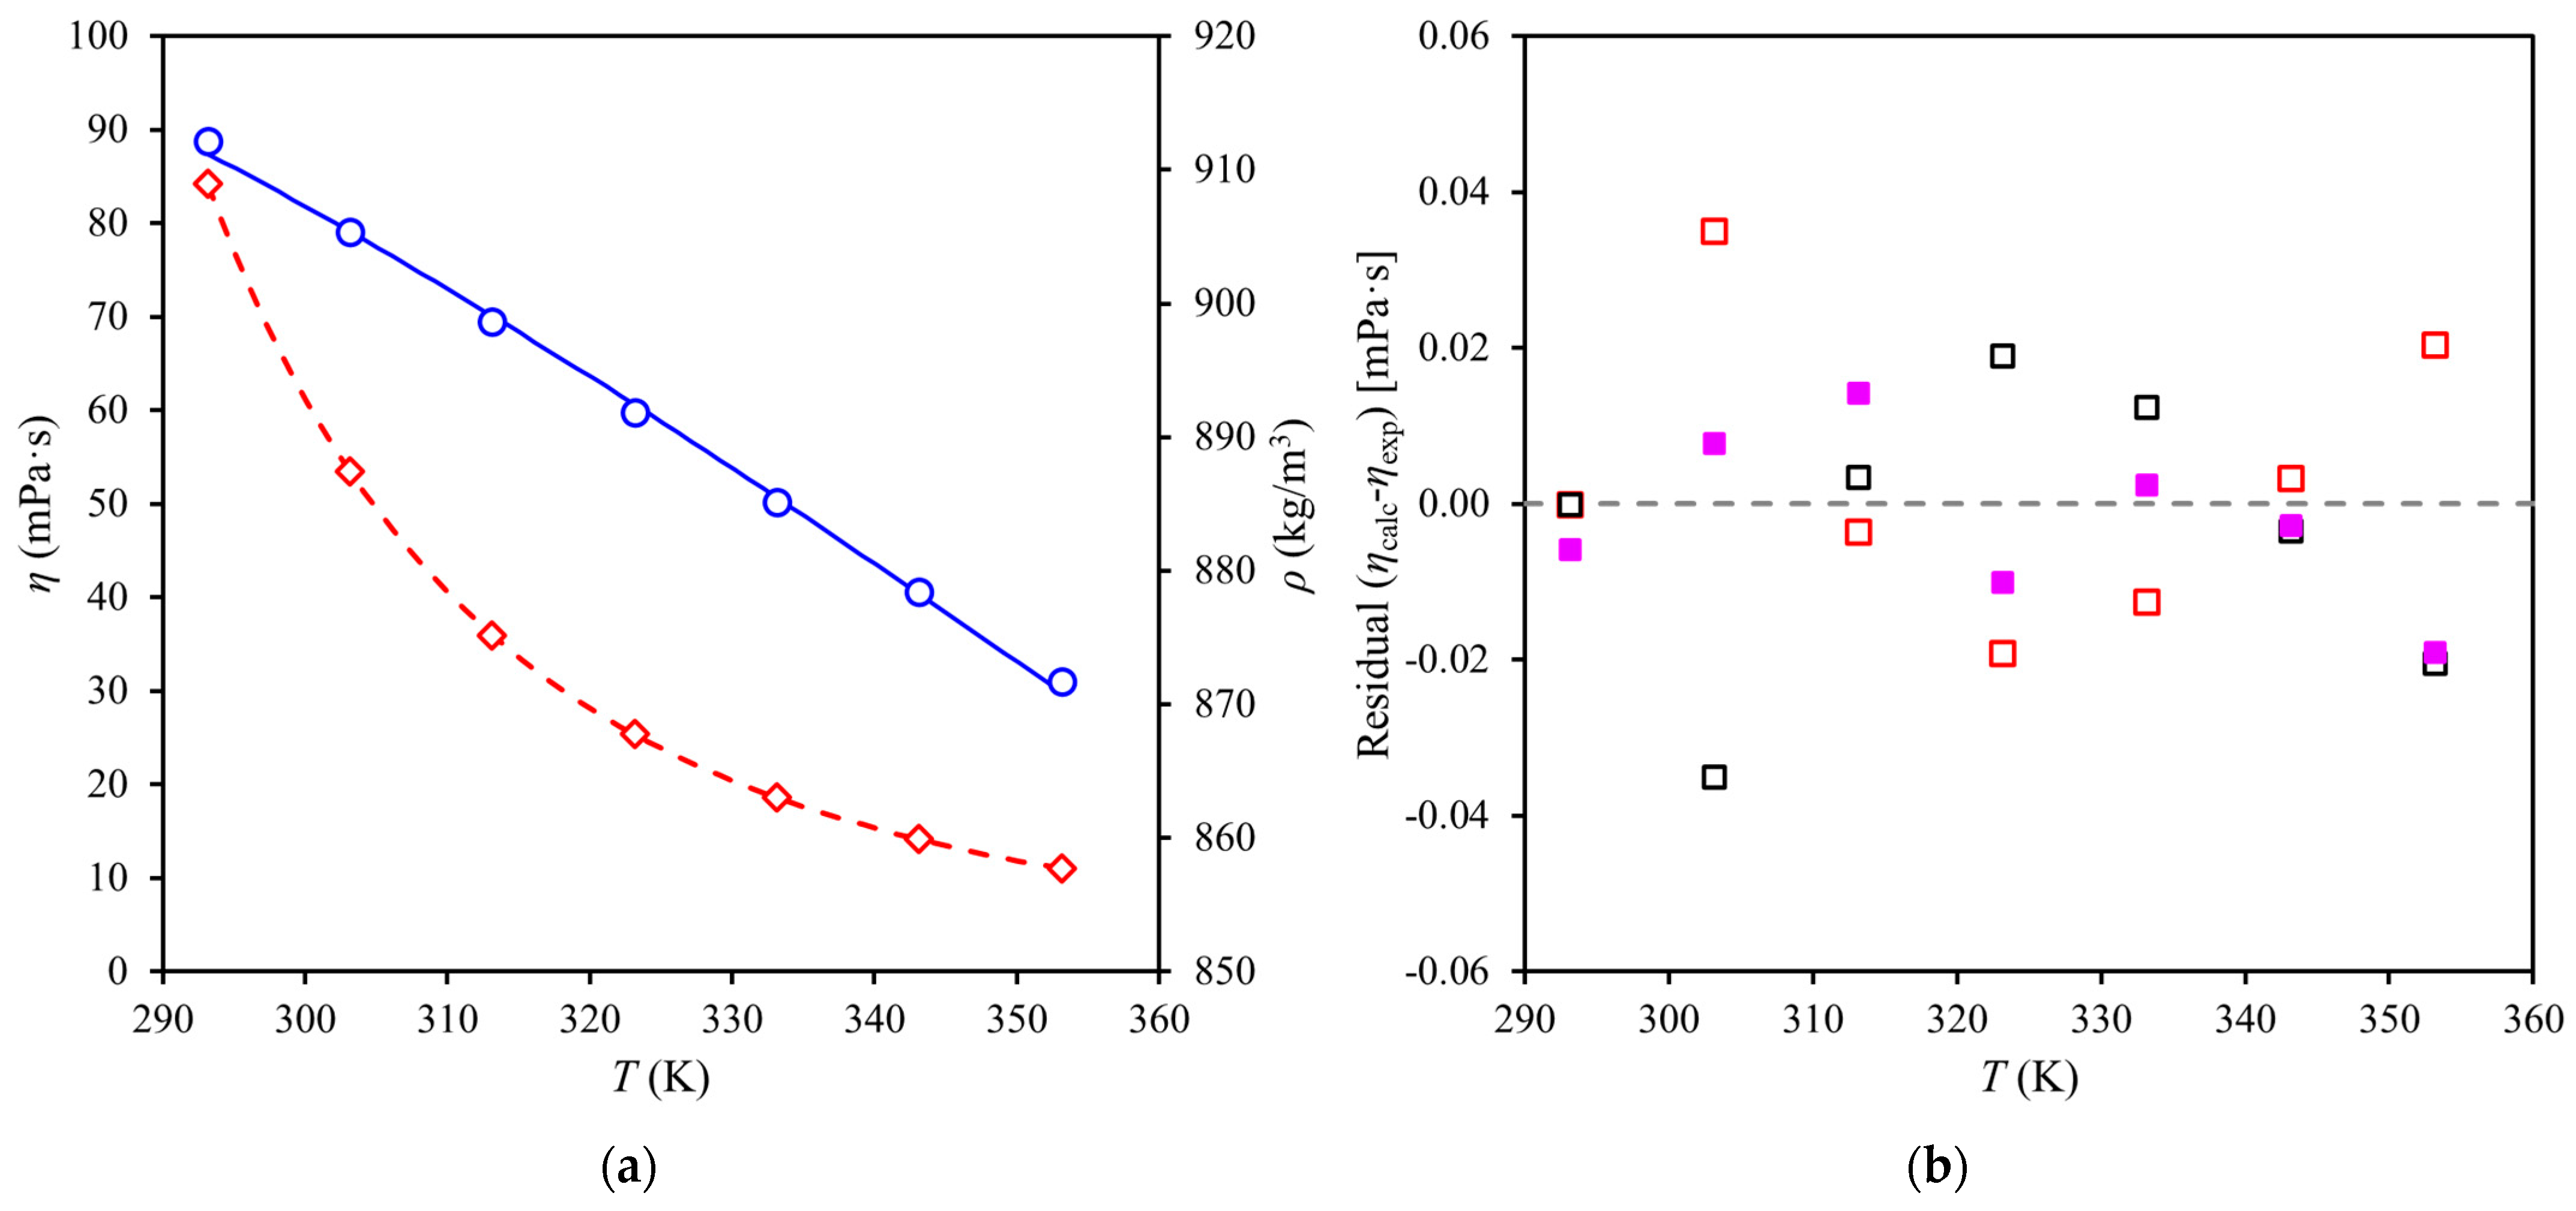
| T (K) | η (mPa∙s) | ρ a (kg m−3) |
|---|---|---|
| 293.15 | 84.24 ± 0.147 | 912.14 |
| 303.15 | 53.53 ± 0.081 | 905.39 |
| 313.15 | 35.99 ± 0.044 | 898.63 |
| 323.15 | 25.38 ± 0.024 | 891.85 |
| 333.15 | 18.63 ± 0.015 | 885.13 |
| 343.15 | 14.14 ± 0.011 | 878.41 |
| 353.15 | 11.05 ± 0.010 | 871.70 |
| Model | Parameters | (%) | ||
|---|---|---|---|---|
| Density | Viscosity | |||
| Rodenbush et al. [15] | (kg m−3) | 934.0360 | 0.0505 | 0.0771 |
| −209.6053 | ||||
| VFT | () | 0.1063 | ||
| (K) | 914.5262 | - | 0.0609 | |
| (K) | −156.1386 | |||
| FV | 0.9893 | |||
| 0.1440 | - | 0.0436 | ||
| 1.2358 | ||||
| T (K) | ||||||
|---|---|---|---|---|---|---|
| 312.1 | 321.9 | 331.9 | 341.8 | 351.9 | 312.0 b | |
| P (MPa) | (kg m−3) | |||||
| 10 | 904.5 | 898.2 | 891.9 | 885.5 | 879.2 | 904.6 |
| 20 | 910.0 | 903.7 | 897.6 | 891.5 | 885.4 | 909.9 |
| 30 | 915.0 | 909.0 | 903.0 | 897.2 | 891.2 | 914.9 |
| 40 | 919.8 | 913.9 | 908.2 | 902.5 | 896.7 | 919.7 |
| 50 | 924.5 | 918.6 | 913.0 | 907.5 | 901.8 | 924.3 |
| 60 | 928.7 | 923.1 | 917.6 | 912.3 | 906.7 | 928.6 |
| 70 | 932.9 | 927.4 | 922.1 | 916.8 | 911.5 | 932.9 |
| 80 | 937.0 | 931.6 | 926.3 | 921.1 | 915.8 | 936.9 |
| 90 | 940.8 | 935.5 | 930.4 | 925.2 | 920.2 | 940.7 |
| 100 | 944.5 | 939.2 | 934.2 | 929.2 | 924.2 | 944.4 |
| 110 | 948.1 | 942.8 | 937.9 | 933.1 | 928.2 | 948.1 |
| 120 | 951.7 | 946.4 | 941.5 | 936.9 | 932.0 | 951.6 |
| 130 | 955.1 | 949.9 | 945.1 | 940.5 | 935.7 | 955.0 |
| 140 | 958.3 | 953.2 | 948.4 | 944.0 | 939.3 | 958.2 |
| 150 | 961.6 | 956.5 | 951.8 | 947.3 | 942.8 | 961.4 |
| Ref. | ||||||||
|---|---|---|---|---|---|---|---|---|
| MPa | ||||||||
| RPO | 8.756 × 10⁻⁴ | 6.951 × 10⁻⁷ | 1.995 × 10⁻¹⁰ | 6.484 × 10² | 4.563 × 10⁻³ | 9.514 × 10⁻² | 0.021 | This work |
| Oils | Mw (g mol−1) | (Å) | (K) | ARD (%) | Ref. | |
|---|---|---|---|---|---|---|
| RPO | 821.7 | 34.003 | 3.400 | 277.35 | 0.143 | This Work |
Disclaimer/Publisher’s Note: The statements, opinions and data contained in all publications are solely those of the individual author(s) and contributor(s) and not of MDPI and/or the editor(s). MDPI and/or the editor(s) disclaim responsibility for any injury to people or property resulting from any ideas, methods, instructions or products referred to in the content. |
© 2025 by the authors. Licensee MDPI, Basel, Switzerland. This article is an open access article distributed under the terms and conditions of the Creative Commons Attribution (CC BY) license (https://creativecommons.org/licenses/by/4.0/).
Share and Cite
Lee, J.L.; Chong, G.H.; Hiraga, Y.; Sato, Y.; Ota, M.; Smith, R.L., Jr. Experimental Liquid Densities of Red Palm Oil at Pressures up to 150 MPa from (312 to 352) K and Dynamic Viscosities at 0.1 MPa from (293 to 353) K. Liquids 2025, 5, 13. https://doi.org/10.3390/liquids5020013
Lee JL, Chong GH, Hiraga Y, Sato Y, Ota M, Smith RL Jr. Experimental Liquid Densities of Red Palm Oil at Pressures up to 150 MPa from (312 to 352) K and Dynamic Viscosities at 0.1 MPa from (293 to 353) K. Liquids. 2025; 5(2):13. https://doi.org/10.3390/liquids5020013
Chicago/Turabian StyleLee, Jia Lin, Gun Hean Chong, Yuya Hiraga, Yoshiyuki Sato, Masaki Ota, and Richard Lee Smith, Jr. 2025. "Experimental Liquid Densities of Red Palm Oil at Pressures up to 150 MPa from (312 to 352) K and Dynamic Viscosities at 0.1 MPa from (293 to 353) K" Liquids 5, no. 2: 13. https://doi.org/10.3390/liquids5020013
APA StyleLee, J. L., Chong, G. H., Hiraga, Y., Sato, Y., Ota, M., & Smith, R. L., Jr. (2025). Experimental Liquid Densities of Red Palm Oil at Pressures up to 150 MPa from (312 to 352) K and Dynamic Viscosities at 0.1 MPa from (293 to 353) K. Liquids, 5(2), 13. https://doi.org/10.3390/liquids5020013