Article

Enhancing Physiological Realism in Nasal Spray Deposition Studies: Synthetic Mucus Properties and Interactions with Saline Solutions and Stereolithography Resin

1
Department of Biomedical Engineering, University of Massachusetts, Lowell, MA 01854, USA
2
Department of Mechanical Engineering, Shiraz University, Shiraz 71946, Iran
3
Department of Mechanical Engineering, California Baptist University, Riverside, CA 92504, USA
*
Author to whom correspondence should be addressed.
Liquids 2025, 5(2), 11; https://doi.org/10.3390/liquids5020011
Submission received: 15 January 2025 / Revised: 19 March 2025 / Accepted: 2 April 2025 / Published: 7 April 2025
(This article belongs to the Section Physics of Liquids)

Abstract

:
This study investigated the role of synthetic mucus coatings in enhancing the physiological relevance of in vitro nasal spray deposition assessments using 3D-printed nasal cavity models. Synthetic mucus solutions, representing normal (0.25% w/v xanthan gum) and diseased (1% w/v xanthan gum) nasal conditions, were developed to mimic the viscoelastic properties of human nasal mucus. Their physical properties, including viscosity, surface tension, contact angle, and adhesivity on dry and synthetic mucus-coated stereolithography (SLA) surfaces, were systematically characterized. Comparative experiments evaluated the behavior of saline drops and liquid films on dry versus synthetic mucus-coated SLA surfaces at inclinations of 30°, 45°, and 60°. Observational deposition experiments using anatomically accurate nasal models were conducted under a 45° backward-tilted head position with gentle sniff airflow across uncoated, 0.25% w/v mucus-coated, and 1% w/v mucus-coated surfaces. Synthetic mucus coatings significantly influenced saline spray deposition patterns. On uncoated surfaces, deposition consisted of scattered droplets and limited film formation, mainly in the anterior and turbinate regions. In contrast, synthetic mucus coatings facilitated broader and more uniform liquid distribution due to diffusion and lubrication effects. These findings highlight the value of synthetic mucus coatings for better simulating nasal environments, offering insights to optimize nasal spray formulations and delivery devices.

1. Introduction

Intranasal drug delivery has emerged as a focal point in pharmacotherapy, offering a non-invasive route for administering therapeutic agents effectively through the nasal cavity [1,2]. Among the various devices used for drug delivery, nasal sprays are the most widely utilized, primarily due to their convenient administration, more effective nasal deposition compared to nasal drops, and high patient compliance. When the nozzle of a spray bottle is positioned inside the nostril, liquid formulations, such as solutions, suspensions, or emulsions, are dispersed into fine droplets to ensure optimal deposition within the nasal cavity. For effective retention in the nasal passages, droplet particles typically need an aerodynamic diameter exceeding 10 µm, as smaller particles are more likely to travel deeper into the respiratory tract [3,4]. Nasal sprays provide rapid absorption of medications, allowing drugs to quickly enter systemic circulation while bypassing the hepatic first-pass effect, a significant limitation of oral drug administration. This bypass ensures that a higher proportion of the active drug reaches systemic circulation, optimizing therapeutic outcomes [1].
Initially developed for managing nasal allergies and the common cold, nasal spray pumps have since expanded their applications to provide targeted topical treatments for conditions such as rhinitis and sinusitis in the nose and paranasal sinuses [5,6]. Moreover, the nasal route has gained popularity for needle-free systemic drug delivery, offering rapid absorption and immediate therapeutic effects [7,8,9]. Nasal sprays are also being explored for mucosal immunization, delivering medications, influenza vaccines, or other vaccines directly to the posterior nasal cavity and nasopharynx, key sites for initiating immune responses against respiratory pathogens, including SARS-CoV-2, the virus responsible for COVID-19 [7,10,11,12]. The ability of nasal sprays to effectively target specific regions within the nasal cavity depends on several factors, including the complex anatomical structure of the nasal passages, as well as spray parameters such as design, discharge velocity, droplet size, plume angle, and release orientation [13,14]. Wider plumes and larger droplets typically result in deposition within the anterior nasal regions, while narrower plume angles and smaller droplets are more effective at reaching deeper areas, such as the posterior turbinates and nasopharynx. Inspiratory airflow during administration further aids in transporting medication to target regions, ensuring optimal therapeutic outcomes [15].
Despite their advantages, conventional nasal sprays face significant challenges in effectively delivering drugs to deeper nasal regions due to the nasal cavity’s geometric complexity and the presence of its mucus layer. The mucus layer, while vital for respiratory defense, often acts as a barrier, influencing drug deposition, distribution, and absorption. Much of the administered dose tends to deposit in the nasal vestibule or valve area, limiting the efficacy of intranasal drug delivery systems. Optimizing deposition in regions such as the turbinate is crucial for improving drug delivery outcomes. Recent studies have highlighted strategies like head positioning to enhance spray distribution in these regions, offering promising solutions for better therapeutic efficacy [16,17,18].
The mucus layer plays a dual role, functioning as both a defense mechanism and a challenge to drug delivery. Comprising a complex mixture of water, mucins, DNA, lipids, ions, proteins, and cellular debris, mucus forms a viscoelastic gel that traps particulates and facilitates mucociliary clearance (MCC) [19,20]. This gel-like layer, maintained by secretions from goblet cells and submucosal glands, relies on mucins—high molecular weight glycoproteins—to provide the viscoelastic properties necessary for effective MCC [20,21]. While essential for trapping pathogens and particulates, the mucus layer’s physical and rheological properties also hinder the diffusion and deposition of therapeutic sprays. Studies using confocal fluorescence microscopy indicate that the thickness of airway mucus can range from 5 to 55 µm [22]. MCC, a pivotal respiratory defense mechanism, involves cilia propelling mucus toward the nasopharynx, where it is swallowed or expelled. Under normal conditions, this “conveyor belt” mechanism clears trapped particles within 15–20 min [23,24]. The biphasic structure of nasal mucus, comprising a periciliary liquid layer facilitating ciliary movement and an overlying gel layer trapping particles, is crucial for effective clearance [19,20]. However, factors such as smoking, circadian rhythms, or respiratory diseases can impair MCC by altering ciliary function or increasing mucus viscosity [25,26].
While the mucus layer is vital for respiratory defense, it also presents barriers to nasal drug delivery. The rheological properties of mucus, primarily governed by hydration levels and mucin content, influence its ability to move and trap particulates. At the macroscopic level, mucus behaves as a non-Newtonian, thixotropic material, exhibiting both flow-related viscous properties and deformation-resistant elastic characteristics [19,27]. Under low shear conditions, its viscosity can be 100 to 10,000 times greater than that of water. However, as the shear rate increases toward physiological limits, such as during coughing, mucus transitions into a shear-thinning state, where its viscosity significantly decreases, closely resembling that of water [28]. For mucus in a healthy state (i.e., unaffected by respiratory diseases), the viscosity at low shear rates typically measures around 103 Pa·s. At shear rates approaching the physiological maximum, such as those occurring during coughing, the viscous resistance is drastically reduced to approximately 2–10 Pa·s [19]. Factors such as particle size, mucus viscosity, and interactions with mucin glycoproteins influence deposition, distribution, and bioavailability [2,24]. Fine particles are more likely to diffuse through the mucus, whereas larger particles may be trapped, limiting drug absorption [3,29].
The inclusion of mucoadhesive polymers in nasal formulations offers a potential solution to improve drug retention in the nose [30,31,32]. However, they adversely affect drug diffusion, necessitating precise formulation strategies [2,22]. Additionally, the viscoelastic properties of mucus can vary significantly under pathological conditions. In diseases such as cystic fibrosis (CF) or chronic obstructive pulmonary disease (COPD), mucus demonstrates substantially higher viscosity and impaired clearance dynamics, further complicating drug delivery [21,33].
In vitro nasal spray deposition studies often utilized dry nasal cavity models [15,34,35,36,37,38,39,40,41,42], which did not replicate the in vivo conditions. While such studies have advanced the understanding of spray behavior and deposition patterns in morphologically accurate casts, they failed to consider the interactions between nasal sprays and the mucus layer, a key physiological factor influencing deposition, distribution, and retention. The absence of a realistic mucosal layer limits the ability of these models to accurately simulate in vivo conditions, particularly the impact of varying mucus consistencies on spray performance. The rheological properties of mucus, primarily determined by its hydration level and mucin content, vary significantly between healthy and diseased states [19]. Studies indicate that increased infection severity is associated with higher mucus viscosity [43], which can impact the final outcome of nasal spray deposition. Understanding these effects is essential for optimizing intranasal formulations and devices. Addressing this gap is critical for bridging the divide between in vitro experimentation and real-world applications, laying the groundwork for more accurate and clinically relevant outcomes.
The objective of this study is to enhance the physiological realism of in vitro nasal models by incorporating synthetic mucus coatings designed to closely mimic the viscoelastic nature and functional properties of human nasal mucus. While not fully replicating the complex composition of actual mucus, these synthetic solutions aim to approximate its behavior in influencing drug deposition, diffusion, and retention, bridging the gap between current in vitro methods and real-life nasal conditions to improve intranasal drug delivery. Specific aims include the following:
(1)
Formulate synthetic mucus solutions with distinct viscosities that simulate both normal and diseased nasal conditions, and characterize their key physical properties, including viscosity, surface tension, contact angle, and adhesivity;
(2)
Compare the impaction of saline sprays on dry and mucus-coated SLA surfaces to determine the role of mucus in altering spray deposition;
(3)
Investigate the post-deposition translocation of saline solutions on dry versus mucus-coated SLA surfaces under varying surface inclinations;
(4)
Visualize nasal spray deposition and translocation in transparent nasal models without versus with synthetic mucus coatings.

2. Materials and Methods

2.1. Study Design

A saline solution (Basic Care, Elkins Park, PA, USA) containing 0.65% sodium chloride, disodium phosphate, phenylcarbinol, monosodium phosphate, and benzalkonium chloride was used as the nasal spray formulation. Xanthan gum (XG) saline solutions were used to simulate mucus. Two synthetic mucus concentrations were considered herein: a 0.25% w/v XG solution representing healthy mucus and a 1% w/v XG solution representing a diseased condition. Measured properties of the spray formulation included viscosity and surface tension; the interactions between the formulation and SLA surfaces (dry, coated with 0.25% w/v XG, and coated with 1% w/v XG) were characterized using contact angle and adhesivity (
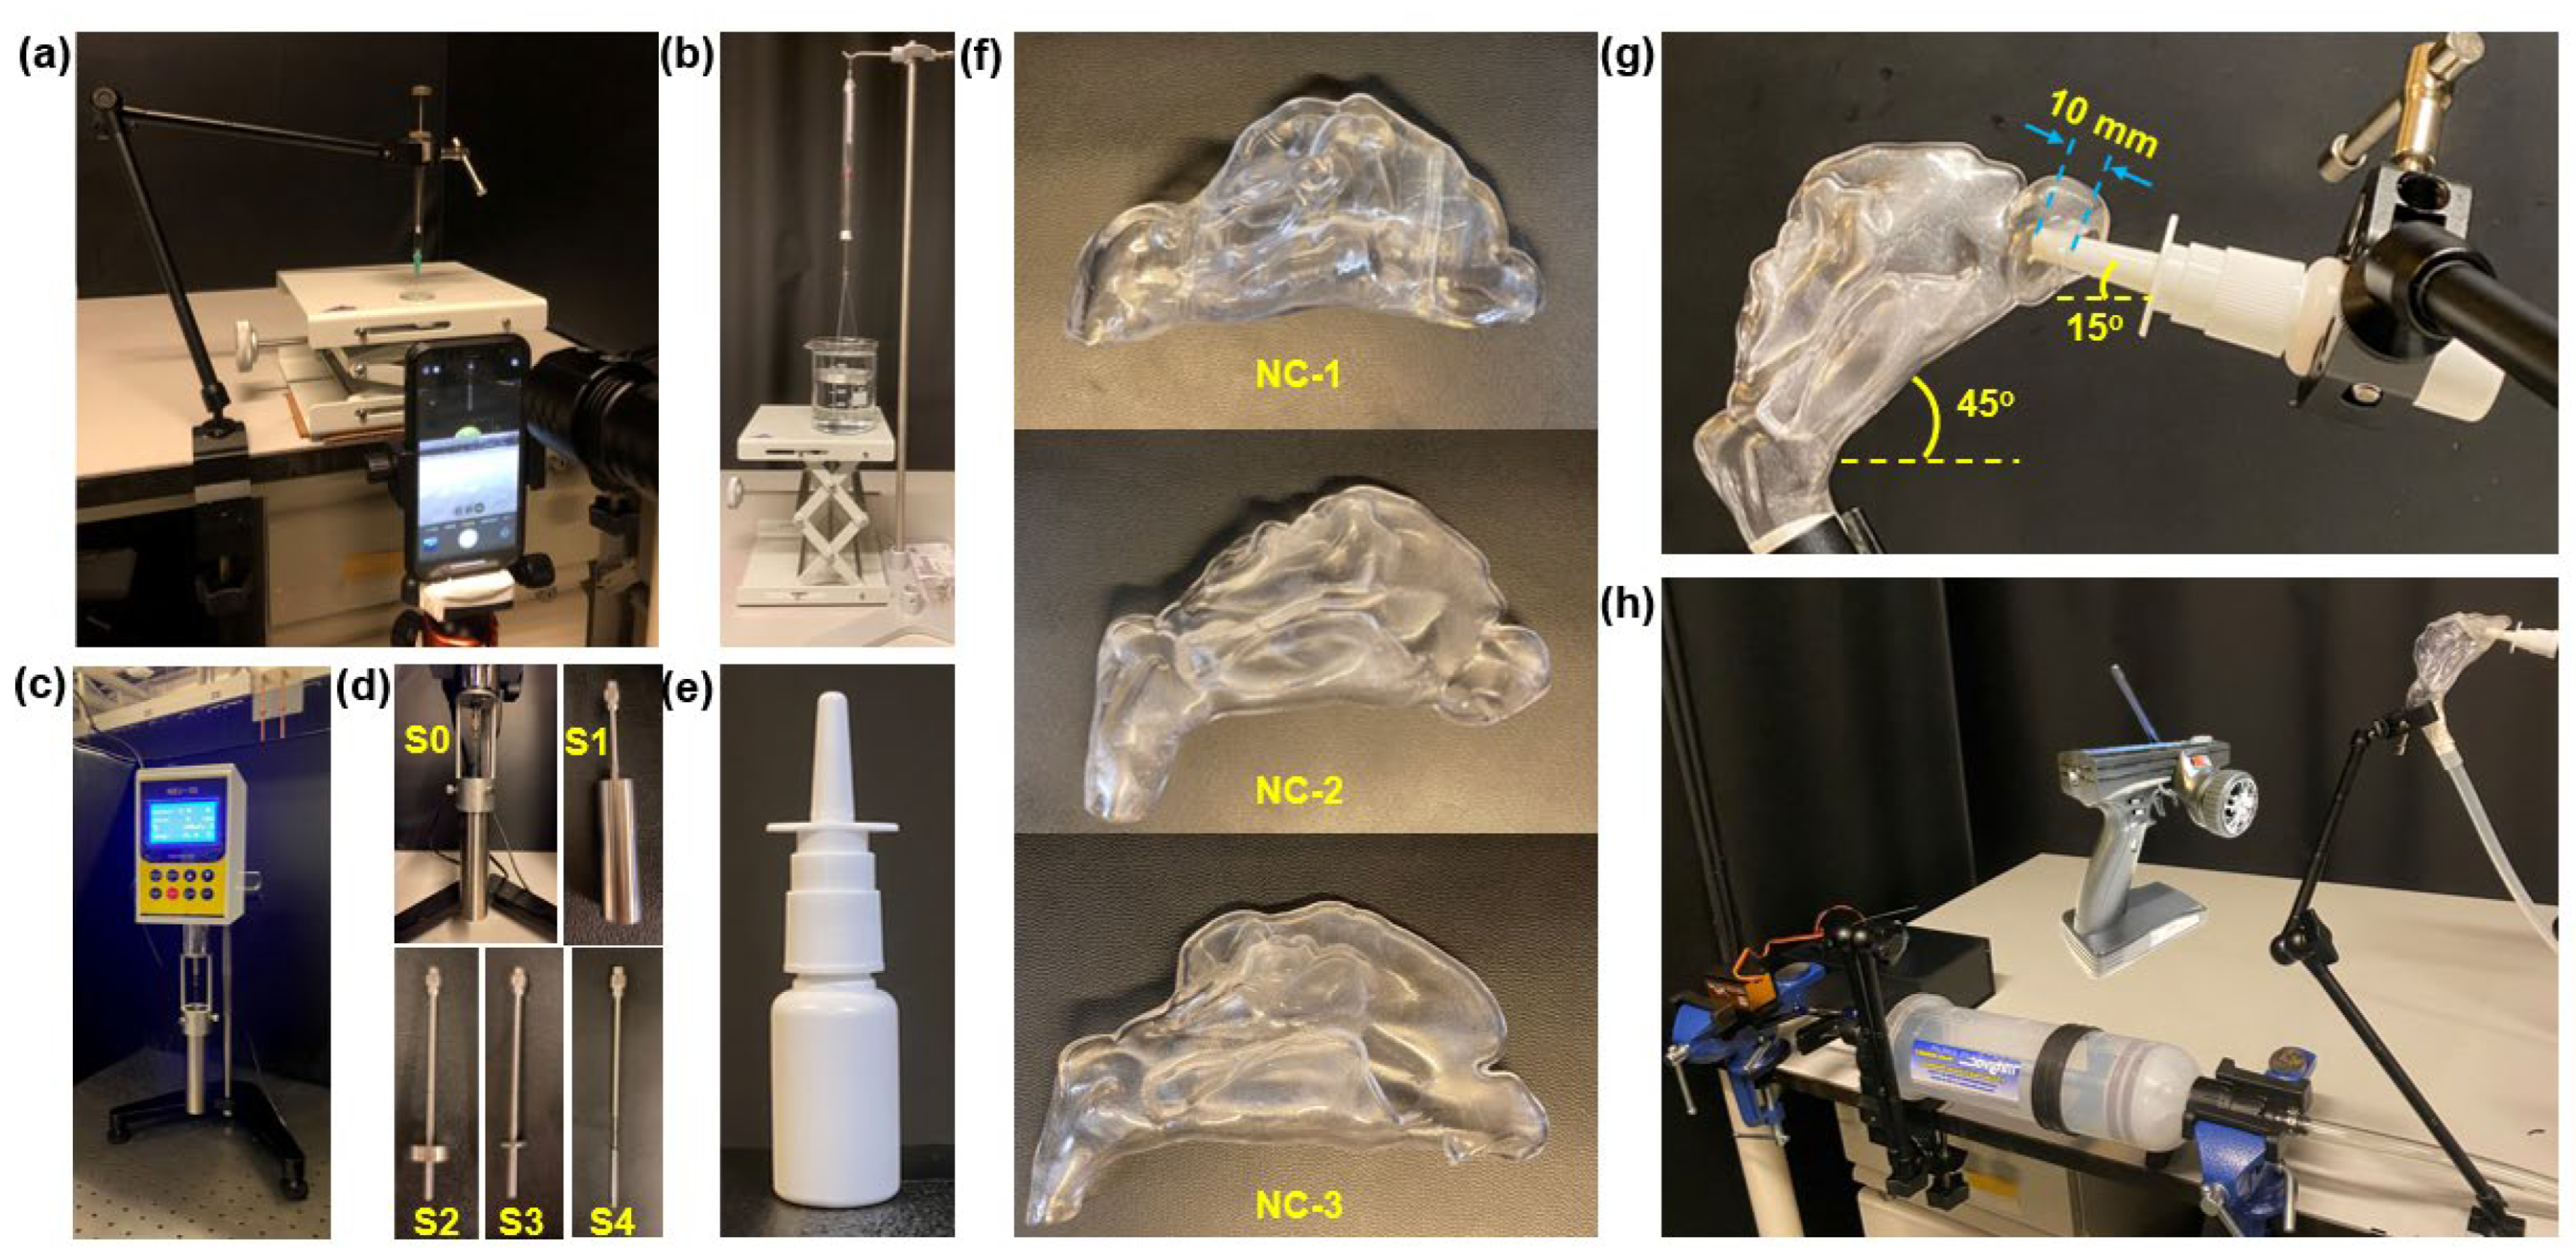
Figure 1a–d). Measured nasal spray properties included aerosol size distribution and spray plume evolution (via recording). Inertial impaction and post-impaction translocation of nasal sprays on flat SLA plates (dry and mucus-coated) were tested at various inclination angles (30°, 45°, and 60°). These tests provided insights into deposition mechanisms, including the gravity effect and the synthetic mucus coating effect. These results complemented intranasal deposition tests, aiding in the interpretation of dynamic interactions between synthetic mucus coatings and saline sprays.
To investigate the effects of synthetic mucus coatings on intranasal spray deposition patterns and dynamics, three 3D-printed nasal cavity models (NC-1, NC-2, and NC-3) were utilized (Figure 1f), representing varying nasal morphologies. The models were transparent, had a single passage, and were anatomically accurate. Three nasal wall conditions were considered to capture the variations in mucus consistency and its effects on spray deposition: dry, coated with 0.25% w/v XG to simulate the consistency of healthy nasal mucus, and coated with 1% w/v XG, representing thicker, more viscous mucus often associated with diseased states. The synthetic mucus solutions were introduced into the nasal cavity models using a dental irrigation syringe through both the nostril and nasopharynx. The solutions were added incrementally, and the models were gently tilted and rotated to promote uniform coverage of the internal surfaces and achieve a thin, even coating. Excess synthetic mucus was allowed to drip out of the nostril or nasopharynx to ensure consistent application and prevent pooling within the models.
Spray deposition distributions and patterns within the nasal models were visualized under UV light by adding a water-soluble fluorescent green dye (GLO Effex, Murrieta, CA, USA) to the saline solution. A 20 mL capacity multi-dose nasal spray pump device (Snoot, Sinox Pharma, Topanga, CA, USA) was employed to deliver a single spray dose per test (Figure 1e). During the spray deposition experimental runs, the nasal models were positioned to replicate a 45° backward head tilt (Figure 1g). The spray nozzle was inserted to a depth of 10 mm from the nostril opening and oriented at a 15° angle relative to the horizontal, pointing toward the anterior middle meatus.
Airflow was generated using a custom radio-controlled electromechanical sniff-generating apparatus to simulate a gentle sniff and mimic real-world intranasal delivery dynamics (Figure 1h). The sniff-generating apparatus consisted of a 1.5 L fluid extractor and dispensing syringe (Mityvac, SKF Lubrication Systems USA Inc., St. Louis, MO, USA), with a metal stopper placed at the 150 mL mark inside the syringe body to limit the piston’s maximum travel to this volume, representing the air inhaled during a gentle sniff. This volume of 150 mL was selected as it is smaller than the tidal volume, which typically measures around 500 mL in a healthy adult male and approximately 400 mL in a healthy female [44], aligning with the understanding that a sniff is a rapid and brief inhalation involving a lower air volume compared to a normal tidal breath.
The handle of the syringe was fastened to a turnbuckle rod connected to a rotary servo motor (JX PDI-HV2060MG, Shantou JiXian Electronic Technology Co., Ltd., Guangdong, China), which was controlled via a 2.4 GHz radio control system (Flysky GT3B, Shenzhen Flysky Technology Co., Ltd., Shenzhen, China). The servo was programmed to actuate the piston with a precise travel distance that draws 150 mL of air at a rate corresponding to a gentle sniff. The syringe was connected to the nasopharynx via a 10 mm inner diameter silicone tube, which was securely taped to ensure an airtight seal. This setup allowed air to enter exclusively through the nostril, effectively preventing air leaks. During each test, the sniff was generated simultaneously with nasal spray administration.

2.2. Nasal Cavity Models

To better visualize spray deposition and post-deposition translocation, the nasal cavity models contained only one nasal passage, allowing visualization from both sides and avoiding the obscuring effects from the other passage (Figure 1f). The nasal models were fabricated using a Stratasys Neo450s 3D printer (Eden Prairie, MN, USA) with a clear, rigid stereolithography (SLA) resin (Somos® WaterShed XC 11122, Stratasys, Eden Prairie, MN, USA), producing fully transparent casts with a thickness of 2 mm. Three nasal models were employed, each representing healthy individuals without known respiratory disorders. The first model, NC-1, was developed from MRI scans of a 53-year-old male, using the image-segmentation software 3D Slicer [38,45,46]. The other two models, NC-2 and NC-3, were derived from CT scans of a 60-year-old male and a 42-year-old female, respectively, as reported by Zare et al. [47].

2.3. Development of Synthetic Mucus Solutions

Actual mucus is composed of a complex mixture of components, including water (90–95%), mucins (1–5%), lipids (1–2%), proteins, deoxyribonucleic acid, cells, and cellular debris [48]. For simplicity, the synthetic mucus developed in this study followed the method proposed by Peters et al. [49], incorporating only essential ingredients to replicate the mucus’ viscoelastic properties rather than matching its detailed composition. While the rheology and gelling properties of real mucus are primarily dictated by mucins, xanthan gum was chosen as the gelling agent for the synthetic mucus. This choice is supported by the widespread use of xanthan gum in the food and pharmaceutical industries [50]. Additionally, xanthan gum solutions have been shown to exhibit highly adaptable viscoelastic properties and remain stable when salts are added to simulate physiological salt concentrations [49].
Mucus in pathological conditions often exhibits significantly increased viscosity and adhesivity compared to healthy mucus. According to Abrami et al., the dynamic viscosity of healthy mucus typically falls below 1 Pa·s, while for diseased conditions, such as cystic fibrosis sputum, viscosity values range from 0.1 Pa·s and 100 Pa·s, depending on the hydration level and disease severity [19]. Furthermore, Girod et al. reported that the mucus viscosity in patients with chronic bronchitis varied from 1 Pa·s to 80 Pa·s and increased with the severity. They also demonstrated that mucus adhesion increased with decreasing water content. Adhesivity, defined as the force required to separate the mucus as an adhesive fluid from the surface it adheres to (e.g., the mucosa), exhibited significant variation. In individuals with chronic bronchitis, adhesivity values ranged from 57 to 137 mN/m, while in patients with cystic fibrosis, mucus adhesivity ranged from 50 to 165 mN/m [43].
Given these characteristics, two different xanthan gum solutions were formulated to replicate the viscoelastic and adhesive properties of mucus under both healthy and diseased conditions [51,52]. The “healthy” synthetic mucus was developed by adding 0.25% w/v xanthan gum powder (138 Foods, Inc., Claremont, CA, USA) to the saline solution, while the “diseased” synthetic mucus was prepared using a 1% w/v concentration of xanthan gum powder to achieve increased gelling and viscosity. The solutions were prepared by thoroughly mixing xanthan gum powder into this saline solution, warmed to 55 °C prior to mixing to facilitate powder dissolution. The mixtures were blended using a rotary mixer for over an hour to ensure homogeneity and then left to cool overnight. Before use, the solutions were remixed to ensure uniformity. Freshly prepared solutions were always utilized for the experiments.

2.4. Measurements of Fluid Properties—Contact Angle, Dynamic Viscosity, and Surface Tension

All measurements were conducted at a room temperature of 22.4 °C and a relative humidity of 35%. Contact angle measurements were conducted using a custom-designed apparatus (Figure 1a). Droplets were dispensed onto a flat, transparent, 3D-printed SLA resin sample using a 500 µL threaded plunger syringe (Hamilton 81242, Hamilton, Reno, NV, USA) equipped with a 22-gauge, 0.5-inch stainless steel blunt-tip needle (Metcal 922050-TE, Metcal, Cypress, CA, USA). The sample material was placed on a horizontally leveled, height-adjustable platform to ensure precise control of the distance between the needle tip and the sample surface. Prior to dispensing droplets, the SLA surface was gently cleaned using KIMTECH Science™ Kimwipes™ (Kimberly-Clark, Irving, TX, USA) to remove loose particles and surface contaminants, ensuring optimal cleanliness and measurement accuracy. Droplet volume was controlled using the syringe’s threaded plunger mechanism. High-resolution images of the droplets were captured using a 12 MP mobile phone camera, with illumination provided by a high-intensity flashlight.
The surface tensions of the saline solution and the two XG solution variations were measured using a specialized surface tensiometer (American 3B Scientific, Tucker, GA, USA; Figure 1b), ensuring accurate determination of surface tension values for each solution under investigation. Viscosity assessments were conducted using a digital rotational viscometer (NDJ-5S, Cgoldenwall; Figure 1c), employing the S0 spindle and its corresponding sample chamber, as well as the S2 and S3 spindles, depending on the viscosity of the liquid being measured.

2.5. Saline Spray Characterization

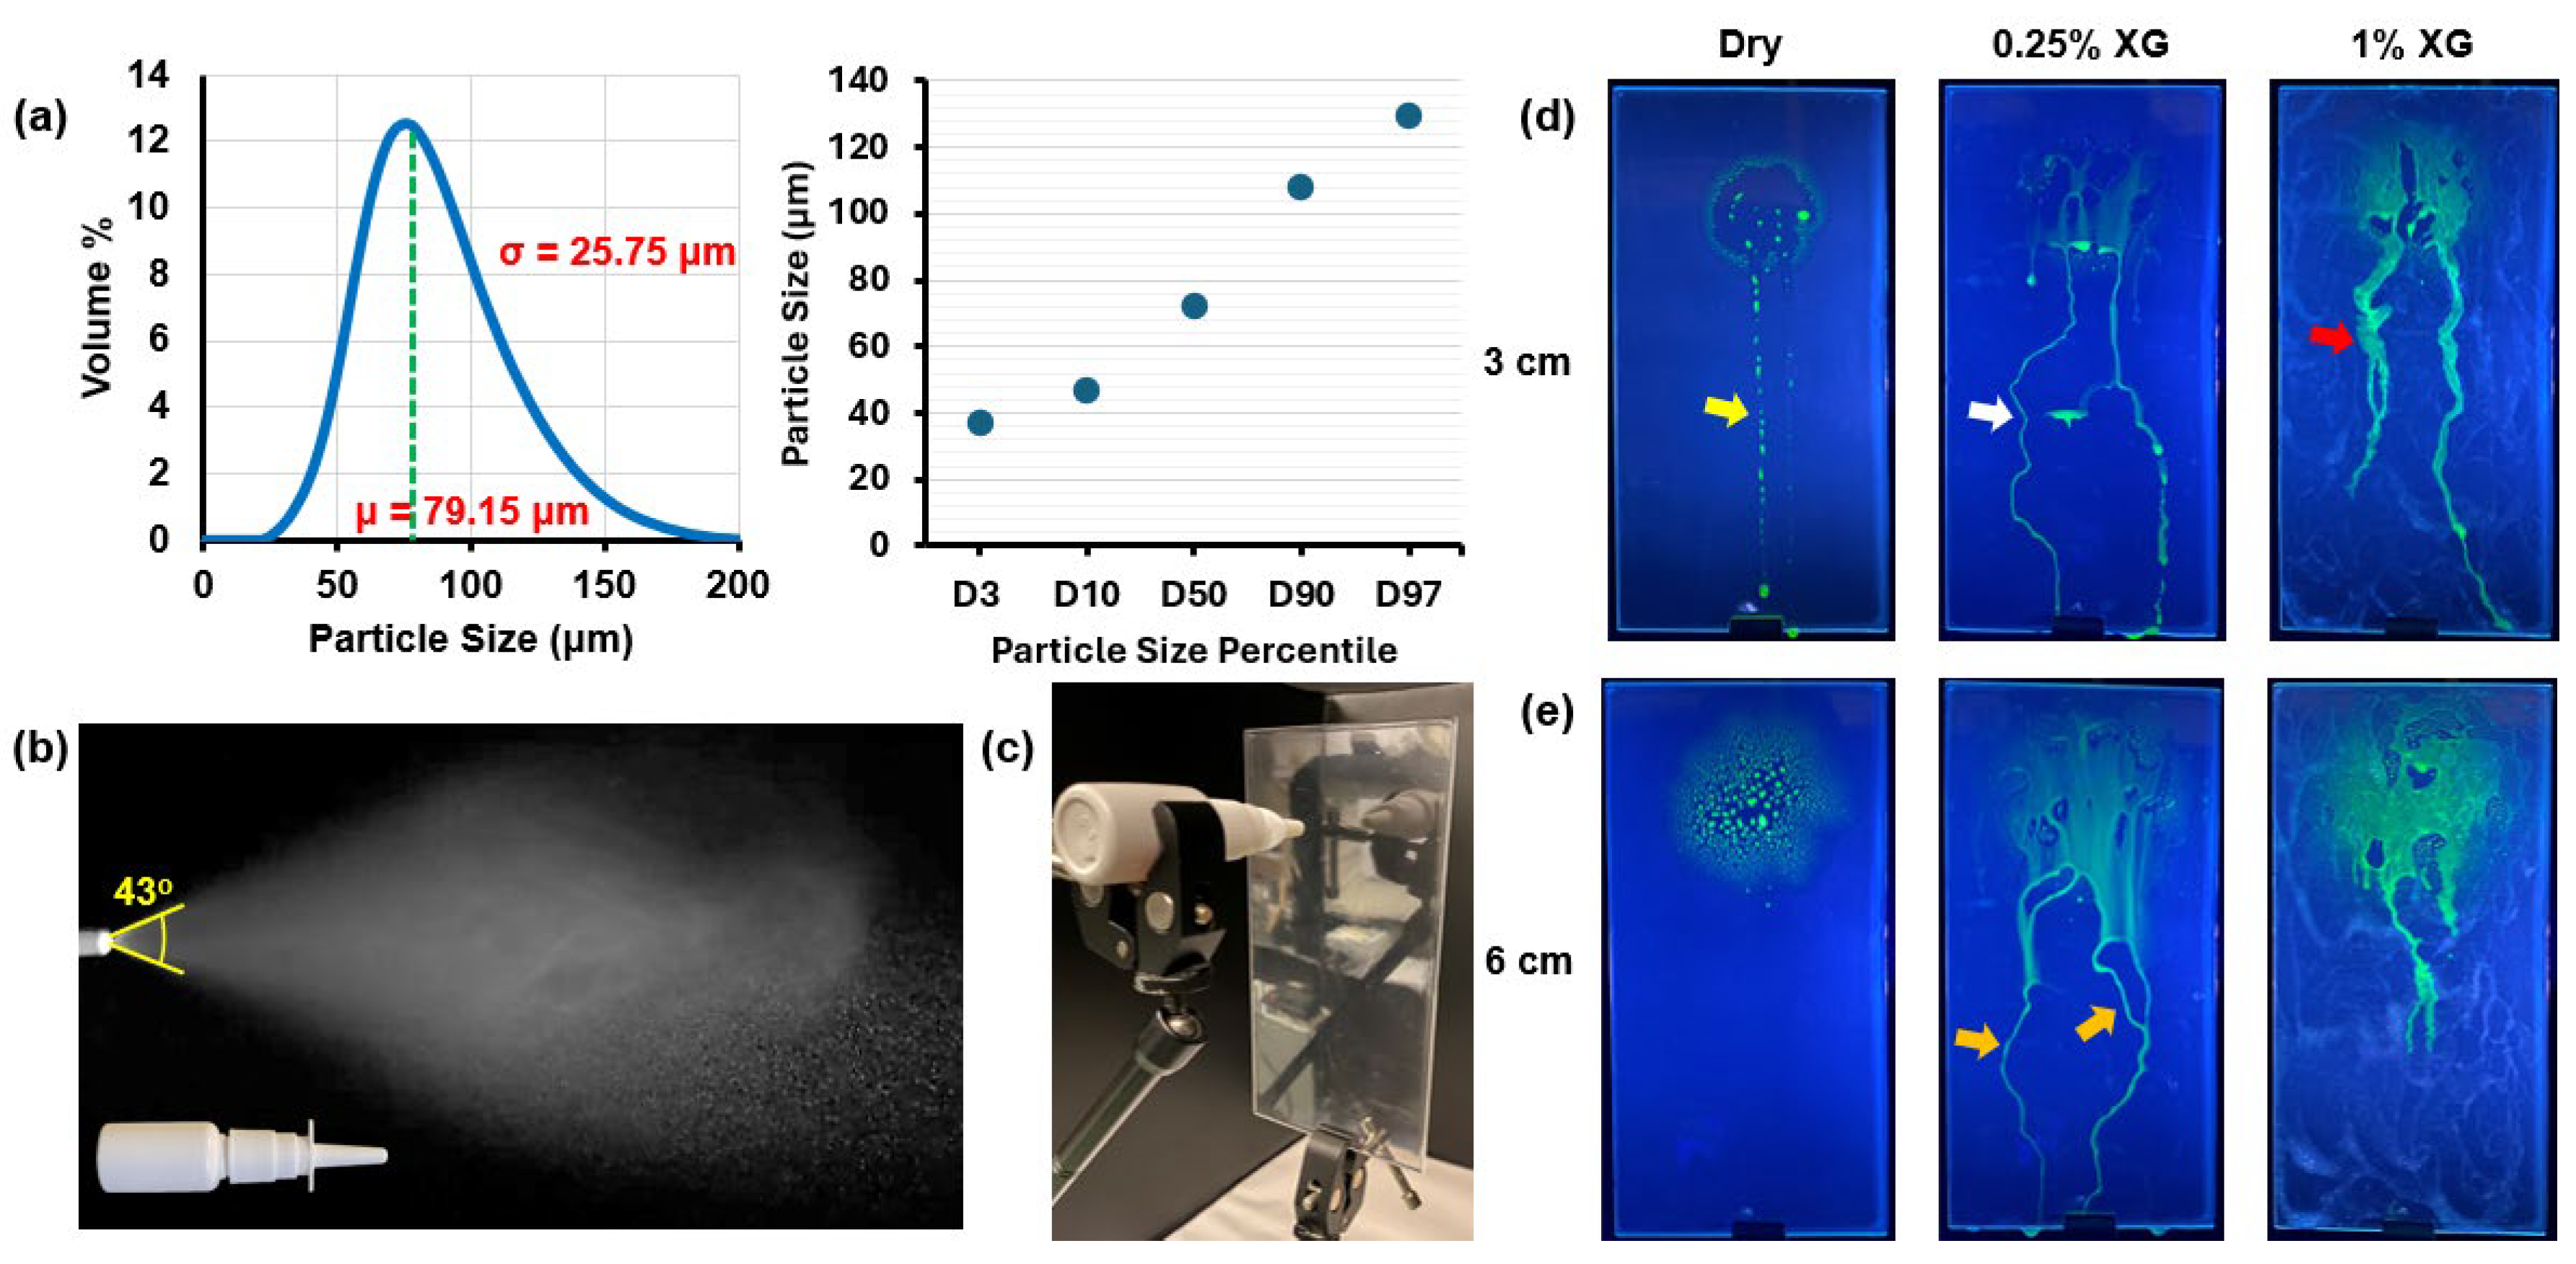
A laser diffraction particle size analyzer (Spraylink, Dickinson, TX, USA) was employed to accurately determine the particle size distribution of the saline spray emitted from the multi-dose nasal spray device. To account for variations in spray characteristics caused by differences in application force and speed, five measurements were conducted, and the averaged results were used to represent the particle size distribution. Additionally, the mass of each spray dose was determined using a precision electronic scale (Bonvoisin, San Jose, CA, USA) by measuring the device’s mass before and after each spray application. Multiple measurements were performed to minimize variability, and the average mass per spray was recorded.

2.6. Tests Assessing Saline Spray and Drop Behavior on Dry and Mucus-Coated SLA Plates

To gain better insights into the deposition/translocation characteristics of intranasally administered saline sprays within the nasal models, tests were conducted to assess the behavior of saline spray droplets and liquid film on a flat plate fabricated from the same SLA resin material as the nasal models. The SLA resin plate, 3D-printed using the same printer, measured 3 mm in thickness, 100 mm in width, and 200 mm in length. The tests were performed under various surface conditions, including (1) dry, (2) coated with a 0.25% w/v XG blanket, and (3) coated with a 1% w/v XG blanket. The synthetic mucus was applied using a glass wiper to achieve as uniform a coating as possible across the plate.

2.6.1. Saline Spray Inertial Impaction on Flat Vertical SLA Plates (Dry and Mucus-Coated)

Deposition and liquid film run-off characteristics were evaluated for saline nasal sprays dispensed perpendicular to the flat SLA resin plate under surface conditions described earlier. The plate was positioned vertically, while the nasal spray bottle was oriented horizontally, with the nozzle tip perpendicular to the plate. This setup allowed gravity to influence the translocation and run-off behavior of deposited droplets and liquid films. Two nozzle-to-plate distances were tested: 30 mm and 60 mm.

2.6.2. Saline Drop Behaviors on SLA Flat Plate at Various Inclination Angles

Behaviors of saline drops on flat SLA plates were evaluated at various inclination angles and under dry and mucus-coated conditions. The first set of tests involved orienting the flat plate at an angle of 30° from the horizontal, dispensing a single drop at an uphill location, and observing the distance traversed by the drop over a 10-s time duration. A 10 µL drop was dispensed from a 500 µL threaded plunger syringe used in the contact angle tests. The syringe was oriented vertically and held in place by a clamp at a fixed location, with the needle pointing downward towards an uphill spot on the inclined plate. The needle tip was positioned close enough to the plate’s surface to allow the 10 µL drop to form and dispense onto the plate’s surface with minimal impact momentum. The average mass per drop was measured using a precision electronic scale and recorded. The test runs were recorded on video under high-intensity lighting from the side of the inclined plate, and the translocation distance covered by a single dispensed drop downhill on the plate’s surface was measured from the recording.
Using the same setup, the behavior of a single saline drop on the SLA plate coated with 0.25% w/v and 1% w/v XG blankets was again evaluated, but viewed from the top of the plate. For these tests, a fluorescent green dye was added to the saline solution, and the events were captured with the camera positioned above the plate under UV light. This setup allowed for clear observation of not only the downhill translocation of the drop but also its transverse and lateral behavior within and across the synthetic mucus blankets.
Additional tests were conducted at three different SLA plate inclinations (30°, 45°, and 60°) to determine the number of saline drops required to initiate liquid film translocation downhill on a dry surface. For each angular inclination, individual drops were gradually added on top of one another to form a film on the plate’s surface. Once the resulting liquid film began translocating downhill, the number of drops was recorded. Additionally, the time taken for the liquid film to travel a distance of 100 mm down the plate was measured for each case.

2.7. Governing Equations for Diffusion, Wettability, and Saline Film Dynamics

The behavior of saline on and within synthetic mucus coatings is governed by equations describing diffusion, wettability, and fluid translocation dynamics. These equations provide a theoretical foundation for interpreting experimental findings, including saline diffusion into the mucus layer, surface energy-driven spreading, and liquid translocation under gravitational and shear forces. While these governing equations provide a theoretical basis for understanding the underlying diffusion and flow dynamics, they were not solved analytically or numerically in this study, as the focus was on experimental validation. Among these equations, only the work of adhesion (Equation (3)) was calculated to assess the fluid–solid interactions. Future studies integrating computational modeling with experimental data may further quantify these processes in greater detail.

2.7.1. Diffusion Dynamics

The diffusion of saline into the mucus layer is described by Fick’s second law of diffusion, which accounts for time-dependent concentration changes across multiple spatial dimensions:
C t = D 2 C
where C = C (x, y, z, t) is the concentration of the saline solution as a function of spatial coordinates (x, y, z) and time (t), D is the diffusion coefficient of the saline solution within the mucus layer, and D 2 represents the Laplacian operator, describing the spatial concentration gradients. This equation provides insight into how saline molecules disperse within the mucus blanket due to concentration gradients.

2.7.2. Wettability and Surface Adhesion

The system’s tendency to minimize surface free energy is governed by Young’s equation, which relates the contact angle of the saline drop to the interfacial tensions between the solid, liquid, and vapor phases:
γ s g = γ s l + γ l g cos θ  
where γ s g   is the surface free energy of the solid, γ s l is the interfacial tension between the solid and the liquid, γ l g is the surface tension of the liquid, and θ is the contact angle of the liquid drop.
The work of adhesion or adhesivity ( W a d ) serves as an additional measure of wettability, complementing surface free energy (as defined by Young’s equation) in characterizing the adhesive interactions between mucus and a specific solid surface. It can be expressed by the following equation, as described in [43]:
W a d = γ l g ( 1 + cos θ )
This relationship aids in understanding the adhesive and cohesive forces that influence drop behavior on the mucus-coated surfaces.

2.7.3. Translocation Dynamics

When saline droplets impinge on the synthetic mucus-coated nasal cavity walls, their behavior is governed by the droplet impact energy and surface conditions. Four possible mechanisms can occur: sticking, rebounding, spreading, or splashing. Upon impaction, collected droplets coalesce to form a liquid film that translocates along the surface. The motion of this film is governed by a balance of forces acting on it, including gravitational, viscous, and surface tension forces. These dynamics are captured by the Eulerian Wall Film Model, which outlines four fundamental processes involved in droplet–wall interactions: (1) the initial interaction as droplets impact and adhere to the wall surface, (2) the tracking of the interface between air and liquid to account for subsequent film behavior, (3) the computation of film properties such as height, velocity, and flow characteristics, and (4) the coupling between the liquid film, surrounding gas phase, and solid wall boundaries. Together, these processes describe the formation, spreading, and movement of the liquid film along the surface.
The conservation of mass and momentum for the liquid film is described by the following governing equations [53]:
h t + s ( h V l ) = m ˙ s ρ l
where h is the film height, V l is the mean film velocity, ∇s is the surface gradient operator, ρl is the liquid density, and m s ˙ represents the mass source due to droplet collection, film separation, or film stripping.
h V l t + s ( h V l V l ) = h s ( P g + P h + P σ ) ρ l + g τ h + 3 2 ρ l τ f s 3 ν l h V + q ˙ ρ l
where Pg is the air pressure, P h = ρ h ( n g ) is the liquid-film-induced pressure normal to the film, and P σ = σ s ( s h ) is the pressure due to surface tension. The second term on the right-hand side of Equation (5) is the tangential gravitational influence on the film, the third term is the viscous shear force at the interface between the air and the film, and the fourth term represents the viscous force at the interface between the film and the wall.

3. Results

3.1. Contact Angles, Viscosity, and Surface Tension Under Various Surface Conditions

The rheological properties of saline and synthetic mucus solutions, including contact angles, dynamic viscosity, and surface tension, were assessed to evaluate their influence on deposition, spreading dynamics, and interaction with SLA resin surfaces under varying conditions. All measurements were performed at a constant room temperature of 22.4 °C.
The measured contact angles provided insights into the wettability and adhesive characteristics of the solutions under study (Figure 2a). For a saline droplet on the dry SLA surface, the contact angle was 70°, indicating moderate wettability. The inclusion of xanthan gum (XG) significantly reduced the contact angle, with 0.25% w/v XG forming a contact angle of 55°, and 1% w/v XG forming a contact angle of 45°. When saline droplets interacted with synthetic mucus coatings, a marked reduction in contact angle was observed. For the 0.25% XG coating, the contact angle decreased to 15°, whereas the 1% XG coating exhibited a slightly higher value of 25°. These results highlight the enhanced spreading of saline droplets on surfaces coated with synthetic mucus compared to the dry SLA resin surface. The work of adhesion, calculated using Equation (3), further underscores these findings. As presented in Table 1, the work of adhesion was highest for saline droplets on the 0.25% XG coating, reflecting the strongest adhesive interaction, followed by the 1% XG coating, and was lowest for the dry SLA resin surface.
The dynamic viscosity and surface tension of the saline solution and xanthan gum (XG) saline solutions used as synthetic mucus were measured to characterize their flow and interfacial properties (Figure 2b). The 0.65% w/v saline solution exhibited a viscosity of 0.97 mPa·s, consistent with its Newtonian behavior. In contrast, the 0.25% w/v and 1% w/v XG saline solutions demonstrated non-Newtonian behavior, with viscosity values decreasing as the viscometer spindle speed increased. For the 0.25% w/v XG solution, the viscosity ranged from 1020 mPa·s at 6 RPM to 297 mPa·s at 30 RPM, while for the 1% w/v XG solution, the viscosity ranged from 14,694 mPa·s at 6 RPM to 3536 mPa·s at 30 RPM. This shear-thinning behavior reflects the xanthan gum’s non-Newtonian characteristics, where viscosity decreases under higher shear rates. The surface tension of the 0.65% w/v saline solution was 77.81 mN/m, while that of the 0.25% w/v XG saline solution was 95.49 mN/m. The surface tension for the 1% w/v XG solution exceeded the limit of the dynamometer used in this study. The application of synthetic mucus coatings created a uniform blanket over the SLA resin plate, with an average thickness of approximately 60 μm (Figure 2c). These properties, combined with contact angle measurements, provide a comprehensive understanding of the fluid–surface interactions and their implications for deposition and spreading behavior.

3.2. Particle Size Distribution, Spray Plume Dynamics, and Inertial Impaction

The characteristics of the saline nasal spray, as well as the deposition patterns observed when dispensing the spray perpendicularly onto the flat SLA resin plate under the various surface conditions, are shown in Figure 3. Figure 3a illustrates the particle size distribution of the saline spray, based on measurements obtained from the laser diffraction particle size analyzer. The distribution curve exhibits a slightly right-skewed profile, with a mean particle size of 79.15 μm and a standard deviation of 25.75 μm. Additionally, the median particle diameter (D50), shown in the right panel of Figure 3a, was measured to be 71.993 μm. The average mass per spray dose was 96.54 mg. The plume generated upon dispensing the spray from the nasal spray device is depicted in Figure 3b. The plume angle was measured to be 43°.
The results of the saline spray inertial impaction tests with a setup in Figure 3c under varying surface conditions are shown in Figure 3d,e, respectively, for nozzle-to-surface distances of 30 mm and 60 mm. As shown in the first panel of Figure 3d, for a dry surface at a nozzle-to-surface distance of 30 mm, the saline spray formed a well-defined circular ring approximately 40 mm wide. Finer droplets were distributed around the periphery, while larger coalesced droplets were concentrated toward the center of the ring. Run-off streams formed at the bottom of the ring, extending downward along the plate’s vertical surface. Initially, the run-off appeared as a consistent narrow stream but fragmented into discrete droplets further along its path, leaving a trail of small droplets (yellow arrow), a phenomenon described by the Plateau–Rayleigh instability theory [54,55]. This fragmentation was driven by surface tension forces acting to stabilize the liquid into smaller configurations with lower surface energy.
On the 0.25% XG-coated surface at the same distance (second panel, Figure 3d), the deposition pattern was irregularly shaped and slightly wider compared to the dry surface. The saline spray diffused into the thin mucus layer, spreading across the coating. Run-off streams formed and descended along the vertical plate, facilitated by the lubricating effect of the mucus layer. Unlike the dry surface, the run-off streams remained mostly intact and exhibited minimal fragmentation as they translocated downward, thinning progressively without significant breakage (white arrow).
For the 1% XG coating at 30 mm (third panel, Figure 3d), while the overall deposition pattern shared some features with the 0.25% XG coating, notable differences were observed. The spray resulted in a significantly wider spread around the site of initial impaction, with a more uniform and cohesive coverage across the plate’s surface. The run-off streams formed were noticeably broader compared to the 0.25% XG case, but translocated a shorter distance down the vertical plate. Unlike the 0.25% XG case, the run-off streams did not reach the lowermost edge of the plate (red arrow), suggesting increased resistance to flow due to the higher viscosity of the 1% XG coating.
For the dry surface at a nozzle-to-surface distance of 60 mm (first panel, Figure 3e), the deposition pattern formed a larger ring with a width of approximately 60 mm, attributed to the wider cone cross-section of the spray plume at a greater distance. The periphery of the deposition ring was characterized by finer droplets, while the central region showed a higher density of larger coalesced droplets. No run-off streams were observed in this case, likely due to insufficient liquid accumulation to initiate cohesive movement down the dry surface.
On the 0.25% XG-coated surface at 60 mm (second panel, Figure 3e), the deposition pattern exhibited significantly wider and more uniform coverage around the site of initial spray impaction. This enhanced spread was attributed to the increased nozzle-to-surface distance, allowing for a broader cone of the spray plume, combined with diffusion into the synthetic mucus coating, which extended laterally and downward from the point of impact. Multiple thin streamlets (indicated by orange arrows) formed as the liquid translocated down the vertical plate, facilitated by the lubricating effect of the mucus layer. However, none of the streamlets reached the bottom edge of the plate, indicating limited downward translocation despite the broader coverage.
Finally, for the 1% XG coating at 60 mm (third panel, Figure 3e), the deposition pattern was irregularly shaped but substantially wider compared to the 0.25% XG coating case, with more uniform coverage. A higher concentration of saline spray deposition was observed, as indicated by the greener color, which reflects a greater quantity of the fluorescent green-dyed saline liquid in that region. The spread extended laterally, upward, and downward from the site of initial spray impaction (Figure 3e). Streamlets formed during translocation down the vertical plate, exhibiting widths comparable to those in the 30 mm case. However, these streamlets traversed a significantly shorter distance before halting, likely due to the increased viscosity of the 1% XG coating, which restricted downward flow and enhanced localized retention.

3.3. Translocation on Inclined SLA Resin Surfaces Under Different Surface Conditions

3.3.1. Behavior of Saline Drops on 30° Inclined Surfaces

The translocation distance of a single liquid drop over a 10-s period, dispensed on the flat SLA resin plate inclined at a 30° angle from the horizontal, under various surface conditions (dry, coated with 0.25% w/v xanthan gum saline solution, and 1% w/v xanthan gum saline solution), is illustrated in Figure 4a. When the surface was dry, the droplet remained stationary throughout the observation period. The downhill component of the droplet’s weight was insufficient to overcome the surface tension and adhesive interfacial forces between the saline and the SLA resin, resulting in its stability at the point of deposition. In contrast, on a surface coated with a thin blanket of 0.25% w/v XG saline solution, the droplet immediately merged with the mucus blanket upon contact. Facilitated by the lubricating effect of the thin coating, the droplet translocated downhill, covering a distance of 38.6 mm in 10 s. On the more viscous 1% w/v XG saline solution blanket, the droplet exhibited similar behavior, merging with the mucus layer and translocating downhill. However, due to the higher viscosity of the 1% w/v XG solution, the droplet covered a shorter distance of 18 mm over the same duration.
When a single drop was dispensed onto the 30° inclined SLA resin plate, distinct behavioral differences were observed between the 0.25% w/v XG and 1% w/v XG coatings, as shown in the top view (Figure 4b, lower left and right panels). On the 0.25% w/v XG coating, the saline drop diffused into the mucus blanket, spreading both transversely and downward under the influence of gravity. This behavior can be explained by Fick’s first law of diffusion, generalized for multiple spatial dimensions (Equation (1)). The lower viscosity of the 0.25% w/v XG solution facilitated smoother interactions, enabling the saline to integrate more effectively into the mucus layer. At the same time, a portion of the saline remained on the surface of the XG layer, translocating as a cohesive stream under gravity. This dual behavior (partial diffusion into the mucus and partial surface-level translocation) was driven by strong adhesive interactions between the saline and the mucus layer, along with the system’s tendency to minimize surface free energy, as described by Young’s equation (Equation (2)). The lubrication effect provided by the 0.25% w/v XG coating further reduced resistance to flow, promoting cohesive and well-defined downward translocation that extended farther along the slope.
In contrast, the 1% w/v XG coating exhibited markedly different behavior. Upon settling on the highly viscous mucus blanket, the saline diffused more slowly and less uniformly into the XG layer due to the increased cohesive forces within the thicker mucus, as described by Equation (1). A larger portion of the saline remained on the surface of the XG coating, but instead of forming a cohesive stream, the liquid fragmented into multiple smaller pathways. This branching or streamlet pattern spread sideways and downward under gravity, reflecting the interplay between the higher viscosity of the 1% XG coating, weaker adhesive interactions between the saline and the mucus, and the system’s natural tendency to minimize surface free energy as described by (Equations (2) and (3)). The higher viscosity of the 1% w/v XG coating increased resistance, limiting uniform spreading and diffusion and giving rise to the formation of branch-like translocation pathways. The force balance between gravity and viscous resistance, as described by the Eulerian Wall Film Model, governs these behaviors (Equation (5)).

3.3.2. Liquid Film Translocation on Dry SLA Surfaces Under Varying Inclinations

The number of saline drops required to initiate liquid film translocation and the translocation time for a 100 mm distance were measured across SLA plate inclinations of 30°, 45°, and 60°, as summarized in the table within Figure 5. These results highlight the interplay of forces acting on the liquid film, including the downhill component of gravitational force, surface tension of the liquid, and adhesive forces at the solid–liquid interface. At the shallowest inclination of 30°, four drops were required to form a liquid film that could overcome the stabilizing forces and begin translocating downhill. The resulting film translocated relatively quickly, covering the 100 mm distance in 270 s. This behavior can be attributed to the heavier liquid film, which generated sufficient gravitational force to counteract the stabilizing adhesive and surface tension forces.
At an intermediate inclination angle of 45°, the number of drops required to initiate translocation was halved to two. Despite the steeper incline providing a larger downhill gravitational force component, the translocation time increased to 366 s. This slower translocation suggests that the reduced weight of the liquid film (due to fewer drops) resulted in less gravitational force overall, counteracting the benefit of the steeper incline. At the steepest inclination of 60°, only a single drop was required to initiate liquid film translocation, indicating the dominance of the downhill weight component in destabilizing the film at this angle. However, the translocation time was the longest, taking 426 s to travel the 100 mm distance. This counterintuitive behavior can be explained by two factors: (1) the lighter weight of the resulting liquid film, which generated less gravitational force compared to heavier films at lower inclinations, and (2) the increased surface area of the film at the steeper angle, which enhanced the adhesive forces at the solid–liquid interface and resisted the downward movement of the film. Additionally, the narrower path of translocation likely intensified the adhesive effects, further slowing the film’s movement.

3.4. Deposition Distribution in Nasal Models with Uncoated and Mucus-Coated Surfaces

The deposition patterns observed in Figure 6 illustrate the distribution of saline spray within the three nasal cavity models (NC-1, NC-2, and NC-3) featuring uncoated (dry) cavity walls after one spray dose accompanied by a gentle sniff-generated flow, with the nasal models positioned at a 45° backward head tilt. The dynamic spray deposition and liquid translocation in the NC-2 cast with uncoated walls can be viewed in Supplementary Video S1. The patterns across the three models were largely similar, with slight variations attributable to intersubject differences in nasal cavity morphology. The steep head tilt increased the gravitational component along the anterior-to-posterior axis of the nasal cavity, augmenting flow shear forces that facilitated the deeper translocation of spray droplets and liquid films into the nasal cavity. In the anterior nose, including the vestibule, the formation of droplets was primarily driven by spray inertial impaction on the cavity walls in that region. The dry SLA surfaces, characterized by reduced adhesive retention due to the high contact angle of saline (70°), led to dispersed and scattered droplet formations across various regions. Finer spray droplets were observed in the anterior cavity, predominantly superiorly and centrally.
In all three models, liquid wall film formation was noted on the anterior roof of the cavity (yellow arrows). The middle and inferior turbinates exhibited scattered liquid droplets and film deposition, with the majority of liquid observed on the inferior turbinate and minor deposition along the middle turbinate and middle meatus. Liquid film deposition was also evident on the cavity floor, particularly in the posterior region (indicated by the white arrow for NC-1, orange arrow for NC-2, and red arrow for NC-3). In the NC-2 model, liquid film translocation extended further down the floor, reaching the nasopharynx (orange arrow). This behavior was attributed to the coalescence of spray droplets into liquid films upon initial impaction and subsequent gravitational and flow-induced translocation along the posterior and inferior cavity surfaces.
Figure 7 presents the final deposition distribution within the nasal cavity models (NC-1, NC-2, and NC-3) coated with a synthetic mucus blanket of 0.25% w/v XG saline solution following the application of one nasal spray dose accompanied by a gentle sniff-generated airflow. The dynamic spray deposition and liquid translocation in NC-2 with 0.25% w/v XG coating can be viewed in Supplementary Video S2. The presence of the synthetic mucus coating significantly altered deposition dynamics compared to the dry surface cases, resulting in wider and more uniform spreading across the nasal cavities, primarily due to diffusion within the mucus blanket. In the anterior region, saline diffusion into the mucus blanket facilitated cohesive coverage along the middle and superior sections, while deposition along the cavity roof was minimal, contrasting with the distinct spray droplet patterns observed in the dry scenarios. Deposition in the nasal vestibules was also negligible across all models, except in NC-2, where inertial impaction on the narrow nasal valve initiated saline liquid translocation along the upper vestibule wall, culminating at the edge of the nostril opening (orange arrow). Additionally, the deposition pattern exhibited uniform spreading across the surface of the inferior turbinate (red arrows), varying among the models. Specifically, in NC-3, deposition was observed mostly anteriorly, while in NC-2, it extended both anteriorly and posteriorly. In NC-1, the inferior turbinate surface displayed almost complete coverage by the saline solution.
In all models, the synthetic mucus layer facilitated the formation of cohesive saline streams on the nasal cavity floor. As the deposited saline partially merged with the mucus layer, the resulting liquid film translocated seamlessly across the entire floor, extending through the nasopharynx and beyond (yellow arrows). This enhanced translocation was driven by the combined effects of gravity and airflow shear, which acted synergistically on the cohesive saline-mucus interface, reducing resistance to movement and enabling longer and more uniform liquid migration. These observations align closely with findings from complementary tests (as shown in Figure 4b, lower left panel), where the lubricating effect of the 0.25% XG coating played a significant role in promoting extended liquid movement.
Figure 8 shows the final deposition distribution within the nasal cavity models (NC-1, NC-2, and NC-3) coated with a synthetic mucus blanket of 1% w/v XG saline solution following the application of one nasal spray dose accompanied by a gentle sniff-generated airflow. The dynamic spray deposition and liquid translocation in NC-2 with 1% w/v XG coating can be viewed in Supplementary Video S3. Like the 0.25% w/v xanthan gum coating, the 1% w/v coating facilitated wide and uniform saline film spread across various regions of the nasal cavity models, largely due to diffusion within the mucus blanket. However, the higher viscosity of the 1% w/v coating significantly influenced the deposition patterns, leading to notable differences in coverage and translocation compared to the thinner 0.25% w/v case.
Minimal deposition was observed within the nasal vestibule across all models. In the anterior sections, saline deposition was characterized by a uniform spread of saline film across the middle and lower-middle regions, with no observable deposition superiorly or along the roof. The behavior of saline droplets and liquid films on the 1% XG coating, as demonstrated in the supporting tests (e.g., translocation dynamics on inclined plates, Figure 4b, lower right panel), corroborates this observation, as the increased viscosity provided greater resistance to liquid movement. Deposition within the middle sections of the nasal cavities displayed cohesive saline film and streamlet coverage, primarily across the middle, lower-middle, and inferior regions of the cavity, as well as along the septum walls. Unlike the 0.25% XG case, where extensive liquid run-off was observed along the cavity floor into the nasopharynx, the higher viscosity of the 1% XG coating restricted saline translocation, resulting in reduced deposition on the cavity floor and no extension into the nasopharynx or beyond. Additionally, deposition on the middle and inferior turbinates, as well as the septum walls, exhibited a branch-like pattern of translocation pathways. This branching effect, particularly visible along the flatter septum walls in NC-1, NC-2, and NC-3 (yellow arrows), reflects the influence of the increased viscosity, which limited cohesive liquid film translocation while promoting localized spreading along paths of least resistance.

4. Discussion

This study systematically investigated synthetic mucus effects on spray-wall interactions and intranasal spray deposition. Influencing variables were characterized to better understand distinct liquid behaviors and fates due to varying surface-coating conditions. Specific findings and insights are discussed below, in the hope of bridging the gap between in vitro deposition testing and in vivo conditions.

4.1. Impact of Fluid Properties and Synthetic Mucus Coatings on Nasal Spray Deposition

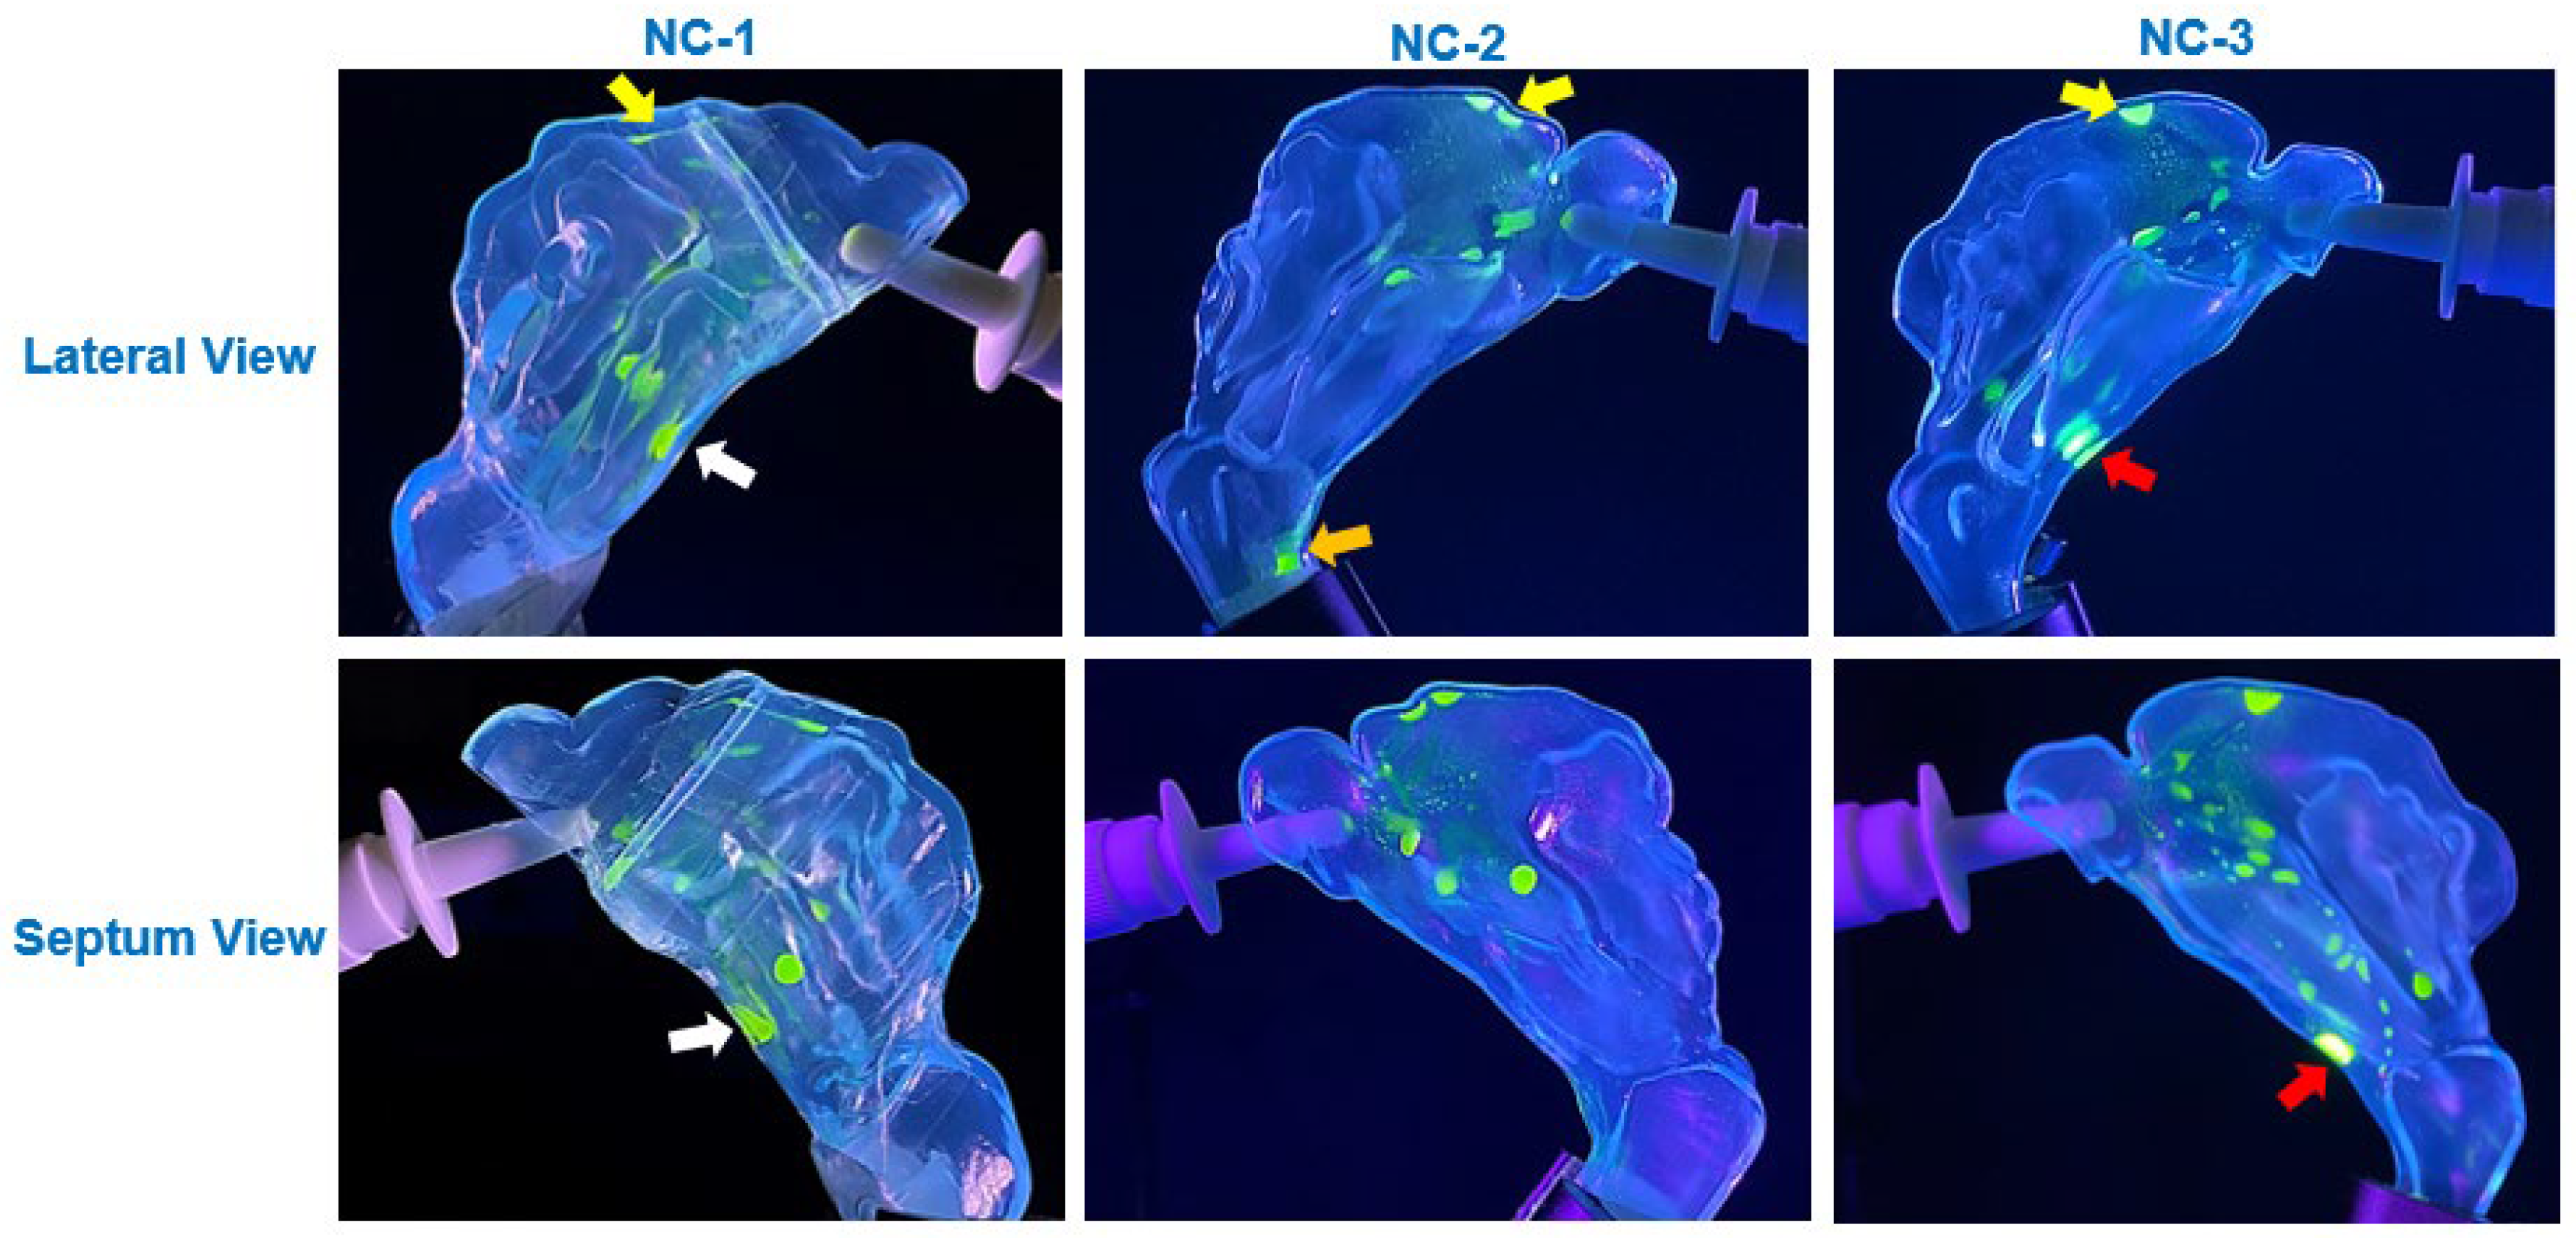
The findings of this study highlighted the significant role of multiple mechanisms in influencing nasal spray deposition within the nasal cavity. Deposition was driven by inertial impaction on key surfaces such as the nasal vestibule, internal nasal valve, turbinates, septum, and lateral walls, while subsequent translocation was governed by gravity and airflow-induced shear forces. Diffusion of saline into the mucus blanket also played a critical role, with solubility, concentration gradients, and fluid properties modulating the diffusion rate. Additionally, spray particles entrained in airflow contributed to deposition in the middle and posterior regions of the nasal cavity. These mechanisms, alongside fluid properties such as viscosity, wettability, and surface tension, collectively shaped the deposition patterns and translocation dynamics observed in this study.
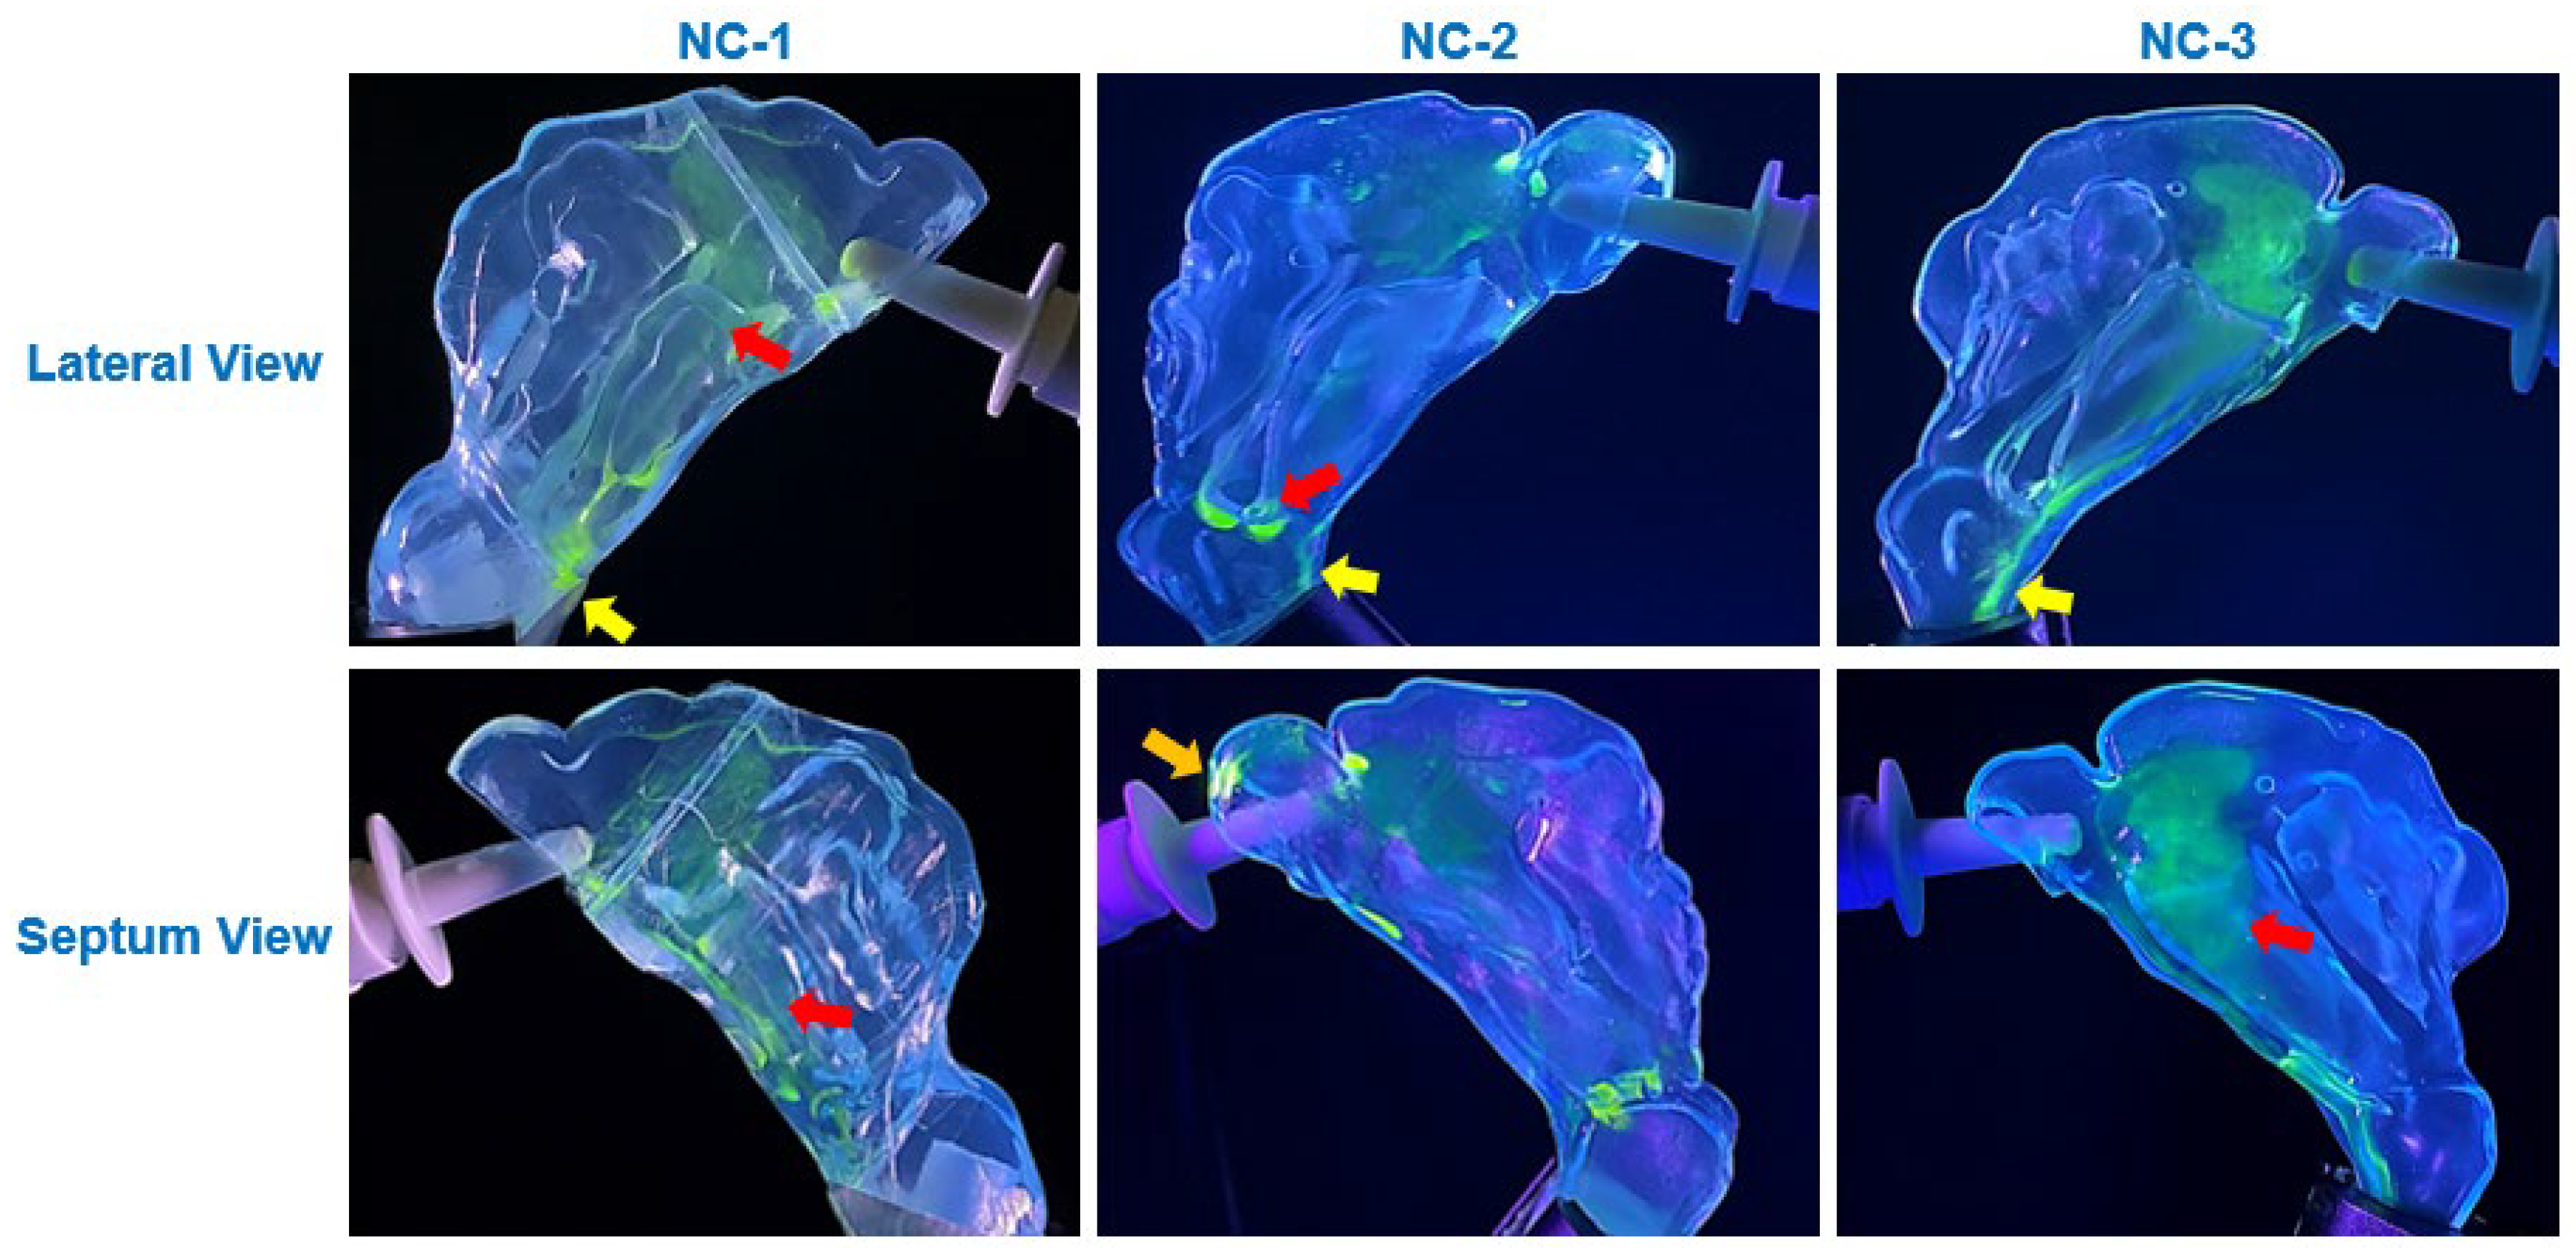
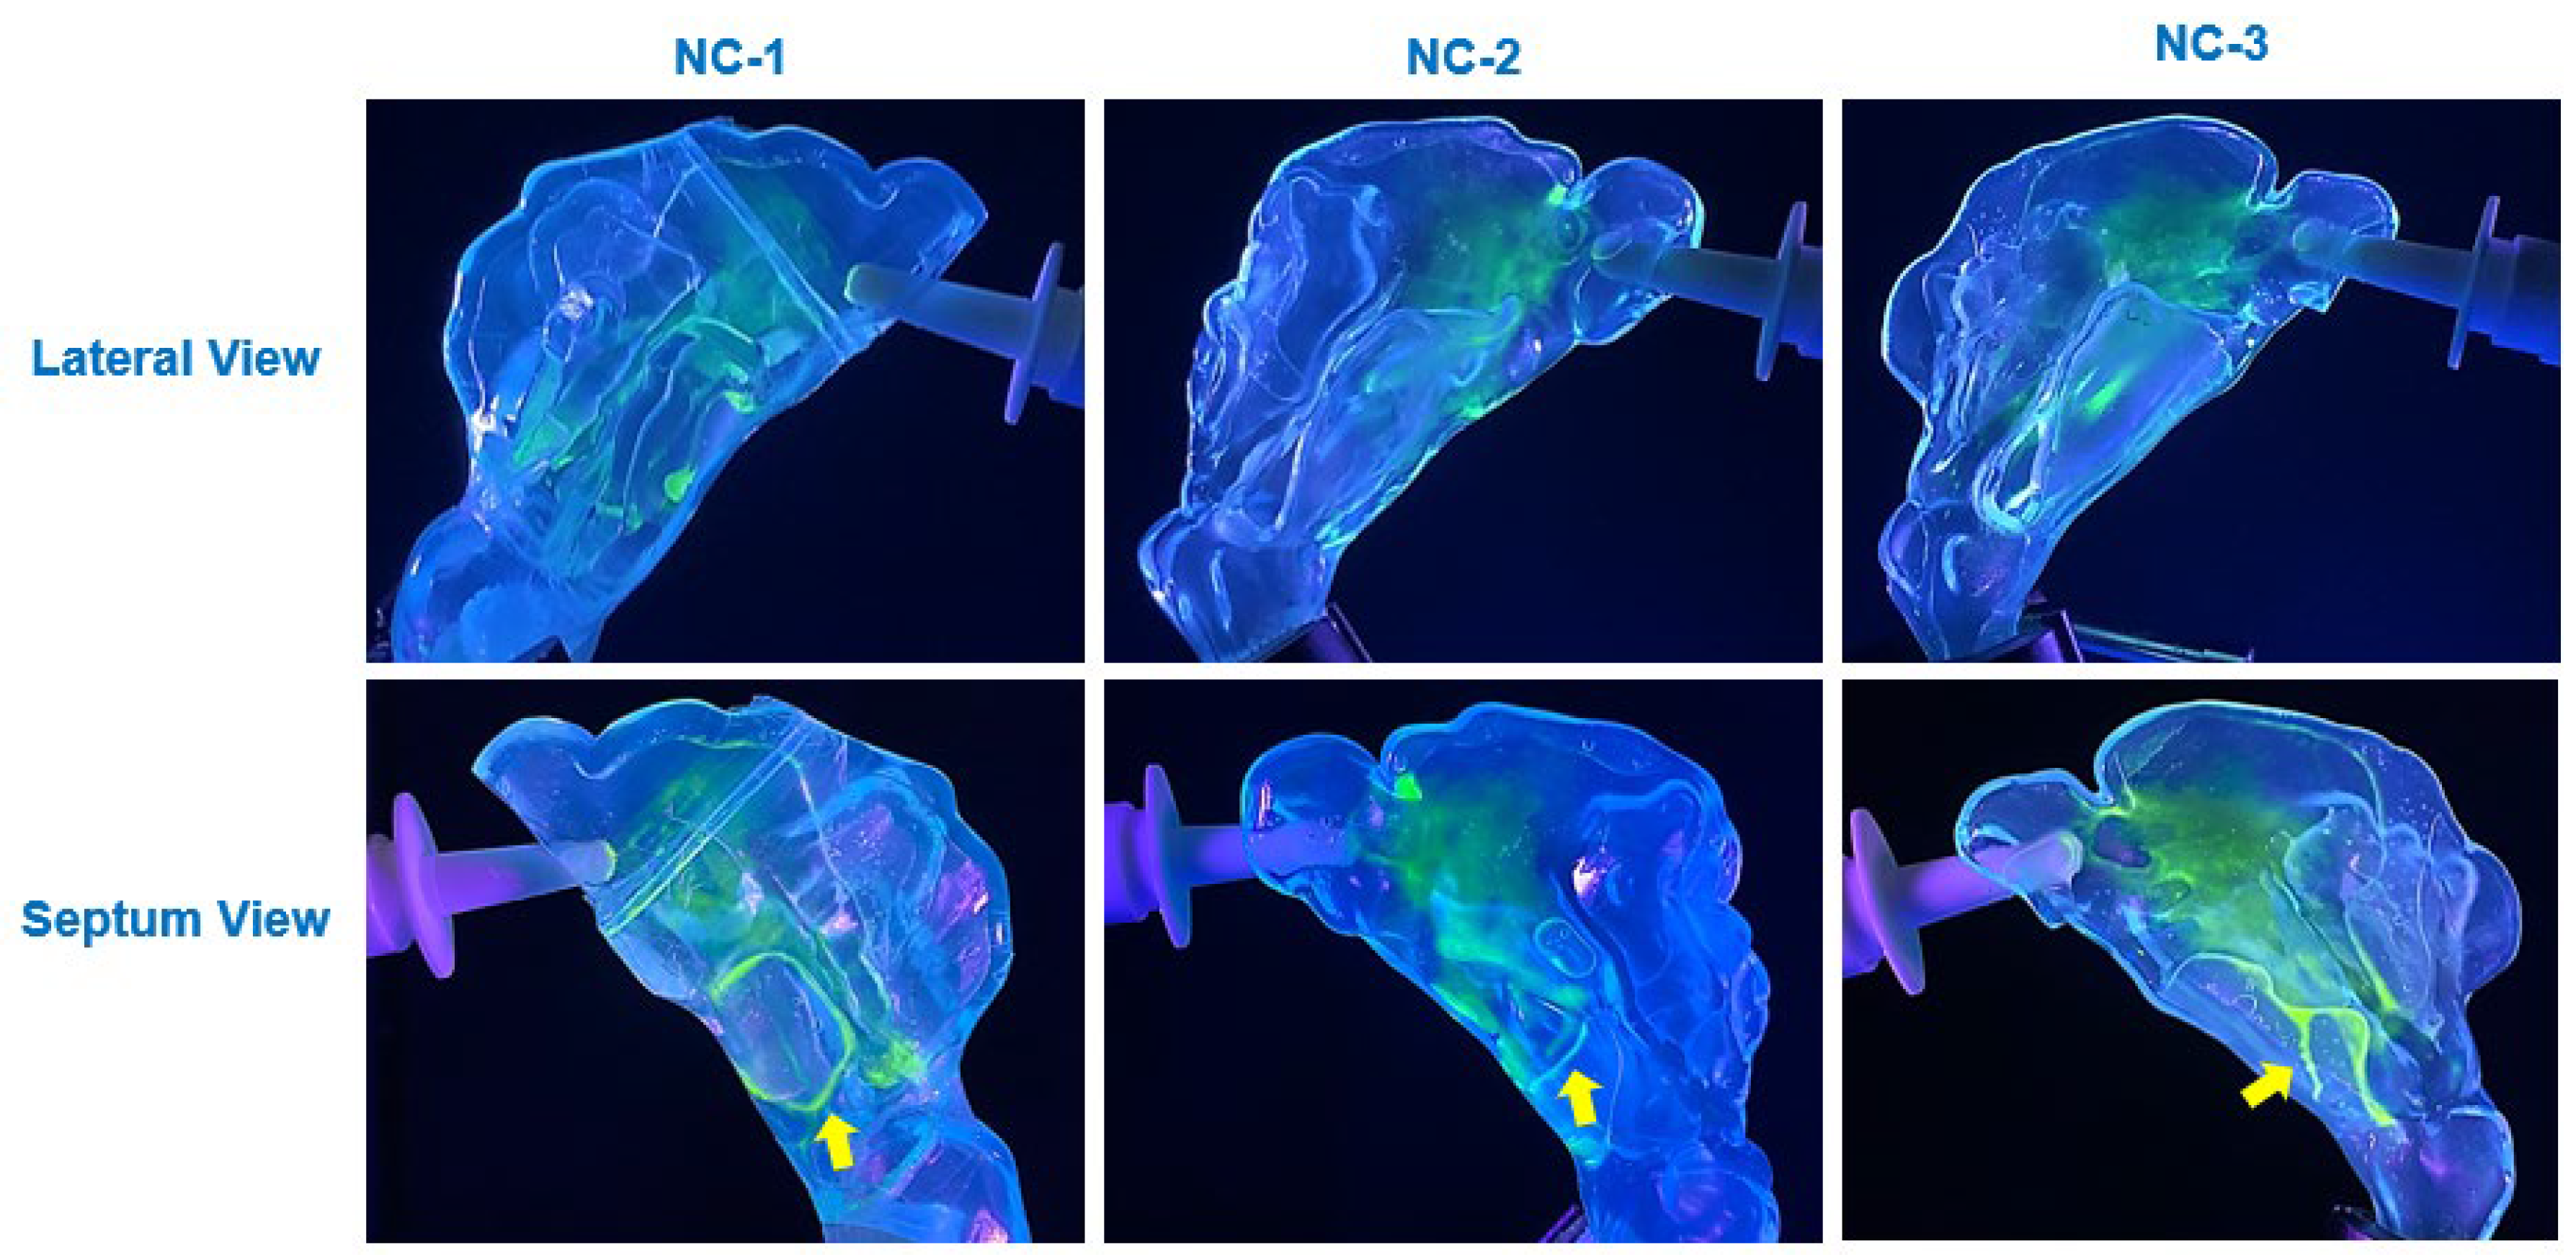
The viscosity of the synthetic mucus solutions played a critical role in determining the extent and nature of saline translocation and deposition. As shown in Figure 6, Figure 7 and Figure 8, the deposition patterns varied substantially depending on whether the cavity surfaces were uncoated or coated with 0.25% or 1% w/v xanthan gum (XG) solutions. The thinner 0.25% XG solution facilitated wider translocation and uniform deposition, particularly in the posterior regions of the nasal cavity and nasopharynx (Figure 7). In contrast, the higher viscosity of the 1% XG solution restricted liquid film movement, resulting in more localized deposition with branch-like translocation pathways (Figure 8). These observations align with the findings from complementary tests on translocation dynamics on flat SLA surfaces, where the higher viscosity of the 1% XG solution coatings exhibited greater resistance to gravity-driven flow, as demonstrated in the translocation dynamics of a saline drop dispensed on the inclined SLA plate (Figure 4).
Diffusion effects also played a notable role in modulating deposition behavior on mucus-coated surfaces. On the 0.25% XG coating, the saline solution exhibited significant diffusion into the mucus blanket, leading to cohesive film formation and uniform spreading across the cavity surfaces (Figure 7). This diffusion-driven behavior was most prominent across the anterior, middle, and inferior regions of the cavity, where the thin mucus layer facilitated integration of saline droplets into the coating, resulting in enhanced coverage. In contrast, the thicker 1% XG coating exhibited reduced diffusion effects due to its higher viscosity, leading to more restricted spreading and the formation of localized saline streamlets (Figure 8). These diffusion-driven dynamics were consistent with Fick’s second law, which governs the rate of saline infiltration into the mucus layers based on concentration gradients and fluid properties.
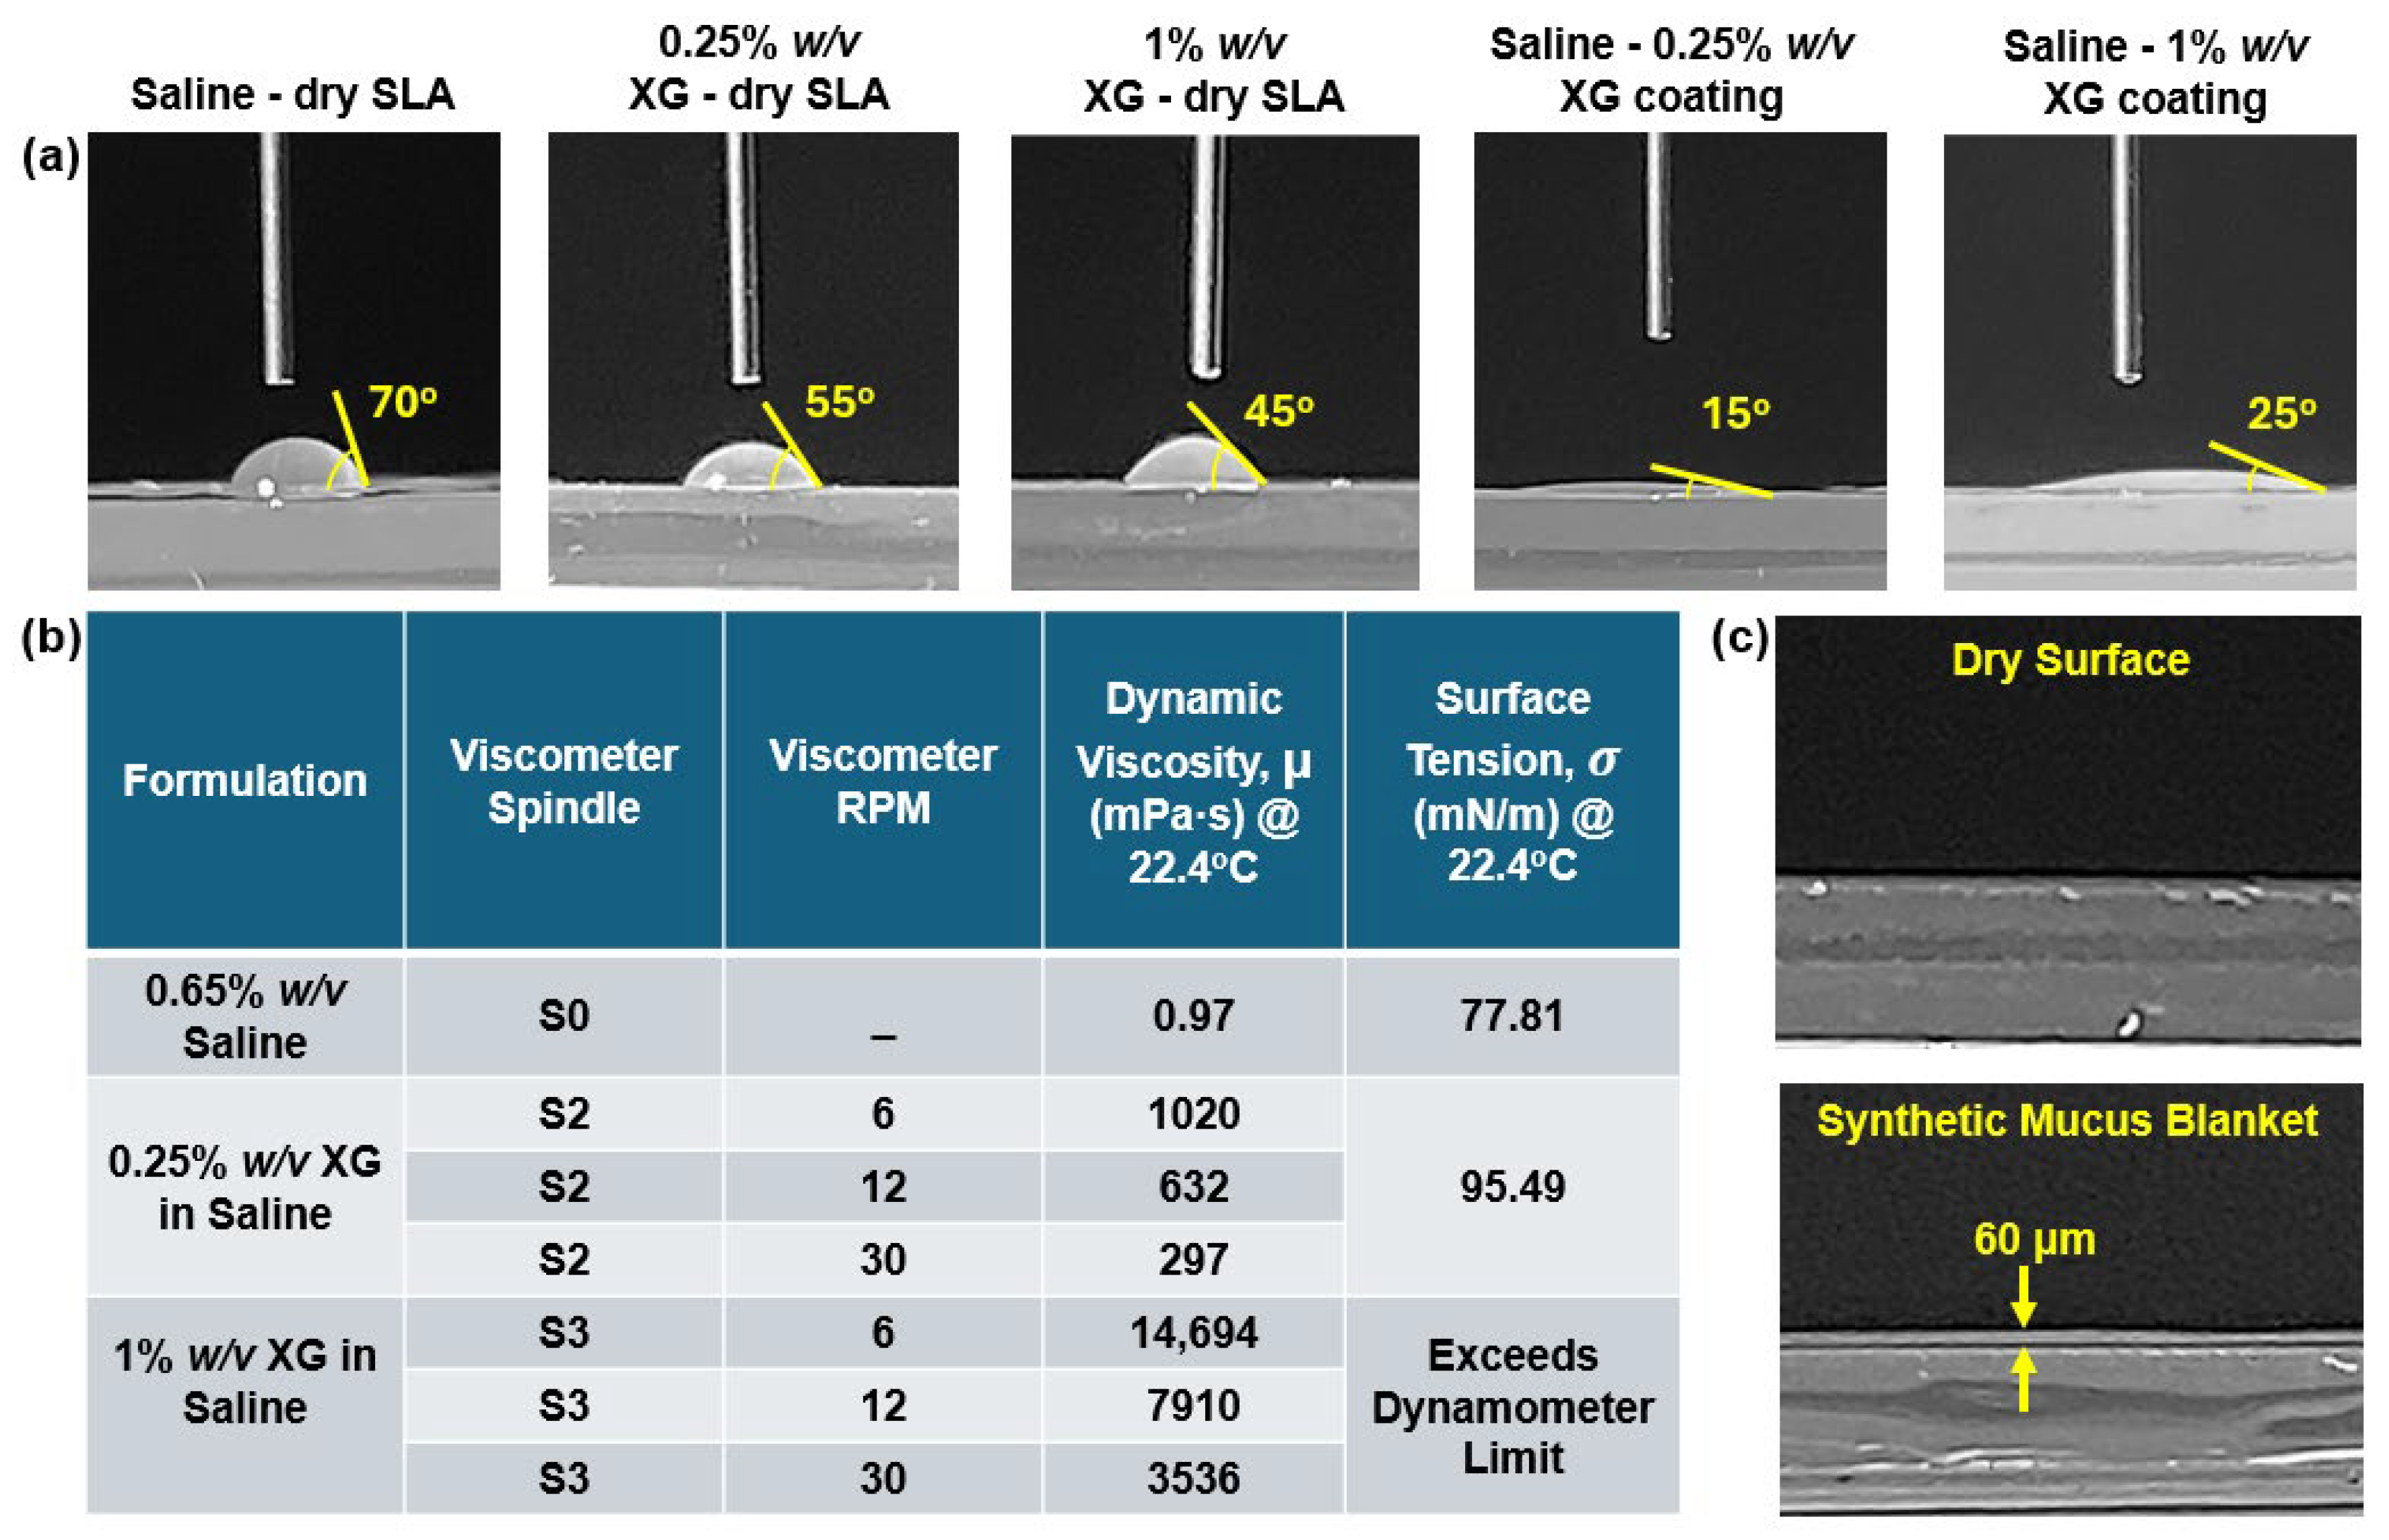
Wettability, as governed by contact angle measurements, further influenced deposition behavior. On uncoated SLA resin surfaces, the high contact angle of saline (70°) resulted in dispersed droplet deposition patterns, with minimal spreading and coalescence (Figure 6). However, on coated surfaces, the reduced contact angles (15° and 25° for 0.25% and 1% XG coatings, respectively) facilitated enhanced spreading and film formation. This behavior was consistent with the predictions of Young’s equation and the work of adhesion calculations, which demonstrated improved wettability in the presence of synthetic mucus coatings (Table 1).
The influence of these fluid properties on translocation dynamics was described using the governing equations of mass and momentum conservation for liquid films. Specifically, the Eulerian Wall Film Model provided a theoretical basis for understanding the interplay of forces acting on the liquid film, including gravitational, viscous, surface tension, and flow shear forces. As described by Equations (4) and (5), the net effect of these forces determined the extent of liquid film movement, with higher viscous forces in the 1% XG coating resisting the effects of flow shear, thereby creating localized resistance and restricting flow compared to the 0.25% XG case.
The incorporation of synthetic mucus coatings introduced a physiologically relevant factor that significantly altered deposition dynamics compared to uncoated surfaces. The thinner 0.25% XG solution closely approximated the consistency of healthy nasal mucus, facilitating translocation into the posterior nasal cavity and nasopharynx, as observed in all three nasal models (Figure 7). In contrast, the thicker 1% XG solution simulated a diseased condition, where higher mucus viscosity reduced translocation and confined deposition (Figure 8).

4.2. Clinical Implications and Broader Impact

The findings of this study have significant clinical implications for improving intranasal drug delivery, particularly for treating respiratory diseases and optimizing vaccine delivery. By incorporating synthetic mucus coatings that mimic the functional properties of human nasal mucus, this study addressed a critical gap in current 3D-printed in vitro nasal cavity models, which often lack features that replicate the complexities of the nasal environment, such as the presence of a mucus layer. The deposition patterns and distributions observed in coated models differed significantly from those in uncoated, dry models, highlighting the profound influence of a mucus-like layer on liquid translocation and deposition behavior. This underscores the necessity of integrating synthetic mucus coatings into in vitro models to enhance their physiological relevance. Models without such coatings may fail to accurately simulate the human nasal environment, potentially leading to misleading results when evaluating intranasal drug delivery systems.
Synthetic mucus coatings provide a more realistic platform for studying the dynamics of nasal spray deposition, offering insights into drug retention, distribution, and absorption. This improved understanding can guide the development of more effective intranasal delivery techniques and devices, ensuring drug formulations reach their intended target regions within the nasal cavity. Ultimately, incorporating synthetic mucus coatings into 3D-printed nasal models offers a valuable approach for refining nasal drug formulations and delivery systems.

4.3. Limitations

This study, while providing valuable insights into the influence of synthetic mucus coatings on nasal spray deposition dynamics, has several limitations that should be acknowledged to contextualize the findings and guide future research. The nasal models used in this study were fabricated using 3D printing with SLA resin, a material that differs significantly from the compliant, dynamic properties of the in vivo airway tissues. While these rigid models allowed for controlled and repeatable experiments, they do not fully replicate the deformable and pliable nature of human nasal passages, which may affect deposition and translocation behaviors. Additionally, the study utilized only three patient-specific nasal cavity models, limiting the generalizability of the findings. Expanding the range of models to include diverse nasal morphologies would provide a more comprehensive understanding of intersubject variability in nasal spray depositions.
The synthetic mucus solutions employed in this study, while designed to mimic certain functional properties of human nasal mucus, do not replicate its full biochemical composition. Real nasal mucus comprises two distinct layers: the luminal mucus gel and a less viscoelastic sol layer, also known as the periciliary liquid layer [31]. The synthetic mucus in this study consisted of a single layer, which may not entirely capture the complex interactions that occur within the dual-layer structure of real mucus.
Furthermore, synthetic mucus formulations containing xanthan gum exhibit non-Newtonian, shear-thinning behavior and may also possess a yield stress, which influences their ability to retain and translocate liquid films. While this study focused on viscosity characterization using a rotational viscometer, advanced rheometric techniques such as parallel-disk viscometry or steady torsional flow measurements could provide further insights into the gel-like behavior and yield stress [56,57]. The use of such methods was not feasible in this study due to the lack of access to an advanced rheometer. Future work incorporating these methods would enhance understanding of how the yield stress of synthetic mucus formulations influences the retention, spread, and clearance of nasal spray formulations within the nasal cavity.
Additionally, viscosity measurements in this study were conducted at three spindle speeds (6 rpm, 12 rpm, and 30 rpm), which correspond to varying shear rates. The observed trend of decreasing viscosity with increasing spindle speed, as shown in Figure 2b, is indicative of the shear-thinning behavior of the xanthan gum-based synthetic mucus solutions. However, because shear rate is not explicitly determined in this measurement approach, the reported viscosity values should be interpreted as indicative of shear-dependent viscosity trends rather than absolute rheological properties. Future studies using cone-and-plate or parallel-plate rheometry could provide a more detailed characterization of viscosity across a continuous shear rate spectrum.
Another limitation lies in the experimental conditions, which maintained the synthetic mucus and nasal models at room temperature and ambient relative humidity (RH). These conditions differ from the physiological temperature and high-humidity environment of the human nasal cavity, potentially influencing fluid behavior and deposition patterns. Moreover, the effects of mucociliary clearance, a key physiological process that influences the movement and clearance of mucus and deposited particles, were not accounted for in this study.

5. Conclusions

This study successfully demonstrated the critical role of synthetic mucus coatings in enhancing the physiological relevance of in vitro nasal spray deposition tests using 3D-printed nasal cavity models. By incorporating coatings that mimic the viscoelastic properties of human nasal mucus, significant differences in deposition patterns and liquid translocation dynamics were observed compared to uncoated models. The findings highlight the impact of fluid properties—such as viscosity, wettability, and surface tension—on the behavior of nasal sprays, with the synthetic mucus layer playing a pivotal role in modulating these effects. The thinner 0.25% w/v XG coating facilitated broader translocation and uniform deposition, particularly in the posterior regions, while the thicker 1% w/v XG coating restricted liquid movement, reflecting the conditions associated with diseased states.
These findings suggest that the incorporation of synthetic mucus coatings can address a key limitation in current 3D-printed nasal models, which often lack features of life conditions, such as the presence of a mucus layer. By providing a closer approximation to the mucus-coated wall conditions, this study offers insights that could better inform in vitro to in vivo extrapolation (IVIVE). The dosimetry variation with mucus coatings has important implications for the design of in vitro systems for more accurate evaluations of intranasal drug delivery, with potential implications for improving therapeutic outcomes in clinical practice.

Supplementary Materials

The following supporting information can be downloaded at: https://www.mdpi.com/article/10.3390/liquids5020011/s1, Video S1: spray deposition and translocation in a nasal cast (NC-2) with uncoated internal walls; Video S2: spray deposition and translocation in NC-2 with internal walls coated with 0.25% w/v xanthan gum saline solution; Video S3: spray deposition and translocation in NC-2 with internal walls coated with 1% w/v xanthan gum saline solution.

Author Contributions

Conceptualization, A.S., X.S. and J.X.; methodology, A.S., F.Z., X.S. and J.X.; validation, A.S., F.Z., X.S. and J.X.; formal analysis, A.S., F.Z., X.S. and J.X.; investigation, A.S. and J.X.; resources, F.Z. and X.S.; data curation, A.S. and J.X.; writing—original draft preparation, A.S.; writing—review and editing, F.Z., X.S. and J.X. All authors have read and agreed to the published version of the manuscript.

Funding

This research received no external funding.

Data Availability Statement

The data presented in this study are available on request from the corresponding author.

Conflicts of Interest

The authors declare no conflicts of interest.

Abbreviations

The following abbreviations are used in this manuscript:
CFCystic fibrosis
COPDChronic obstructive pulmonary disease
CTComputed tomography
DNADeoxyribonucleic acid
IVIVEIn vitro to in vivo extrapolation
MCCMucociliary clearance
NC-1Nasal cavity model 1
RHRelative humidity
SLAStereolithography
w/vWeight/volume
XGXanthan gum

References

  1. Pires, A.; Fortuna, A.; Alves, G.; Falcão, A. Intranasal drug delivery: How, why and what for? J. Pharm. Pharm. Sci. 2009, 12, 288–311. [Google Scholar] [CrossRef] [PubMed]
  2. Ugwoke, M.I.; Agu, R.U.; Verbeke, N.; Kinget, R. Nasal mucoadhesive drug delivery: Background, applications, trends and future perspectives. Adv. Drug Deliv. Rev. 2005, 57, 1640–1665. [Google Scholar] [CrossRef] [PubMed]
  3. Lam, J.K.W.; Cheung, C.C.K.; Chow, M.Y.T.; Harrop, E.; Lapwood, S.; Barclay, S.I.G.; Wong, I.C.K. Transmucosal drug administration as an alternative route in palliative and end-of-life care during the COVID-19 pandemic. Adv. Drug Deliv. Rev. 2020, 160, 234–243. [Google Scholar] [CrossRef] [PubMed]
  4. Seifelnasr, A.; Si, X.; Xi, J. Effects of nozzle retraction elimination on spray distribution in middle-posterior turbinate regions: A comparative study. Pharmaceutics 2024, 16, 683. [Google Scholar] [CrossRef]
  5. Burton, M.J.; Clarkson, J.E.; Goulao, B.; Glenny, A.-M.; McBain, A.J.; Schilder, A.G.; Webster, K.E.; Worthington, H.V. Use of antimicrobial mouthwashes (gargling) and nasal sprays by healthcare workers to protect them when treating patients with suspected or confirmed COVID-19 infection. Cochrane Database Syst. Rev. 2020, 9, CD013626. [Google Scholar]
  6. Williamson, S.; Dennison, L.; Greenwell, K.; Denison-Day, J.; Mowbray, F.; Richards-Hall, S.; Smith, D.; Bradbury, K.; Ainsworth, B.; Little, P.; et al. Using nasal sprays to prevent respiratory tract infections: A qualitative study of online consumer reviews and primary care patient interviews. BMJ Open 2022, 12, e059661. [Google Scholar] [CrossRef] [PubMed]
  7. Djupesland, P.G. Nasal drug delivery devices: Characteristics and performance in a clinical perspective—A review. Drug Deliv. Transl. Res. 2013, 3, 42–62. [Google Scholar] [CrossRef] [PubMed]
  8. Segboer, C.; Gevorgyan, A.; Avdeeva, K.; Chusakul, S.; Kanjanaumporn, J.; Aeumjaturapat, S.; Reeskamp, L.F.; Snidvongs, K.; Fokkens, W. Intranasal corticosteroids for non-allergic rhinitis. Cochrane Database Syst. Rev. 2019, 2019, CD010592. [Google Scholar] [CrossRef]
  9. Wise, S.K.; Lin, S.Y.; Toskala, E.; Orlandi, R.R.; Akdis, C.A.; Alt, J.A.; Azar, A.; Baroody, F.M.; Bachert, C.; Canonica, G.W. International consensus statement on allergy and rhinology: Allergic rhinitis. Int. Forum Allergy Rhinol. 2018, 8, 108–352. [Google Scholar] [CrossRef]
  10. Cingi, C.; Bayar Muluk, N.; Mitsias, D.I.; Papadopoulos, N.G.; Klimek, L.; Laulajainen-Hongisto, A.; Hytönen, M.; Toppila-Salmi, S.K.; Scadding, G.K. The nose as a route for therapy: Part 1. pharmacotherapy. Front. Allergy 2021, 2, 638136. [Google Scholar] [CrossRef]
  11. Glezen, W.P. The new nasal spray influenza vaccine. Pediatr. Infect. Dis. J. 2001, 20, 731–732. [Google Scholar] [CrossRef] [PubMed]
  12. Nian, X.; Zhang, J.; Huang, S.; Duan, K.; Li, X.; Yang, X. Development of nasal vaccines and the associated challenges. Pharmaceutics 2022, 14, 1983. [Google Scholar] [CrossRef]
  13. Cheng, Y.; Holmes, T.; Gao, J.; Guilmette, R.; Li, S.; Surakitbanharn, Y.; Rowlings, C. Characterization of nasal spray pumps and deposition pattern in a replica of the human nasal airway. J. Aerosol Med. 2001, 14, 267–280. [Google Scholar] [PubMed]
  14. Inthavong, K.; Fung, M.C.; Yang, W.; Tu, J. Measurements of droplet size distribution and analysis of nasal spray atomization from different actuation pressure. J. Aerosol Med. Pulm. Drug Deliv. 2015, 28, 59–67. [Google Scholar] [PubMed]
  15. Seifelnasr, A.; Si, X.; Xi, J. Assessing nasal epithelial dynamics: Impact of the natural nasal cycle on intranasal spray deposition. Pharmaceuticals 2024, 17, 73. [Google Scholar] [CrossRef] [PubMed]
  16. Amr, S.; Mohamed, T.; Xiuhua April, S.; Jinxiang, X. Delivery of agarose-aided sprays to the posterior nose for mucosa immunization and short-term protection against infectious respiratory diseases. Curr. Pharm. Biotechnol. 2024, 25, 787–798. [Google Scholar]
  17. Laube, B.L.; Kesavan, J.; Farias, G.; Karavas, N.; Blondel, M.; Suman, J. Targeting aerosol delivery to regions of nasal-associated lymphoid tissue (NALT) in three dimensional models of human intranasal airways using the BiVax intranasal atomizer. Front. Drug Deliv. 2024, 4, 1456538. [Google Scholar]
  18. Seifelnasr, A.; Talaat, M.; Ramaswamy, P.; Si, X.A.; Xi, J. A supine position and dual-dose applications enhance spray dosing to the posterior nose: Paving the way for mucosal immunization. Pharmaceutics 2023, 15, 359. [Google Scholar] [CrossRef]
  19. Abrami, M.; Biasin, A.; Tescione, F.; Tierno, D.; Dapas, B.; Carbone, A.; Grassi, G.; Conese, M.; Di Gioia, S.; Larobina, D.; et al. Mucus Structure, Viscoelastic Properties, and Composition in Chronic Respiratory Diseases. Int. J. Mol. Sci. 2024, 25, 1933. [Google Scholar] [CrossRef]
  20. Tufail, A.; Jiang, Y.; Cui, X. A review on the mucus dynamics in the human respiratory airway. Biomech. Model. Mechanobiol. 2024, 24, 107–123. [Google Scholar]
  21. Hill, D.B.; Button, B.; Rubinstein, M.; Boucher, R.C. Physiology and pathophysiology of human airway mucus. Physiol. Rev. 2022, 102, 1757–1836. [Google Scholar] [CrossRef]
  22. Ghadiri, M.; Young, P.M.; Traini, D. Strategies to enhance drug absorption via nasal and pulmonary routes. Pharmaceutics 2019, 11, 113. [Google Scholar] [CrossRef] [PubMed]
  23. Kumar, H.; Mishra, G.; Sharma, A.K.; Gothwal, A.; Kesharwani, P.; Gupta, U. Intranasal drug delivery: A non-invasive approach for the better delivery of neurotherapeutics. Pharm. Nanotechnol. 2017, 5, 203–214. [Google Scholar] [CrossRef] [PubMed]
  24. Rogers, T.D.; Button, B.; Kelada, S.N.P.; Ostrowski, L.E.; Livraghi-Butrico, A.; Gutay, M.I.; Esther, C.R.; Grubb, B.R. Regional differences in mucociliary clearance in the upper and lower airways. Front. Physiol. 2022, 13, 842592. [Google Scholar] [CrossRef]
  25. Davidovich, N.E.; Kloog, Y.; Wolf, M.; Elad, D. Mechanophysical stimulations of mucin secretion in cultures of nasal epithelial cells. Biophys. J. 2011, 100, 2855–2864. [Google Scholar] [PubMed]
  26. Zhang, N.; Van Crombruggen, K.; Gevaert, E.; Bachert, C. Barrier function of the nasal mucosa in health and type-2 biased airway diseases. Allergy 2016, 71, 295–307. [Google Scholar] [CrossRef]
  27. Lai, S.K.; Wang, Y.Y.; Wirtz, D.; Hanes, J. Micro- and macrorheology of mucus. Adv. Drug Deliv. Rev. 2009, 61, 86–100. [Google Scholar] [CrossRef]
  28. Leal, J.; Smyth, H.D.C.; Ghosh, D. Physicochemical properties of mucus and their impact on transmucosal drug delivery. Int. J. Pharm. 2017, 532, 555–572. [Google Scholar] [CrossRef]
  29. Cu, Y.; Saltzman, W.M. Mathematical modeling of molecular diffusion through mucus. Adv. Drug Deliv. Rev. 2009, 61, 101–114. [Google Scholar]
  30. Ghori, M.U.; Mahdi, M.H.; Smith, A.M.; Conway, B.R. Nasal drug delivery systems: An overview. Am. J. Pharmacol. Sci. 2015, 3, 110–119. [Google Scholar]
  31. Gizurarson, S. The effect of cilia and the mucociliary clearance on successful drug delivery. Biol. Pharm. Bull. 2015, 38, 497–506. [Google Scholar] [PubMed]
  32. Shang, Y.; Inthavong, K.; Qiu, D.; Singh, N.; He, F.; Tu, J. Prediction of nasal spray drug absorption influenced by mucociliary clearance. PLoS ONE 2021, 16, e0246007. [Google Scholar] [CrossRef] [PubMed]
  33. Ali, M.S.; Pearson, J.P. Upper airway mucin gene expression: A review. Laryngoscope 2007, 117, 932–938. [Google Scholar] [CrossRef] [PubMed]
  34. Deruyver, L.; Rigaut, C.; Lambert, P.; Haut, B.; Goole, J. The importance of pre-formulation studies and of 3D-printed nasal casts in the success of a pharmaceutical product intended for nose-to-brain delivery. Adv. Drug Deliv. Rev. 2021, 175, 113826. [Google Scholar] [CrossRef]
  35. Fang, S.; Rui, X.; Zhang, Y.; Yang, Z.; Wang, W. Comparative study of nasal cavity drug delivery efficiency with different nozzles in a 3D printed model. PeerJ 2024, 12, e17227. [Google Scholar] [CrossRef]
  36. Maaz, A.; Blagbrough, I.S.; De Bank, P.A. In vitro evaluation of nasal aerosol depositions: An insight for direct nose to brain drug delivery. Pharmaceutics 2021, 13, 1079. [Google Scholar] [CrossRef]
  37. Molinari, G.; Emiliani, N.; Cercenelli, L.; Bortolani, B.; Gironi, C.; Fernandez, I.J.; Presutti, L.; Marcelli, E. Assessment of a novel patient-specific 3D printed multi-material simulator for endoscopic sinus surgery. Front. Bioeng. Biotechnol. 2022, 10, 974021. [Google Scholar]
  38. Seifelnasr, A.; Si, X.A.; Xi, J. Visualization and estimation of nasal spray delivery to olfactory mucosa in an image-based transparent nasal model. Pharmaceutics 2023, 15, 1657. [Google Scholar] [CrossRef]
  39. Seifelnasr, A.; Zare, F.; Si, X.A.; Xi, J. Optimized gravity-driven intranasal drop administration delivers significant doses to the ostiomeatal complex and maxillary sinus. Drug Deliv. Transl. Res. 2024, 14, 1839–1859. [Google Scholar]
  40. Valtonen, O.; Ormiskangas, J.; Kivekäs, I.; Rantanen, V.; Dean, M.; Poe, D.; Järnstedt, J.; Lekkala, J.; Saarenrinne, P.; Rautiainen, M. Three-dimensional printing of the nasal cavities for clinical experiments. Sci. Rep. 2020, 10, 502. [Google Scholar]
  41. Zhao, K.; Kim, K.; Craig, J.R.; Palmer, J.N. Using 3D printed sinonasal models to visualize and optimize personalized sinonasal sinus irrigation strategies. Rhinology 2020, 58, 266–272. [Google Scholar]
  42. Zhuo, C.; Lei, L.; Yulin, Z.; Wentao, L.; Shuangxia, W.; Chao, W.; Yaqian, Z.; Shuman, H.; Dong, D. Creation and validation of three-dimensional printed models for basic nasal endoscopic training. Int. Forum Allergy Rhinol. 2019, 9, 695–701. [Google Scholar] [CrossRef] [PubMed]
  43. Girod, S.; Zahm, J.M.; Plotkowski, C.; Beck, G.; Puchelle, E. Role of the physiochemical properties of mucus in the protection of the respiratory epithelium. Eur. Respir. J. 1992, 5, 477–487. [Google Scholar] [CrossRef] [PubMed]
  44. Hallett, S.; Toro, F.; Ashurst, J.V. Physiology, tidal volume. In StatPearls; StatPearls Publishing: Treasure Island, FL, USA, 2024. [Google Scholar]
  45. Abdollahzadeh Jamalabadi, M.Y.; Xi, J. Olfactory drug aerosol delivery with acoustic radiation. Biomedicines 2022, 10, 1347. [Google Scholar] [CrossRef]
  46. Fedorov, A.; Beichel, R.; Kalpathy-Cramer, J.; Finet, J.; Fillion-Robin, J.C.; Pujol, S.; Bauer, C.; Jennings, D.; Fennessy, F.; Sonka, M.; et al. 3D Slicer as an image computing platform for the Quantitative Imaging Network. Magn. Reson. Imaging 2012, 30, 1323–1341. [Google Scholar]
  47. Zare, F.; Aalaei, E.; Zare, F.; Faramarzi, M.; Kamali, R. Targeted drug delivery to the inferior meatus cavity of the nasal airway using a nasal spray device with angled tip. Comput. Methods Programs Biomed. 2022, 221, 106864. [Google Scholar] [CrossRef] [PubMed]
  48. Bansil, R.; Turner, B.S. The biology of mucus: Composition, synthesis and organization. Adv. Drug Deliv. Rev. 2018, 124, 3–15. [Google Scholar] [CrossRef]
  49. Peters, G.; Jakubaß, B.; Weidenfeller, K.; Kniesburges, S.; Böhringer, D.; Wendler, O.; Mueller, S.K.; Gostian, A.O.; Berry, D.A.; Döllinger, M.; et al. Synthetic mucus for an ex vivo phonation setup: Creation, application, and effect on excised porcine larynges. J. Acoust. Soc. Am. 2022, 152, 3245. [Google Scholar]
  50. Singhvi, G.; Hans, N.; Shiva, N.; Dubey, S.K. Xanthan Gum in Drug Delivery Applications. In Natural Polysaccharides in Drug Delivery and Biomedical Applications; Hasnain, S., Nayak, A.K., Eds.; Academic Press: Cambridge, MA, USA, 2019. [Google Scholar]
  51. Grubb, B.R.; Chadburn, J.L.; Boucher, R.C. In vivo microdialysis for determination of nasal liquid ion composition. Am. J. Physiol. Cell Physiol. 2002, 282, C1423–C1431. [Google Scholar]
  52. Vanthanouvong, V.; Roomans, G.M. Methods for determining the composition of nasal fluid by X-ray microanalysis. Microsc. Res. Tech. 2004, 63, 122–128. [Google Scholar] [CrossRef]
  53. Si, X.A.; Sami, M.; Xi, J. Liquid film translocation significantly enhances nasal spray delivery to olfactory region: A numerical simulation study. Pharmaceutics 2021, 13, 903. [Google Scholar] [CrossRef] [PubMed]
  54. Bharti; Carlson, A.; Chan, T.S. Plateau–Rayleigh instability of a soft layer coated on a rigid cylinder. Soft Matter 2024, 20, 5456–5463. [Google Scholar] [CrossRef] [PubMed]
  55. Rykner, M.; Saikali, E.; Bruneton, A.; Mathieu, B.; Nikolayev, V.S. Plateau–Rayleigh instability in a capillary: Assessing the importance of inertia. J. Fluid. Mech. 2024, 1001, A15. [Google Scholar] [CrossRef]
  56. Quan, L.; He, J.; Lee, S.S.; Kalyon, D.M. Yield stresses of concentrated suspensions of rigid particles in the volume fraction range of 0.62 to 0.78 via steady torsional flow. Rheol. Acta 2023, 62, 111–127. [Google Scholar]
  57. Quan, L.; Kalyon, D.M. Parallel-disk viscometry of a viscoplastic hydrogel: Yield stress and other parameters of shear viscosity and wall slip. Gels 2022, 8, 230. [Google Scholar] [CrossRef]
Figure 1. Instruments and setups for measuring fluid properties and the experimental setup for nasal delivery tests: (a) contact angle measurement setup; (b) surface tension measurement apparatus; (c) viscometer; (d) viscometer spindles; (e) multi-dose nasal spray pump device; (f) nasal cavity models; (g) head orientation, administration angle, and insertion depth; (h) electromechanical, radio-controlled sniff generating apparatus.
Liquids 05 00011 g001
Figure 2. Fluid properties: (a) Contact angles of various liquids on a 3D-printed flat plate made of rigid transparent SLA resin under different surface conditions (dry and coated with synthetic mucus blankets of two consistencies: 0.25% w/v xanthan gum and 1% w/v xanthan gum); (b) dynamic viscosity and surface tension of saline nasal spray solution and xanthan gum saline solutions used as synthetic mucus. All measurements were conducted at a temperature of 22.4 °C. (c) Side-view images of the flat SLA resin plate under dry conditions and uniformly coated with a synthetic mucus blanket.
Liquids 05 00011 g002
Figure 3. (a) Particle size distribution of the saline spray, with mean (μ) and standard deviation (σ) indicated; (b) high-speed image of the generated spray plume; (c) saline spray inertial impaction test setup; inertial impaction results under different surface conditions (dry and coated with two synthetic mucus formulations: 0.25% w/v xanthan gum and 1% w/v xanthan gum) at two nozzle-to-surface distances: (d) 3 cm and (e) 6 cm.
Liquids 05 00011 g003
Figure 4. (a) Translocation distance of a single saline drop dispensed on a 30° inclined flat SLA resin surface over 10 s, under various surface conditions (dry, coated with 0.25% w/v xanthan gum saline solution, and 1% w/v xanthan gum saline solution); (b) top panel: experimental setup for the drop tests, showing the threaded plunger syringe used to dispense the drops and the inclined flat SLA plate; bottom panels: top view illustrating liquid behavior after dispensing a saline drop on the 30° inclined SLA plate coated with 0.25% w/v XG and 1% w/v XG.
Liquids 05 00011 g004
Figure 5. The number of saline drops required to initiate liquid film translocation across a dry, flat SLA resin surface at various inclinations (30°, 45°, and 60°), translocation time to cover a 100 mm distance, as well as the average volume and mass of a single saline drop.
Liquids 05 00011 g005
Figure 6. Liquid deposition distribution within nasal models (NC-1, NC-2, and NC-3) with uncoated internal nasal cavity walls, viewed from the lateral and septum sides after one spray application accompanied by a gentle sniff. Dynamic spray deposition and translocation in NC-2 can be viewed in Supplementary Video S1.
Liquids 05 00011 g006
Figure 7. Liquid deposition distribution within nasal models (NC-1, NC-2, and NC-3) with internal nasal cavity walls coated with a mucus blanket formed by 0.25% w/v xanthan gum saline solution, viewed from the lateral and septum sides after one spray application accompanied by a gentle sniff. Dynamic spray deposition and translocation in NC-2 can be viewed in Supplementary Video S2.
Liquids 05 00011 g007
Figure 8. Liquid deposition distribution within nasal models (NC-1, NC-2, and NC-3) with internal nasal cavity walls coated with a mucus blanket formed by 1% w/v xanthan gum saline solution, viewed from the lateral and septum sides after one spray application accompanied by a gentle sniff. Dynamic spray deposition and translocation in NC-2 can be viewed in Supplementary Video S3.
Liquids 05 00011 g008
Table 1. Contact angle, surface tension, and work of adhesion values for saline and synthetic mucus (0.25% and 1% w/v XG) on SLA resin surfaces under varying conditions.
Solution &
Surface Condition
Contact Angle
(θ, °)
Surface Tension
(mN/m)
Adhesivity
(Wad, mN/m)
Saline—dry SLA7077.81104.42
0.25% w/v XG—dry SLA5595.49150.26
Saline—0.25% w/v XG coating1577.81152.97
Saline—1% w/v XG coating2577.81148.32
Disclaimer/Publisher’s Note: The statements, opinions and data contained in all publications are solely those of the individual author(s) and contributor(s) and not of MDPI and/or the editor(s). MDPI and/or the editor(s) disclaim responsibility for any injury to people or property resulting from any ideas, methods, instructions or products referred to in the content.

