Article

Evaluation of Thermodynamic and Kinetic Contributions to Over-Extraction of Extractables by Nonpolar Organic Solvents in Comparison to Lipids in Exhaustive and Exaggerated Extractions of Medical Devices Based on Abraham Solvation Model and Solvent–Material Interactions Using Low-Density Polyethylene as a Representative Material

Chemical Characterization Solutions, LLC, P.O. Box 113, Newport, MN 55055, USA
Liquids 2024, 4(1), 117-147; https://doi.org/10.3390/liquids4010006
Submission received: 30 November 2023 / Revised: 23 December 2023 / Accepted: 11 January 2024 / Published: 23 January 2024

Abstract

:
The thermodynamic and kinetic contributions to the over-extraction of extractables by nonpolar organic solvents relative to biological lipids in exhaustive and exaggerated extractions of medical devices are studied based on the Abraham solvation model and solvent–material interactions, using low-density polyethylene (LDPE) as an exemplary material. The thermodynamic effect is evaluated by the partition constant of extractables between LDPE and extraction solvents, hexane and lipids, defined as the concentration in the polymer phase divided by the concentration in the solvent phase. The Abraham solvation model is used to correlate the measured LDPE-lipid partition constant ( l o g 10 P l d p e / l i p i d ) to construct the predictive model. Similar models are also derived from the thermodynamic cycle conversion, using the system constants of LDPE-water and Lipid-water partition systems. These constructed models, together with the predictive LDPE-hexane ( l o g 10 P l d p e / h e x a n e ) model established from a previous study, are used to predict and compare the ranges and values of P l d p e / s (s = lipids and hexane) for the observed LDPE extractables over a wide hydrophobicity range in l o g 10 P o / w from zero to 30. The solvent-LDPE interactions are examined by the degree of swelling of LDPE by hexane (or other nonpolar solvents) and lipids, including the solvent diffusion rates into the material. These parameters allow the evaluation of kinetic effect on the over-extraction. The extent of over-extraction is compiled directly by experimental “overall” or “specific” migration data or indirectly calculated by the diffusion coefficient of extractables when extracted by hexane or lipids. It is concluded from this study that the extractables distribution between LDPE and lipids highly favors the lipid phase thermodynamically ( P l d p e / l i p i d < 1 ), and the values of P l d p e / l i p i d are always lower than those of P l d p e / h e x a n e , thereby indicating that the thermodynamic effect is not the cause of over-extraction. It is the kinetic effect that dominantly contributes to the over-extraction, as supported by the material swelling and solvent diffusion rates. Finally, the extent of over-extraction has been established from a few folds to over a hundred-fold, and the median value is 7. Furthermore, the methods adopted and developed in this study can be invaluable tools in other disciplines such as the reliable prediction of extractables from other device materials and environmental sampling.

1. Introduction

Chemical characterization of medical devices (or assessment of extractables and leachables, E&L) is currently a subject of intense interest and an essential aspect of the regulatory review and approval of medical devices in the U.S., the European Union (EU), and most major markets around the world [1,2]. Chemical characterization is a process that identifies and quantifies the constituent chemicals of a specific device or its component and materials, which may have a direct or indirect human exposure from its clinical use [3]. This process consists of the liquid–solid extraction of medical devices, components, or materials using appropriate extraction solvents and/or conditions, followed by instrumental analysis of extraction samples (also called extracts) to determine the concentration and identity of E&L chemical entities, both of which are then used for a toxicological risk (or safety) assessment.
Extractables are “substances that can be released from medical devices, components, or their materials using extraction solvents and/or extraction conditions that are expected to be at least as aggressive as the clinical use [3]”. Leachables, which are typically a subset of extractables, are “substances that are released from a medical device during its clinical use [3]”. As these medical and biomedical products use diverse categories of materials, including polymers, metals, and ceramics [4]; and many different compounds are used as polymer additives, including antioxidants, plasticizers, heat and UV light stabilizers, extrusion chemicals, and colorants [5], E&L are a result of polymer monomers/oligomers/additives, and residues from sterilization, cleaning, manufacturing processes, or chemical degradation of the material. Obviously, the classes of E&L compounds and their physicochemical properties can be rather broad [6], and the number of extractables has been reported to be over 10K [7]. For example, the range of hydrophobicity of likely extractables from different materials can be from −2 to 19 in l o g 10 P o / w [6]. The term “extractables” is solely used in the remaining article, as nonpolar organic solvents are mainly used in extractables studies of medical devices by exaggerated and exhaustive extractions [3].
Nonpolar organic solvents, such as hexane, heptane, cyclohexane, etc., are used or recommended as the extraction vehicles in the exaggerated and exhaustive extraction of medical devices due to at least two reasons: (1) they are analytically expedient for instrumental analysis of extracts [3]; and (2) they are intended to simulate the polarity of the human lipid tissues, because the lipids are considered as nonpolar in general and are soluble in nonpolar organic solvents [8,9]. A similar practice has been adopted in the food industries over several decades. For example, vegetable oils such as olive oil are used as the food simulants for “overall” migration testing for fatty foods, according to Commission Regulation (EU) No 10/2011 on plastic food contact materials [10,11,12]. Because the “specific” migration testing in olive oil is often impossible, alternative simulants are being proposed: iso-octane and 95% ethanol [13,14,15,16]. The US FDA similarly recommends the use of some aqueous-based solvents (absolute or 95% ethanol) as alternatives for fatty-food simulants for polyolefins [11,17]. It is worth noting that lipids exist in biological tissues in many different physical forms, and the simple lipids are often part of large aggregates in storage tissues, such as oil bodies or adipose tissue (called as storage lipids). In contrast, other complex lipids are usually constituents of membranes, where they occur in a close association with such compounds as proteins and polysaccharides [18]. Because the recommended nonpolar extraction vehicles or simulants by ISO 10993-12 (2021) are vegetable oils such as olive oil [19], and vegetable oils and storage lipids are made of same mixtures of triglycerides, the lipids referred in this study belong to the storage lipids (or simply fats). Lipids, fats, and vegetable oils are considered the same in this study, and used interchangeably in the remaining article.
As extensively studied and documented already, the extraction solvent is perhaps the single most important variable affecting both the ultimate amount of extractables and their diffusion properties, acting through its solubility of extractables and its swelling action upon the polymer [20,21,22,23]. The equilibrium amount of extractables into a solvent system with a finite solvent-to-polymer volume ratio is governed by the partition constant or the respective solubilities of extractables in the solvent and in the polymer. When the system is far from equilibrium, the amount migrated is determined by the diffusion coefficients and associated parameters, such as the time of extraction and the thickness of the sample [21,24,25,26]. The combination of the effects of solubility, partitioning, and diffusion would determine ultimately the extractables profiles (the number and amounts of extractables, and the molecular weight distribution of all extractables from materials).
The partition constant, P p / l (typically defined as the equilibrium concentration in the polymer divided by the corresponding concentration in the solvent phase), is a fundamental physicochemical parameter describing the distribution of extractables between two contacting phases at equilibrium. The values for the partition constant range over several orders of magnitude depending on the polarities of polymeric materials involved, the extraction solvent, and the nature of extractables [27]. For instance, the partition constant of limonene, a nonpolar substance or hydrocarbon, in the LDPE/water system at 23 °C was found to be higher than 5000 [28]. This makes it retained in the polymer, whereas a much more polar compound like cis-hexenol shows a much lower value of 0.33, causing a considerable transfer into the water. The reverse is true for nonpolar extraction solvents such as hexane [29]. Numerous experimentally determined P p / l values between polyolefins and alcohols or alcohol/water mixtures have been reported [30]. In general, the partition constants between device materials and extraction solvents can be difficult to measure, due mostly to the time required to reach equilibrium and matrix interference for analysis. Several predictive approaches for calculating P p / l values have been proposed and published [29], but their accuracies are often questionable for a predictive purpose. It is currently assumed in the food industries that P p / l  < 1 for non-polar fat simulants or nonpolar organic solvents; and P p / l >> 1 for polar aqueous simulants for polyolefin materials [11,24,31,32]. Additionally, if a significant fraction of extractables in the polymer can migrate into a solvent thermodynamically, the amount of extractables observed at specific time points is dominated by diffusion, and can often be described as approximately proportional to the square root of time [20,24,25,26]. It is noted that P p / l is used in this study, consistent with the notation typically used by the solvation model [33]; however, K p / l is typically used in food industries [24,32].
Regarding the extraction of nonpolar (device) materials by alkanes (e.g., hexane) and lipids, the release kinetics of extractions of polyolefins by alkanes is usually faster than that by lipids (or vegetable oils), because alkane solvents cause a significant swelling of nonpolar materials, and enhance the diffusion rate of material constituents [20,22]. The interactions between lipids and polyolefins are much weaker due to the high MW of lipids/oils [34]. Because of the difference in release kinetics, a much shorter extraction time and lower temperature of alkanes have been evaluated and used to establish the equivalence between alkane and lipid extraction, so that the same amount of extractables by oils can be predicted by alkanes in food industries [13,16,35,36,37,38]. For example, 10 days and 40 °C olive oil extraction on polyolefins can be replaced by 2 days and 20 °C extraction with isooctane [28]. In fact, the FDA guidelines to correct for the accelerating action of n-heptane over food oils is by 5-fold [20].
The amount of extractables migrated and measured into an extraction solvent at defined time points in an exaggerated or exhaustive extractions of medical devices may not be equilibrium values, because the extraction end point is determined by the 10% rule [3]. If a parallel extraction experiment is performed using lipids and alkanes to extract polyolefins, the amount by alkane is higher than that by oils at the same sampling points, thereby resulting in a so called “over-extraction” by alkane solvents relative to lipids. In fact, this over-extraction occurrence by alkane solvents has been demonstrated in several studies already [20,39,40,41]. For example, in the study of migration of a UV absorber additive (UVITEX or (2,5-bis(5-ter-butyl-benzoxazol-2-yl)thiophen)) from a polypropylene material into a pure extraction solvent glyceryl tripelargonate, it was demonstrated that this solvent could swell the materials and enhance the mobility of extractables to cause an over-extraction by 100% [39]. Furthermore, this effect was more pronounced for high molecular weight compounds and thick materials. In another study of extraction of polyolefins, including LDPE, HDPE, and PP, by n-heptane, ethanol, and vegetable oils, it was clearly shown that the heptane solvent could accelerate the diffusion process during extractions, and the total weight fraction of oligomers extracted by n-heptane is about 6–8 times greater than that extracted by corn oils [20]. Additionally, the difference in the total amount extracted was caused by different amounts of the higher molecular weight species being extracted by n-heptane. A similar accelerating effect of organic solvents was also demonstrated by a migration study of LDPE using Irganox 1076 as the model extractables, and organic solvents caused a significant solvent absorption, not observed for the triglycerides and olive oil [40]. Accordingly, an over-extraction should be expected relative to biological lipids, when nonpolar organic solvents are used to substitute lipids to perform the chemical characterization studies. This phenomenon could have a profound consequence on the results of the chemical characterization studies and subsequent toxicological risk assessments.
The general conclusion so far on the cause of over-extraction seems to be the kinetic effect [20]; however, this is based on a limited amount of partition data. In fact, the partition constants of LDPE-hexane or LDPE-lipids are scarce in the literature. A few studies can be found on measuring LDPE-oil partition constants of limited compounds [20,42,43,44,45,46,47], but the data accuracy is questionable due to the durations and techniques of these studies. Based on rather limited data, it was proposed that the logarithm of LDPE-lipid partition constant ( l o g 10 P l d p e / l i p i d ) is positively proportional to l o g 10 P o / w with 16 compounds over a l o g 10 P o / w range from 0.5 to 18 by olive oil [44,45]. The best and comprehensive measurement of LDPE-lipid partition constants were recently conducted by a polymer-lipid partitioning setup [47]. It was concluded that l o g 10 P l d p e / l i p i d is independent of or (weakly) negatively proportional to l o g 10 P o / w . Overall, there is not a specific comprehensive study on the range of LDPE-lipid or LDPE-alkane partition constants of extractables from LDPE or other materials; and their dependence on l o g 10 P o / w . As the material extractables can be rather broad in physicochemical properties in chemical characterization studies [6], the scope of these partition constants remain an assumption and unknown, in particular on the difference between alkanes (hexane as an example in this study) and lipids/oils. The judgement on the thermodynamic and kinetic contributions to the over-extraction cannot be specifically delineated under the current situation. The partition constant between polyolefins, including LDPE, and lipids/oils/alkanes is currently assumed to be one in the diffusion-based predictive modeling of extractables release [48,49], but it remains unclear whether this assumption would be suitable limits for all extractables of different physicochemical properties. Although it is well recognized that methods for the evaluation of specific and accurate partition constants are required to predict patient exposure to polymeric medical device extractables using physics-based models [48], no such methods have been reported so far. Moreover, a reliable model for the prediction of LDPE-lipid distribution is also important in other fields such as environmental sampling [47,50,51,52].
The purpose of this study is four-fold: (1) to explore the correlation of P l d p e / s (s: hexane or lipids) by the Abraham solvation model for a predictive purpose; (2) to quantitatively explore the range of P l d p e / s of the LDPE extractables over a broad hydrophobicity range; (3) to evaluate the dependence of P l d p e / s on the hydrophobicity of extractables from a practical perspective, and the effect of P l d p e / s on over-extraction of medical devices by alkanes; and (4) to conduct a systematic study into the extent of over-extraction, using LDPE as an example. The first three goals are achieved by the Abraham solvation model, which has been used successfully to correlate the partition constant between polymeric materials and solvents with and without a material swelling [33]. The use of the solvation model to directly correlate the partition constants of LDPE-lipids has not been reported so far to the best of my knowledge. Additionally, LDPE is a nonpolar material, commonly used in food and pharmaceutical packaging, and medical devices [53,54], and can also be a suitable representation for other nonpolar materials such as linear low-density polyethylene (LLDPE), polydimethylsiloxane (PDMS or silicone), high-density polyethylene (HDPE), polystyrene (PS), etc.
The specific goals of this study are outlined as follows:
(1)
Correlation of the partition constant between LDPE and lipids by the Abraham solvation model. The constructed (predictive) models are then used to predict the partition constant of extractables observed for LDPE over a wide hydrophobicity range.
(2)
Calculation of the partition constant between LDPE and hexane for the same LDPE extractables.
(3)
Assessment of the dependence of LDPE-lipid and LDPE-hexane partition constants on l o g 10 P o / w using extractables observed for LDPE.
(4)
Evaluation of the adequacy of the LDPE-lipid and LDPE-hexane predictive models.
(5)
Comparison of the range and difference of two sets of partition constants (LDPE-lipid and LDPE-hexane) for the observed LDPE extractables to understand the thermodynamic effect on over-extraction.
(6)
Study of LDPE-lipid interactions by the adsorption of lipids into LDPE in comparison to alkanes and other organic solvents.
(7)
Assessment of the range of solvent diffusion coefficients by both types of solvents.
(8)
Estimation of the extent of over-extractions by alkanes.
Based on the goals and conclusions of this study, two critical questions are answered: (1) What is the dominant factor in controlling over-extraction by alkanes (e.g., hexane)? (2) what is the extent of over-extraction? Furthermore, the conclusion of the study on the use of Abraham solvation model to correlate and predict the polymer-lipid partition constant can be applied not only to the prediction of extractables chemicals from medical device polymers, but also to the environmental passive sampling [47,50,51,52].
Elemental impurities and inorganic anions are not included in this study, as they are handled differently from organic extractables.

2. Methods

The sequence of the study can be briefly defined below:
  • Development of the Abraham solvation working models to correlate the partition constant ( l o g 10 P l d p e / l i p i d ) between LDPE and lipids using: (1) multiple linear regression (MLR) analysis of the measured partition constant ( P l d p e / l i p i d ), and (2) a thermodynamic cycle method [55,56]. The solutes used in the model construction are directly taken from the ref [47]. These predictive models are used to predict the l o g 10 P l d p e / l i p i d of experimentally observed LDPE extractables over a wide range of hydrophobicity.
  • Establishment of empirical relationships between the partition constant l o g 10 P l d p e / l i p i d and l o g 10 P o / w using experimentally observed LDPE extractables.
  • Establishment of empirical relationships between the partition constant l o g 10 P l d p e / h e x a n e and l o g 10 P o / w using the same experimentally observed LDPE extractables for a comparison purpose.
  • Comparison of the dependence of l o g 10 P l d p e / s on l o g 10 P o / w (s: lipids or hexane) between hexane and lipids to assess the extractability of LDPE by hexane and lipids from a thermodynamic perspective.
  • Justification of the suitability of the constructed solvation models in the prediction.
  • Assessment of the practical implications of the difference between l o g 10 P l d p e / l i p i d and l o g 10 P l d p e / h e x a n e values on over-extraction by hexane (or alkanes).
  • Assessment of the material-solvent interactions between LDPE and alkanes/lipids and their influence on over-extraction.
  • Compile and estimate the degree of over-extraction of LDPE material by alkane solvents relative to lipids/oils.

2.1. Abraham Solvation Model

The Abraham solvation parameter model describes the solute transfer between two condensed phases, or between a condensed phase and a gas phase [57,58,59]. Extensive specific chemical and biological processes have been successfully described by the basic model [60]. This model uses a common set of solute descriptors for all types of solute transfer processes. The basic model that describes solute transfer of neutral molecules between two condensed phases is as follows:
l o g 10 P = c + e E + s S + a A + b B + v V
The dependent variable in Equation (1) is l o g 10 P , where P is the solvent-to-solvent partition constant in molar concentration for the transfer of solutes between two condensed phases, including polymers. The intercept, c term, contains information for system properties only. (c, e, s, a, b, v) are the solvent system constants, and (E, S, A, B, V) are the solute descriptors: E is the solute excess molar refractivity in units of (cm3/mol)/10, S is the solute dipolarity/polarizability, A and B are the overall or summation hydrogen bond acidity and basicity, and V is the McGowan characteristic volume in units of (cm3/mol)/100. To date, solvent system constants have been determined for over 90 commonly used solvents (wet and dry) [59]. Equation (1) is used to correlate the LDPE-lipids (or hexane) partition constants in this study.
It is noted that the general solvation model has been used to describe the transfer between polymeric phases and liquid solvent phases with and without a material swelling [33]. One of the major goals of this study is to apply the solvation model to LDPE-lipid system to understand the thermodynamic effect on over-extraction of medical devices by nonpolar solvents, including alkanes.

2.2. Construction of Abraham Solvation Model for LDPE-Lipid Partition Constant

The LDPE-lipid partition constants ( l o g 10 P l d p e / l i p i d ) are difficult to measure and scarce in the literatures. However, a number of “nonpolar” organic compounds (total 78, polychlorinated biphenyls, polycyclic aromatic hydrocarbons, and organochlorines) have been measured and reported recently [47], shown in Supplemental Information Section (Table S1). Because the measured compounds are “nonpolar” or moderately polar, the descriptor spaces of these compounds are limited in the S, A, and B descriptors, and the range of the l o g 10 P l d p e / l i p i d values is narrow as well. Although this situation is not ideal [57], a multiple linear regression (MLR) method is still used to correlate the partition constants with the descriptors by Equation (1), as described in Section 3.4 and Section 3.5.
Additionally, a “thermodynamic cycle” method is used to derive the solvation model [55,56], using the system constants of LDPE-water partition systems ( l o g 10 P l d p e / w a t e r ) [56,61,62] and the Lipid-water partition system ( l o g 10 P L i p i d / w a t e r ) from the literature [51]. The relevant system constants of partition systems are tabulated in Table 1. For example, the l o g 10 P l d p e / l i p i d is derived through the thermodynamic cycle using the constants from Systems D and G in Table 1 as follows [51,56]:
l o g 10 P l d p e l i p i d = l o g 10 P l d p e w a t e r l o g 10 P l i p i d w a t e r = c + e E + s S + a A + b B + v V l d p e / w a t e r c + e E + s S + a A + b B + v V l i p d / w a t e r = δ c + δ e E + δ s S + δ a A + δ b B + δ v V = 0.459 + 0.398 · E 0.477 · S 1.271 · A 0.477 · B 0.224 · V
Equation (2) is shown and labelled as System I in Table 1. The results of a similar derivation using the LDPE-water Systems E and F are also shown in Table 1 (as J and K). The three systems are called as “Cycle-A”, “Cycle-B”, and “Cycle-C” models in Table 1.

2.3. Construction of Abraham Solvation Model for LDPE-Hexane Partition Constant

The model for the LDPE-hexane partition constants ( l o g 10 P l d p e / h e x a n e ) has been constructed previously [33], as indicated by Equation (3) (and System L in Table 1).
l o g P l d p e / H e x a n e = 1.104 + 0.329 E 0.033 S 1.315 A 0.977 B + 0.229 V
It is noted that the effect of solvent swelling in LDPE is included in the model. The suitability of Equation (3) is discussed further in Section 2.6 and Section 4.4.
Furthermore, the l o g 10 P l d p e / h e x a n e solvation model (System M) is also derived through the thermodynamic cycle using the data (Systems D [51] and H [59]) in Table 1 without a consideration of solvent swelling. It is noted that the constants of Systems L and M are nearly opposite, indicating the effect of swelling on the extractables distribution.

2.4. Calculation of LDPE-Lipid and LDPE-Hexane Partition Constants of Observed LDPE Extractables

The solvation models (Systems B, I, J, and K in Table 1) are then used as the predictive models to calculate the LDPE-lipid and LDPE-hexane partition constants for the observed LDPE extractables (shown in Table S2). System B is called “MLR” model in Section 3.5.

2.5. Evaluation of Dependence of l o g 10 P l d p e / l i p i d and l o g 10 P l d p e / h e x a n e on l o g 10 P o / w of Observed LDPE Extractables

The dependence of l o g 10 P l d p e / l i p i d and l o g 10 P l d p e / h e x a n e on l o g 10 P o / w is empirically evaluated for the observed LDPE Extractables, because they do not have the same reference phase [33]. This is simply done by a linear correlation between of l o g 10 P l d p e / l i p i d or l o g 10 P l d p e / h e x a n e and l o g 10 P o / w . Note that a more complex equation was used in ref [33] to empirically describe the relationship.

2.6. Suitability of Use of Constructed Models to Predict l o g 10 P l d p e / l i p i d and l o g 10 P l d p e / h e x a n e for the Observed LDPE Extractables

To assess if the constructed solvation models (MLR, and Cycle-A to C, plus Equation (3)) are suitable in predicting l o g 10 P l d p e / l i p i d and l o g 10 P l d p e / h e x a n e for the observed LDPE extractables, the partition constant ratio ( R h / l ) between P l d p e / h e x a n e and P l d p e / l i p i d is derived as follows:
l o g 10 R h / l = l o g 10 P l d p e / h e x a n e P l d p e / l i p i d = l o g 10 P l d p e / h e x a n e l o g 10 P l d p e / l i p i d
Equation (4) can be thermodynamically corresponding to:
l o g 10 R h / l = l o g 10 P l i p i d / w a t e r l o g 10 P h e x a n e / w a t e r = l o g 10 C l i p i d C h e x a n e
where C l i p i d and C h e x a n e in Equation (5) are the concentration in lipid and hexane phases at equilibrium.
Equation (5) indicates that l o g 10 R h / l can have the same reference phase, water, with l o g 10 P o / w in principle and a linear relationship between l o g 10 R h / l and l o g 10 P o / w should be expected fundamentally, although they are derived differently. The correlation of l o g 10 P l d p e / h e x a n e was derived by the partition systems of LDPE-methanol and heptane-methanol [33]. The l o g 10 P l d p e / l i p i d are derived from MLR and thermodynamic cycle conversion in this study. If a linear relationship could be established between l o g 10 R h / l and l o g 10 P o / w , the constructed models for l o g 10 P l d p e / l i p i d and l o g 10 P l d p e / h e x a n e are confirmed to be correct and suitable to predict LDPE-lipid and LDPE-hexane distributions. See Section 4.4 for more details.

2.7. Calculation of l o g 10 P o / w of Measured and LDPE Extractables Compounds

The Abraham solvation parameter model for the octanol–water partition constant ( l o g 10 P o / w ), as the hydrophobicity parameter, has been constructed as follows [63]:
l o g 10 P o / w = 0.088 + 0.562 E 1.054 S + 0.034 A 3.460 B + 3.814 V
The descriptive statistics in deriving Equation (6) are: R = 0.995, SE = 0.12, F = 23,255, and n = 613. This equation is used to calculate l o g 10 P o / w of the measured compounds (Table S1) and representative LDPE extractables compounds (Table S2, see Section 3.6 for details).

2.8. Differentiation between Thermodynamic and Kinetic Contributions

The amount of extractables released into a solvent at a specific time is related to thermodynamic (time-independent) and kinetic (time-dependent) influences [14,25,40,48]. The thermodynamic contribution defines the limit of extraction by the partition constant ( P l d p e / s ). If M S denotes the amount of extractables released from LDPE at equilibrium and M T is the total amount initially present in LDPE, the amount extracted at equilibrium can be written as follws [48]:
M S M T = 1 V l d p e P l d p e / s / V S + 1
where V l d p e and V S are the volume of LDPE and solvent phase, respectively. Equation (7) indicates that, if P l d p e / s is much smaller than unity, M S M T ~ 1 (or ~100%).
Under the limit set by the thermodynamic parameter, the kinetic contribution to the amount extracted at a specific time has been studied extensively [14,25,40,48]. Both exact and approximate equations have been developed. The most relevant conclusion to this study is that the amount extracted is exactly or approximately dependent on the square root of the time with the slope controlled in part by the diffusion coefficient of the extractables.

2.9. Estimation of Over-Extraction of LDPE by Alkanes Compared to Lipids

Over-extraction (OE) is defined in this study as the amount extracted by alkanes to that by lipids. No such data can be directly compiled from the literature. There were a few studies to compare the extraction equivalency between vegetable oils and alkanes, particularly isooctane, either by overall migration and specific migration (of an extractables compound). These data are directly used to estimate the over-extraction. Additionally, the extent of over-extraction is derived from the compiled diffusion coefficients of extractables from LDPE to alkanes and lipids. They are briefly described as follows:
(1)
Direct calculation by:
O E = A A l k a n e A L i p i d
where A A l k a n e is the amount migrated to alkanes; and A l i p i d is the amount migrated to lipids and vegetable oils. The amount can be obtained by overall migration testing or specific migration testing over a specific time duration.
(2)
Estimation by kinetic diffusion coefficients as follows:
O E = D A l k a n e s D o i l s / e t h a n o l
where D A l k a n e is the diffusion coefficient of extractables migrated to alkanes; and D l i p i d is the diffusion coefficient migrated to lipids and vegetable oils. Equation (8) is derived by the square root dependence of extracted amount on the diffusion coefficient by each solvent [26]:
M t M = 4 l D t π 1 2
where l is the thickness of the material, D is the diffusion coefficient, t is time, and M t M is the fraction extracted at time t. Note that Equation (10) applies to devices of any shape [25,26]. For polyolefins, including LDPE, the diffusion rate by vegetable oils and lipids can be represented by that of ethanol solvent [13,14,15,35,64].

3. Experimental

3.1. Collection of LDPE-Lipid Partition Constants

The LDPE-lipid partition constants are collected from the literature [42,43,44,45,46,47], including olive oils and sunflower oils as the lipids [42,43,44,45,46]. The data from the ref [47] were measured by lipids for neutral organic compounds, mostly “nonpolar” environmental contaminants, and are used in the construction of the solvation model. They were measured at 4 and 20 °C by partitioning experiments between polymers (silicones and LDPE) and lipids (fish oil and triolein), and a total of 78 of them were measured. The unit of these partition constants is Kg/Kg [47]. These compounds and their LDPE-lipid partition constants, together with their descriptors and hydrophobicity, are Table S1. The values in Table S1 are the final generic (mean) P p / l (or K p l ) values, averaged from four mean values of two lipid types (fish oil and triolein) and temperatures (4 and 20 °C), since they show no dependence on temperature or storage lipid type. The range of l o g 10 P o / w of these compounds is 2.75–7.92 (Equation (6)). It should be emphasized that the partition constant is insensitive to temperature [43,47,65,66,67,68,69] and lipid/oil types (fish oil, triolein fish, olive, rapeseed and sunflower oil) [47,50,51,70,71,72,73]. It is also assumed that LDPE material heterogeneity has no influence on the partition constant [52,54].
The LDPE-oil (olive oil and sunflower oil) partition constants are also included in Table S1 to understand the range of LDPE-lipid partition constant, considering lipids and vegetable oils are the same. However, they are not used in the model construction.

3.2. Collection of Observed LDPE Extractables

To evaluate the over-extraction from LDPE material, the most relevant LDPE extractables should be used in this study. Experimentally observed extractables from LDPE are collected from literature publications [74,75,76,77,78,79,80]. A total of 76 LDPE extractables of different classes of compounds by organic solvent extraction are compiled and tabulated in Table S2, together with their descriptors, hydrophobicity, etc. They are used to evaluate the range of LDPE-lipid and LDPE-hexane partition constants. The hydrophobicity range of the collected extractables compounds in l o g 10 P o / w by Equation (6) is 0.3 to 29.5 (mostly below 17) and MW range from 72.1 to 1177.6.

3.3. Compilation of Abraham Solvation Model Constants of LDPE-Water and Lipid-Water Partition Systems

The Abraham model system constants for LDPE-water and LDPE-lipid partition systems are compiled to derive the system constants of LDPE-lipid partition system by a thermodynamic cycle method [55,56]. Table 1 shows the results of the collection, together with the system constants of other partition systems. It is noted in Table 1 that the range of temperature in Table 1 is from 20 to 37 °C in all studies. The correlation of measured partition constants by the solvation model is considered applicable within this range (and beyond), because the partition constant is not sensitive to temperature (Section 3.1). Additionally, the material sources for the studies in Table 1 could be different, but this is the reality that needs to be accepted.
It should be mentioned that the unit of partition constants in Table 1 can be kg/kg, L/kg or L/L. The density of LDPE is about 0.92 g/mL [52,54], and the density of lipids/fat is also about 0.92 g/mL. The values of LDPE-lipid partition constants are essentially the same by all three units and will not be distinguished further (see Table 1 for more details). However, the density of hexane is 0.66 g/mL, and significantly different from LDPE. This difference in density will be corrected in Equation (3) (System L and M in Table 1) to convert L/L unit to kg/kg unit, consistent with the data from Ref. [47]. The correction is on the c constant in Systems L and M by subtracting l o g 10 0.66 / 0.92 = 0.144 .

3.4. Determination of Descriptors of Collected Compounds

To correlate l o g 10 P l d p e / l i p i d by the solvation model, the descriptors (E, S, A, B, and V) of these compounds are required. For the compounds (Tables S1 and S2) collected in this study, their descriptors are calculated by the “RMG: Solvation Tools” (SoluteML module), an online computational program based on group contributions and machine learning approaches [81]. The inputs for the algorithm are the canonical SMILES notations. These notations are mostly obtained from “PubChem” database using CAS # search. The descriptors from Wayne State University experimental descriptor database are also adopted, as discussed in Section 4.1.1 [82].
The correlation matrix of descriptors for the solutes in Tables S1 and S2 are shown in Tables S3 and S4.

3.5. Construction and Correlation of LDPE-Lipid Partition Constant by Abraham Solvation Model

The Abraham solvation model, Equation (1), is used to construct the LDPE-lipid partition constants ( l o g 10 P l d p e / l i p i d ) in this study. This is performed in two ways, as described in Section 2.2. The first is by MLR with and without the aA term. The regression results and statistics are shown in Table 1. The model without the aA term is called MLR model in Table 1. The second is by the thermodynamic cycle conversion using the system constants of l o g 10 P l i p i d / w a t e r and l o g 10 P l d p e / w a t e r . The results of the conversion are also indicated in Table 1. The models (Systems I, J and K) by thermodynamic cycle conversion are called “Cycle”.

3.6. Calculation of l o g 10 P o / w of Representative Extractables Compounds

Calculation of l o g 10 P o / w of representative extractables compounds is performed using Equation (6) with descriptors in Tables S1 and S2, as described in Section 2.7. They are shown in Tables S1 and S2.

3.7. Calculation of l o g 10 P l d p e / l i p i d and l o g 10 P l d p e / h e x a n e for Observed Extractables Compounds

The l o g 10 P l d p e / s (s = hexane or lipids) for the observed LDPE extractables in Table S2 are computed using the system constants of MLR, Cycle-A to Cycle-C models, plus Equation (3) (System L) in Table 1.
The empirical correlation between l o g 10 P l d p e / s (s = hexane or lipids) and l o g 10 P o / w is described in Section 2.5. The results of the correlation for lipid and hexane are shown in Table 2. The established relationships can be used to determine and compare the range of l o g 10 P l d p e / s for observed LDPE extractables.
The range of l o g 10 P l d p e / s (s = hexane or lipids) for the observed LDPE extractables are calculated by the correlation results in Table 2, and are shown in Table 3.

3.8. Correlation of l o g 10 R h / l and l o g 10 P o / w for Observed Extractables Compounds for Model Verification

The l o g 10 R h / l values are plotted against l o g 10 P o / w for the observed extractables compounds. The linear correlation results and descriptive statistics between them are shown in Table 2 to evaluate the model suitability for the predictive purpose.

3.9. Collection of Solvent Absorption and Swelling Data for LDPE

To fully elucidate the extractables migration processes from LDPE to hexane and lipid, it is necessary to consider the impact of LDPE-lipid and LDPE-hexane interactions, as indicated by the solvent absorption or swelling data [33,83]. Table 4 shows the results of collection of LDPE by lipids, oils, oils and organic solvents [40,47,84,85,86,87,88,89,90,91,92,93,94].

3.10. Estimation of Over-Extraction Data of LDPE by Alkanes

The extent of over-extraction (OE) of hexane (or alkanes in general) to lipid are estimated by direct overall migration or specific migration data or extractables diffusion coefficients, as described in Section 2.9. The OE values are tabulated in Table S5 [14,15,20,22,34,40,41,87,95,96,97,98]. It is also noted that, although the nonpolar organic solvent focused in this study is hexane, any reported data with alkane solvents are collected to determine OE because the extraction properties of all alkanes are similar toward nonpolar polymers such as LDPE (details are not shown). An example of this conclusion is shown in Figures S1–S3 between LDPE and HDPE. The kinetic extraction profiles of HDPE by solvents are similar to those of LDPE (see Section 4.8.2).

4. Results and Discussion

4.1. Correlation of LDPE-Lipid Partition Constant by Solvation Model

The construction of predictive models for LDPE-lipid partition constants is proceeded by two ways: (1) correlation of experimental data by the solvation model and (2) thermodynamic cycle conversion. They are discussed in the following sections.

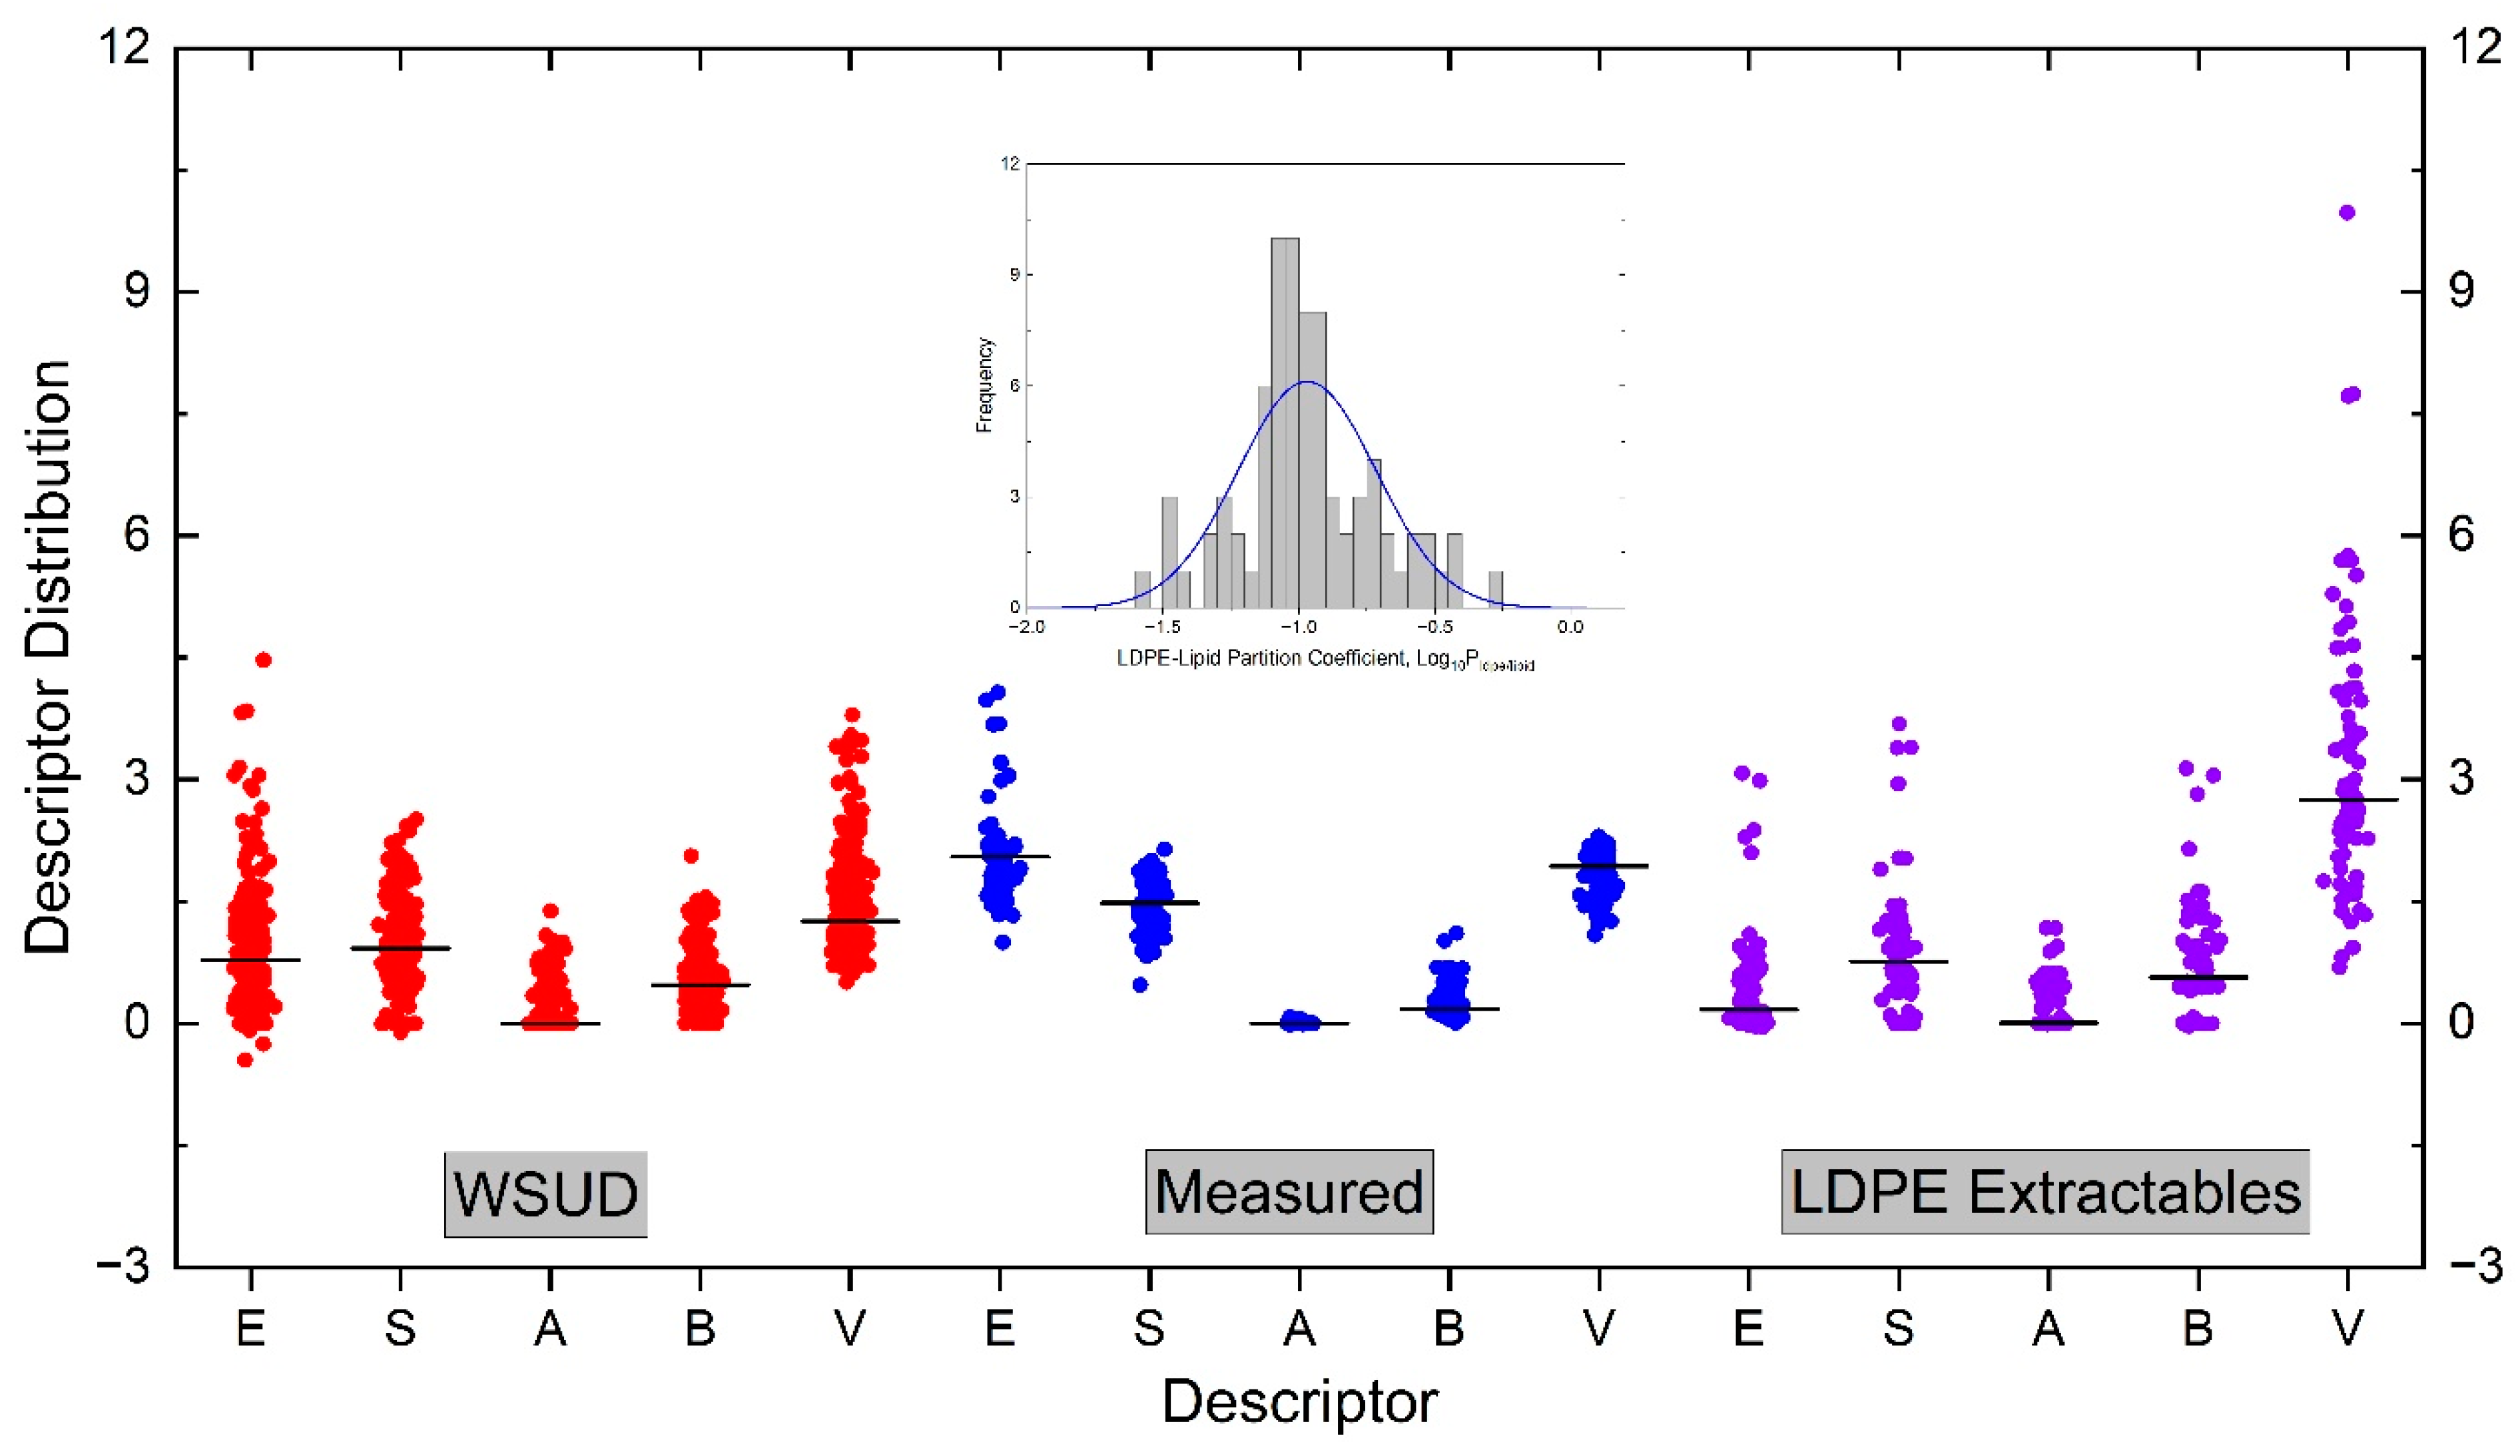
4.1.1. The Space of Abraham Solute Descriptors

To construct the solvation models (Equation (1)) for the partition constant of l o g 10 P l d p e / l i p i d , the descriptors of these solutes (Table S1) are required and computed, as described in Section 3.4. As the range or space of each descriptor is important in the construction of a reliable prediction model [57], it is necessary to first examine them judiciously. Figure 1 shows the descriptor spaces for three sets of compounds: (a) the solutes in Wayne State University Database (WSUD, 293 compounds) [82], (b) solutes with measured l o g 10 P l d p e / l i p i d (Table S1, 78 solutes), and (3) the experimentally observed LDPE extractables by solvent extraction (Table S2, 76 compounds). The descriptors of each set of compounds are plotted as box-overlap graph in Figure 1, including an inserted figure on the distribution of l o g 10 P l d p e / l i p i d of the measured compounds (Table S1). The inclusion of WSUD is used as the reference for the adequate range of each descriptor, as the descriptors in WSUD were experimentally measured using the same protocol and calibration scheme, and they are considered as adequate in the construction of the solvation models due to their range and accuracy. The range of each descriptor in WSUD is as follows: E from −0.45 to 4.47, S from −0.11 to 2.51, A from 0 to 1.38. B from 0 to 2.06, and V from 0.51 to 3.79. Moreover, the hydrophobicity range of compounds in WSUD in l o g 10 P o / w is from −1 to 13.6, calculated by Equation (6).
It is seen in Figure 1 that the span of each descriptor in WSUD is wide, only the A descriptor has a small median value. The span of each descriptor is at least 1.4. They are used as the references for the other two sets of solutes. The descriptors for the measured solutes in Table S1 are in general narrower, particularly for the A descriptor (its span is less than 0.1, from zero to 0.08), because no hydroxy or carboxylic compounds are included in the measurement [47]. The consequence of this narrow A descriptor is the statistical uncertainty in the a constant in the multiple linear regression (MLR) by Equation (1) to construct the solvation model. The B descriptor is reasonably wide and acceptable, but the median value is small. It is also seen in Figure 1 that the space of each descriptor of the observed LDPE extractables are in general wide and acceptable compared to the WSUD, although the A descriptor is also in a narrow space with a small median value. The V descriptor of the observed LDPE extractables is wide, due to the observation of high MW polymer additives, such as Irganox 1010, in extraction solvents.
It should be mentioned that the range of descriptors of the measured solutes are more important than those for the observed LDPE extractables, because they are used to construct the predictive models. The correlation matrix for the measured solutes and observed LDPE extractables are shown in Tables S3 and S4. It can be seen in Table S3 that, although the A descriptor space is narrow, the correlation among the descriptors is in general excellent [57].

4.1.2. Construction by the Multiple Linear Regression (MLR)

The experimental l o g 10 P l d p e / l i p i d data collected for 78 organic compounds are used to construct the predictive model (Table S1). The distribution of the l o g 10 P l d p e / l i p i d data are shown as an inserted figure in Figure 1. It can be seen in Figure 1 that the distribution of l o g 10 P l d p e / l i p i d is narrow from −1.55 to −0.29, about 1.3 log units. The range of l o g 10 P l d p e / l i p i d values and the descriptor spaces for the measured values are not considered ideal for constructing the correlation model [57]; however, this is the only available dataset with adequate accuracy and number of solutes. The range of l o g 10 P l d p e / l i p i d , of course, should be narrow, because the two partitioning phases are chemically similar.
The experimental data (Table S1) are correlated with model Equation (1) by MLR. Two correlation options are adopted, with and without the aA term (Section 2.2 and Section 3.5). The correlation results and descriptive statistics are shown in Table 1 (Systems A and B). It can be seen in Table 1 that the a constant is 1.475 if included in the regression, and it is not statistically significant, as indicated by the p-value (>0.05), consisting with the lack of A descriptor values in the dataset. When the aA term is excluded in the linear regression, the correlation results and statistics are barely changed. The SE is about 0.12 (SE/range < 10%) in both cases, and the F-values are 57 (with aA term) and 69 (without aA term), respectively. The correlation coefficient is low because the range of the l o g 10 P l d p e / l i p i d is narrow. Overall, the correlation statistics by Equation (1) is considered acceptable with the limited range of the data.
The predicted l o g 10 P l d p e / l i p i d values by MLR for the compounds in Table S1 are plotted against the measured values, and they are shown in Figure 2 (plot A). Also included in Figure 2 are the standardized residual distribution as plot B. It is seen in Figure 2 that the data points in plot A are symmetrically distributed along the diagonal line, and the absolute standardized residuals are within 3 (plot B). Thus, the constructed MLR model is considered as adequate in predicting the l o g 10 P l d p e / l i p i d of compounds without a significant HB acidity contribution. The model is used to explore the range of l o g 10 P l d p e / l i p i d for the observed LDPE extractables in Section 4.2 (Table S2).

4.1.3. Construction by the Thermodynamic Cycle Conversion

The distribution of extractables between LDPE and lipids can also be derived using LDPE-water and lipid-water partition system by a thermodynamic cycle method (Section 2.2 and Section 3.5), because the LDPE and lipids are considered as immiscible. Although there is a slight lipid penetration to the LDPE phase, it is negligibly low [47], as discussed in Section 4.8.1. Due to the difficulty in measuring the partition constants, the thermodynamic cycle method can be a useful and acceptable approach to evaluate this distribution. Table 1 also tabulates the system constants for LDPE-water, lipid-water, hexane-water partition systems. Three sets of LDPE-water systems are listed in Table 1 (Systems D, E, and F), and they are all used to derive the system constants for the LDPE-lipid system (Cycle-A to C).
Comparing the MLR model and Cycle-A to C models (total four models) in Table 1, it is apparent that the a constant in the MLR model should be negative, as it is consistently negative in the Cycle models. Furthermore, the sign of the a constant should be consistent with that of the b constant in general. The e (or δe) constant in all equations is positive and the v (or δv) constant in all models is negative. It is noted in Cycle-B that the b constant (0.103) is positive, but the error bars for both a and b are larger than their values, indicating that they are statistically insignificant. But it is used further for a comparison purpose, as discussed in the following sections.
It is worth noting regarding the four models that the positive (e or δe) constant suggests that LDPE is more prone to generate dispersion interactions than lipids to interact with the solute through n and π-electron pairs [57]. The negative (s or δs) constant suggests LDPE having a lower ability to interact with dipolar/polarizable solutes. The negative (a or δa) and (b or δb) constants reveal LDPE having a lower ability to interact with solutes through the hydrogen bonding interactions, and the negative v (or δv) reflects LDPE have a lower ability to interact with solutes from the dispersion interactions and cavity effects. These results are sensible considering the fact that the lipid phase has water and polar components (the ester function group) [51,70], and it makes sense that all S, A, and B constants are negative. The ester groups in lipids are hydrogen bond acceptors and can interact with more polar solutes. The negative v constant in all models indicates that the l o g 10 P l d p e / l i p i d is becoming smaller as the hydrophobicity increase. This is a contrast to the of l o g 10 P l d p e / h e x a n e from the previous study [33].
To evaluate the similarity and differences among the four models, the partition constants of measured compounds are computed by each model (Table 1) and descriptors in Table S1. The calculated values are plotted against the predicted values by MLR model (without the aA term), as it best represents the measured data. It is noted that these compounds do not possess significant hydrogen-bonding acidity. The results of the calculation are shown in Figure 3, together with the calculation results using the MLR model, adding the aA term with a being −1.271 (taken from Cycle-A). It is obvious in Figure 3 that the predicted values by MLR with aA term are all aligned along the diagonal line (plot A), because these compounds have essentially no hydrogen bonding acidity. The data points by the Cycle-A model are in general distributed above the diagonal line, except for several compounds at higher l o g 10 P l d p e / l i p i d values. The data points by Cycle-B model are in general distributed above the diagonal line as well, but no trending relationship with the MLR model can be observed. The data points by Cycle-C model are distributed essentially the same as that of Cycle-A, except that all predicted l o g 10 P l d p e / l i p i d values are higher than those predicted by the MLR model. If the highest predictive limit of l o g 10 P l d p e / l i p i d is the criterion of model acceptance, Cycle-C model is considered as the best. This point is discussed further in Section 4.5 using the measured LDPE extractables (Table S2).

4.2. Calculation of LDPE-Lipid and LDPE-Hexane Partition Constant Range for Collected LDPE Extractables

Based on the predictive models established in the section above (Table 1), the range of P l d p e / l i p i d can be determined for the collected LDPE extractables (Table S2). Figure 4 shows the results of the calculations and plots against l o g 10 P o / w values. Also included in the figure are the predicted P l d p e / h e x a n e values for the same LDPE extractables using two equations, one established in a previous publication [33], and the other one by a thermodynamic cycle between l o g 10 P l d p e / w a t e r and l o g 10 P h e x a n e / w a t e r (System L and M in Table 1), as discussed in Section 2.3. It is noted that the effect of LDPE swelling by hexane is absent in System M. It is seen in Figure 3 that the logarithm of P l d p e / l i p i d is trending towards a decrease with an increase in the l o g 10 P o / w by MLR and Cycle models (plot A, B, C and D). The extent of the decrease is strongly correlated with v constant. The more negative v constant in Cycle-B model (plot B), the sharper decrease with l o g 10 P o / w . However, the logarithm of P l d p e / h e x a n e shows an increasing trend with the l o g 10 P o / w with a LDPE swelling (plot E). If the effect of swelling by hexane on LDPE is not considered, P l d p e / h e x a n e decreases obviously with the l o g 10 P o / w (plot F).
As the representation of extractables physicochemical properties in this study needs to be l o g 10 P o / w , and there is not a direct thermodynamic relationship between l o g 10 P o / w and l o g 10 P l d p e / s [33], a simple empirical equation is used instead to quantitatively describe the relationship to enable the prediction of LDPE-solvent partition constant for LDPE extractables of different hydrophobicity. The (empirical) linear regression results and statistics between l o g 10 P l d p e / s (s = hexane or lipid) and l o g 10 P o / w are shown in Table 2. It is seen in the table that all intercepts and slopes are statistically significant, as all p-values are much smaller than 0.05. As expected, the SE is large and F-values are small (<100), because this is an empirical relationship. It is noted that the F-value by hexane without swelling is the largest. It is also worth noting in Figure 4 that the shaded area above and below the linear regression line bounded by the SE covers the range of P l d p e / l i p i d and P l d p e / h e x a n e values across the hydrophobicity range in each plot.

4.3. Dependence of l o g 10 P l d p e / l i p i d on l o g 10 P o / w for LDPE Extractables

It has been reported that l o g 10 P l d p e / l i p i d   could be linearly related to l o g 10 P o / w as follows [44,45]:
l o g 10 P l d p e / l i p i d = 1.17 + 0.056 · l o g 10 P o / w
Equation (11) was established with 16 compounds and the range of l o g 10 P o / w was from 0.5 to 18. The lipid was represented by olive oil. However, a different conclusion has been demonstrated in a recent study [47], and l o g 10 P l d p e / l i p i d has no relationship, or (weakly) negative relationship with l o g 10 P o / w .
The l o g 10 P l d p e / l i p i d data in Table S1 are linearly correlated with l o g 10 P o / w as well, and the results are tabulated in Table 1, as System C. It is seen in Table 1 that the slope of the regression is 0.005 with a p-value of >0.05, thereby indicating that a statistically significant relationship between l o g 10 P l d p e / l i p i d and l o g 10 P o / w cannot be established.
The regression results between l o g 10 P l d p e / l i p i d and l o g 10 P o / w for the observed LDPE extractables by the four models in Table 2 all indicate a small negative slope, with large SE and small F-values, which indicates that l o g 10 P l d p e / l i p i d   is weakly and negatively proportional to l o g 10 P o / w . However, l o g 10 P l d p e / h e x a n e shows a weakly and positively correlation with l o g 10 P o / w (System L). The slopes and intercepts of the four models are used to determine the upper limits of P l d p e / l i p i d in Section 4.5.
Overall, l o g 10 P l d p e / l i p i d is weakly and negatively dependent on l o g 10 P o / w by the compounds in Tables S1 and S2 with a large SE. The opposite is true for l o g 10 P l d p e / h e x a n e . The conclusions of this section have been reported for other solvents [22,23], as shown in Figure S4.

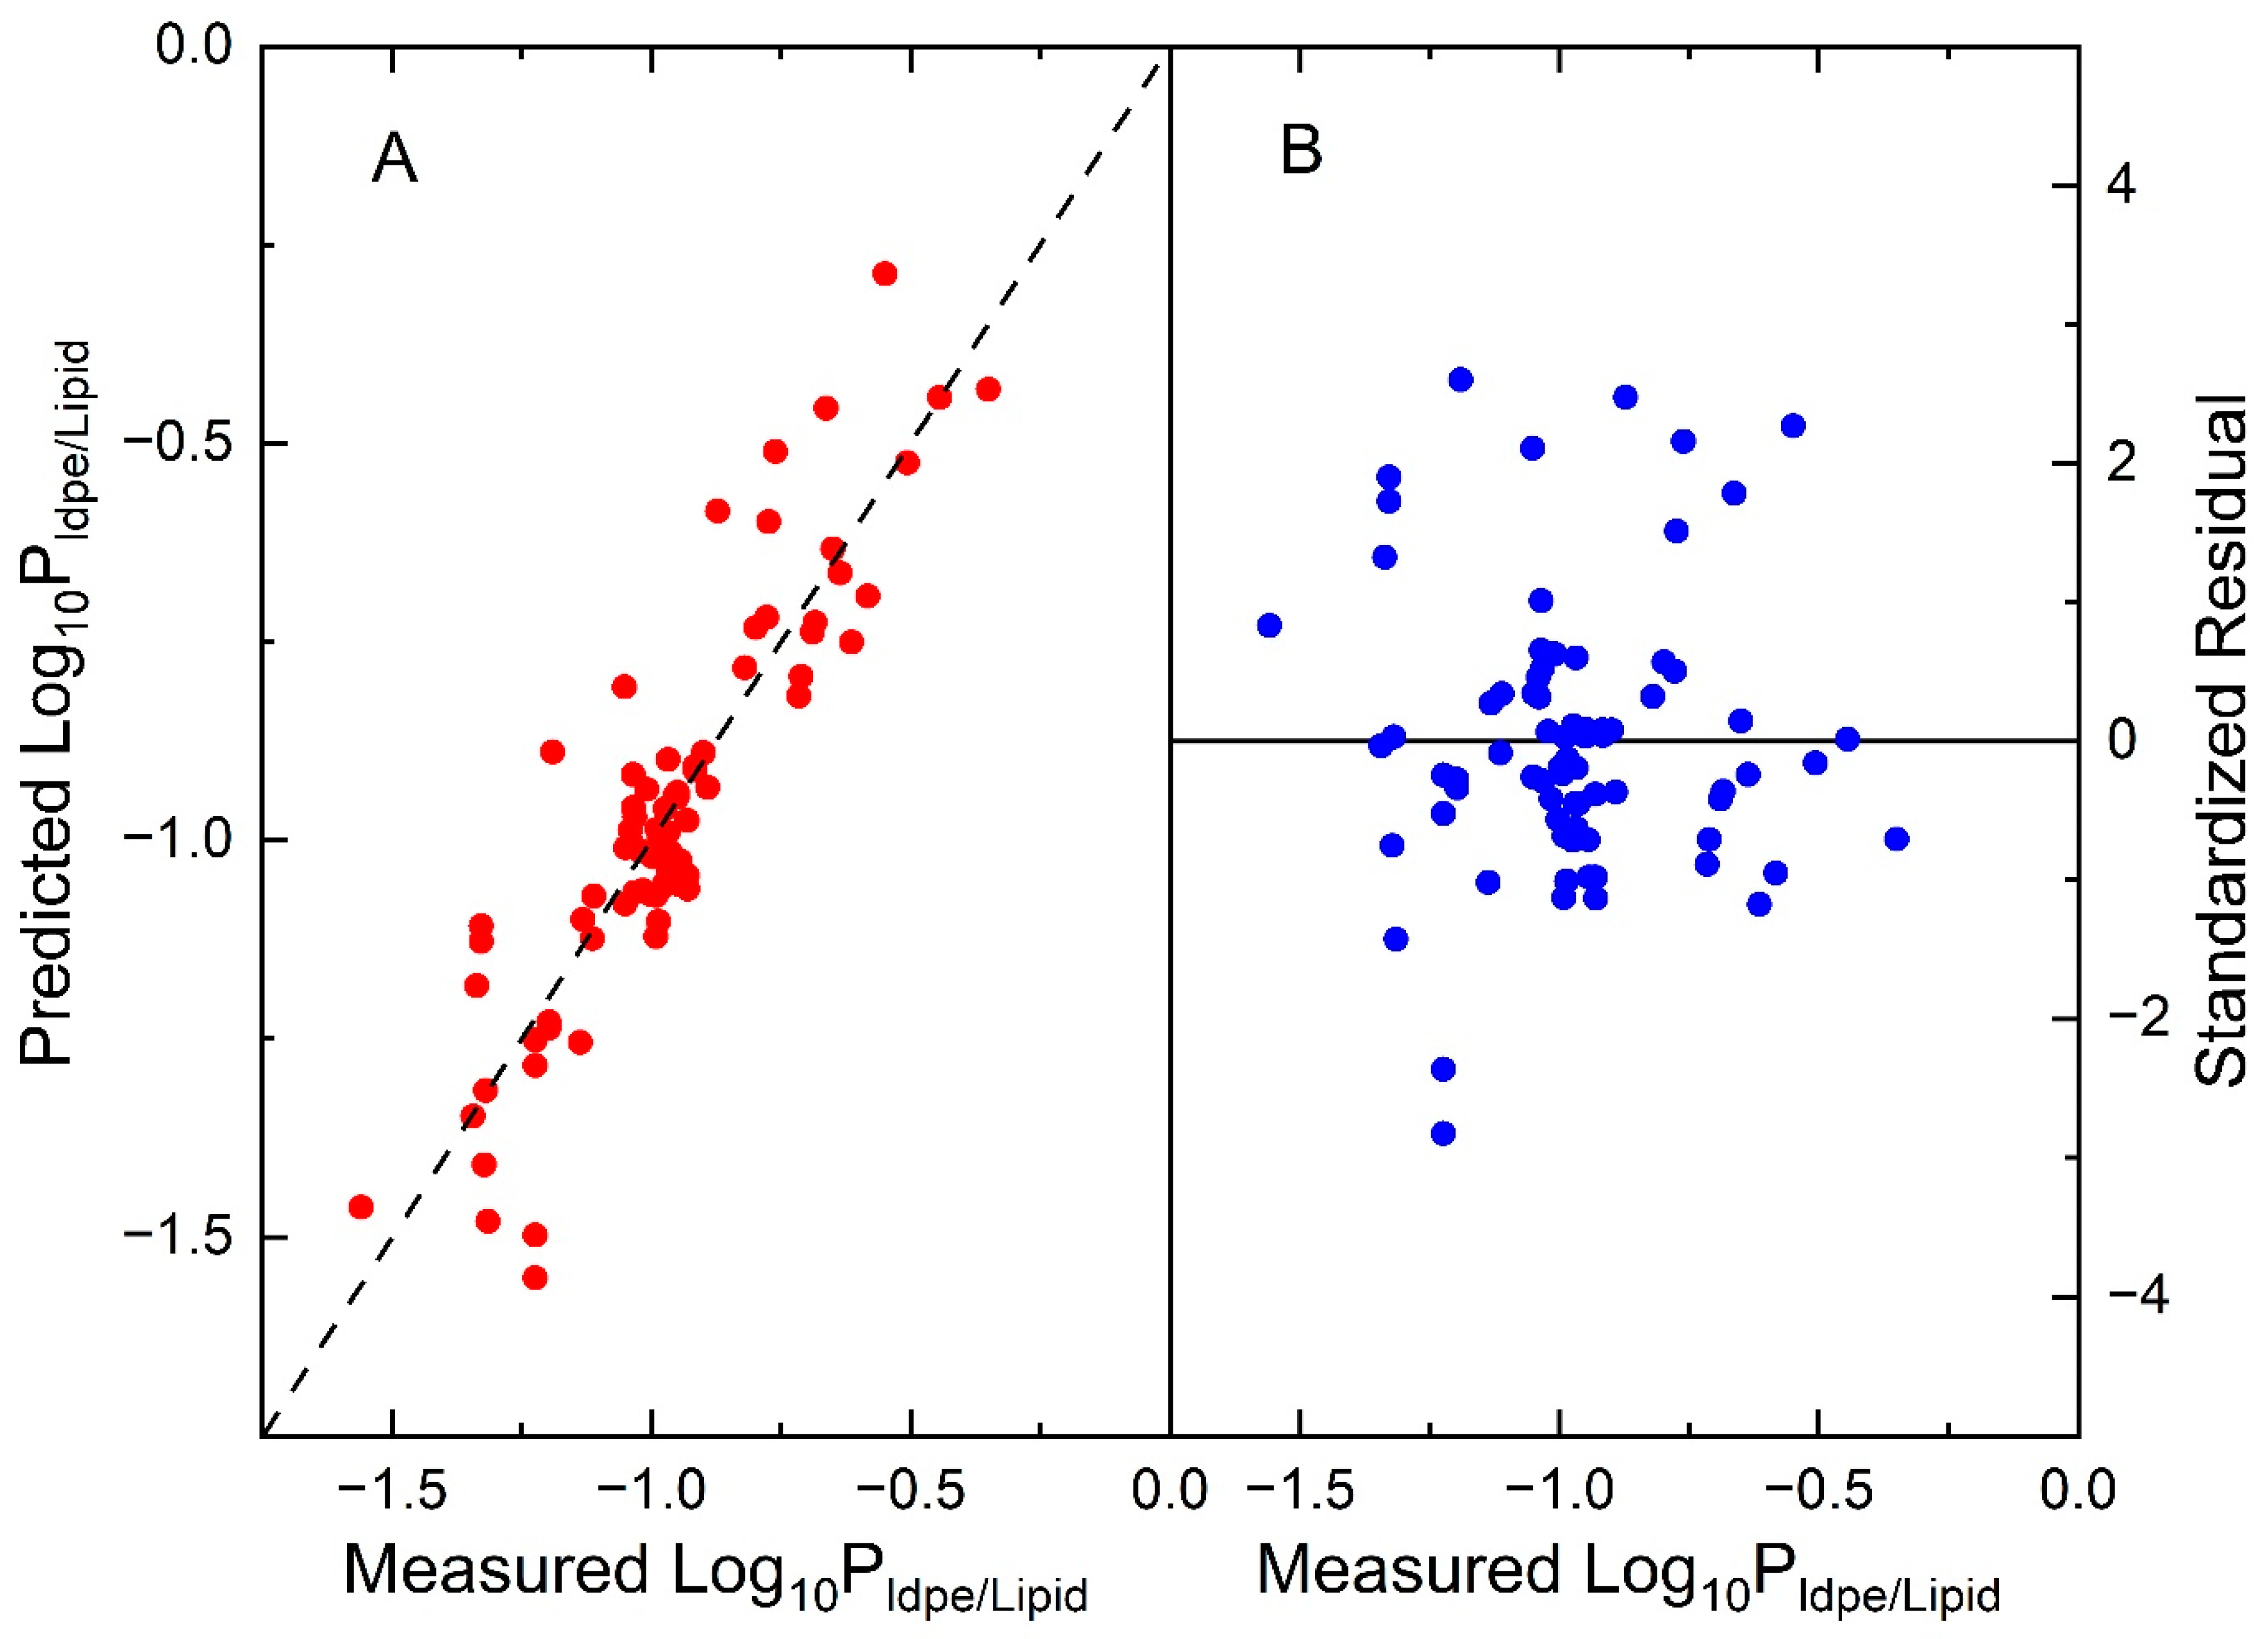
4.4. Model Validation

To confirm if the four models (MLR and Cycle-A to -C) are acceptable to predict l o g 10 P l d p e / l i p i d for the measured LDPE extractables, the ratio ( R h / l ) of P l d p e / h e x a n e and P l d p e / l i p i d are determined by l o g 10 P l d p e / h e x a n e and l o g 10 P l d p e / l i p i d using Equation (4), as discussed in Section 2.6. It is then plotted against l o g 10 P o / w , as suggested by Equation (5). If the P l d p e / h e x a n e and P l d p e / l i p i d were correct, the l o g 10 R h / l should be a linear relationship with l o g 10 P o / w , because it theoretically related to the same water phase by l o g 10 P l i p i d / w a t e r and l o g 10 P h e x a n e / w a t e r . The derivation of Equation (3) ( l o g 10 P l d p e / h e x a n e , System L in Table 1) was not based on water-related phase [33]. The MLR model is not based on a partition system involving water. Figure 5 plots the l o g 10 R h / l against l o g 10 P o / w by MLR and Cycle-A to -C (plots A, B, C and D) for the P l d p e / l i p i d , and Equation (3) as the l o g 10 P l d p e / h e x a n e (with swelling). Also included in Figure 5 are the plot (E and F) using System M (Table 1) to calculate l o g 10 P l d p e / h e x a n e (no swelling).
It can be seen in Figure 5 that there is an excellent linear relationship between l o g 10 R h / l and l o g 10 P o / w using Equation (3) to calculate l o g 10 P l d p e / h e x a n e ; however, no relationship is expected when System M (Table 1) is used to represent l o g 10 P l d p e / h e x a n e . The plots in Figure 5 clearly demonstrate the influence of LDPE swelling by hexane on the extractables distribution (System M is not discussed further). Furthermore, the data in plots A–D show no sign of curvatures. The data in plots A–D are linearly correlated and the results of correlation and descriptive statistics are shown in Table 2 as well. It can be seen in Table 2 that the intercepts and slopes are statistically significant. The SE is between 0.32–0.36, and F-values are all high. Overall, although the l o g 10 P l d p e / h e x a n e and l o g 10 P l d p e / l i p i d are not derived based on the same (water) phase (either both or one system), the excellent linear relationship still exists. This clearly indicates that the MLR and Cycle models (and Equation (3)) are all suitable for the prediction of l o g 10 P l d p e / h e x a n e and l o g 10 P l d p e / l i p i d of the observed LDPE extractables.

4.5. Comparison of MLR and Cycle Models in Predicting LDPE-Lipid Partition Constants for Observed LDPE Extractables

To further evaluate the similarities and differences among the four l o g 10 P l d p e / l i p i d models, the l o g 10 P l d p e / l i p i d values for the observed LDPE extractables (Table S2) are computed by each model. The predicted values by Cycle models are plotted against those by the MLR model in Figure 6. Also included in Figure 6 is a plot (A) by the calculated values with the same MLR model with an addition of the aA term (a = −1.271, same as in Figure 3). It is seen in Figure 6 (plot A) that some of the data points by the MLR model with the aA term are below the diagonal line, because this term is negative and decreases l o g 10 P l d p e / l i p i d values for solutes with a significant hydrogen- bond acidity, as expected. The data points predicted by the Cycle-A and Cycle-C models are in general distributed above the diagonal line, except for a few compounds below the line, and they are essentially the same. The prediction results by Cycle-B show lower results for alkane extractables due likely to the small negative a and positive b constant in the model. Thus, Cycle-A and C models generally predict higher values than those by the MLR model.
Finally, model Cycle-A and Cycle-C are used to predict the upper limits of LDPE-lipid partition constant in the following section.

4.6. Comparison of LDPE-Hexane and LDPE-Lipid Partition Constants for LDPE Extractables

The ranges and values of LDPE-hexane and LDPE-lipid partition constants are determined by the empirical regression coefficients in Table 2 (systems L, B, I, J, and K) using l o g 10 P o / w from zero to 30. The results of the calculation are tabulated in Table 3. The lower and upper bounds are also included using the SE value of each regression (95% confidence).
It can be seen in Table 3 that the range of P l d p e / h e x a n e predictive values is from 0.02 at l o g 10 P o / w = 0 to 1.50 at l o g 10 P o / w = 30 . The upper bound at the same hydrophobicity range is from 0.10 to 7.18. The range of P l d p e / l i p i d predictive values by Cycle-A model, for example, is from 0.0302 at l o g 10 P o / w = 0 to 0.0006 at l o g 10 P o / w = 30. This range of P l d p e / l i p i d values is considered small, thereby indicating that extractables distribution between LDPE and lipids are highly favorable towards the lipid phase, due to the lipid physicochemical properties, as discussed in Section 4.1.3.
It should be emphasized that the P l d p e / l i p i d values are in general small, and the exact values may not be as important as the upper bounds from a practical extraction perspective (see Equation (7)). That is why the upper bound of the P l d p e / l i p i d values are shown in Table 2, and why the four predictive models are compared in Figure 4 and Figure 6 to understand which one predicts the highest values and upper bounds. The range of the upper bound of P l d p e / l i p i d values by Cycle-A model is from 0.268 to 0.005 over the same hydrophobicity range. Additionally, the range of the upper bound of P l d p e / l i p i d values by Cycle-C model is from 0.272 to 0.01. Based on these values, Cycle-C model should be used to predict the P l d p e / l i p i d values, consistent with the conclusion in Section 4.1.
It is thus concluded that the assumption of P l d p e / s (s = lipids and hexane) is less than 1 or equal to 1 is not appropriate for hexane solvent when l o g 10 P o / w is greater than ~15. It is also noted that the predictive values of P l d p e / l i p i d in this section and the developed methods in this study can be critically important in environmental sampling. Additionally, the P l d p e / h e x a n e values derived in this study can be valuable in the prediction of extractables release [48].

4.7. Thermodynamic Contribution to Over-Extraction of LDPE by Hexane

Based on the ranges and values of P l d p e / h e x a n e and P l d p e / l i p i d from Section 4.6, the distribution of extractables between LDPE and hexane/lipids highly favor the solvent phase in general, except for the very hydrophobic solutes by hexane solvent. As illustrated in plot E of Figure 4, the P l d p e / h e x a n e values are overlapped nearly completely with the P l d p e / l i p i d values, when their l o g 10 P o / w values are less than about 6. The P l d p e / h e x a n e values are totally larger than P l d p e / l i p i d values, when l o g 10 P o / w is higher than ~15 (see also Table 3). It is therefore concluded that the extractables distribution between LDPE and solvents, hexane and lipids, are approximately the same and favors the solvent phase ( P l d p e / s < 1), when their l o g 10 P o / w values are less than about 6, after which the distribution to lipids are becoming more favorable thermodynamically than to hexane. Overall, the partitioning of LDPE extractables into lipids is the same as or more favorable than into hexane. This point can be further illustrated by calculating the amount extracted at equilibrium by both solvents using the data in Table 3 by Equation (7). For example, the upper limit of P l d p e / s value by hexane at l o g 10 P o / w = 15 is 0.85, while that of lipids is 0.052. The fractions extracted by hexane and lipids are 54% and 95%, respectively, assuming that the LDPE and solvent phase volumes are the same. The fractions extracted by hexane and lipids at l o g 10 P o / w = 30 are 12% and 99%, respectively, by the same calculation. Therefore, lipids are better extraction solvents than hexane from a thermodynamic consideration. The over-extraction by alkane solvents or any nonpolar organic solvents towards LDPE should not be the thermodynamic effect, but the kinetic effect, consistent with the previous assumption [20] and further supported by the discussion in Section 4.8.

4.8. Determination of Over-Extraction of LDPE by Hexane over Lipid

The thermodynamics of extractables distribution between LDPE and solvents is the focus up to this point. The contribution to over-extraction is concluded to be mainly the kinetic effect from LDPE to lipids relative to hexane. However, this effect is closely related to solvent-material interactions or swelling of material by alkanes and lipids [33,83].

4.8.1. Material-Solvent Interactions

During an extraction of materials with solvents, the polymer will swell to a certain extent, depending on the degree of polymer-solvent network interactions. The degree of swelling for LDPE by nonpolar solvents and lipids (or vegetable oils) are collected and tabulated in Table 4, together with the diffusion rates of solvents into materials. Also included in the table are the swelling data by alcohols and two more related materials (LLDPE and PP) for a comparison purpose. It can be seen in Table 4 that the degree of swelling of LDPE by alcohols (semipolar) is <2%, typically 10–30% by nonpolar solvents, and less than 3% by lipids/oils (at ambient temperature). The degree of material-solvent interactions and swelling strongly affect the effective diffusion coefficient of both extraction solvents and LDPE extractables, as interpretated by the free-volume theory [83]. Of course, the viscosity of the solvents also plays a role in the diffusion rate.
The solvent diffusion rates collected in Table 4 are plotted in Figure 7. It can be seen in the figure that the change in solvent diffusion rate by alkanes to lipids can be over a thousand-fold using the median values. The same range has been documented for larger MW extractables [20]. The increased diffusion rate of extractables by organic solvents relative to lipids can affect their release kinetics, as discussed in the next section.

4.8.2. Time-Dependent LDPE Extractables Release Profiles

To demonstrate the solvent effect in the release of LDPE extractables into lipids and alkane solvents, Figure 8, Figure 9 and Figure 10 show the extraction kinetics of butylated hydroxytoluene (BHT), n-octadecane, and n-dotriacontane, respectively [46]. Similar graphs by HDPE material are shown in Figures S1–S3.
It is seen in Figure 8 that the release of BHT is a diffusion-controlled process by all solvents, because an approximately linear relationship can be observed by the log-log scale [25,26]. The full extraction can be achieved by all solvents; however, the time to reach a full extraction is different. For example, it takes 0.4 day by heptane solvent, 40 days by ethanol/corn oil/trioctanoin, and nearly 400 days by water. Additionally, the release rate by ethanol, corn oil, and trioctanoin are essentially the same. This is the reason why ethanol (or 95% ethanol) is used in the food industries to simulate fats for polyolefin materials [13,15]. It is also the basis that Equation (8) is used to estimate the over estimation in this study.
Similar conclusions can be drawn for the extraction of n-octadecane (Figure 9) and n-dotriacontane (Figure 10). The release kinetics are becoming slower due to the increase in the MW from BHT to n-dotriacontane.
It is also pointed out from the three figures that the over-extraction should be the vertical distance between the release curves of heptane and lipids/oils/ethanol within their linear ranges.

4.8.3. Over-Extraction by Alkanes

The over-extraction data are compiled, as outlined in Section 3.10, and they are presented in Table S5. The data in Table S5 are plotted in Figure 11 as a histogram plot. It can be seen in Figure 11 that the median value of over-extraction is about 7-fold, and as high as 100-fold can be expected for high MW extractables. This is a result of a nearly 1000-fold increase in the corresponding diffusion coefficients of high MW extractables into alkane solvents relative to lipids [20].

5. Conclusions

The over-extraction of extractables from medical devices by nonpolar organic solvents relative to biological lipids are evaluated from both thermodynamic and kinetic perspectives, based on the Abraham solvation model and solvent-material interactions, using LDPE as representative material. Abraham solvation models are established by either MLR or thermodynamic cycle conversion to correlate the LDPE-lipid partition constant using the measured LDPE-lipid partition constants. The constructed models for l o g 10 P l d p e / l i p i d and l o g 10 P l d p e / h e x a n e are used to calculate and compare the ranges and values of P l d p e / s (s = lipids and hexane) for the observed LDPE extractables. The kinetic contributions to over-extraction are evaluated by the material swelling and solvent diffusion rate. It is concluded from the study that the kinetic effect, rather than the thermodynamic effect, is the main reason for the over-extraction. Finally, the extent of over-extraction can be up to over 100-fold with a median value of 7-fold.

Supplementary Materials

The following supporting information can be downloaded at: https://www.mdpi.com/article/10.3390/liquids4010006/s1. Figure S1: Time-Dependent BHT Release Profiles by Different Solvents from HDPE Material., Figure S2: Time-Dependent C18 Release Profiles by Different Solvents from HDPE Material., Figure S3: Time-Dependent C32 Release Profiles by Different Solvents from HDPE Material., Figure S4: Illustration of the Dependence of LDPE (or HDPE)-Solvent Partition Coefficient on l o g 10 P o / w of Extractables.; Table S1: Tabulation of Analytes with Measured Partition coefficients (P_(ldpe/lipid)) and Their Physicochemical Properties., Table S2: Tabulates the collected LDPE extractables and their physicochemical properties by organic solvent extractions., Table S3: Correlation Matrix of Descriptors of Solutes with Measured P l d p e / l i p i d , Table S4: Correlation Matrix of Observed LDPE Extractables Descriptors., Table S5: Tabulates the over extraction data, compiled from literatures.

Funding

This research received no external funding.

Data Availability Statement

Data are contained within the article and Supplementary Materials.

Conflicts of Interest

The Author Jianwei Li was employed by the company Chemical Characterization Solutions. The author declares that the research was conducted in the absence of any commercial or financial relationships that could be construed as a potential conflict of interest. The funders had no role in the design of the study; in the collection, analyses, or interpretation of data; in the writing of the manuscript; or in the decision to publish the results.

References

  1. Reeve, L.; Baldrick, P. Biocompatibility assessments for medical devices—Evolving regulatory considerations. Expert Rev. Med. Devices 2017, 14, 161–167. [Google Scholar] [CrossRef] [PubMed]
  2. Cuadros-Rodríguez, L.; Lazúen-Muros, M.; Ruiz-Samblás, C.; Navas-Iglesias, N. Leachables from plastic materials in contact with drugs. State of the art and review of current analytical approaches. Int. J. Pharm. 2020, 583, 119332. [Google Scholar] [CrossRef] [PubMed]
  3. ISO10993-18:2020; Biological Evaluation of Medical Devices—Part 18: Chemical Characterization of Medical Device Materials within a Risk Management Process. Available online: https://www.iso.org/standard/64750.html (accessed on 27 November 2023).
  4. Kiradzhiyska, D.D.; Mantcheva, R.D. Overview of Biocompatible Materials and Their Use in Medicine. Folia Med. 2019, 61, 34–40. [Google Scholar] [CrossRef] [PubMed]
  5. Marturano, V.; Cerruti, P.; Ambrogi, V. Polymer additives. Phys. Sci. Rev. 2017, 2, 20160130. [Google Scholar] [CrossRef]
  6. Li, B.J. Exploring three-dimensional space of extractables and leachables in volatility, hydrophobicity, and molecular weight and assessment of roles of gas and liquid chromatographic methods in their comprehensive analysis. J. Pharm. Biomed. Anal. 2023, 223, 115142. [Google Scholar] [CrossRef] [PubMed]
  7. Geueke, B.; Groh, K.J.; Maffini, M.V.; Martin, O.V.; Boucher, J.M.; Chiang, Y.-T.; Gwosdz, F.; Jieh, P.; Kassotis, C.D.; Łańska, P.; et al. Systematic evidence on migrating and extractable food contact chemicals: Most chemicals detected in food contact materials are not listed for use. Crit. Rev. Food Sci. Nutr. 2022, 63, 9425–9435. [Google Scholar] [CrossRef] [PubMed]
  8. Finley, J.W.; deMan, J.M. Lipids. In Principles of Food Chemistry; Food Science Text Series; Springer: Cham, Switzerland, 2018. [Google Scholar] [CrossRef]
  9. Reis, A.; Rudnitskaya, A.; Blackburn, G.J.; Fauzi, N.M.; Pitt, A.R.; Spickett, C.M. A comparison of five lipid extraction solvent systems for lipidomic studies of human LDL. J. Lipid Res. 2013, 54, 1812–1824. [Google Scholar] [CrossRef] [PubMed]
  10. Muncke, J. Hazards of Food Contact Material: Food Packaging Contaminants. In Encyclopedia of Food Safety; Motarjemi, Y., Ed.; Academic Press: Cambridge, MA, USA, 2014; pp. 430–437. [Google Scholar] [CrossRef]
  11. Bhunia, K.; Sablani, S.S.; Tang, J.; Rasco, B. Migration of Chemical Compounds from Packaging Polymers during Microwave, Conventional Heat Treatment, and Storage. Compr. Rev. Food Sci. Food Saf. 2013, 12, 523–545. [Google Scholar] [CrossRef]
  12. Gavriil, G.; Kanavouras, A.; Coutelieris, F.A. Food-packaging migration models: A critical discussion. Crit. Rev. Food Sci. Nutr. 2018, 58, 2262–2272. [Google Scholar] [CrossRef]
  13. de Kruijf, N.; Rijk, R. The suitability of alternative fatty food simulants for overall migration testing under both low- and high-temperature test conditions. Food Addit. Contam. 1997, 14, 775–789. [Google Scholar] [CrossRef]
  14. Baner, A.; Bieber, W.; Figge, K.; Franz, R.; Piringer, O. Alternative fatty food simulants for migration testing of polymeric food contact materials. Food Addit. Contam. 1992, 9, 137–148. [Google Scholar] [CrossRef] [PubMed]
  15. Cooper, I.; Goodson, A.; O’Brien, A. Specific migration testing with alternative fatty food simulants. Food Addit. Contam. 1998, 15, 72–78. [Google Scholar] [CrossRef] [PubMed]
  16. De Kruijf, N.; Rijk, M.A.H. Iso-octane as fatty food simulant: Possibilities and limitations. Food Addit. Contam. 1988, 5, 467–483. [Google Scholar] [CrossRef]
  17. Guidance for Industry: Preparation of Premarket Submissions for Food Contact Substances (Chemistry Recommendations). Available online: https://www.fda.gov/regulatory-information/search-fda-guidance-documents/guidance-industry-preparation-premarket-submissions-food-contact-substances-chemistry (accessed on 27 November 2023).
  18. Fahy, E.; Subramaniam, S.; Brown, H.A.; Glass, C.K.; Merrill, A.H., Jr.; Murphy, R.C.; Raetz, C.R.H.; Russell, D.W.; Seyama, Y.; Shaw, W.; et al. A comprehensive classification system for lipids. J. Lipid Res. 2005, 46, 839–861. [Google Scholar] [CrossRef] [PubMed]
  19. ISO 10993-12:2021; Biological Evaluation of Medical Devices—Part 12: Sample Preparation and Reference Materials. Available online: https://www.iso.org/standard/75769.html (accessed on 7 January 2023).
  20. Chang, S.-S.; Pummer, W.J.; Maurey, J.R. Fat-simulating and accelerating solvents for polyolefins and MWD of solvent extracts of polyethylenes. Polymer 1983, 24, 1267–1272. [Google Scholar] [CrossRef]
  21. Limm, W.; Hollifield, H.C. Modelling of additive diffusion in polyolefins. Food Addit. Contam. 1996, 13, 949–967. [Google Scholar] [CrossRef] [PubMed]
  22. Koszinowski, J. Diffusion and solubility of n-alkanes in polyolefines. J. Appl. Polym. Sci. 1986, 32, 4765–4786. [Google Scholar] [CrossRef]
  23. Koszinowski, J. Diffusion and Solubility of Hydroxy Compounds in Polyolefines. J. Appl. Polym. Sci. 1986, 31, 2711–2720. [Google Scholar] [CrossRef]
  24. Poças, M.F.; Oliveira, J.C.; Oliveira, F.A.R.; Hogg, T. A critical survey of predictive mathematical models for migration from packaging. Crit. Rev. Food Sci. Nutr. 2008, 48, 913–928. [Google Scholar] [CrossRef] [PubMed]
  25. Wan, J.A.L.; Chatwin, P.C.; Katan, L.L. Migration from plastic packages into their contents. I. The role of mathematical models. Philos. Trans. R. Soc. Lond. Ser. A Phys. Eng. Sci. 1995, 350, 379–406. [Google Scholar] [CrossRef]
  26. Chatwin, P.C.; Katan, L.L. The role of mathematics and physics in migration predictions. Packag. Technol. Sci. Int. J. 1989, 2, 75–84. [Google Scholar] [CrossRef]
  27. Franz, R.; Stormer, A. Migration of Plastic Constituents. In Plastic Packaging—Interactions with Food and Pharmaceuticals, 2nd ed.; Piringer, O.G., Baner, A.L., Eds.; WILEY-VCH Verlag GmbH & Co. KGaA: Weinheim, Germany, 2008; Chapter 11; pp. 349–415. ISBN 978-3-527-31455-3. [Google Scholar]
  28. Franz, R. Migration of plastic constituents. In Plastic Packaging Materials for Food, Barrier Function, Mass Transport, Quality Assurance, and Legislation; Piringer, O.G., Baner, A.L., Eds.; WILEY-VCH: Weinheim, Germany, 2000; Chapter 10; pp. 287–357. [Google Scholar]
  29. Baner, A.L. Partition constant. In Plastic Packaging Materials for Food, Barrier Function, Mass Transport, Quality Assurance, and Legislation; Piringer, O.G., Baner, A.L., Eds.; WILEY-VCH: Weinheim, Germany, 2000; Chapter 4; pp. 78–123. [Google Scholar]
  30. Piringer, O.G.; Baner, A.L. Appendix II. In Plastic Packaging—Interactions with Food and Pharmaceuticals, 2nd ed.; WILEY-VCH Verlag GmbH & Co. KGaA: Weinheim, Germany, 2008; pp. 558–590. ISBN 978-3-527-31455-3. [Google Scholar]
  31. Piringer, O. Mathematical modeling of chemical migration from food contact materials. In Chemical Migration and Food Contact Materials; Barnes, K.A., Sinclair, C.R., Watson, D.H., Eds.; Woodhead: Cambridge, UK, 2007; pp. 180–202. [Google Scholar]
  32. Helmroth, E.; Rijk, R.; Dekker, M.; Jongen, W. Predictive modelling of migration from packaging materials into food products for regulatory purposes. Trends Food Sci. Technol. 2002, 13, 102–109. [Google Scholar] [CrossRef]
  33. Li, B.J. Correlation of Extractables Transfer from Low-Density Polyethylene into Extraction Solvents with Abraham Solvation Parameter Model and Assessment of Thermodynamic and Kinetic Effects in Achieving Exhaustive Extractions in Chemical Characterization of Medical Devices. J. Solut. Chem. 2023, 52, 967–1000. [Google Scholar] [CrossRef]
  34. Figge, K. Migration of additives from plastics films into edible oils and fat simulants. Food Cosmet. Toxicol. 1972, 10, 815–828. [Google Scholar] [CrossRef] [PubMed]
  35. Gramiccioni, L.; Di Prospero, P.; Milana, M.; Di Marzio, S.; Marcello, I. Global migration from plastic materials into olive oil and isooctane: An experimental comparison. Food Chem. Toxicol. 1986, 24, 23–26. [Google Scholar] [CrossRef] [PubMed]
  36. Garde, J.A.; Catalá, R.; Gavara, R.; Garde, R.C.J.A. Global and specific migration of antioxidants from polypropylene films into food simulants. J. Food Prot. 1998, 61, 1000–1006. [Google Scholar] [CrossRef] [PubMed]
  37. Hamdani, M.; Feigenbaum, A. Migration from plasticized poly(vinyl chloride) into fatty media: Importance of simulant selectivity for the choice of volatile fatty simulants. Food Addit. Contam. 1996, 13, 717–729. [Google Scholar] [CrossRef]
  38. Monteiro, M.; Nerín, C.; Reyes, F. Migration of Tinuvin P, a UV stabilizer, from PET bottles into fatty-food simulants. Packag. Technol. Sci. Int. J. 1999, 12, 241–248. [Google Scholar] [CrossRef]
  39. Reynier, A.; Dole, P.; Feigenbaum, A. Integrated approach of migration prediction using numerical modelling associated to experimental determination of key parameters. Food Addit. Contam. 2002, 19, 42–55. [Google Scholar] [CrossRef]
  40. Helmroth, I.E.; Dekker, M.; Hankemeier, T. Influence of solvent absorption on the migration of Irganox 1076 from LDPE. Food Addit. Contam. 2002, 19, 176–183. [Google Scholar] [CrossRef]
  41. Beldì, G.; Pastorelli, S.; Franchini, F.; Simoneau, C. Time- and temperature-dependent migration studies of Irganox 1076 from plastics into foods and food simulants. Food Addit. Contam. Part A Chem. Anal. Control Expo. Risk Assess. 2012, 29, 836–845. [Google Scholar] [CrossRef] [PubMed]
  42. Hernandez-Muñoz, P.; Catalá, R.; Gavara, R. Food aroma partition between packaging materials and fatty food simulants. Food Addit. Contam. 2001, 18, 673–682. [Google Scholar] [CrossRef] [PubMed]
  43. Paseiro-Cerrato, R.; Tongchat, C.; Franz, R. Study of the partition coefficients Kp/f of seven model migrants from LDPE polymer in contact with food simulants. Food Addit. Contam. Part A Chem. Anal. Control Expo. Risk Assess. 2016, 33, 885–892. [Google Scholar] [CrossRef] [PubMed]
  44. Seiler, A.; Bach, A.; Driffield, M.; Losada, P.P.; Mercea, P.; Tosa, V.; Franz, R. Correlation of foodstuffs with ethanol–water mixtures with regard to the solubility of migrants from food contact materials. Food Addit. Contam. Part A 2014, 31, 498–511. [Google Scholar] [CrossRef]
  45. Correlation of Partition Constants KPolymer/Food and KOctanol/Water for Potential Migrants in Food Contact Polymers. Available online: https://www.ivv.fraunhofer.de/content/dam/ivv/en/documents/Forschungsfelder/Produktsicherheit-und-analytik/Correlation_of_partition_coefficients.pdf (accessed on 27 November 2023).
  46. Migration of Low Molecular Weight Additives in Polyolefins and Copolymers, National Bureau of Standards (NBS), Final Project Report, NBSIR 82-2472. 1982. Available online: https://nvlpubs.nist.gov/nistpubs/Legacy/IR/nbsir82-2472.pdf (accessed on 27 November 2023).
  47. Smedes, F.; Rusina, T.P.; Beeltje, H.; Mayer, P. Partitioning of hydrophobic organic contaminants between polymer and lipids for two silicones and low density polyethylene. Chemosphere 2017, 186, 948–957. [Google Scholar] [CrossRef] [PubMed]
  48. Turner, P.; Elder, R.M.; Nahan, K.; Talley, A.; Shah, S.; Duncan, T.V.; Sussman, E.M.; Saylor, D.M. Leveraging Extraction Testing to Predict Patient Exposure to Polymeric Medical Device Leachables Using Physics-based Models. Toxicol. Sci. 2020, 178, 201–211. [Google Scholar] [CrossRef] [PubMed]
  49. Begley, T.; Castle, L.; Feigenbaum, A.; Franz, R.; Hinrichs, K.; Lickly, T.; Mercea, P.; Milana, M.; O’brien, A.; Rebre, S.; et al. Evaluation of migration models that might be used in support of regulations for food-contact plastics. Food Addit. Contam. 2005, 22, 73–90. [Google Scholar] [CrossRef] [PubMed]
  50. Jahnke, A.; McLachlan, M.S.; Mayer, P. Equilibrium sampling: Partitioning of organochlorine compounds from lipids into polydimethylsiloxane. Chemosphere 2008, 73, 1575–1581. [Google Scholar] [CrossRef]
  51. Geisler, A.; Endo, S.; Goss, K.-U. Partitioning of organic chemicals to storage lipids: Elucidating the dependence on fatty acid composition and temperature. Environ. Sci. Technol. 2012, 46, 9519–9524. [Google Scholar] [CrossRef]
  52. Rusina, T.P.; Smedes, F.; Klanova, J.; Booij, K.; Holoubek, I. Polymer selection for passive sampling: A comparison of critical properties. Chemosphere 2007, 68, 1344–1351. [Google Scholar] [CrossRef]
  53. Paxton, N.C.; Allenby, M.C.; Lewis, P.M.; Woodruff, M.A. Biomedical applications of polyethylene. Eur. Polym. J. 2019, 118, 412–428. [Google Scholar] [CrossRef]
  54. Lohmann, R. Critical Review of Low-Density Polyethylene’s Partitioning and Diffusion Coefficients for Trace Organic Contaminants and Implications for Its Use As a Passive Sampler. Environ. Sci. Technol. 2012, 46, 606–618. [Google Scholar] [CrossRef] [PubMed]
  55. Ulrich, N.; Böhme, A.; Strobel, A.B.; Egert, T. Predicting partitioning from low density polyethylene to blood and adipose tissue by linear solvation energy relationship models. J. Biomed. Mater. Res. B Appl. Biomater. 2023, 111, 2044–2054. [Google Scholar] [CrossRef] [PubMed]
  56. Egert, T.; Langowski, H.C. Linear solvation energy relationships (LSERs) for robust prediction of partition coefficients between low density polyethylene and water. Part II: Model evaluation and benchmarking. Eur. J. Pharm. Sci. 2022, 172, 106138. [Google Scholar] [CrossRef] [PubMed]
  57. Poole, C.F. Solvation parameter model: Tutorial on its application to separation systems for neutral compounds. J. Chromatogr. A 2021, 1645, 462108. [Google Scholar] [CrossRef] [PubMed]
  58. Poole, C.F. Partition constant database for totally organic biphasic systems. J. Chromatogr. A 2017, 1527, 18–32. [Google Scholar] [CrossRef]
  59. Abraham, M.H.; Acree, W.E., Jr. Descriptors for the Prediction of Partition Coefficients and Solubilities of Organophosphorus Compounds. Sep. Sci. Technol. 2013, 48, 884–897. [Google Scholar] [CrossRef]
  60. Jouyban, A.; Acree WMichael, H. Abraham and His Developed Parameters: Various Applications in Medicine, Chemistry and Biology. Pharm. Sci. 2022, 28, 170–173. [Google Scholar] [CrossRef]
  61. Khawar, M.I.; Nabi, D. Relook on the Linear Free Energy Relationships Describing the Partitioning Behavior of Diverse Chemicals for Polyethylene Water Passive Samplers. ACS Omega 2021, 6, 5221–5232. [Google Scholar] [CrossRef]
  62. Liu, Z.; Sun, X.; Xu, Y. Recalibrating polyparameter linear free energy relationships and reanalyzing mechanisms for partition of nonionic organic compounds to low-density polyethylene passive sampler. J. Chromatogr. A 2023, 1700, 464039. [Google Scholar] [CrossRef]
  63. Abraham, M.H.; Chadha, H.S.; Whiting, G.S.; Mitchell, R.C. Hydrogen bonding. 32. An analysis of water-octanol and water-alkane partitioning and the Δlog P parameter of seiler. J. Pharm. Sci. 1994, 83, 1085–1100. [Google Scholar] [CrossRef] [PubMed]
  64. Lickly, T.D.; Bell, C.D.; Lehr, K.M. The migration of Irganox 1010 antioxidant from high-density polyethylene and polypropylene into a series of potential fatty-food simulants. Food Addit. Contam. 1990, 7, 805–814. [Google Scholar] [CrossRef] [PubMed]
  65. Garde, J.A.; Catalá, R.; Gavara, R.; Hernandez, R.J. Characterizing the migration of antioxidants from polypropylene into fatty food simulants. Food Addit. Contam. 2001, 18, 750–762. [Google Scholar] [CrossRef] [PubMed]
  66. Li, B. Determination of the mass transport properties of chemical additives in polypropylene material/simulated food system. Food Addit. Contam. Part A 2019, 36, 625–637. [Google Scholar] [CrossRef] [PubMed]
  67. Zhu, T.; Jafvert, C.T.; Fu, D.; Hu, Y. A novel method for measuring polymer–water partition coefficients. Chemosphere 2015, 138, 973–979. [Google Scholar] [CrossRef] [PubMed]
  68. Booij, K.; Hofmans, H.E.; Fischer, C.V.; Van Weerlee, E.M. Temperature-dependent uptake rates of nonpolar organic compounds by semipermeable membrane devices and low-density polyethylene membranes. Environ. Sci. Technol. 2003, 37, 361–366. [Google Scholar] [CrossRef] [PubMed]
  69. Zhang, K.; Fahr, A.; Abraham, M.H.; Acree, W.E., Jr.; Tobin, D.J.; Liu, X. Comparison of lipid membrane–water partitioning with various organic solvent–water partitions of neutral species and ionic species: Uniqueness of cerasome as a model for the stratum corneum in partition processes. Int. J. Pharm. 2015, 494, 1–8. [Google Scholar] [CrossRef] [PubMed]
  70. Cao, Y.; Marra, M.; Anderson, B.D. Predictive relationships for the effects of triglyceride ester concentration and water uptake on solubility and partitioning of small molecules into lipid vehicles. J. Pharm. Sci. 2004, 93, 2768–2779. [Google Scholar] [CrossRef]
  71. Allan, I.J.; Vrana, B.; Ruus, A. Passive Sampling Helps the Appraisal of Contaminant Bioaccumulation in Norwegian Fish Used for Regulatory Chemical Monitoring. Environ. Sci. Technol. 2022, 56, 7945–7953. [Google Scholar] [CrossRef]
  72. Gargas, M.L.; Burgess, R.J.; Voisard, D.E.; Cason, G.H.; Andersen, M.E. Partition coefficients of low-molecular-weight volatile chemicals in various liquids and tissues. Toxicol. Appl. Pharmacol. 1989, 98, 87–99. [Google Scholar] [CrossRef]
  73. Ruus, A.; Allan, I.J.; Bæk, K.; Borgå, K. Partitioning of persistent hydrophobic contaminants to different storage lipid classes. Chemosphere 2021, 263, 127890. [Google Scholar] [CrossRef] [PubMed]
  74. Alan, D. Hendricker, Controlled Extraction Study on Low Density Polyethylene (LDPE). 2015. Available online: https://pqri.org/wp-content/uploads/2015/11/LDPE_Poster.pdf (accessed on 27 November 2023).
  75. Cozzi, A.C.; Briasco, B.; Salvarani, E.; Mannucci, B.; Fangarezzi, F.; Perugini, P. Evaluation of Mechanical Properties and Volatile Organic Extractable to Investigate LLDPE and LDPE Polymers on Final Packaging for Semisolid Formulation. Pharmaceutics 2018, 10, 113. [Google Scholar] [CrossRef] [PubMed]
  76. Jenke, D.; Castner, J.; Egert, T.; Feinberg, T.; Hendricker, A.; Houston, C.; Hunt, D.G.; Lynch, M.; Shaw, A.; Nicholas, K.; et al. Extractables characterization for five materials of construction representative of packaging systems used for parenteral and ophthalmic drug products. PDA J. Pharm. Sci. Technol. 2013, 67, 448–511. [Google Scholar] [CrossRef] [PubMed]
  77. Vera, P.; Canellas, E.; Barknowitz, G.; Goshawk, J.; Nerín, C. Ion-Mobility Quadrupole Time-of-Flight Mass Spectrometry: A Novel Technique Applied to Migration of Nonintentionally Added Substances from Polyethylene Films Intended for Use as Food Packaging. Anal. Chem. 2019, 91, 12741–12751. [Google Scholar] [CrossRef] [PubMed]
  78. Schwope, A.; Till, D.; Ehntholt, D.; Sidman, K.; Whelan, R.; Schwartz, P.; Reid, R. Migration of BHT and Irganox 1010 from low-density polyethylene (LDPE) to foods and food-simulating liquids. Food Chem. Toxicol. 1987, 25, 317–326. [Google Scholar] [CrossRef]
  79. Chapke, K.; Gandhi, K.; Lata, K.; Sharma, R.; Mann, B.; Singh, N. Migration study of chemical additives from low density polyethylene (LDPE) into dahi. J. Food Sci. Technol. 2022, 59, 3283–3295. [Google Scholar] [CrossRef] [PubMed]
  80. Wessling, C.; Nielsen, T.; Leufvén, A.; Jägerstad, M. Mobility of α-tocopherol and BHT in LDPE in contact with fatty food simulants. Food Addit. Contam. 1998, 15, 709–715. [Google Scholar] [CrossRef] [PubMed]
  81. RMG: Group Contribution Method for Abraham Solute Parameter Prediction. Available online: https://rmg.mit.edu/database/solvation/search/ (accessed on 27 November 2023).
  82. Poole, C.F. Wayne State University experimental descriptor database for use with the solvation parameter model. J. Chromatogr. A 2020, 1617, 460841. [Google Scholar] [CrossRef]
  83. Li, J.; Sobańtka, A. A Systematic Analysis of the Effect of Extraction Solvents on the Chemical Composition of Extraction Solutions and the Analytical Implications in Extractables and Leachables Studies. J. Pharm. Biomed. Anal. 2023, 222, 115081. [Google Scholar] [CrossRef]
  84. Igwe, I.O. Uptake of aromatic solvents by polyethylene films. J. Appl. Polym. Sci. 2007, 104, 3849–3854. [Google Scholar] [CrossRef]
  85. Riquet, A.-M.; Scholler, D.; Feigenbaum, A. Tailoring fatty food simulants made from solvent mixtures (2): Determining the equivalent migration behaviour of olive oil and of solvents in the case of polyolefins. Food Addit. Contam. 2002, 19, 582–593. [Google Scholar] [CrossRef] [PubMed]
  86. Fava, L.P.P. Study of diffusion through LDPE film of Di-n-butyl phthalate. Food Addit. Contam. 1999, 16, 353–359. [Google Scholar] [CrossRef] [PubMed]
  87. Hedenqvist, M.; Gedde, U. Parameters affecting the determination of transport kinetics data in highly swelling polymers above Tg. Polymer 1999, 40, 2381–2393. [Google Scholar] [CrossRef]
  88. Harding, S.G.; Johns, M.L.; Pugh, S.R.; Fryer, P.J.; Gladden, L.F. Magnetic resonance imaging studies of diffusion in polymers. Food Addit. Contam. 1997, 14, 583–589. [Google Scholar] [CrossRef] [PubMed]
  89. Riquet, A.M.; Wolff, N.; Laoubi, S.; Vergnaud, J.M.; Feigenbaum, A. Food and packaging interactions: Determination of the kinetic parameters of olive oil diffusion in polypropylene using concentration profiles. Food Addit. Contam. 1998, 15, 690–700. [Google Scholar] [CrossRef] [PubMed]
  90. Nasiri, A.; Peyron, S.; Gastaldi, E.; Gontard, N. Effect of nanoclay on the transfer properties of immanent additives in food packages. J. Mater. Sci. 2016, 51, 9732–9748. [Google Scholar] [CrossRef]
  91. Rusina, T.P.; Smedes, F.; Klanova, J. Diffusion Coefficients of Polychlorinated Biphenyls and Polycyclic Aromatic Hydrocarbons in Polydimethylsiloxane and Low-Density Polyethylene Polymers. J. Appl. Polym. Sci. 2010, 116, 1803–1810. [Google Scholar] [CrossRef]
  92. Randová, A.; Bartovská, L.; Hovorka, Š.; Bartovský, T.; Izák, P.; Poloncarzová, M.; Fries, K. Diffusion coefficients in systems LDPE+cyclohexane and LDPE+benzene. e-Polymers 2010, 10, 742–747. [Google Scholar] [CrossRef]
  93. Mauricio-Iglesias, M.; Guillard, V.; Gontard, N.; Peyron, S. Application of FTIR and Raman microspectroscopy to the study of food/packaging interactions. Food Addit. Contam. Part A Chem. Anal. Control Expo. Risk Assess. 2009, 26, 1515–1523. [Google Scholar] [CrossRef]
  94. Helmroth, I.E.; Dekker, M.; Hankemeier, T. Additive Diffusion from LDPE Slabs into Contacting Solvents as a Function of Solvent Absorption. J. Appl. Polym. Sci. 2003, 90, 1609–1617. [Google Scholar] [CrossRef]
  95. Ibarra, V.G.; Sendón, R.; García-Fonte, X.; Losada, P.P.; de Quirós, A.R.B. Migration studies of butylated hydroxytoluene, tributyl acetylcitrate and dibutyl phthalate into food simulants. J. Sci. Food Agric. 2019, 99, 1586–1595. [Google Scholar] [CrossRef] [PubMed]
  96. de Kruijf, N.; Rijk, M.; Soetardhi, L.; Rossi, L. Selection and application of a new volatile solvent as a fatty food simulant for determining the global migration of constituents of plastics materials. Food Chem. Toxicol. 1983, 21, 187–191. [Google Scholar] [CrossRef] [PubMed]
  97. Hernández-Muñoz, P.; Catalá, R.; Gavara, R. Simple method for the selection of the appropriate food simulant for the evaluation of a specific food/packaging interaction. Food Addit. Contam. 2002, 19, 192–200. [Google Scholar] [CrossRef] [PubMed]
  98. Kirchkeszner, C.; Petrovics, N.; Tábi, T.; Magyar, N.; Kovács, J.; Szabó, B.S.; Nyiri, Z.; Eke, Z. Swelling as a promoter of migration of plastic additives in the interaction of fatty food simulants with polylactic acid- and polypropylene-based plastics. Food Control 2022, 132, 108354. [Google Scholar] [CrossRef]
Figure 1. Illustration of Abraham solute descriptors for three sets of compounds by box-overlap graph: WSUD: Wayne state university database [82]; compounds with measured l o g 10 P l d p e / l i p i d [47]; observed LDPE extractables (Section 3.2). The descriptors of WSUD are measured values; while those of measured solutes and observed LDPE extractables are computed by an online program: RMG [81]. The solid black horizontal line in each distribution is the median value. The inserted graph on top is the distribution of the measured l o g 10 P l d p e / l i p i d values for 78 compounds.
Liquids 04 00006 g001
Figure 2. Illustration of the correlation results by the solvation model for the measured compounds [47]. Plot (A): plot of the predicted LDPE-lipid partition constants ( l o g 10 P l d p e / l i p i d ) against the measured values. Plot (B): the standardized residual distribution.
Liquids 04 00006 g002
Figure 3. Comparison of predicted l o g 10 P l d p e / l i p i d values for the measured solutes by four models. The X-axis values in all plots are calculated by MLR model (System B in Table 1). Plot (A): the predicted values by the MLR model with an addition of the aA term (A = −1.271 from System I); Plot (B): the predicted values by the Cycle-A model (System I); Plot (C): the predicted values by the Cycle-B model (System J); Plot (D): the predicted values by the Cycle-C model (System K). A diagonal line is shown in each plot.
Liquids 04 00006 g003
Figure 4. Illustration of the relationship between l o g 10 P l d p e / s (s = lipids and hexane) against l o g 10 P o / w as the independent variable for the observed LDPE extractables. Plot (A): l o g 10 P l d p e / l i p i d by MLR model; Plot (B): l o g 10 P l d p e / l i p i d by Cycle-A model; Plot (C): l o g 10 P l d p e / l i p i d by Cycle-B model; Plot (D): l o g 10 P l d p e / l i p i d by Cycle-C model; Plot (E): l o g 10 P l d p e / h e x a n e by System L in Table 1 (with swelling); Plot (F): l o g 10 P l d p e / h e x a n e by System M in Table 1 (no swelling). The solid line in each plot is the linear regression line between l o g 10 P l d p e / s (s = lipids and hexane) vs. l o g 10 P o / w . The lines above and below the regression lines are the limits of the data by SE of the regression with 95% confidence. Also included in Plot (E) is the l o g 10 P l d p e / l i p i d by Cycle-A model for the evaluation of the data overlap between l o g 10 P l d p e / l i p i d and l o g 10 P l d p e / h e x a n e . The vertical line at l o g 10 P o / w = 15 in plot (E) indicates the full divergence between l o g 10 P l d p e / l i p i d and l o g 10 P l d p e / h e x a n e . The horizontal line at l o g 10 P l d p e / s = 0 in plot (E) indicates the l o g 10 P l d p e / s = 1 to show the distribution of data points.
Liquids 04 00006 g004
Figure 5. Illustration of the relationship between l o g 10 R h / l (h = hexane and l = lipids, Equation (4)) against l o g 10 P o / w for the observed LDPE extractables. The l o g 10 P l d p e / h e x a n e by System L (with swelling) is used in the calculation of plots (AD). Plot (A): l o g 10 P l d p e / l i p i d by MLR model; Plot (B): l o g 10 P l d p e / l i p i d by Cycle-A model; Plot (C): l o g 10 P l d p e / l i p i d by Cycle-B model; Plot (D): l o g 10 P l d p e / l i p i d by Cycle-C model. The l o g 10 P l d p e / h e x a n e by System M (no swelling) is used in the calculation of plots (E,F). Plot (E): l o g 10 P l d p e / l i p i d by MLR model; Plot (F): l o g 10 P l d p e / l i p i d by Cycle-A model.
Liquids 04 00006 g005
Figure 6. Comparison of calculated l o g 10 P l d p e / l i p i d values for the observed LDPE extractables by four models. The notations and descriptions are the same as those in Figure 3.
Liquids 04 00006 g006
Figure 7. Illustration of box-whisker plots for the solvent diffusion coefficient. The solvent in the left plot is lipids/oils; and the solvent in the right plot is hexane (or nonpolar organic solvents). The median values are indicated in the graph.
Liquids 04 00006 g007
Figure 8. Illustration of BHT extraction release kinetic profiles from LDPE material by different solvents [46]. The X-axis and Y-axis are in 10-based log scale to show a much broad range of time duration (day). The Y-axis is the fraction (or amount at time t, M(t)) extracted to the total amount in the material (Mt). The solvents are indicated in the figure. The temperature of the extraction is 30 °C, except for water (60 °C). The thickness of the material is 0.061 cm.
Liquids 04 00006 g008
Figure 9. Illustration of C18 (n-octadecane) extraction release kinetic profiles from LDPE material by different solvents [46]. All notations the same as those in Figure 8. The thickness of the material is 0.072 cm.
Liquids 04 00006 g009
Figure 10. Illustration of C32 (n-dotriacontane) extraction release kinetic profiles from LDPE material by different solvents [46]. All notations the same as those in Figure 8. The thickness of the material is 0.028 cm.
Liquids 04 00006 g010
Figure 11. Illustration of histograms of over-extraction of LDPE and other nonpolar materials by hexane (or alkanes). The data are shown in Table S5. The median value by LDPE material is 7. The number of data points is indicated in the figure.
Liquids 04 00006 g011
Table 1. Tabulation of MLR Results and Descriptive Statistics plus Solvation System Constants of Various Partition Systems.
MethodPartition SystemSolvation Model System Constants aDescriptive Statistics b
System Label cSystem Description dcesabvRSEF L o g P RangeSE/Range (%)AR (AAR)
MLR by Equation (1) (Section 2.2 and Section 3.5)A eLDPE-Lipid (4–20 °C)−0.529 (0.089)0.526 (0.043)−0.368 (0.095)1.475 h (1.089)−0.640 (0.082)−0.455 (0.073)0.8930.118571.265 (−1.55 to −0.287)9.40.00 (0.08)
B f (MLR)LDPE-Lipid (4–20 °C)−0.524 (0.089)0.506 (0.041)−0.329 (0.091)NA−0.619 (0.081)−0.465 (0.073)0.8900.119699.40.00 (0.08)
C gLDPE-Lipid (4–20 °C)−0.997 (0.151)0.005 h (0.026) 0.0210.2560.0420.20.00 (0.19)
Compilation from Literatures and Thermodynamic Cycle Conversion (Section 2.2 and Section 3.5)D iLDPE-Water (25 °C)−0.529 (0.077)1.098 (0.047)−1.557 (0.081)−2.991 (0.116)−4.617 (0.110)3.886 (0.058)
E jLDPE-Water (20–25 °C) 1.002 (0.075)−1.296 (0.128)−1.820 (0.472)−4.037 (0.153)3.399 (0.072)
F kLDPE-Water (20–25 °C)−0.54 (0.05)1.13 (0.03)−1.58 (0.06)−3.47 (0.08)−4.53 (0.07)3.92 (0.04)
G lLipid-Water (37 °C)−0.07 (0.07)0.7 (0.06)−1.08 (0.08)−1.72 (0.13)−4.14 (0.09)4.11 (0.06)
H mHexane-Water (w/d, 25 °C)0.3330.56−1.71−3.578−4.9394.463
I n (Cycle-A)LDPE-lipid (25–37 °C)−0.459 (0.104)0.398 (0.076)−0.477 (0.114)−1.271 (0.174)−0.477 (0.142)−0.224 (0.084)
J o (Cycle-B)LDPE-lipid (20–37 °C)0.070 (0.07)0.302 (0.096)−0.216 (0.151)−0.100 (0.490)0.103 (0.178)−0.711 (0.094)
K p (Cycle-C)LDPE-lipid (20–37 °C)−0.470 (0.086)0.430 (0.067)−0.500 (0.100)−1.750 (0.153)−0.390 (0.114)−0.190 (0.072)
L q (Equation (3))LDPE-Hexane (23 °C)−1.104 s (0.153)0.329 (0.109)−0.033 (0.136)−1.315 (0.242)−0.977 (0.176)0.229 (0.087)
M rLDPE-Hexane (25–37 °C)−0.862 s0.5380.1530.5870.322−0.577
a System constants obtained by MLR (95% confidence) and the thermodynamic cycle conversion, or taken directly from literatures, as described in Section 2.2 and Section 3.5. The value in the parenthesis is the standard error of the constant, if available. b Notation of descriptive statistics: R-correlation coefficient; SE-standard error of the fit; F-Fisher statistic; l o g P Range- l o g P values from minimum to maximum; SE/Range-the standard error of the fit divided by the l o g P data range of the system, in percent; AR-average residual between predicted and measured values (AAR: absolute average residual between predicted and measured values in the parenthesis). c Partition system label. d System description. The value in the parenthesis is the temperature, range of temperatures in the initial study or the applicable range of temperature in the final system. e Regression results by Equation (1). The partition constant unit is kg/kg [47]. The value in the parenthesis of a system constant is the standard error from MLR (same for superscript f and g). f Regression results after the A parameter is removed in Equation (1). This correlation is called “MLR”. g Regression by l o g 10 P o / w model. The number in the c column is the intercept, and the number in the e column is the slope. h The p-value is greater than 0.05, indicating statistically insignificant. i LDPE-water partition system [56]. The concentration unit is the molar concentration. The partition constant unit is L/L. The value in the parenthesis is the standard error of the constant taken directly from the reference (same for superscript j, k, and l). j LDPE-water partition system [61]. The partition constant unit is L/kg. k LDPE-water partition system [62]. The partition constant unit is L/kg. l Lipid-water partition system [51]. The concentration unit is molar/liter. The partition constant unit is L/L. m Hexane-water partition system [59]. The concentration unit is mol/liter. The partition constant unit is L/L. n LDPE-lipid partition system by a thermodynamic cycle of LDPE-water and lipid-water systems [51,56]. The value in the parenthesis is the standard error of the constant derived from error propagation (same for superscript o, p, and q). LDPE (~0.92 g/mL) and lipid (0.9 g/mL) have nearly the same density, and the partition unit of L/L is considered the same as Kg/Kg in this study (also same for superscript o, and p). This correlation is called “Cycle-A”. o Same as superscript n, using LDPE-water system [51,61]. This correlation is called “Cycle-B”. p Same as superscript n, using LDPE-water system [51,62]. This correlation is called “Cycle-C”. q LDPE-hexane partition system with a LDPE swelling [33]. The concentration unit is the molar concentration. LDPE and hexane have different density, and the partition unit of L/L is converted to Kg/Kg in this study to be consistent with the data in Ref. [47] (same for superscript r). r LDPE-hexane partition system without a swelling by a thermodynamic cycle of lipid-water [56] and hexane-water system [59]. s The correction on the c constant in Systems L and M is by subtracting l o g 10 0.66 / 0.92 = 0.144 to convert from L/L unit to kg/kg unit. The corrected c constant for System L is −0.960, and −0.718 for System M. e,f,g The number of solutes is 78.
Table 2. Tabulation of Linear Regression Results and Descriptive Statistics between l o g 10 P l d p e / s and l o g 10 P o / w by Collected LDPE Extractables.
Partition System aRegression Results bDescriptive Statistics c
InterceptSlopeRAdj. RSEFn
LDPE-hexane
(L)
−1.685
(0.152)
0.062
(0.014)
0.4520.1930.6821976
LDPE-hexane d
(M)
−0.576
(0.092)
−0.136
(0.009)
0.8780.7680.41124976
LDPE-lipid
(B)
−1.453
(0.174)
−0.117
(0.016)
0.6400.4020.7795176
LDPE-lipid
(I)
−1.521
(0.211)
−0.058
(0.020)
0.3190.0900.949876
LDPE-lipid
(J)
−0.537
(0.113)
−0.183
(0.011)
0.8950.7980.50629776
LDPE-lipid
(K)
−1.561
(0.222)
−0.048
(0.021)
0.2580.0540.995576
R h / l  
(Equation (4), B)
−0.231
(0.080)
0.179
(0.008)
0.9410.8840.35757376
R h / l  
(Equation (4), I)
−0.164
(0.072)
0.120
(0.007)
0.8990.8060.32331376
R h / l  
(Equation (4), J)
−1.148
(0.071)
0.245
(0.007)
0.9740.9470.319134576
R h / l  
(Equation (4), K)
−0.124
(0.077)
0.110
(0.007)
0.8700.7540.34623076
a The letter in the parentheses is the system label from Table 1. b The values in the parentheses are the errors of the regression coefficients (95% confidence). c All notations the same as those in Table 1 (95% confidence). d No swelling of LDPE by hexane.
Table 3. Tabulation of LDPE-Lipid and LDPE-Hexane Partition constants of LDPE Extractables.
l o g 10 P o / w LDPE-Hexane aLDPE-Lipid b (B)LDPE-Lipid c (I)LDPE-Lipid d (K)
FitFit + SEFit − SEFitFit + SEFitFit + SEFitFit + SE
00.020.100.0040.03540.21220.03020.2680.02760.272
2.50.030.140.0060.01800.10830.02170.1920.02090.206
50.040.200.0090.00920.05530.01550.1380.01590.157
7.50.060.290.0130.00470.02820.01110.0990.01210.119
100.090.410.0180.00240.01440.00800.0710.00910.090
12.50.120.590.0260.00120.00730.00570.0510.00690.068
150.180.850.0370.00060.00370.00410.0360.00530.052
17.50.251.210.0520.00030.00190.00290.0260.00400.039
200.361.720.0750.00020.00100.00210.0190.00300.030
22.50.512.460.1070.00010.00050.00150.0130.00230.023
250.733.520.1530.000040.00030.00110.0100.00170.017
27.51.055.030.2180.000020.00010.00080.0070.00130.013
301.507.180.3120.000010.00010.00060.0050.00100.010
a Calculated by the partition system (L) in Table 1 and the coefficients in Table 2. b Calculated by the partition system (B, MLR) in Table 1 and the coefficients in Table 2. The values in the Table are mostly used for a comparison purpose with the two Cycle models and best applicable for solutes without hydrogen-bond acidity. c Calculated by the partition system (I, Cycle-A) in Table 1 and the coefficients in Table 2. d Calculated by the partition system (J, Cycle-C) in Table 1 and the coefficients in Table 2. a,b,c,d The upper and lower bounds (Fit + SE, and Fit − SE) are calculated by the SE of each fit in Table 2. The “Fit” column is the predictive values by the model. The number of significant digits is at least 1. The SE is based on 95% confidence in the regression in Table 2.
Table 4. Tabulation of LDPE Solvent Absorption and Diffusion Coefficients.
MaterialSolventTemperature (°C)Solvent Absorption (w/w%) aDiffusion Coefficient (D × 10−12 cm2/s)
LDPEFish Oil201.552.53
47 3.26
Triolein202.585.79
47 29.6
Olive oil401.6–2250–300
Olive oil b40<2 (~1.5)
Ethanol b~0.2
Isopropanol b<0.4
Ethyl acetate b3
Isooctane b15
Cyclohexane b25
Tributyrin b<1
Tricaprylin b<2
Cyclohexane402934,000
Isooctane125200
n-Heptane1424,000
Isooctane25 199
Ethanol d25 8.66
Olive oil12110
Isooctane404
6010
8019
Cyclohexane1010.8820,300
1512.6725,100
2518.1433,400
Benzene109.0940,600
1510.7445,900
2513.0763,600
n-Hexane25112500
n-HeptaneNA5–15
Ethanol d<1
Corn oil or Triglycerides2–5
LLDPE cOlive oil401.3690
Isooctane4010.65
95% Ethanol d400.45
PP cOlive oil40~2%
The data are collected from references [40,47,84,85,86,87,88,89,90,91,92,93,94]. LLDPE: linear low-density polyethylene; PP: polypropylene. a These values are presented as weight % (w/w, %), after a conversion if necessary. b These values are presented as volume % (v/v, %) in the original reference. The value in the parenthesis is the weight percent (w/w%). c Additional (similar) materials are collected and included in the table for information and comparison purposes. d Ethanol (or 95% ethanol) solvent is collected and included in the table for information and comparison purposes.
Disclaimer/Publisher’s Note: The statements, opinions and data contained in all publications are solely those of the individual author(s) and contributor(s) and not of MDPI and/or the editor(s). MDPI and/or the editor(s) disclaim responsibility for any injury to people or property resulting from any ideas, methods, instructions or products referred to in the content.

