1. Introduction
Organized solutions belong to the most explored liquid media for performing numerous chemical processes [
1]. The origin of the term “organized solutions” can be found in [
2,
3]. Among these systems, surfactant micellar solutions are the oldest [
4,
5,
6] and well-defined [
7,
8,
9,
10,
11,
12]. Among the most popular tools for studying the properties of surfactant micelles in water are indicator dyes of various types [
10,
13,
14,
15,
16,
17,
18,
19,
20,
21,
22,
23]. They are utilized as acid–base [
10,
13,
14,
15,
16,
17,
18,
19,
20], solvatochromic [
1,
19,
21], and fluorescent [
22,
23,
24,
25,
26] molecular probes.
These compounds have long been used in sensor devices [
27,
28,
29,
30,
31], for examining polyelectrolyte solutions [
32,
33], gelatin films [
34], nanodiamond and fullerenol dispersions [
35,
36], calixarene [
37,
38] and cucurbituril solutions [
39], surfactant monolayers on water/air interfaces [
40,
41,
42], monolayers on solid/liquid interfaces [
43], multilayers of different types [
44,
45,
46], and even water/air interfaces without introducing additional surfactants [
47,
48,
49].
With the help of such tools, the electrical surface potential, polarity, hydration, effective permittivity, and viscosity of the micellar pseudophases and related systems can be examined. The problems associated with the molecular probes are a matter of detailed consideration and discussion, and the corresponding publications are huge in number. Some of them are regarded in the above-cited articles, reviews, and books.
In addition to this abundant, but often quite contradictory information, we decided to investigate the “micelle + molecular probe” systems, first “micelle + indicator dyes” using molecular dynamics (MD) simulations. Despite numerous studies devoted to MD modeling of surfactant micelles in water, the systems containing molecular probes were almost overlooked. Some works were devoted to dye molecules in phospholipid bilayers [
50,
51]. An example of such a study of micelles is the MD investigation of the location of a dye sulforhodamine B in the micellar pseudophase [
52].
Within the course of our study, we used first sodium
n-dodecylsulfate, SDS, and
n-hexadecyl- (or cetyl-) trimethylammonium bromide, CTAB, micelles in water as the most well-defined surfactant systems. In addition, six other surfactants were occasionally used. In total, seventeen molecular probes were examined mainly in SDS and CTAB micellar solutions. The results of our research group have been reported in seventeen articles from 2016 to the present [
53,
54,
55,
56,
57,
58,
59,
60,
61,
62,
63,
64,
65,
66,
67,
68,
69]. We thought it is expedient to summarize the data obtained and the regularities found. In particular, a comparison of the theoretically derived models with the experimental data is of a special interest.
Since theoretical methods for studying solvation began to be considered as an integral part of the knowledge of solutions, it was important to apply modern MD modeling approaches not only to the structure of micelles, but also to the placement and hydration of molecular probes in the surfactant micelles.
Several theoretical models were proposed in order to qualitatively describe the structure of surfactant micelles. At the same time, molecular dynamics simulation may serve as the most physically grounded model to validate the other ones because it explicitly takes into account most of the interactions present in the solutions discussed. Such simulations go back several decades and revealed the features, which are hardly accessible otherwise.
The works devoted to MD simulations of surfactants and surfactant micelles are numerous. Here, we mention only some of them as an example [
70,
71,
72,
73,
74], as well as a new review article [
75], and a MD modeling of surfactant monolayers on the water/air interface [
76]. There are some studies of surfactant micelles [
77,
78] or bilayers [
79] based on other theoretical methods, including those analyzing the systems with incorporated lauric acid [
77,
79].
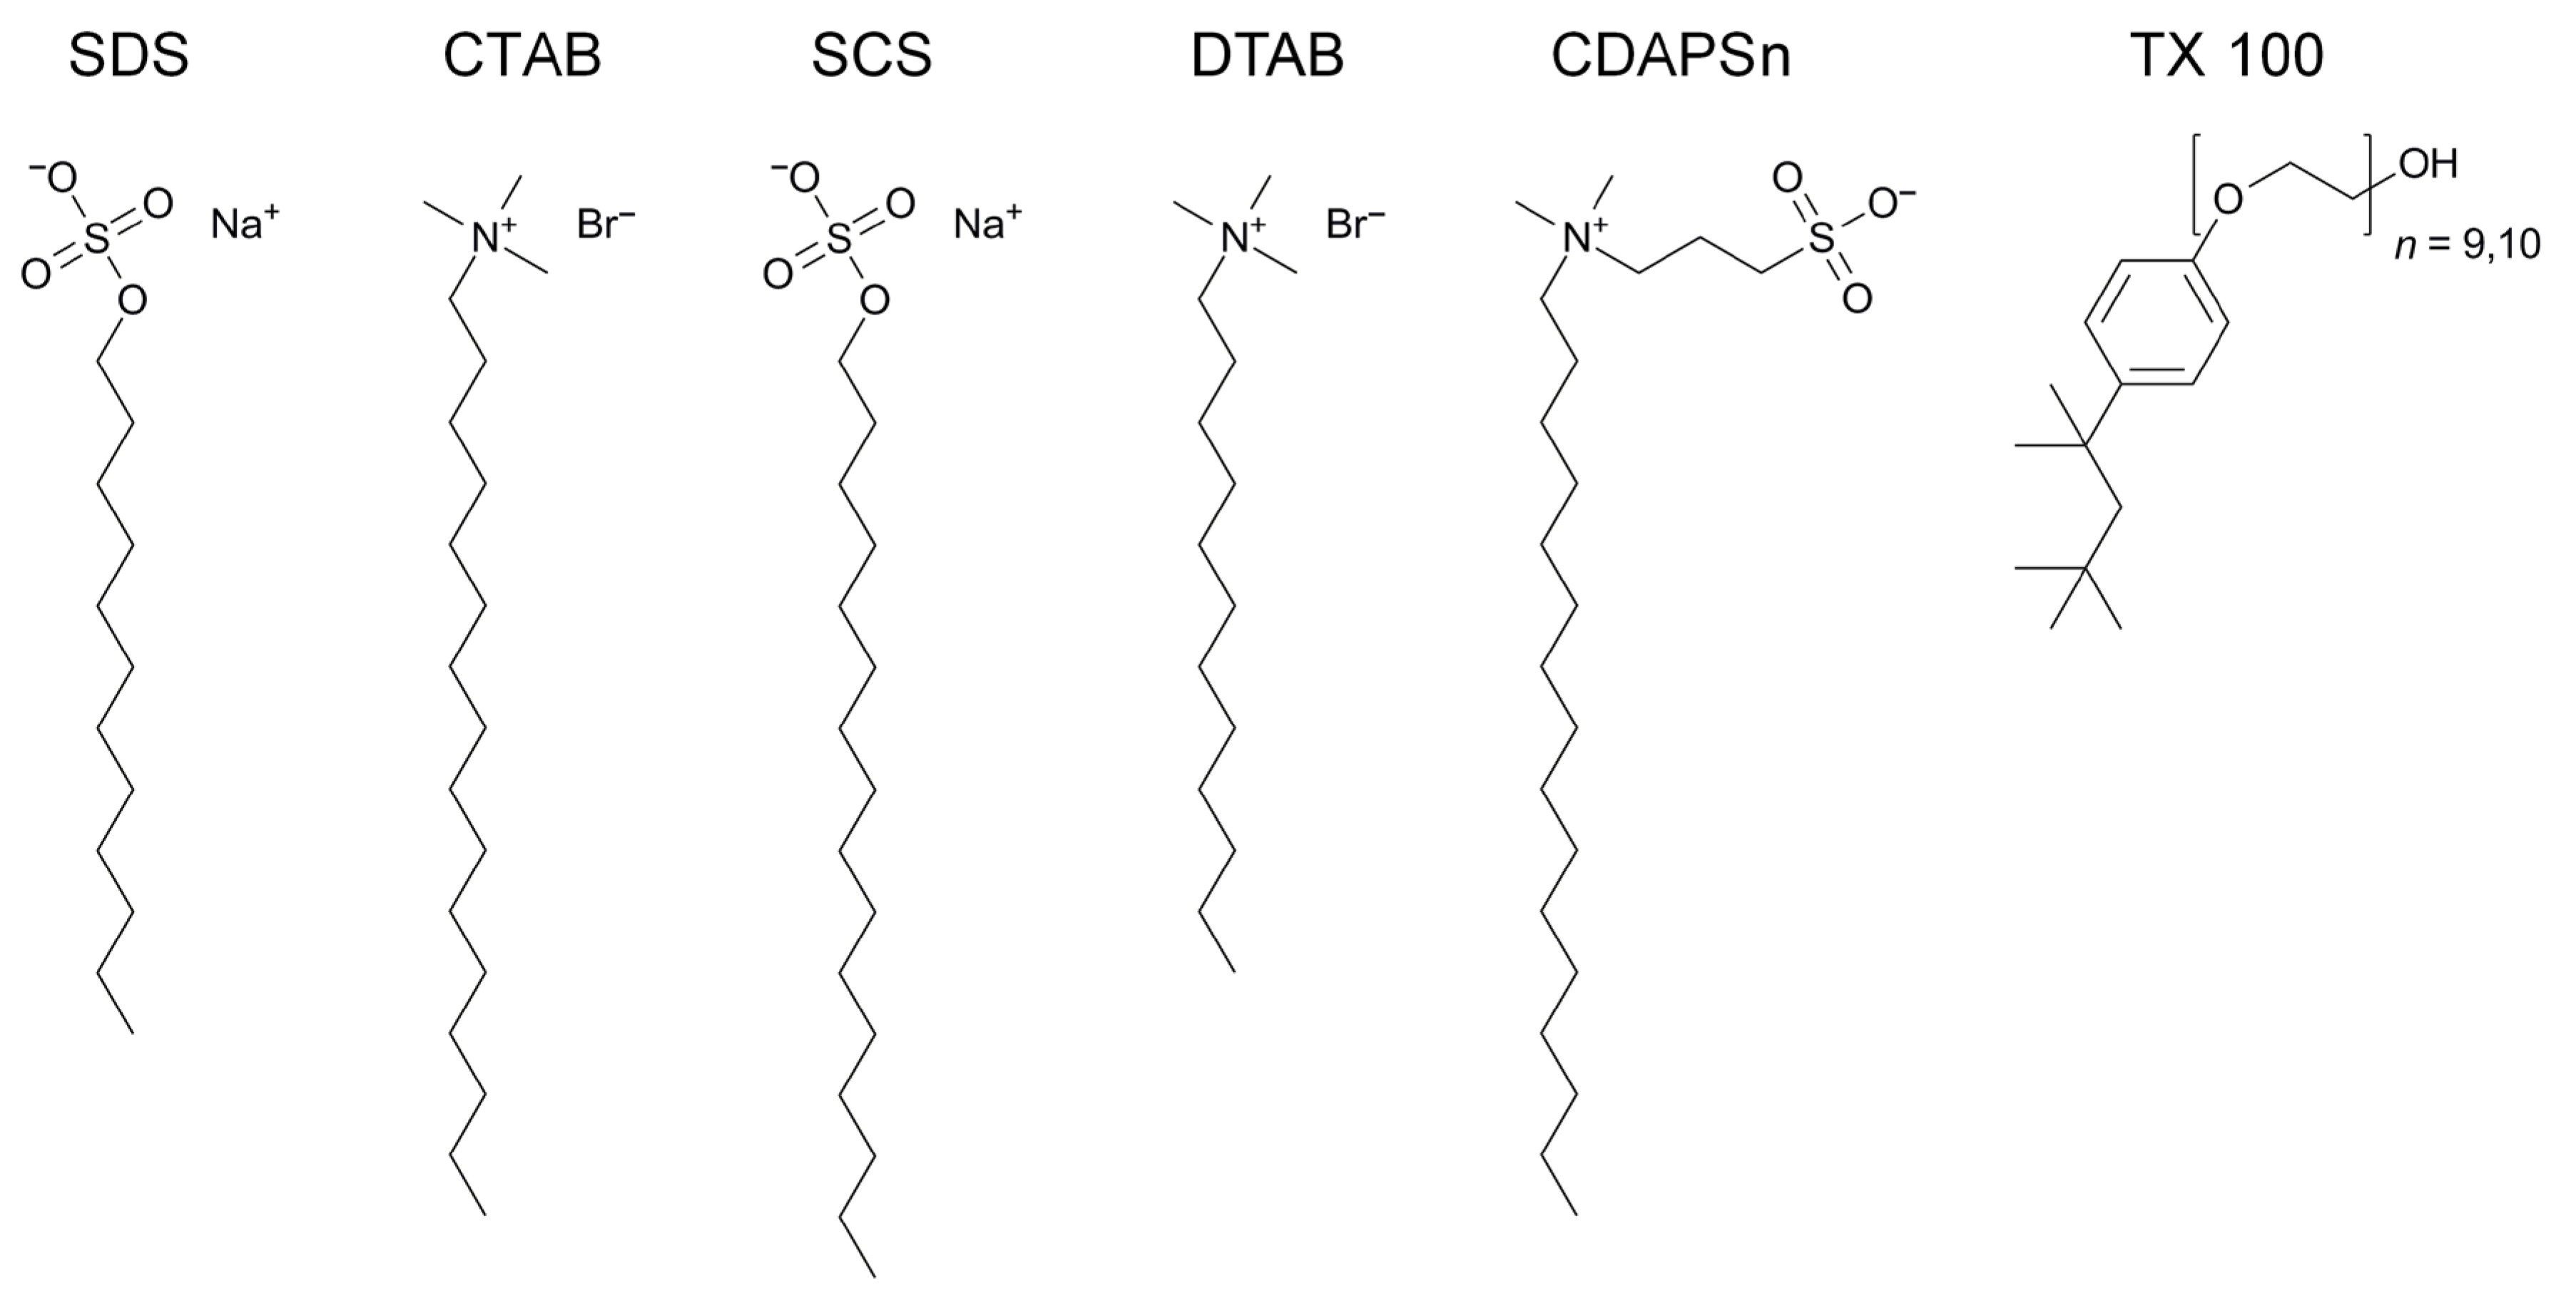
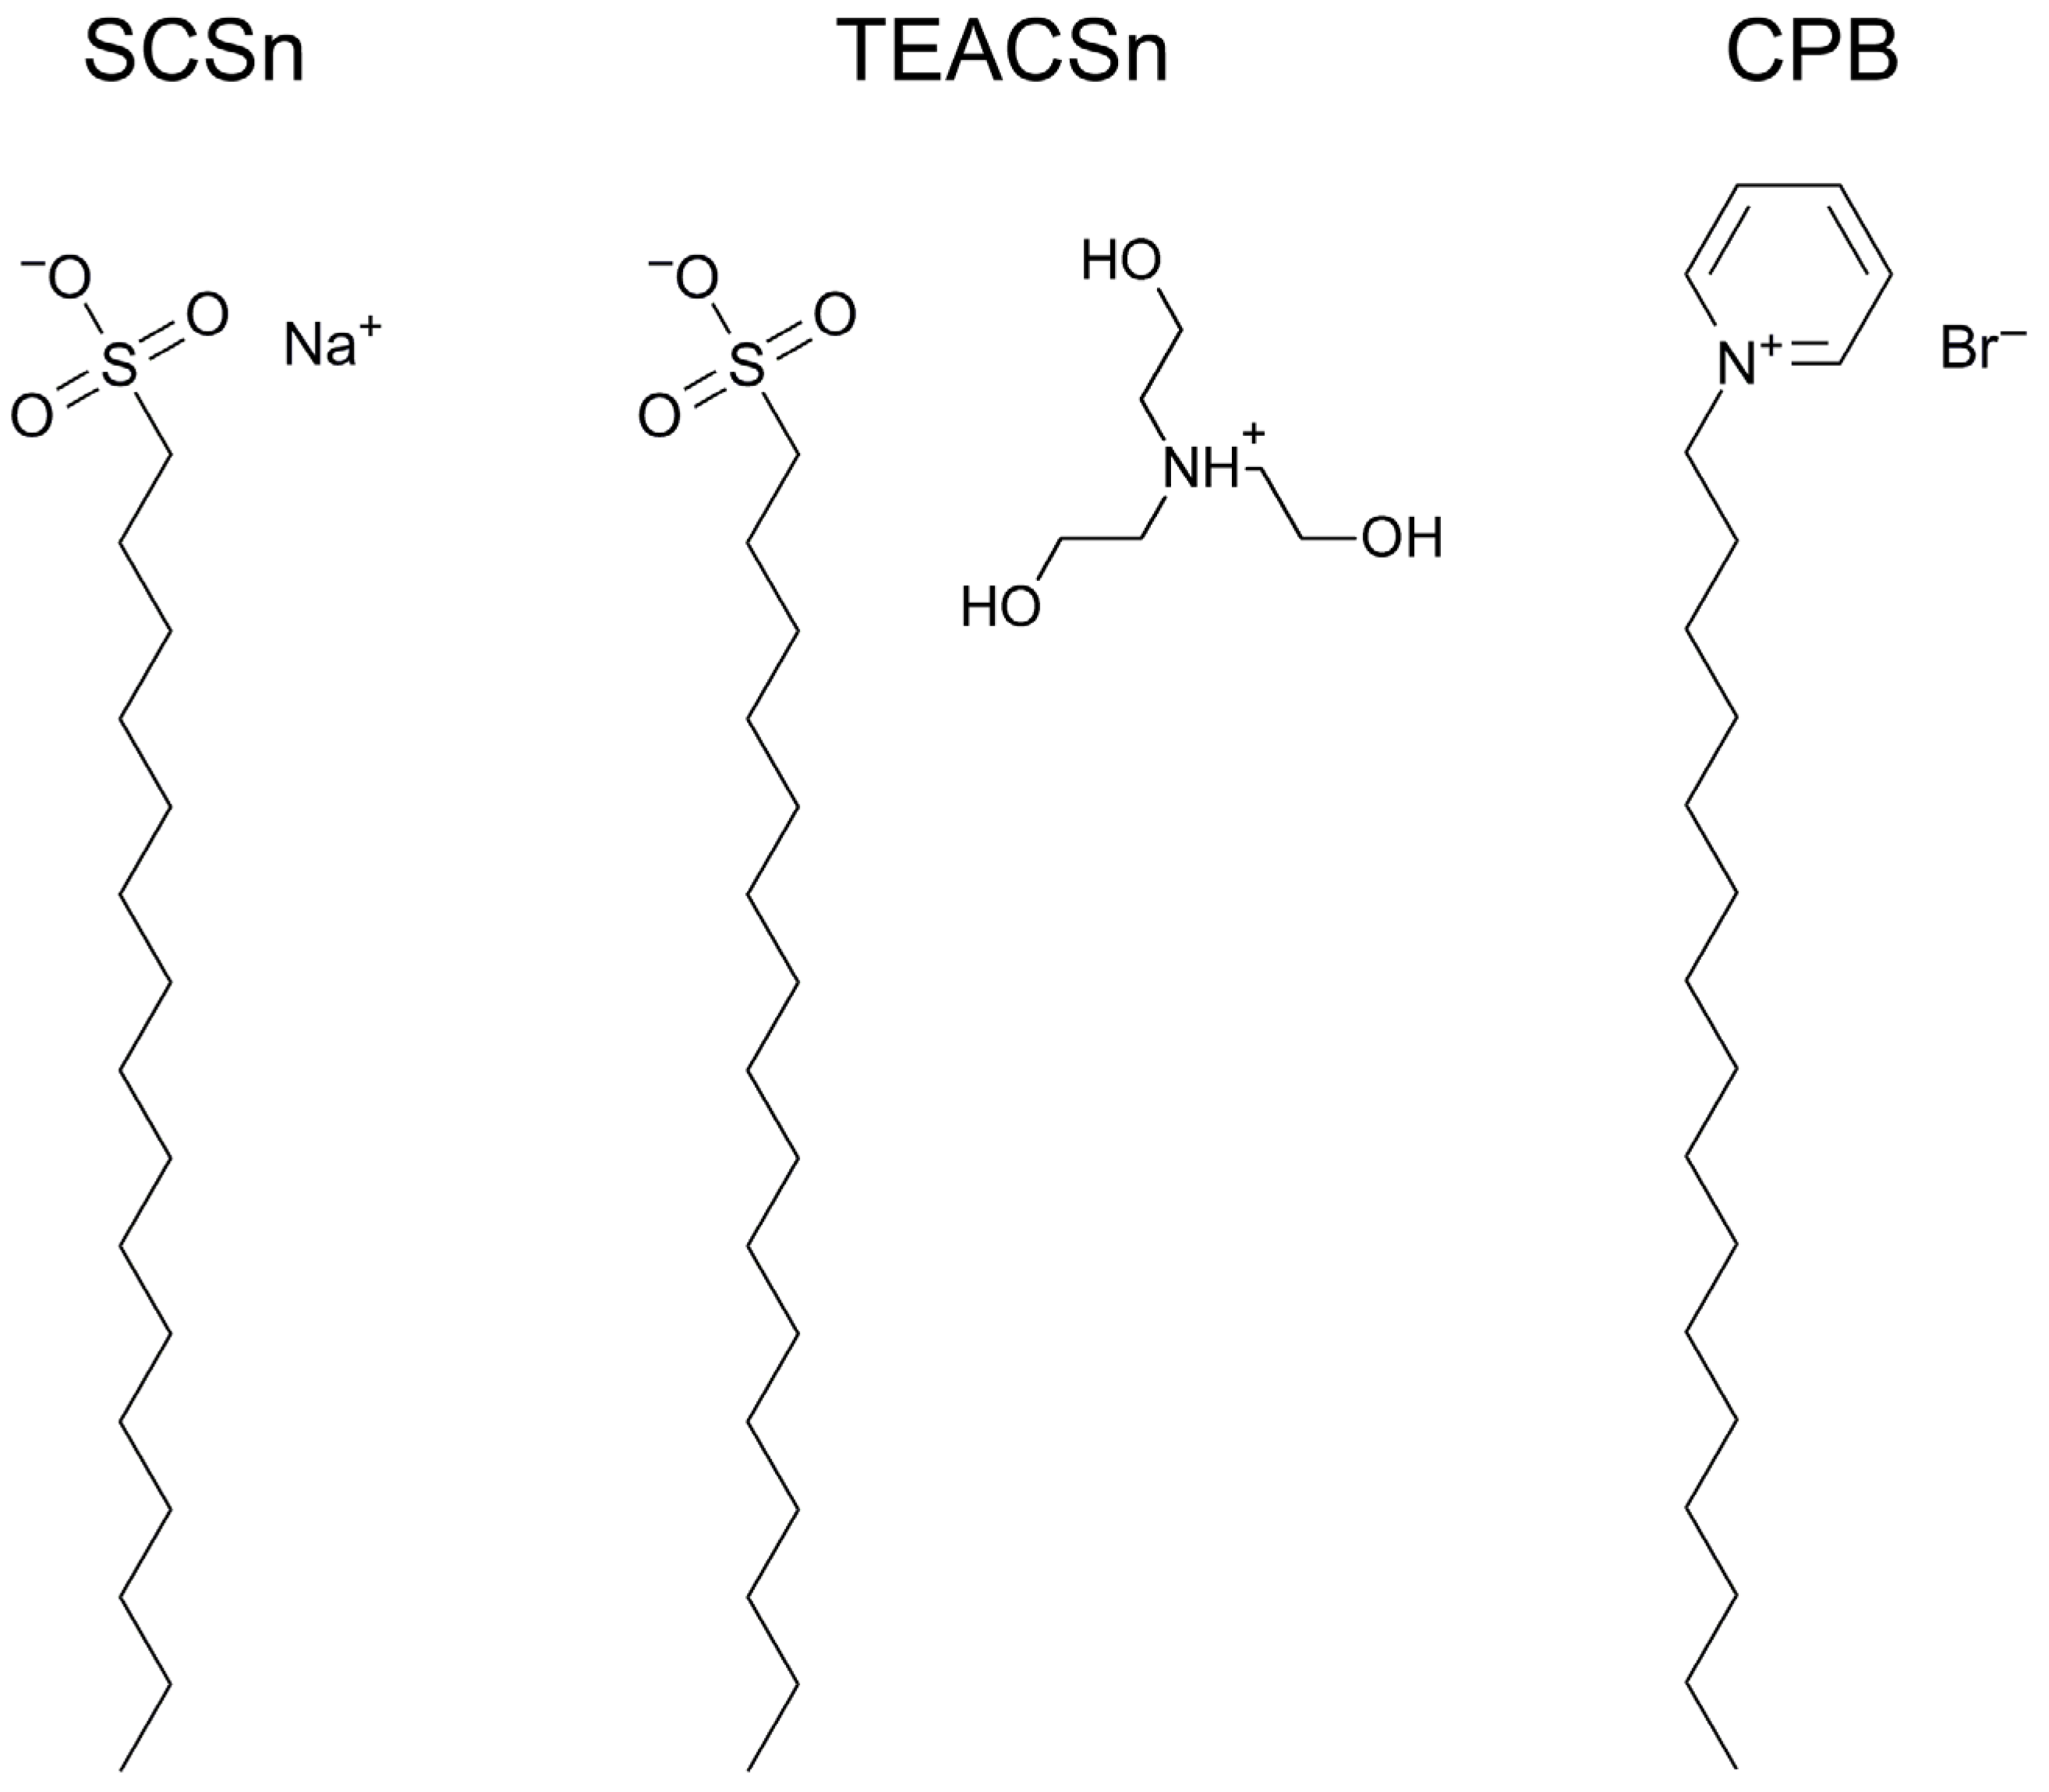
Within the course of our studies, the following ionic surfactants attracted our attention: sodium
n-dodecylsulfate, SDS; sodium
n-hexadecylsulfate (or cetylsulfate, SCS); cetyltrimethylammonium bromide, CTAB;
n-dodecyltrimethylammonium bromide, DTAB;
N-cetylpyridinium chloride, CPC. A zwitterionic surfactant,
N-cetyl-
N,
N-dimethyl-3-ammonio-1-propanesulfonate, CDAPSn, and a nonionic surfactant Triton X-100 (TX-100), were also examined (
Scheme 1). In order to compare the results with literature data,
N-cetylpyridinium bromide, CPB, and cetylsulfonic acid with a triethanolammonium cation, TEACSn, were also studied (not shown in
Scheme 1).
The leitmotif of this article is the MD simulation of “micelle + molecular probe” systems and comparison of the obtained results with experiment. We started with the study of solvatochromic dyes, whereas the idea of estimating the surface electric potential of micelles arose in the course of this research. As such, we performed a series of molecular dynamics simulations in order to elucidate the state of a set of dyes enclosed in surfactant micelles. The following characteristics were revealed: localization and spatial orientation of dye molecules with respect to the micelle surface and their degree of hydration. The collected data allowed us to identify the effect of various surfactant and dye parameters on these characteristics:
Charge of the surfactant headgroup;
Length of the surfactant hydrocarbon tail;
Micellar size.
Substituents in the dye molecule;
Protonation state of the dye;
3. Ionic Surfactant Micelles
Although the formation of surfactant micelles in aqueous solutions was proved more than a hundred years ago [
5,
6], the exact nature of these particles is still a matter of debate.
The ideas about the structure of surfactant micelles found in the literature were generally established quite a long time ago and are periodically refined and improved. It is impossible to consider this issue in detail here. As typical examples of the traditional approach, the model developed by Stigter [
81,
82,
83] and the article by Larsen and Magid [
84] should be mentioned. These and similar works correspond rather to Hartley’s model of spherical micelles. At the same time, Menger [
85] leans more towards McBain’s theory of a lamellar (bilayer, plate-like) surfactant micelle; see also Philippoff’s articles [
86,
87].
Fromherz proposed a hybrid of the two main models, a surfactant-block model, which presumes the contact of water molecules with the hydrocarbon core to some extent (“The entire hydrocarbon chain of all molecules is wettable in time average. The average number of wetted methylenes per chain is given by the wetted alpha-carbon, by the smooth surface of saturating cube configuration—about two methylenes—and by roughness”) [
88].
The schematic structure of a globular surfactant micelle considered by Grieser and Drummond on the basis of a number of studies by other authors seems to be quite realistic [
13]. In addition to the dynamic character of the micelle ⇆ surfactant monomer equilibrium, their model includes two important features. These are as follows. First, “a large hydrocarbon/aqueous solution contact area, i.e., the headgroups do not completely cover the hydrocarbon core”. This is in line with the scheme proposed by Israelachvili [
89]. Second, “a fluid hydrocarbon core, containing
no water, in which some chain bending can occur, thereby permitting some of the terminal CH
3 groups to be in contact with the interface.” [
13]. Today, both statements have been confirmed by MD simulations (see below).
In addition, Gilanyi [
90] proposed a concept of fluctuating micelles, based on the small system thermodynamics. Rusanov proposed a detailed consideration of structural, mechanical, thermodynamic, and electrostatic aspects of cylindrical, lamellar, and (first) spherical surfactant micelles in water [
91]. Us’yarov [
92,
93] also considers a spherical model of the SDS micelles even at surfactant concentrations up to 0.9 M.
A key characteristic of all micelles of ionic surfactants is their electrostatic potential, Ψ. A more detailed consideration allows to distinguish between the surface potential, Ψ
0, the Stern layer potential, Ψ
δ, and the electrokinetic potential,
ζ. The last is available for direct determination, but corresponds to the share surface (slip plane) located in the diffuse layer of the electrical double layer, EDL. For a charged spherical or cylindrical colloidal particle, the Ψ value can be calculated by an equation proposed by Ohshima, Healy, and White, based on the approximate analytical solution of Poisson–Boltzmann equation [
94]. For surfactant spherical micelles, the method was adapted by Hartland et al. [
95], to give Equation (1). The left-hand side in this equation is the surface charge density,
= 1 −
, where
is the degree of counterion binding,
si is the molecular area of the headgroup.
Here, , is the reciprocal Debye length, r is the micellar radius, = 8.854 × 10⁻¹² F m−1, and ε = 78.5 at T = 298.15 K. It should be noted, that the calculations require the knowledge of ri, si, and β and therefore are possible only for such well-defined surfactants as CTAB and SDS.
Though the present article is devoted to hydrophilic colloidal systems, an important work concerning the EDL at hydrophobic surfaces [
96] should be mentioned, as well as a theoretical approach for the determination of
ζ [
97].
It is clear that for a better understanding of the nature of surfactant micelles, the
values are of critical importance. These values determine the micelle charge and electrostatic potential, and can be deduced from experimental data. As early as 1951, Philippoff presented
values for nine representative ionic surfactants, although even then there was much more such data; for SDS,
= 0.183 [
87]. An overview of the literature accumulated over many years [
92,
95,
98] shows a significant spread of the
values for a given surfactant. For instance, let us consider the data for SDS and related anionic surfactants. Sasaki et al. [
98] determined
= 0.27 by activity measurements of Na
+ and DS
− and compared this value with those obtained in thirteen other works by seven different experimental methods:
varies from 0.14 to 0.54, 0.26 on average. Frahm et al. [
99] used two methods and determined
= 0.36–0.49, while Lebedeva et al. [
100] compared values from four different publications, from 0.272 to 0.322, with 0.290 on average.
Still in practice different methods provide dissimilar values. This is because the position of the boundary between bound and free counterions is not an intrinsic characteristic of the micelle but depends on the method used. Hartland et al. [
95] noted that micelle mobility methods give
values of approximately 0.3 to 0.4, which is higher than those determined from measurements of sodium ion activity, which give
values of approximately 0.20 to 0.25. Simultaneously, Gilanyi [
101] proposed an interpretation of the experimental
values in terms of specific and nonspecific electrostatic interactions between the colloidal particles and small ions.
At the same time, utilization of one and the same method reveals the tendency of
decreasing along with lengthening of the hydrocarbon tails. This is not so pronounced when comparing C
10H
21OSO
3Na and C
12H
25OSO
3Na with C
14H
29OSO
3Na, and C
16H
33OSO
3Na [
98], but for seven surfactants, C
nH
2n+1OSO
3Na, from
n = 8 and 9 to 13 and 14,
decreases from 0.41–0.42 to 0.19–0.22 (average of values obtained by different methods) [
99].
The increase in the concentrations of both surfactant and foreign electrolyte can lead to a decreasing
value. For example, Us’yarov performed a detailed theoretical study of the SDS solutions within a wide concentration range, without and with NaCl additions [
92,
93]. At SDS concentrations up to 0.9 M and a total Na
+ concentration in the bulk aqueous phase from 0.01 to ≈0.9 M, the
= 1 −
values vary from 0.19 to 0.025–0.04 [
92,
93].
4. New Molecular Dynamics Modeling Results for Surfactant Micelles
Now let us consider our results concerning the micellar structure. Particularly, the simulations show that water molecules do not penetrate deeply into the hydrocarbon core. In other words, the core is completely dry; see
Figure 1A, which is in line with earlier proposed picture [
13] and theoretical results [
72]. Nevertheless, the continuous thermal motion of surfactant monomers and the character of their packing enable every CH
2/CH
3 bead of the tail to have occasionally contact to water. This occurs when the bead appears on the micelle surface for some time, which in turn depends on its position in the chain. However, if a micelle adopts a prolate or rod-like shape instead of being close to spherical, then the dry core appears rather thin, as was observed for DTAB micelles. Probably, the most appropriate term for the micellar structure is globular.
MD simulation with explicit water allows directly counting the amount of water in micelles using various metrics. On one hand, we estimated the extent of hydration of each CH
2/CH
3 bead of hydrocarbon tails.
Figure 1B shows the average number of water molecules staying within 0.4 nm of each bead in the micelles of SCS and CTAB having a
n-C
16H
33 hydrocarbon tail, and SDS and DTAB with a
n-C
12H
25 one. In alkylammonium surfactants, we attributed the first methylene group as belonging to the headgroup, basing on the charge distribution. While the hydration decreases quickly with moving away from the headgroups, it still never reaches zero, and even somewhat increases for the last two beads. The hydration of the first and third beads in the anionic surfactants is ca. 30% higher than in cationic ones, while it is ca. 9% lower for the second and fourth beads. On average, the hydration of the first four beads is somewhat higher in the anionic surfactants. However, this does not mean that the surface layer contains more water because the beads may share water molecules. Instead, if hydration is calculated using a radius of 0.5 nm then CTAB ions have some preference. Hence, we conclude the DS
− and CTA
+ ions in micelles are hydrated to a similar extent.
On the other hand, we estimated the complete amount of water within the surface layer of SDS, SCS, DTAB, and CTAB micelles. As such, we used a simplified geometric model where micelle and its hydrocarbon core were represented as concentric triaxial ellipsoids; see
Figure 2. Axes of the latter ellipsoid were chosen to make its volume and moments of inertia equal the values computed by MD simulation. The axes of the former ellipsoid were 2 ×
δ nm longer to reflect the
δ-thick surface layer around the core. Then, the water molecules within
δ nm of the core were enumerated and a time-average number was computed using the MD trajectories. Having this input data, we found the hydration
H of the complete micelle as volume fraction of water in the Stern layer via Equation (2).
Here, δ is the Stern layer thickness; VStern layer, Vwater, Vmicelle, Vcore are volumes of the surface layer, water, micelle ellipsoid, and the hydrocarbon-core ellipsoid, respectively; Nwater is the number of water molecules in the surface layer; and V1mol is the volume of a single water molecule (0.030 nm3).
The results indicate that, despite the difference in the headgroup charge and micelle size, the H(δ) parameter appears almost equal for all four surfactants considered (the spread is no more than 0.05 units). This agrees well with the previously shown similarity of hydration of individual CH2 beads of the surfactant ions.
As mentioned before, the degree of counterions binding,
β (and the related degree of dissociation,
α), is an essential quantity determining the behavior of an ionic micelle in solution. MD simulation allows examining the complete distribution of counterions instead of a single-point value. The calculated
β values for some of the inspected surfactants are collected in
Table 1 for two values of the boundary position. The lower boundary is found from the distribution of counterions around headgroups, and corresponds to the first minimum in the radial distribution function of Na
+ (Br
−) with respect to S (N) atoms. The upper one is somewhat arbitrarily chosen as 0.9 nm. The comparison indicates that considering the most tightly bound counterions only (the lower boundary) leads to underestimation of
β, so the boundary must be chosen farther from the micelle. According to our simulations of SDS, potential models that provide higher counterion binding within the lower boundary also lead to deformation of structure of large micelles [
55]. The upper boundary provides
β values, which fit in the experimental range, except of CTAB where small underestimation of ca. 0.05 remains.
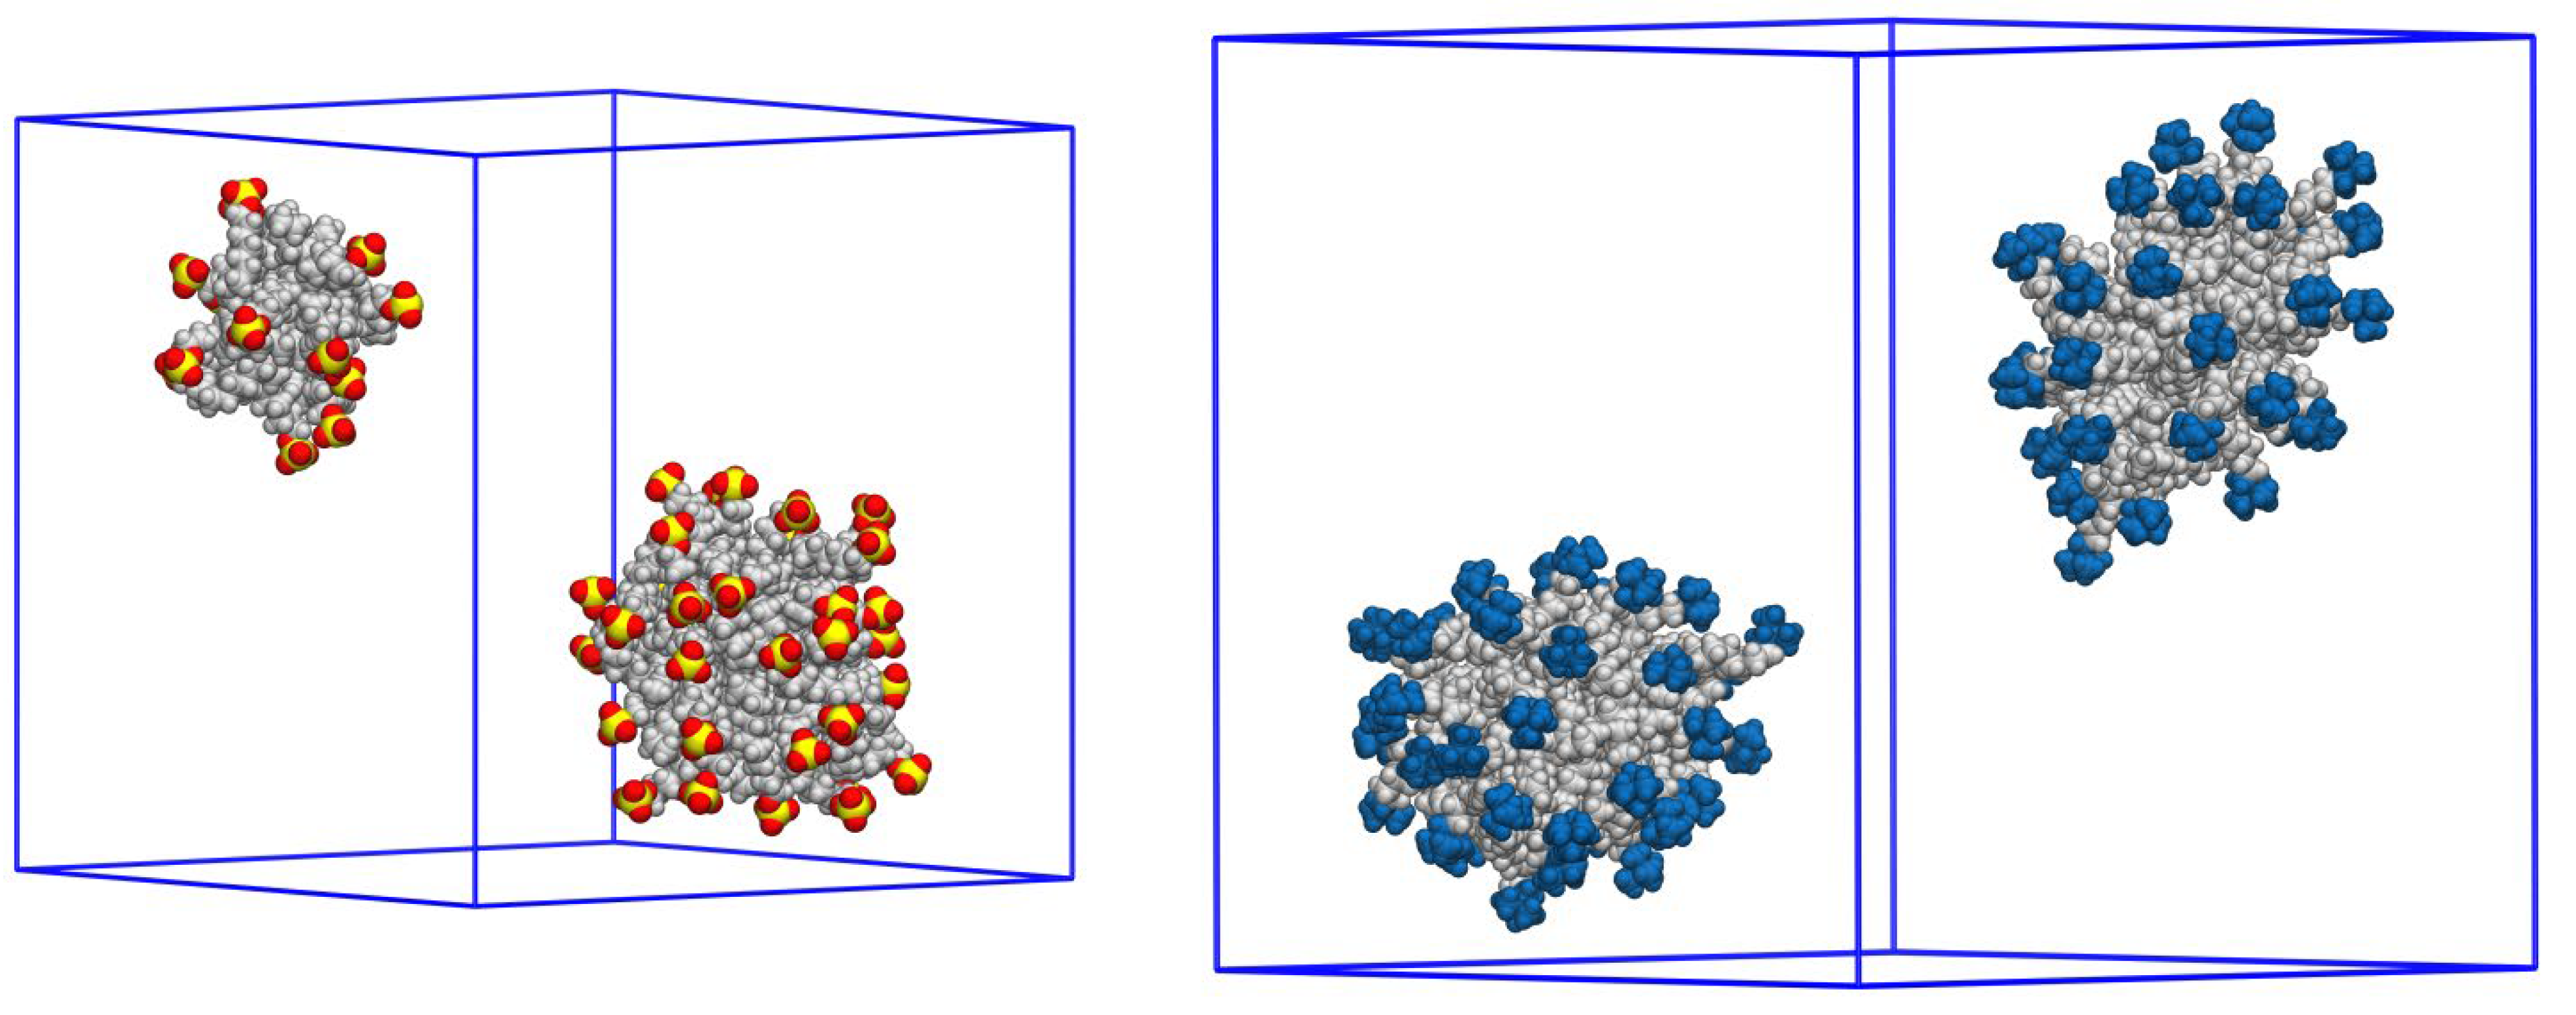
In order to elucidate the role of counterions, we applied an unusual approach. By means of MD simulations one can easily study systems, which cannot be prepared in the laboratory. We performed simulations of “bare” micelles, composed of DS
− or CTA
+ ions only, without any other ions present in the aqueous solution. Usually, counterions are considered as a necessary factor for the formation of a micelle, which compensates the electrostatic repulsion between like-charged surfactant ions. In the simulations, the DS
− micelle of 60 monomers expelled a small aggregate and reduced to 43 monomers. The CTA
+ micelle of 80 monomers was split into two comparable micelles; see
Figure 3. This result indicates that the hydrophobic interaction itself is able to keep the aggregate together without additional stabilization up to some size.
It is well proven and documented that in mixed nonionic + ionic surfactant micelles at low content of the second component, the fraction of the counterions is small or even zero [
14,
108,
109,
110]. In such cases, the hydrophilic portions of the nonionic component ensured micelle stabilization. In any case, the diffuse layer of counterions exists around the micelle. In the case of polyelectrolytes, according to Manning’s theory, there is a critical degree of counterions condensation [
111]. It should be noted that some early theories do not assume an adsorption layer of counterions in the monolayers of ionic surfactants at the water/air and water/hydrocarbon interfaces [
112].
The formation of pre-micellar, or sub-colloidal, species (DS
−)
2 occurs rather without than with the participation of the sodium ions [
113,
114], though at SDS and NaClO
4 concentrations of 10
−4 M, the (DS
−)
2Na
+ particles were fixed by the electrospray spectrometry [
115].
Though the hydration of ionic groups certainly takes place in the case of counterion-free dodecylsulfate aggregates, the MD prediction of formation of such aggregates can be considered as an illustration of the efficiency of the hydrophobic interaction.
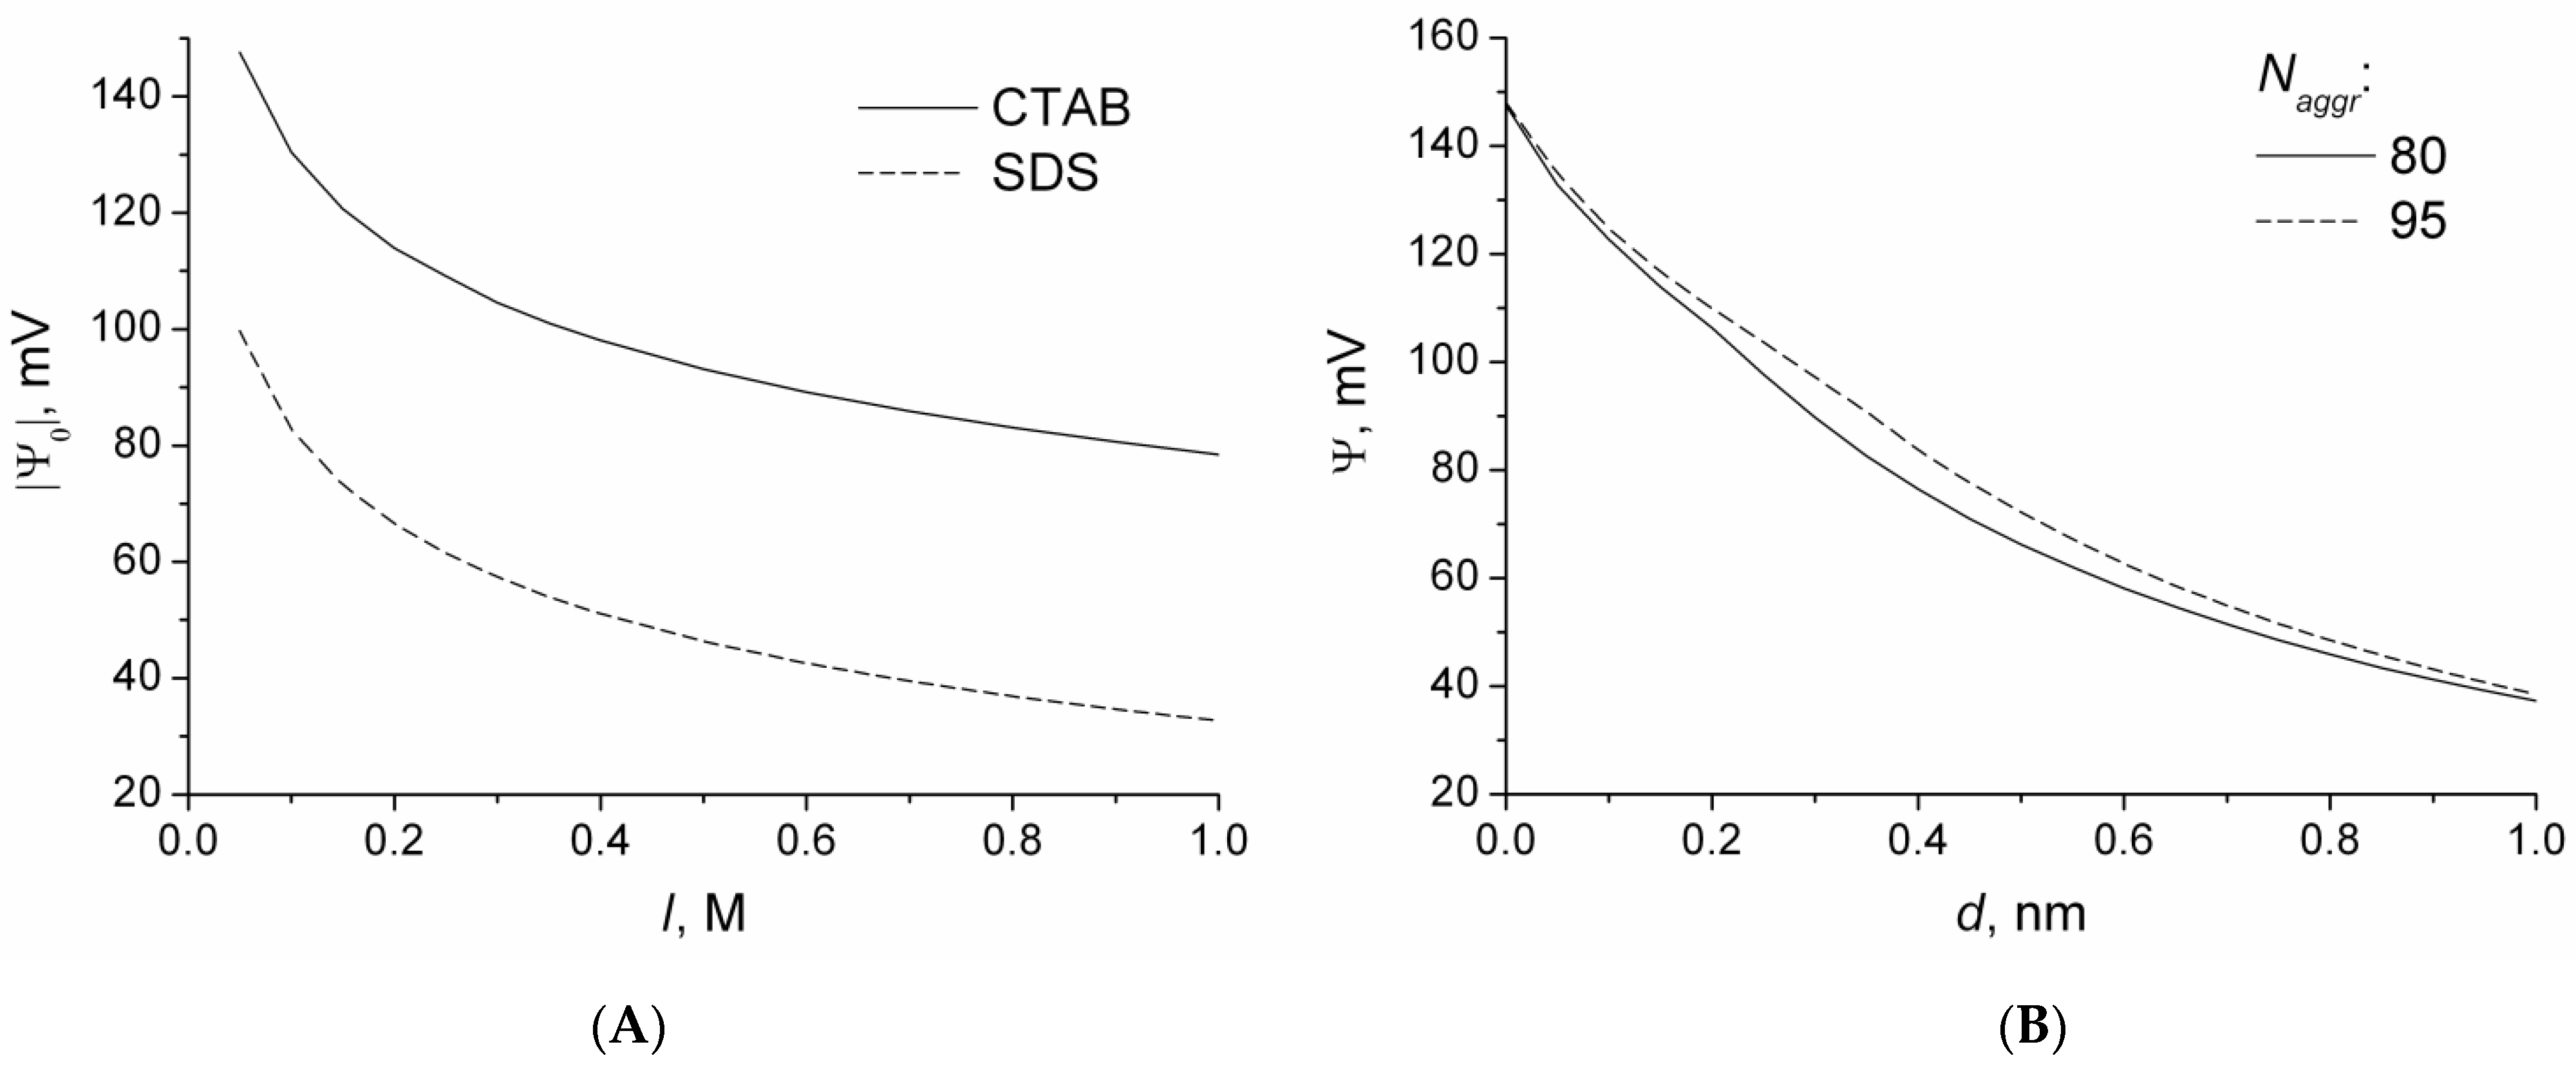
A related issue is the profile of the electrostatic potential around the micelle. This problem was extensively studied previously, but simplified geometries (sphere, cylinder) were mostly used because they enable analytical solutions. We performed the calculation of Ψ(
r) considering micelles of natural shapes, which were produced by MD simulation. The suitable method of calculation was the numerical solution of the Poisson–Boltzmann equation. The discrete character of charge distribution and complex shape of micelle were taken into account, as well as the finite size of counterions. Solvent and micelle were treated as dielectric continuums, as is usually done in such calculations. The profiles Ψ(
r) predict the expected fade of Ψ with distance and ionic strength,
Figure 4 and
Figure 5. They were then interpreted in terms of the commonly used characteristics: surface potential Ψ
0 and Stern layer potential, Ψ
δ. For SDS and CTAB micelles, the values Ψ
0 = −100 mV and +(149–151) mV, Ψ
δ = −75 mV and +(70–78) mV were found (at
I = 0.05 M), which stays in line with the estimations of other methods. The Stern layer boundary
δ was chosen 0.32 nm for SDS and 0.45 nm for CTAB according to the distribution of counterions around the micelle surface, more details may be found in our previous work [
66].
Note that
Figure 4 and
Figure 5B do not show a sharp change in the potential near the surface.
The method chosen by us allows us to calculate the surface electrostatic potential of “bare” micelles without counterions. We used the micelles consisting of 41–43 monomers produced as a result of MD simulations presented before. The Ψ
0 values are −420 mV and +380 mV. Importantly, these numbers are of lesser magnitude than found for the original size micelles, where Ψ
0 is −535 mV and +630 mV. Evidently, a decrease in the aggregation number led to a reduction in the surface charge density and headgroup—headgroup repulsion up to the magnitudes, which can be compensated by hydrophobic interactions. On the other hand, calculations of the electrostatic potential of the dodecylsulfate micelle with “empty”, i.e., counterions-free Stern layer using Equation (1) lead to a value of −(193–199) mV at
= 1 [
14,
95]. The screening of the surface charge by the diffuse layer was accounted for in this case, contrary to the above mentioned MD simulations. Therefore, the influence of the diffuse layer corresponds to −340 mV.
From the computational perspective, we identified the importance of bonded parameters for potential models of surfactants. It was previously identified for higher hydrocarbons and lipids and led to derivation of improved potential models, but it was not applied for common surfactants. Usually, the non-bonded parameters (point charges, Lennard–Jones potential σ and ε) are in focus during the parameterization. However, for SDS, the parameters of dihedral (torsion) angles governing the rotation around C–C bonds strongly affect the micelle properties, as well. Too rigid tails (i.e., with high potential barriers for the rotation) superfluously tend to adopt a parallel arrangement. In small micelles (<100 monomers), this affects only the degree of counterions binding because the headgroups become more grouped. However, large micelles may artificially adopt a bilayer-like shape instead of a rod-like one. Whether this occurs depends also on the non-bonded parameters. The problem was solved by making the tails more flexible, which was achieved by employing the dihedral parameters proposed for description of higher hydrocarbons and lipids.
A crucial feature of micelles is their ability to bind (adsorb) molecules and ions present in solutions. The properties of the molecule often undergo a change after adsorption, and experimental registration of this change is the basis of the method of investigating micelle properties by means of molecular probes. Still, this method heavily relies on the a priori information about the state of the molecular probe, which is needed to interpret the registered changes. This is a severe problem because the state itself cannot be observed directly and must be deduced from some other experiments. By using properly prepared and mutually consistent potential models it is possible to recapitulate the adsorption process in MD simulation and examine the state of the molecular probe including its localization, local environment, and diffusion coefficient. For example, we simulated the adsorption of N(C
3H
7)
4+ ions in SDS micelle, and observed a significant reduction in its diffusion coefficient as result [
53]. Still, even for these oppositely charged species adsorption may demand a quite long simulation time; therefore, we concluded it is more practically convenient to have the molecular probe initially located in the micelle at the start of MD. The final result (
Figure 6) demonstrates the location of this cation; it is in line with the scheme proposed by Bales et al. [
116], who considered the tetra-
n-propylammonium and other tetraalkylammonium cations in the Stern layer of the micelles of tetraalkylammonium dodecylsulfates.
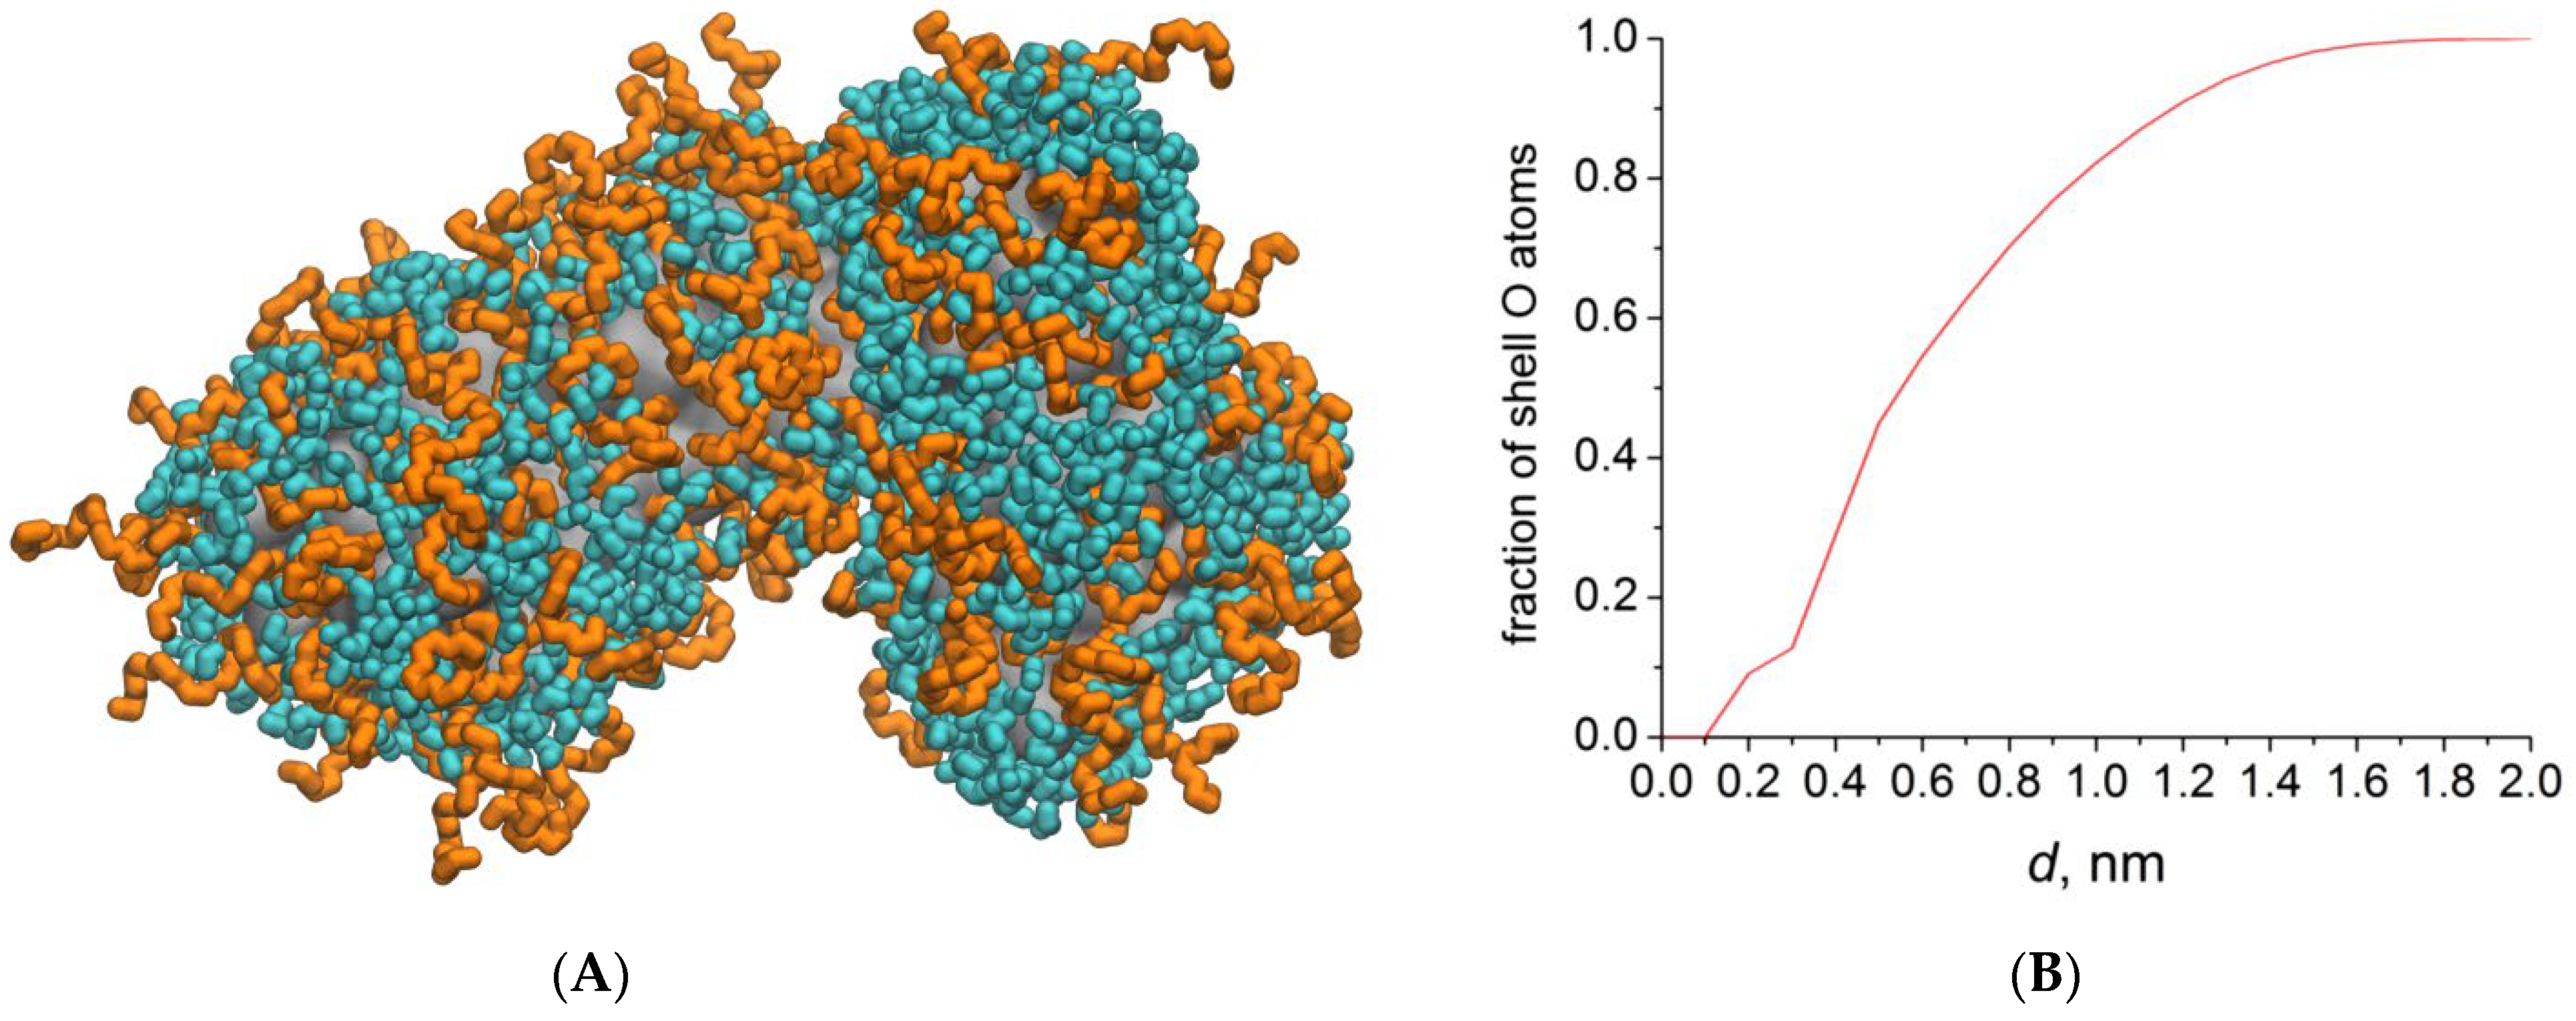
We also paid attention to nonionic micelles with and without an adsorbed dye molecule, since they are used in the indicator method of estimating the surface electrostatic potential [
10,
13,
14].
The micelles of TX-100 with an aggregation number of 110 adapted a curved rod shape in accordance with experimental observations. The diameter of the rods is ~5 nm and their length is ~12 nm (in unbend state), as determined by visual inspection in Visual Molecular Dynamics (VMD) software. The thickness of the hydrophilic shell was approximately 1 nm, while some polyoxyethylene chains extended for 1.5 nm out of it. The detailed structure of the hydrophilic shell is quantified by means of the fraction of O atoms found at a given distance from the hydrocarbon core. The graph is shown in
Figure 7; here, a mistake made in this graph in the original paper is corrected. Estimated in such a way, shell thickness equals 1.4 nm, from which the half of O atoms are located within 0.45 nm of the surface [
64].
5. Solvatochromic Indicators in Surfactant Micelles
5.1. Choice of Pyridinium-N-Phenolate Dyes
Solvatochromic dyes have been widely used for studying colloidal systems since long ago [
117], and such works are ongoing [
1,
118,
119,
120,
121]. Among other solvatochromic indicators, the pyridinium
N-phenolate betaine dyes belong to the most powerful ones [
21]. These compounds were often used for studying surfactant micelles and similar nano-sized species [
21,
117,
122,
123].
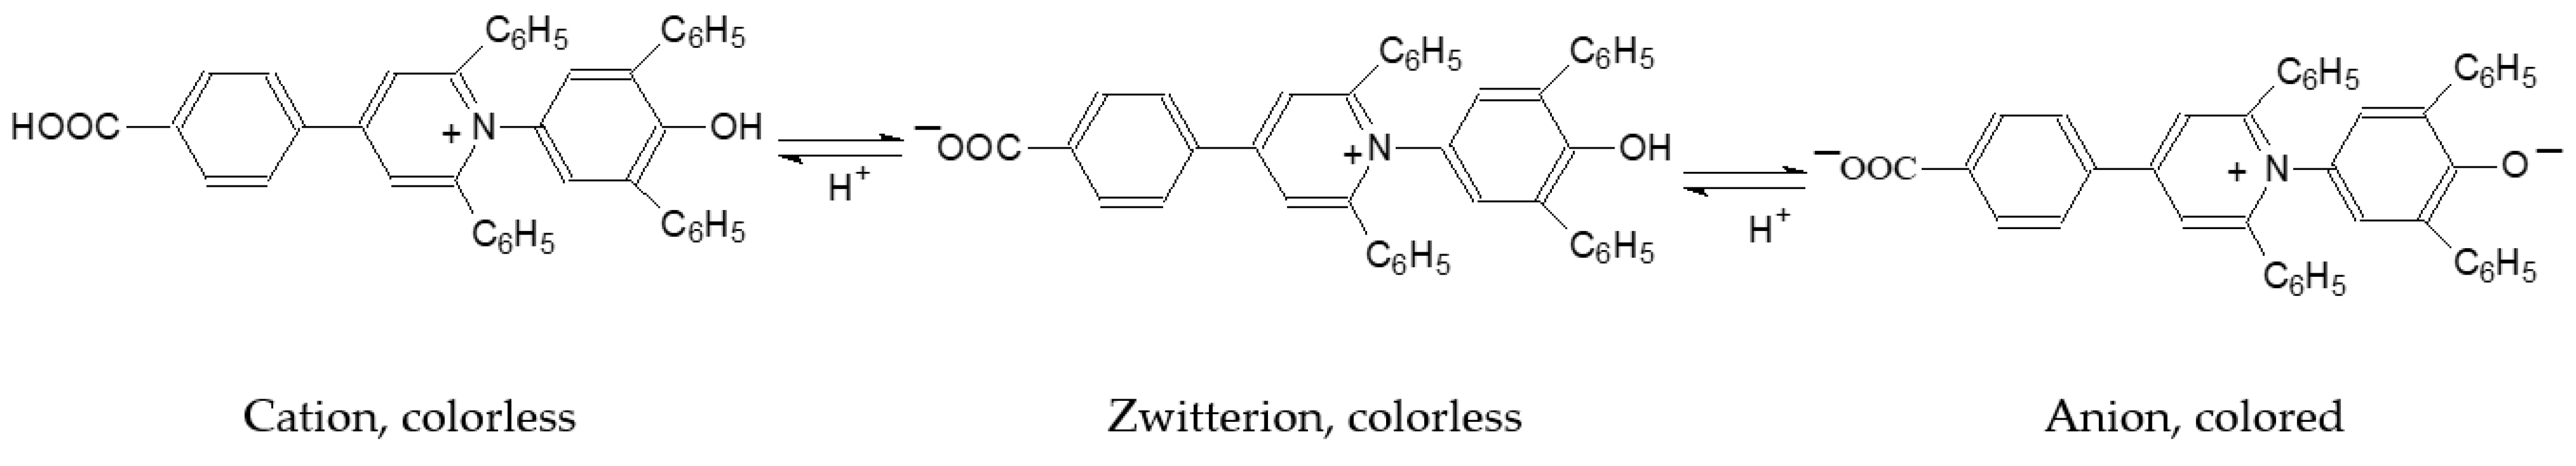
Therefore, we started our research with these dyes in micellar surfactant solutions. The MD simulations were aimed to reveal the locus of the dyes and the solvation/hydration character in the micellar pseudophase. Another reason for this choice is the application of these dyes as acid–base indicators in micellar media. This was first demonstrated for standard Reichardt’s dye, a solvatochromic pyridinium
N-phenolate dye, i.e., 4-(2,4,6-triphenylpyridinium-1-yl)-2,6-diphenylphenolate (
Scheme 2) [
19]. Accordingly, not only the colored solvatochromic neutral (zwitterionic) forms (
Scheme 3), but also the colorless cations were examined here in micellar environments.
The main results of our modeling are presented below.
5.2. Localization of the Solvatochromic Betaine Dyes in Surfactant Micelles
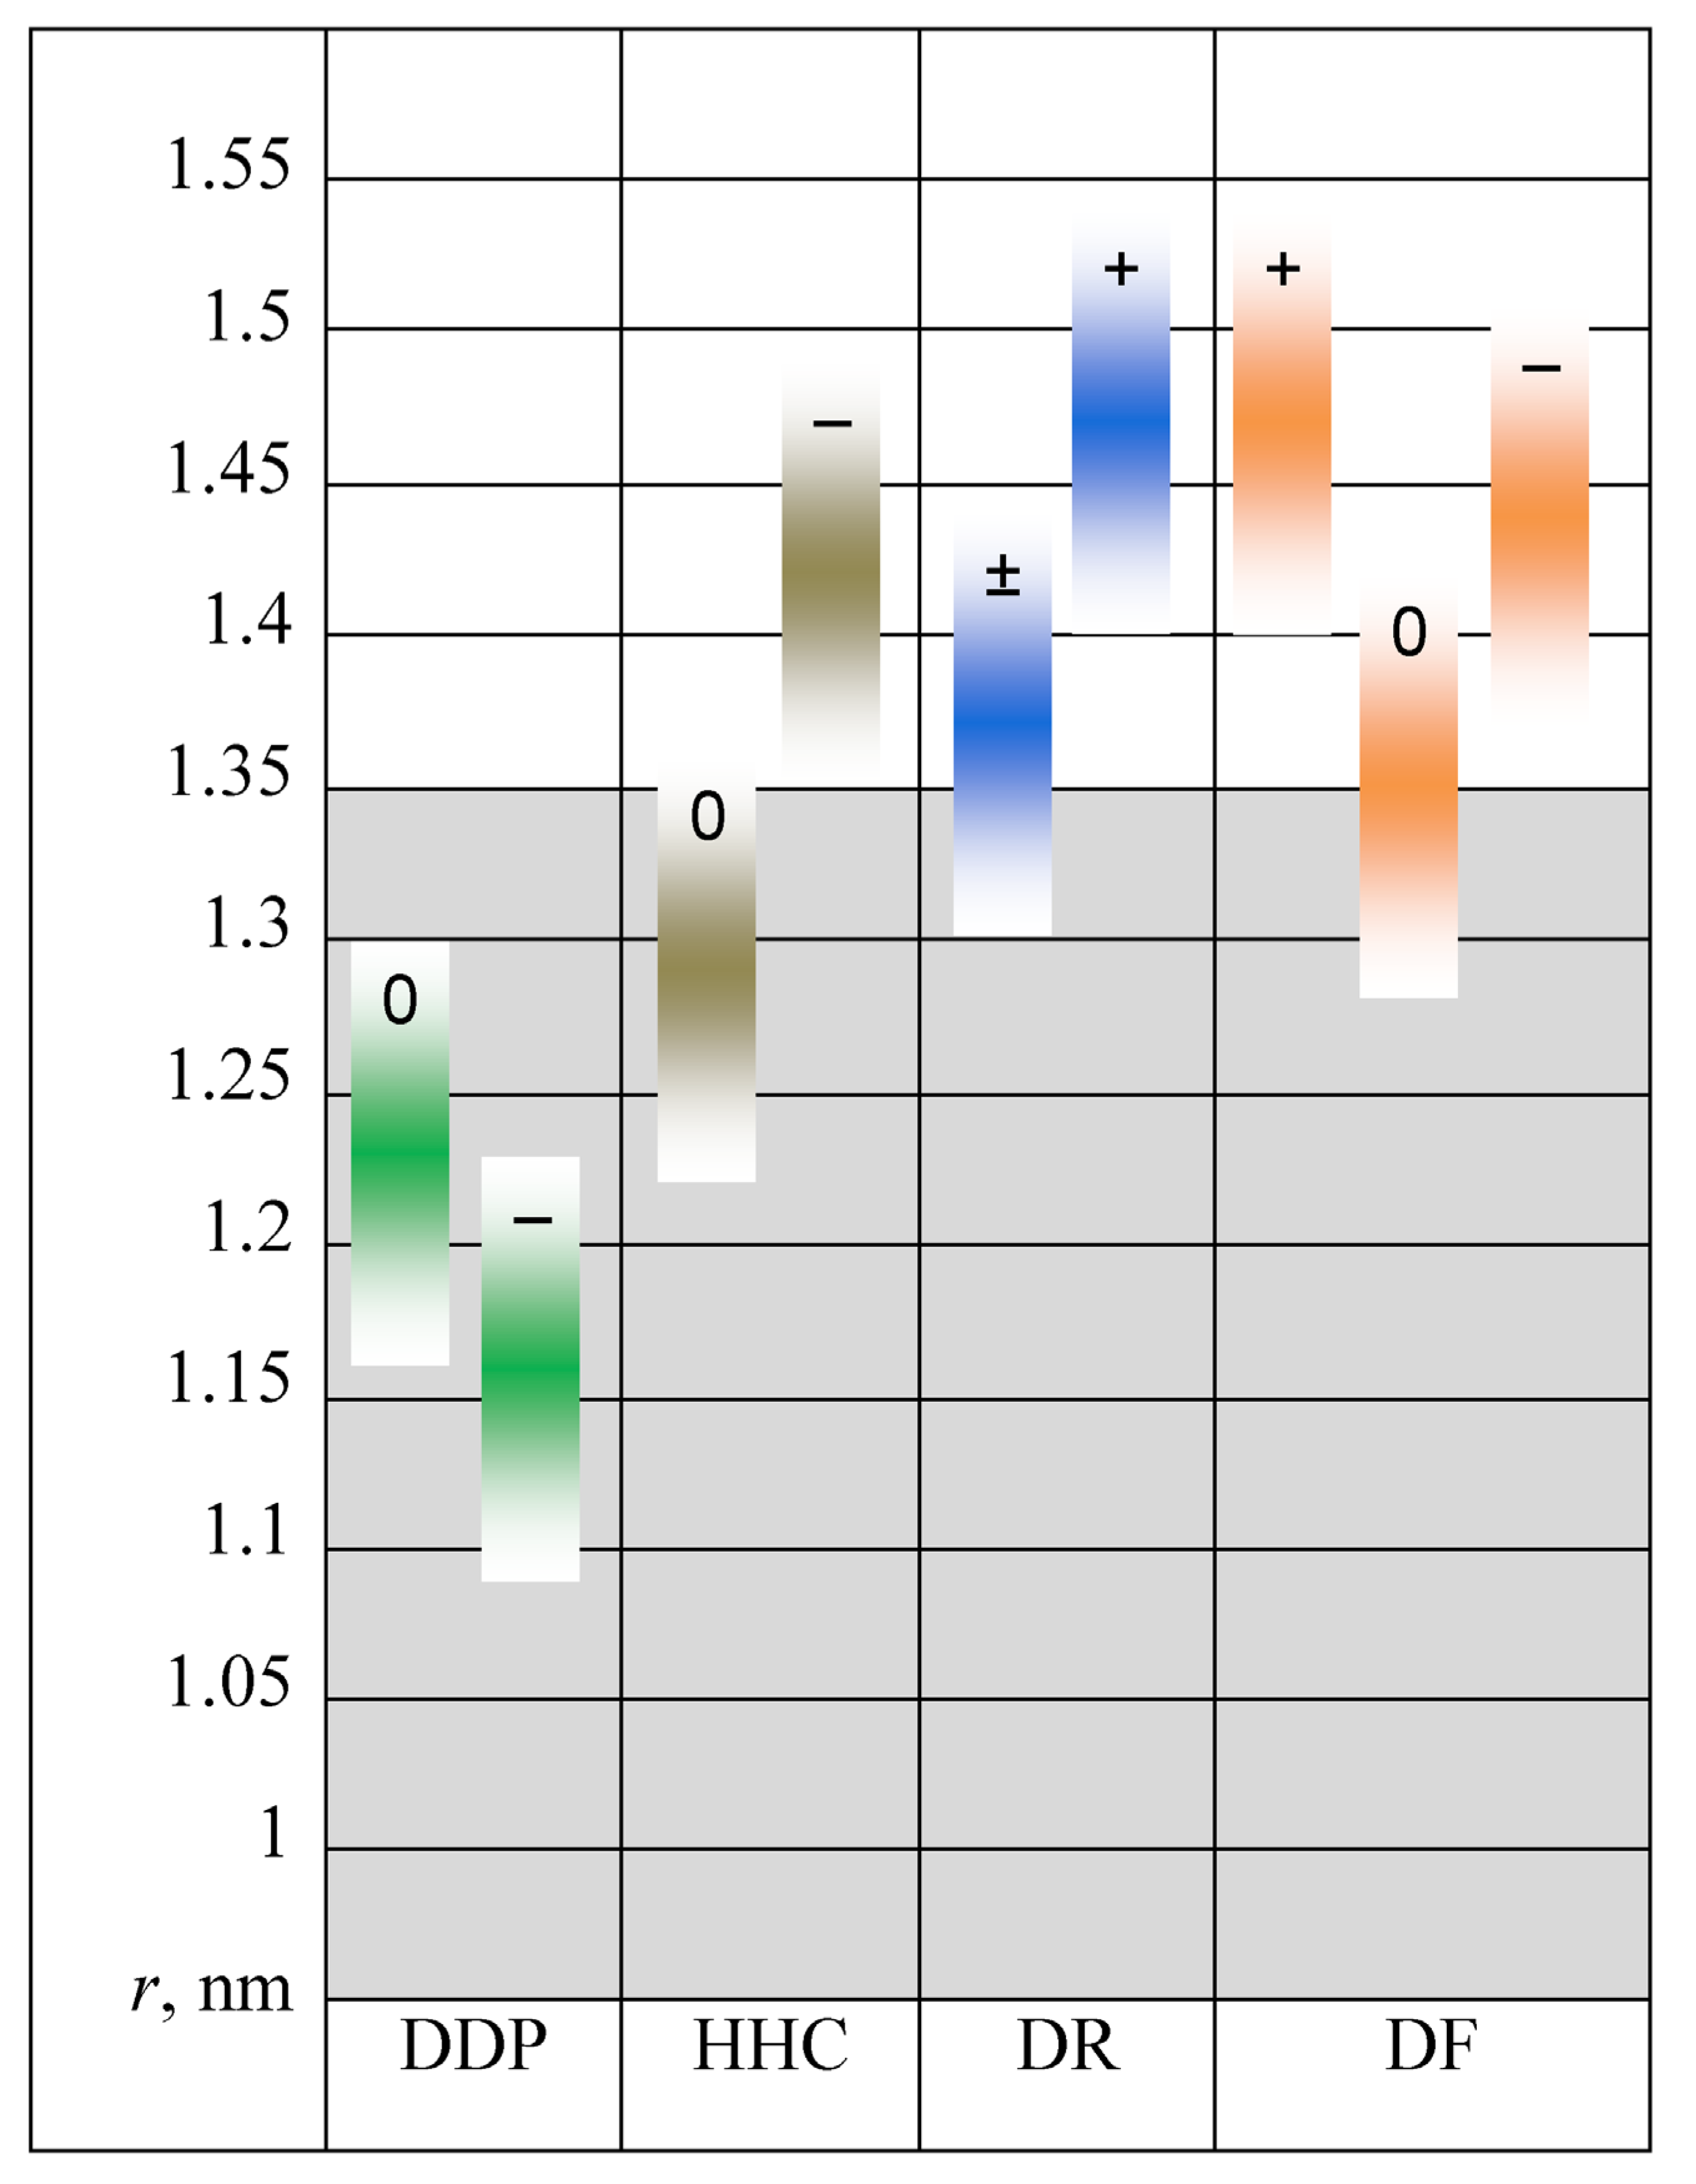
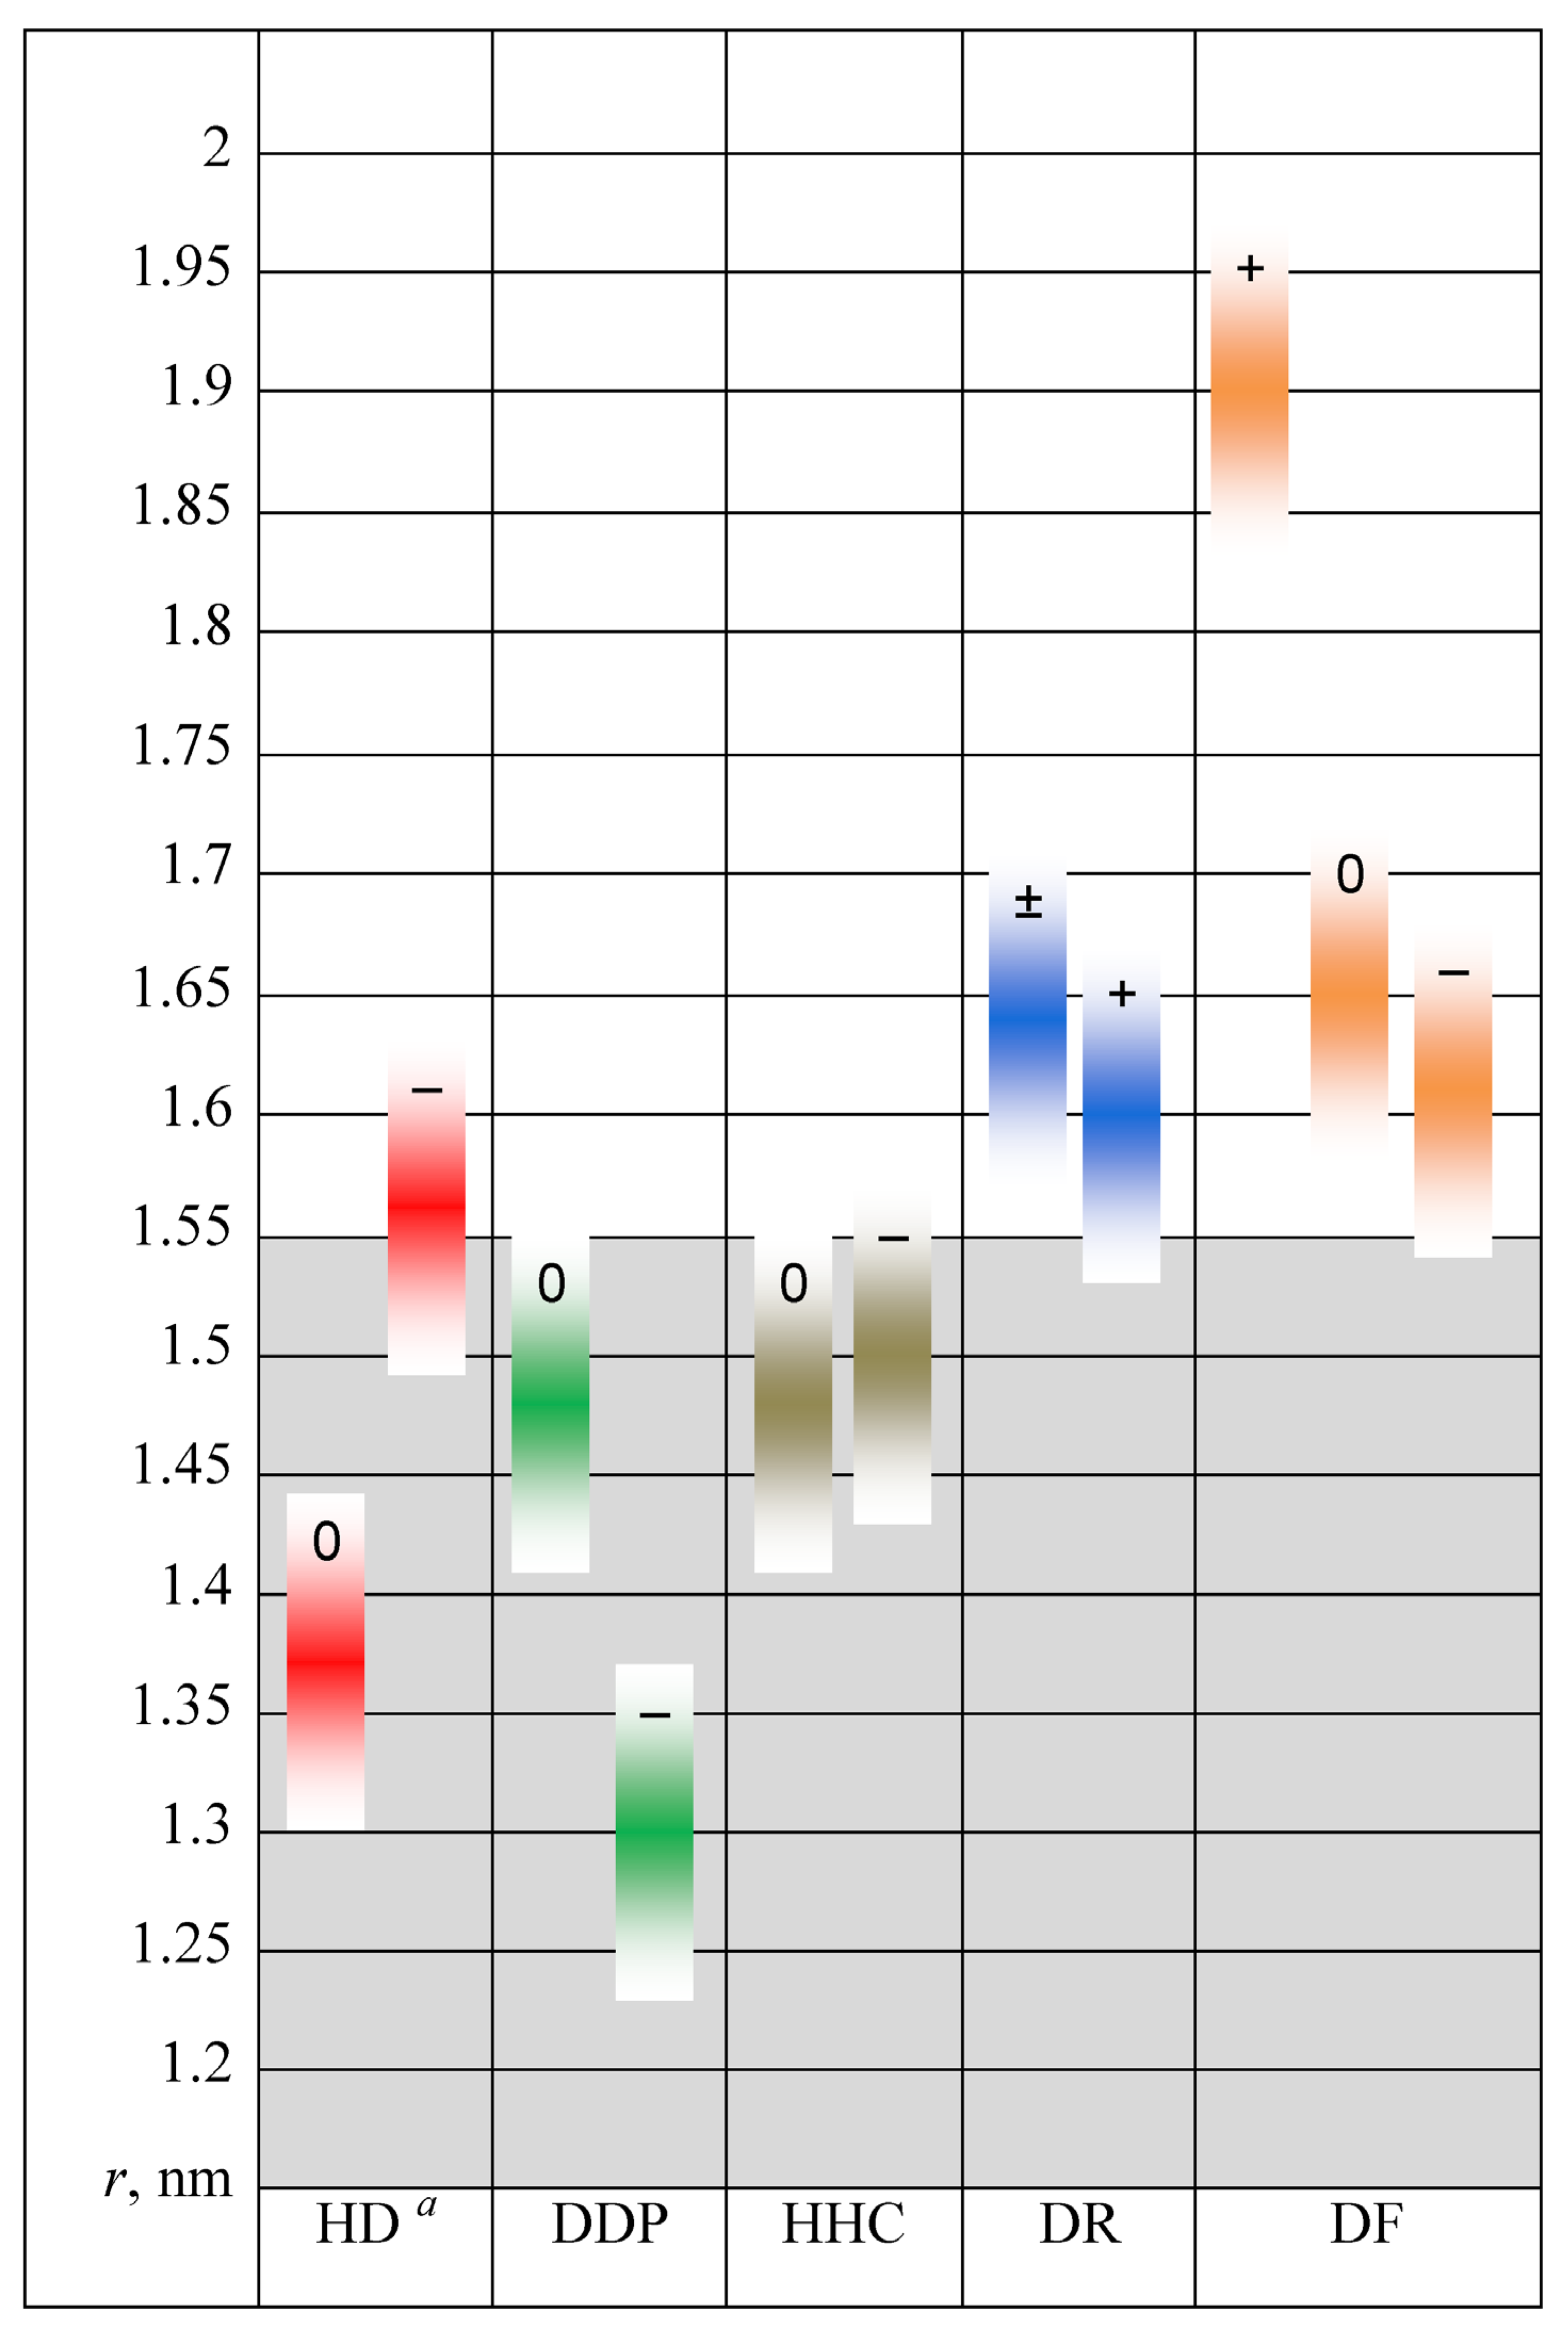
Overall, molecules of most of the dyes are located on the surfaces of the micelles staying in contact with both the hydrocarbon core and the solution. Still, the dyes differ by the depth of immersion (penetration) into the micelles. It can be described as the distance between the micelle center and the dye molecule center. As dye center, it is convenient to consider the
N atom of the pyridinium ring. The average distances are collected in
Table 2 and schematically represented in
Figure 8 and
Figure 9 as a diagram for convenient comparison. The distances below 1.35 nm (SDS) or 1.55 nm (CTAB) are highlighted gray to indicate the approximate extent of the hydrocarbon core. It is difficult to unambiguously set the border because of the ellipsoidal shape of micelles, so we conventionally defined it here as the distance where water fraction appears at least 5%.
Less convenient but a more informative characteristic is the distribution function of this distance,
p(
r), which was computed over MD trajectories and served to find the time-average value. An example of such graphs is shown in
Section 5.5 below.
Three observations stem immediately from the diagrams:
In CTAB micelles, protonation pushes the dye molecule considerably towards the bulk solution by 0.2–0.3 nm, while in SDS micelles the effect is smaller and depends on the dye;
For zwitterionic forms, the immersion correlates with the steric demands of the substituents. Compact dyes RD-H and RD-Cl are in average located closer to the bulk solution than bulky dyes RD-cyclo9, RD-tBu, RD-Ph, and RD-COOH, with rare exceptions. This becomes most evident in the extreme case of RD-PhtBu, which is deeply buried in the hydrocarbon cores of both micelles.
In SDS micelles, the dye RD-PhtBu is located ca. 0.35–0.4 nm deeper in the micelle as compared with other dyes. In CTAB micelles, this difference is ca. 0.5–0.55 nm, which is somewhat larger.
5.3. Orientation of the Solvatochromic Betaine Dyes in Surfactant Micelles
An important aspect of the dye localization is the orientation, or placement, of the dye molecule with respect to the micelle surface. Typically, the molecule is placed either roughly parallel to the surface or perpendicular to it (
Figure 10). Sometimes both orientations are sampled by turns. The particular placement depends mainly on the substituents, while other factors show a smaller effect. The results of our observations are collected in
Table 3.
In more precise terms, we defined the inclination angle of the molecule as ∠(micelle COM, dye N atom, dye O atom) and calculated it for each MD frame. The molecule was said to be in the vertical orientation when
θ was less than 40°. The inverted vertical one corresponded to
θ ≤ 130°, and the horizontal one to 40° <
θ < 130°. Fraction of time, which the molecule spent in a given orientation, indicates probability of the latter. Still, it was important to perform additional visual examination to check the correct identification of the major orientation: simple geometric criteria were insufficient for characterizing such soft and nonspherical particles as micelle + dye aggregates. It was especially important in the case of RD-PhtBu having very deep immersion into micelles. More elaborate analysis was made using distribution functions of
θ,
p(
θ), the example of such functions is shown below in
Section 5.5.
The horizontal orientation is observed as the most often. The dyes RD-Cl, RD-cyclo9, and RD-tBu behave quite similarly, while each of the other dyes has some unique features. The inverted vertical orientation is sometimes adopted by protonated standard dye RD-Ph and is dominant for protonated RD-PhtBu. The neutral RD-PhtBu mostly stays vertical, and neutral RD-COOH in SDS stays in inverted vertical orientation.
We see that the same dye in the same state shows rather similar behavior in both anionic and cationic micelles, which indicates a minor influence of the headgroup charge on this characteristic. This is a quite unexpected result due to the opposite signs of the charge–charge interactions with the micelles.
The substituents also affect the orientation weakly: the zwitterions of RD-Cl, RD-cyclo9, RD-tBu, and RD-Ph behave similarly. Only the extreme cases of the absence of R3 substituents (RD-H) or with very bulky substituents R1 = R2 = R3 ones (RD-PhtBu) express some deviations. The dye RD-COOH is also an individual case because in the zwitterionic form the negative charge is located on the COO− group instead of O−.
The most influential factor appears to be the protonation state of the betaine dyes, which determines the overall charge of the molecule. The protonated forms of all betaine dyes (except of the bulkiest RD-PhtBu) are coherent in having a horizontal orientation in micelles of both surfactants.
To be more precise, for zwitterionic forms, the horizontal orientation is usually skewed towards having the phenolate part somewhat pushed towards the bulk solution. Oppositely, for cationic forms, this orientation implies the molecule being accurately parallel to the surface, or sometimes having the pyridinium part advanced towards the solution.
It is important to compare our data with the information on the locus of the colored zwitterionic form of these dyes in micelles obtained by
1H NMR spectroscopy. Zachariasse et al. [
122] studied the dye RD-Ph in CTAB micelles, with a surfactant: dye ratio of 20:1. It was demonstrated that the dye exerts the largest influence on the methyl groups of N(CH
3)
3+ and the hydrogen atoms of the α and β methylene groups. Hence, the dye is located in the micellar surface region. Tada et al. [
124] have found that the dichloro derivative RD-Cl is rather deeply penetrated into the cationic micelles, though our MD simulations enable concluding that the locus of the RD-Ph dye is deeper (
Figure 9).
For the dye RD-H in cationic micelles, Plieninger and Baumgärtel [
125] deduced from the
1H NMR data the location of the anionic center of the molecule among the N(CH
3)
3+ groups, and exposition of the cationic pyridinium part to water. A reverse picture was proposed for the same dye in the SDS micelles. Here, the pyridinium center of the molecule is situated in the plane of the O–SO
3− groups, whereas the phenolate moiety is “immersed in water layers” [
125]. Our MD simulations did not confirm such a pronounced penetration of this betaine dye towards the aqueous phase. Additionally, the change in the direction of the zwitterion was observed only for three dyes: RD-Ph (protonated form), RD-PhtBu, and RD-COOH. This is the above-mentioned inverted vertical state.
In
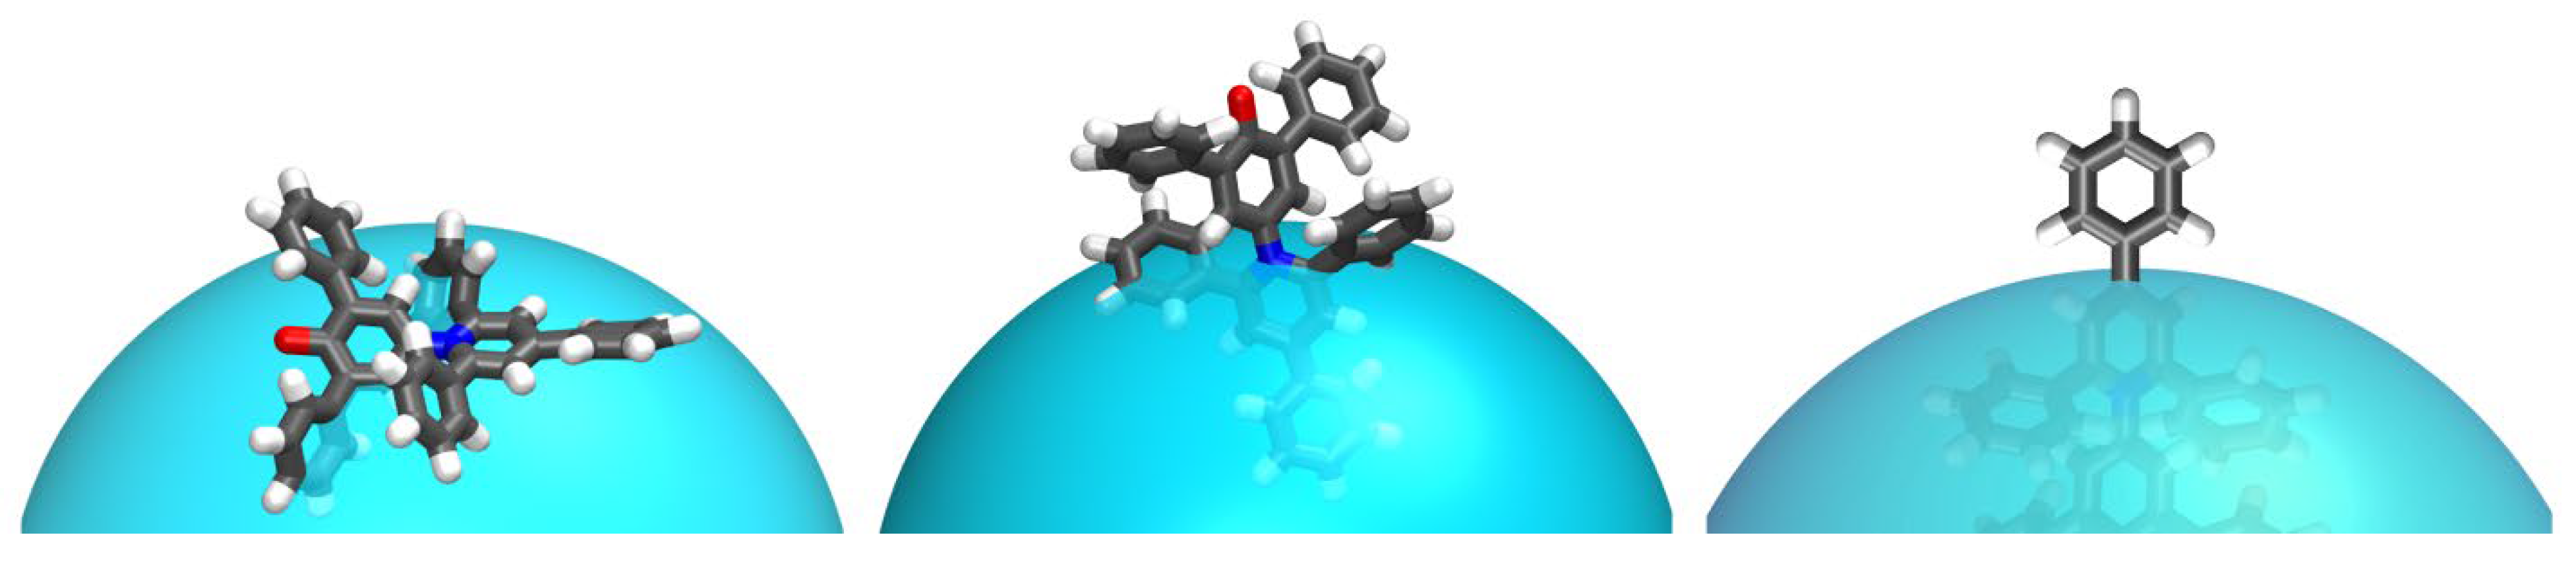
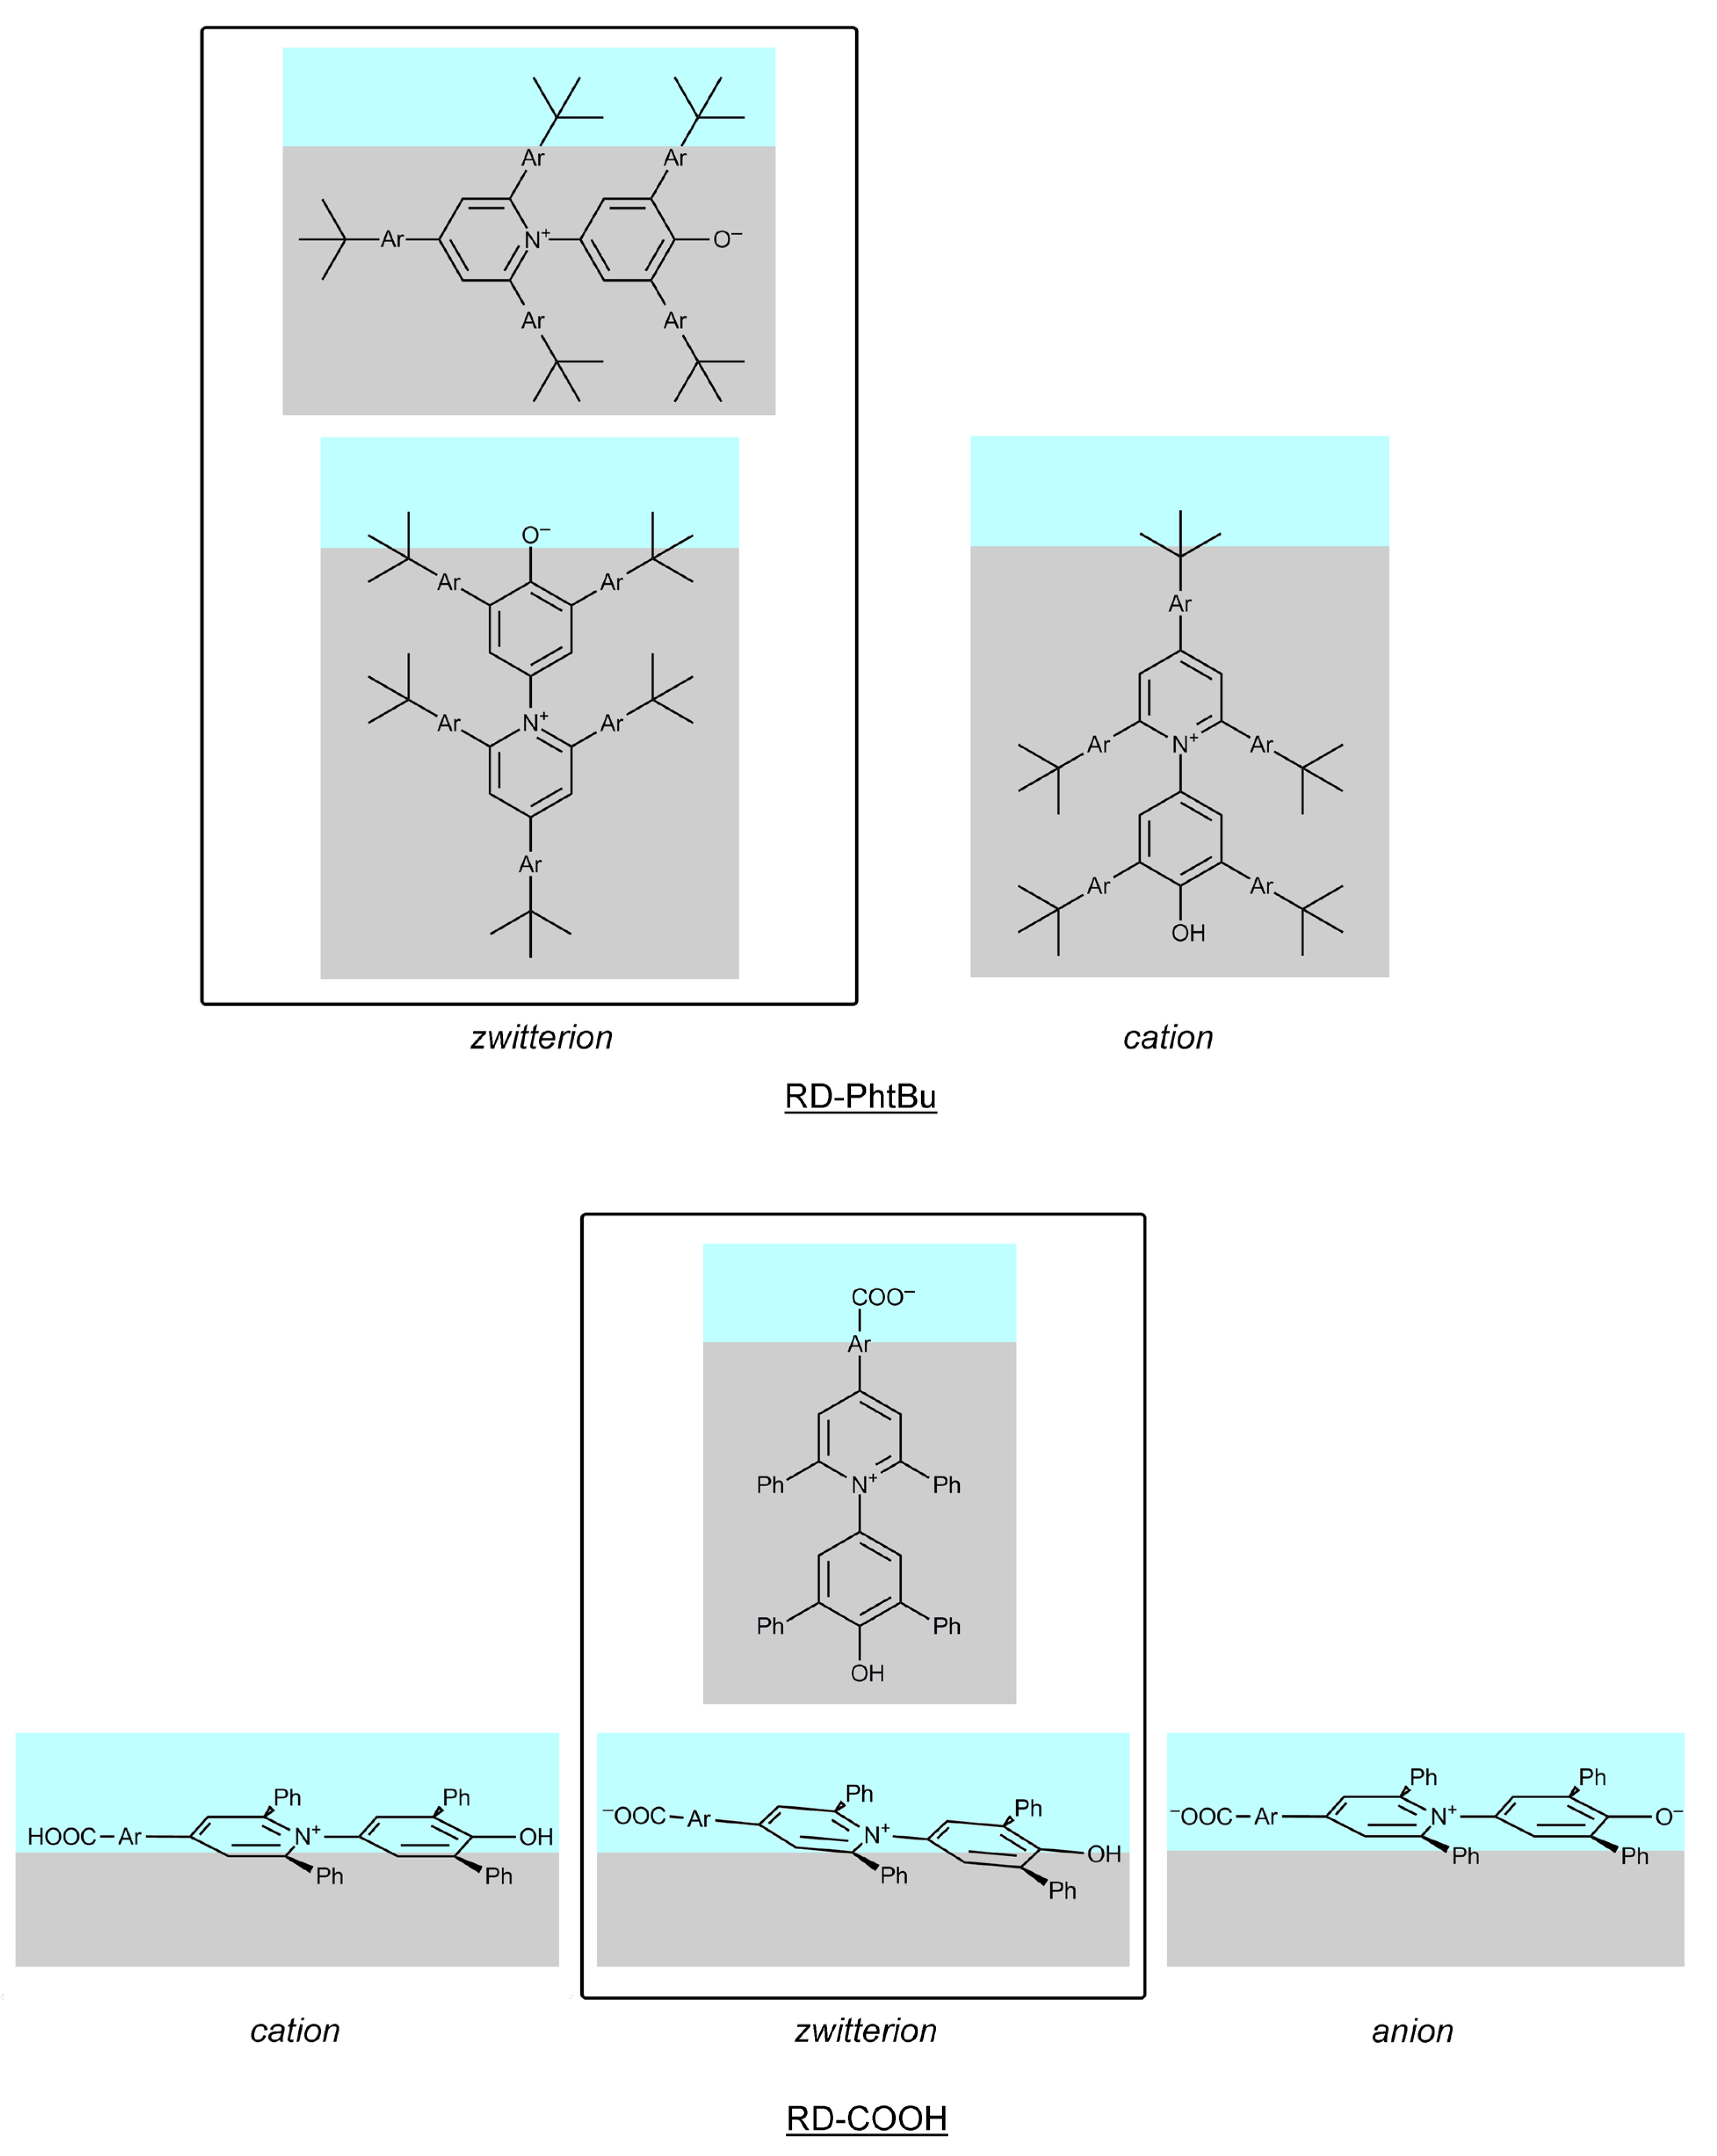
Figure 11 and
Figure 12, the most probable states of Reichardt’s dyes in zwitterionic and cationic forms in SDS and CTAB micelles, elicited from the observation of the MD data, are presented. The orientation of the dyes with the phenolic part placed inside the micelle occurs due to either their extremely pronounced hydrophobicity (RD-PhtBu) or the good solvation of the COOH and COO
− groups (RD-COOH).
The special case of the acid–base equilibria of the last dye is presented in
Scheme 4.
In this case, the colored solvatochromic species is the anion, because of the much stronger basic properties of the phenolate as compared with the carboxylate.
All the above information concerning the location and orientation of different dye species in SDS and CTAB micelles should be understood as an average picture of a huge number of snapshots. It reflects the most probable states of the dyes.
5.4. Hydration of the Solvatochromic Betaine Dyes in Surfactant Micelles
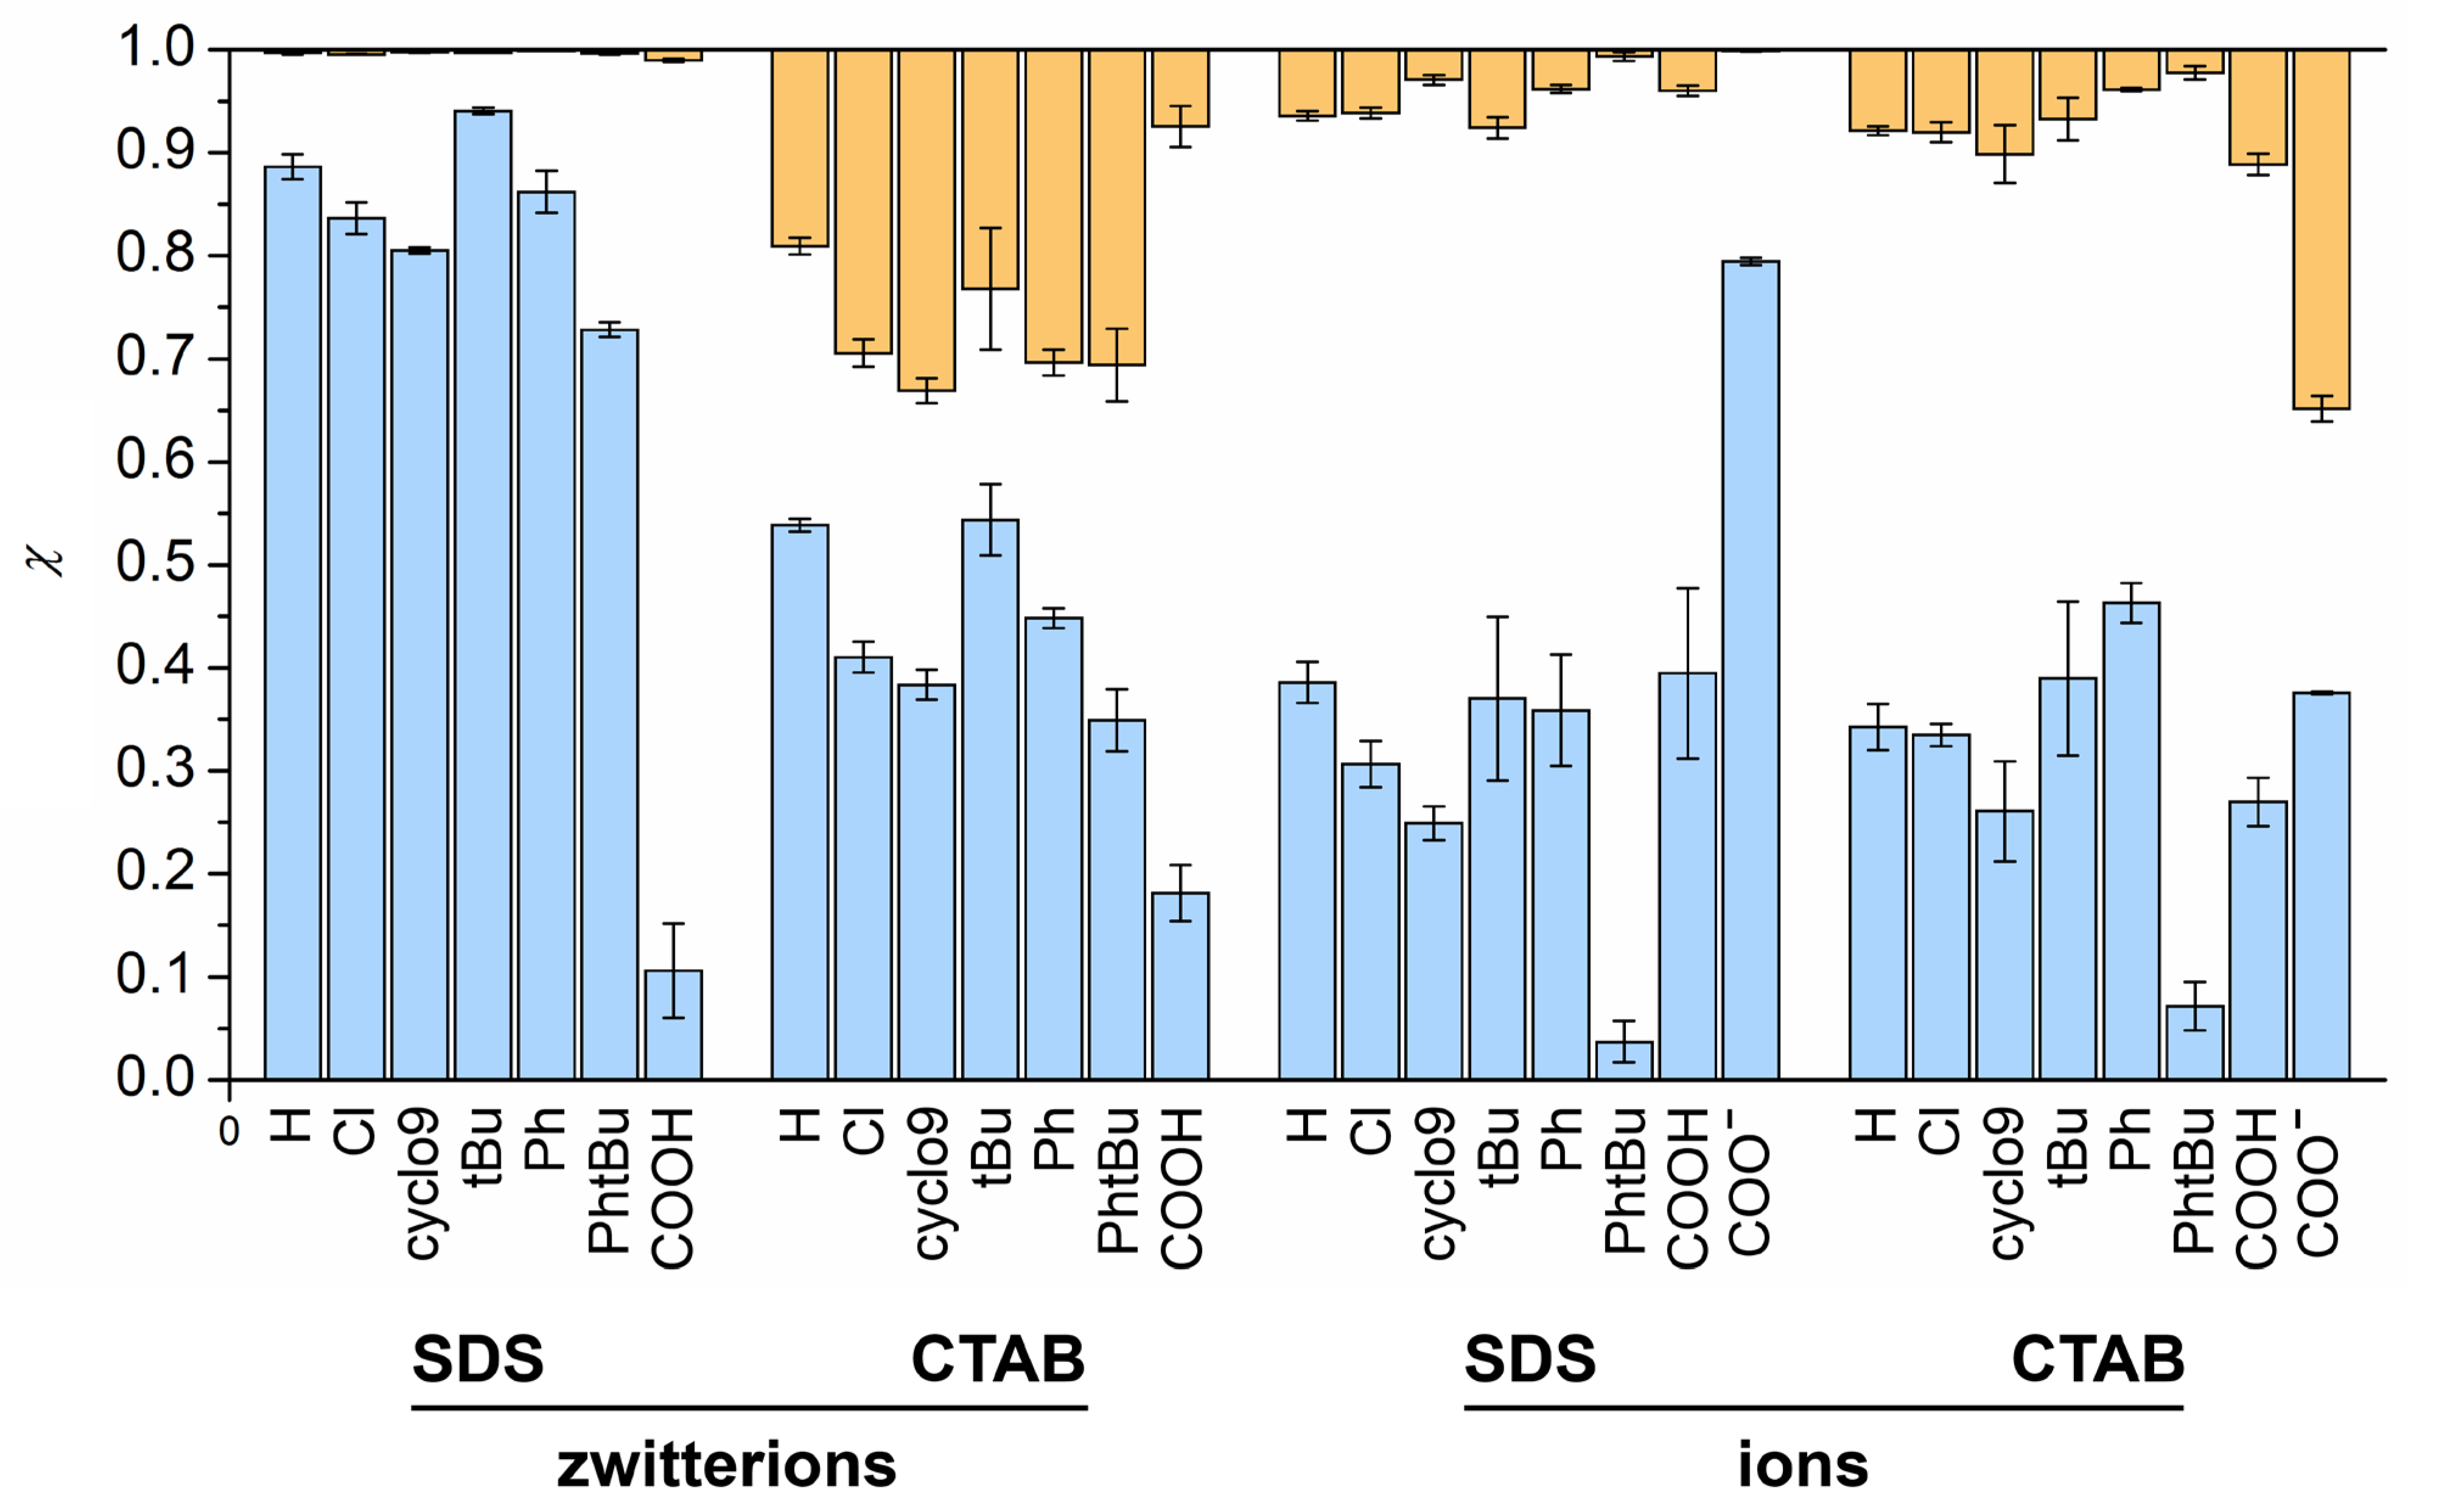
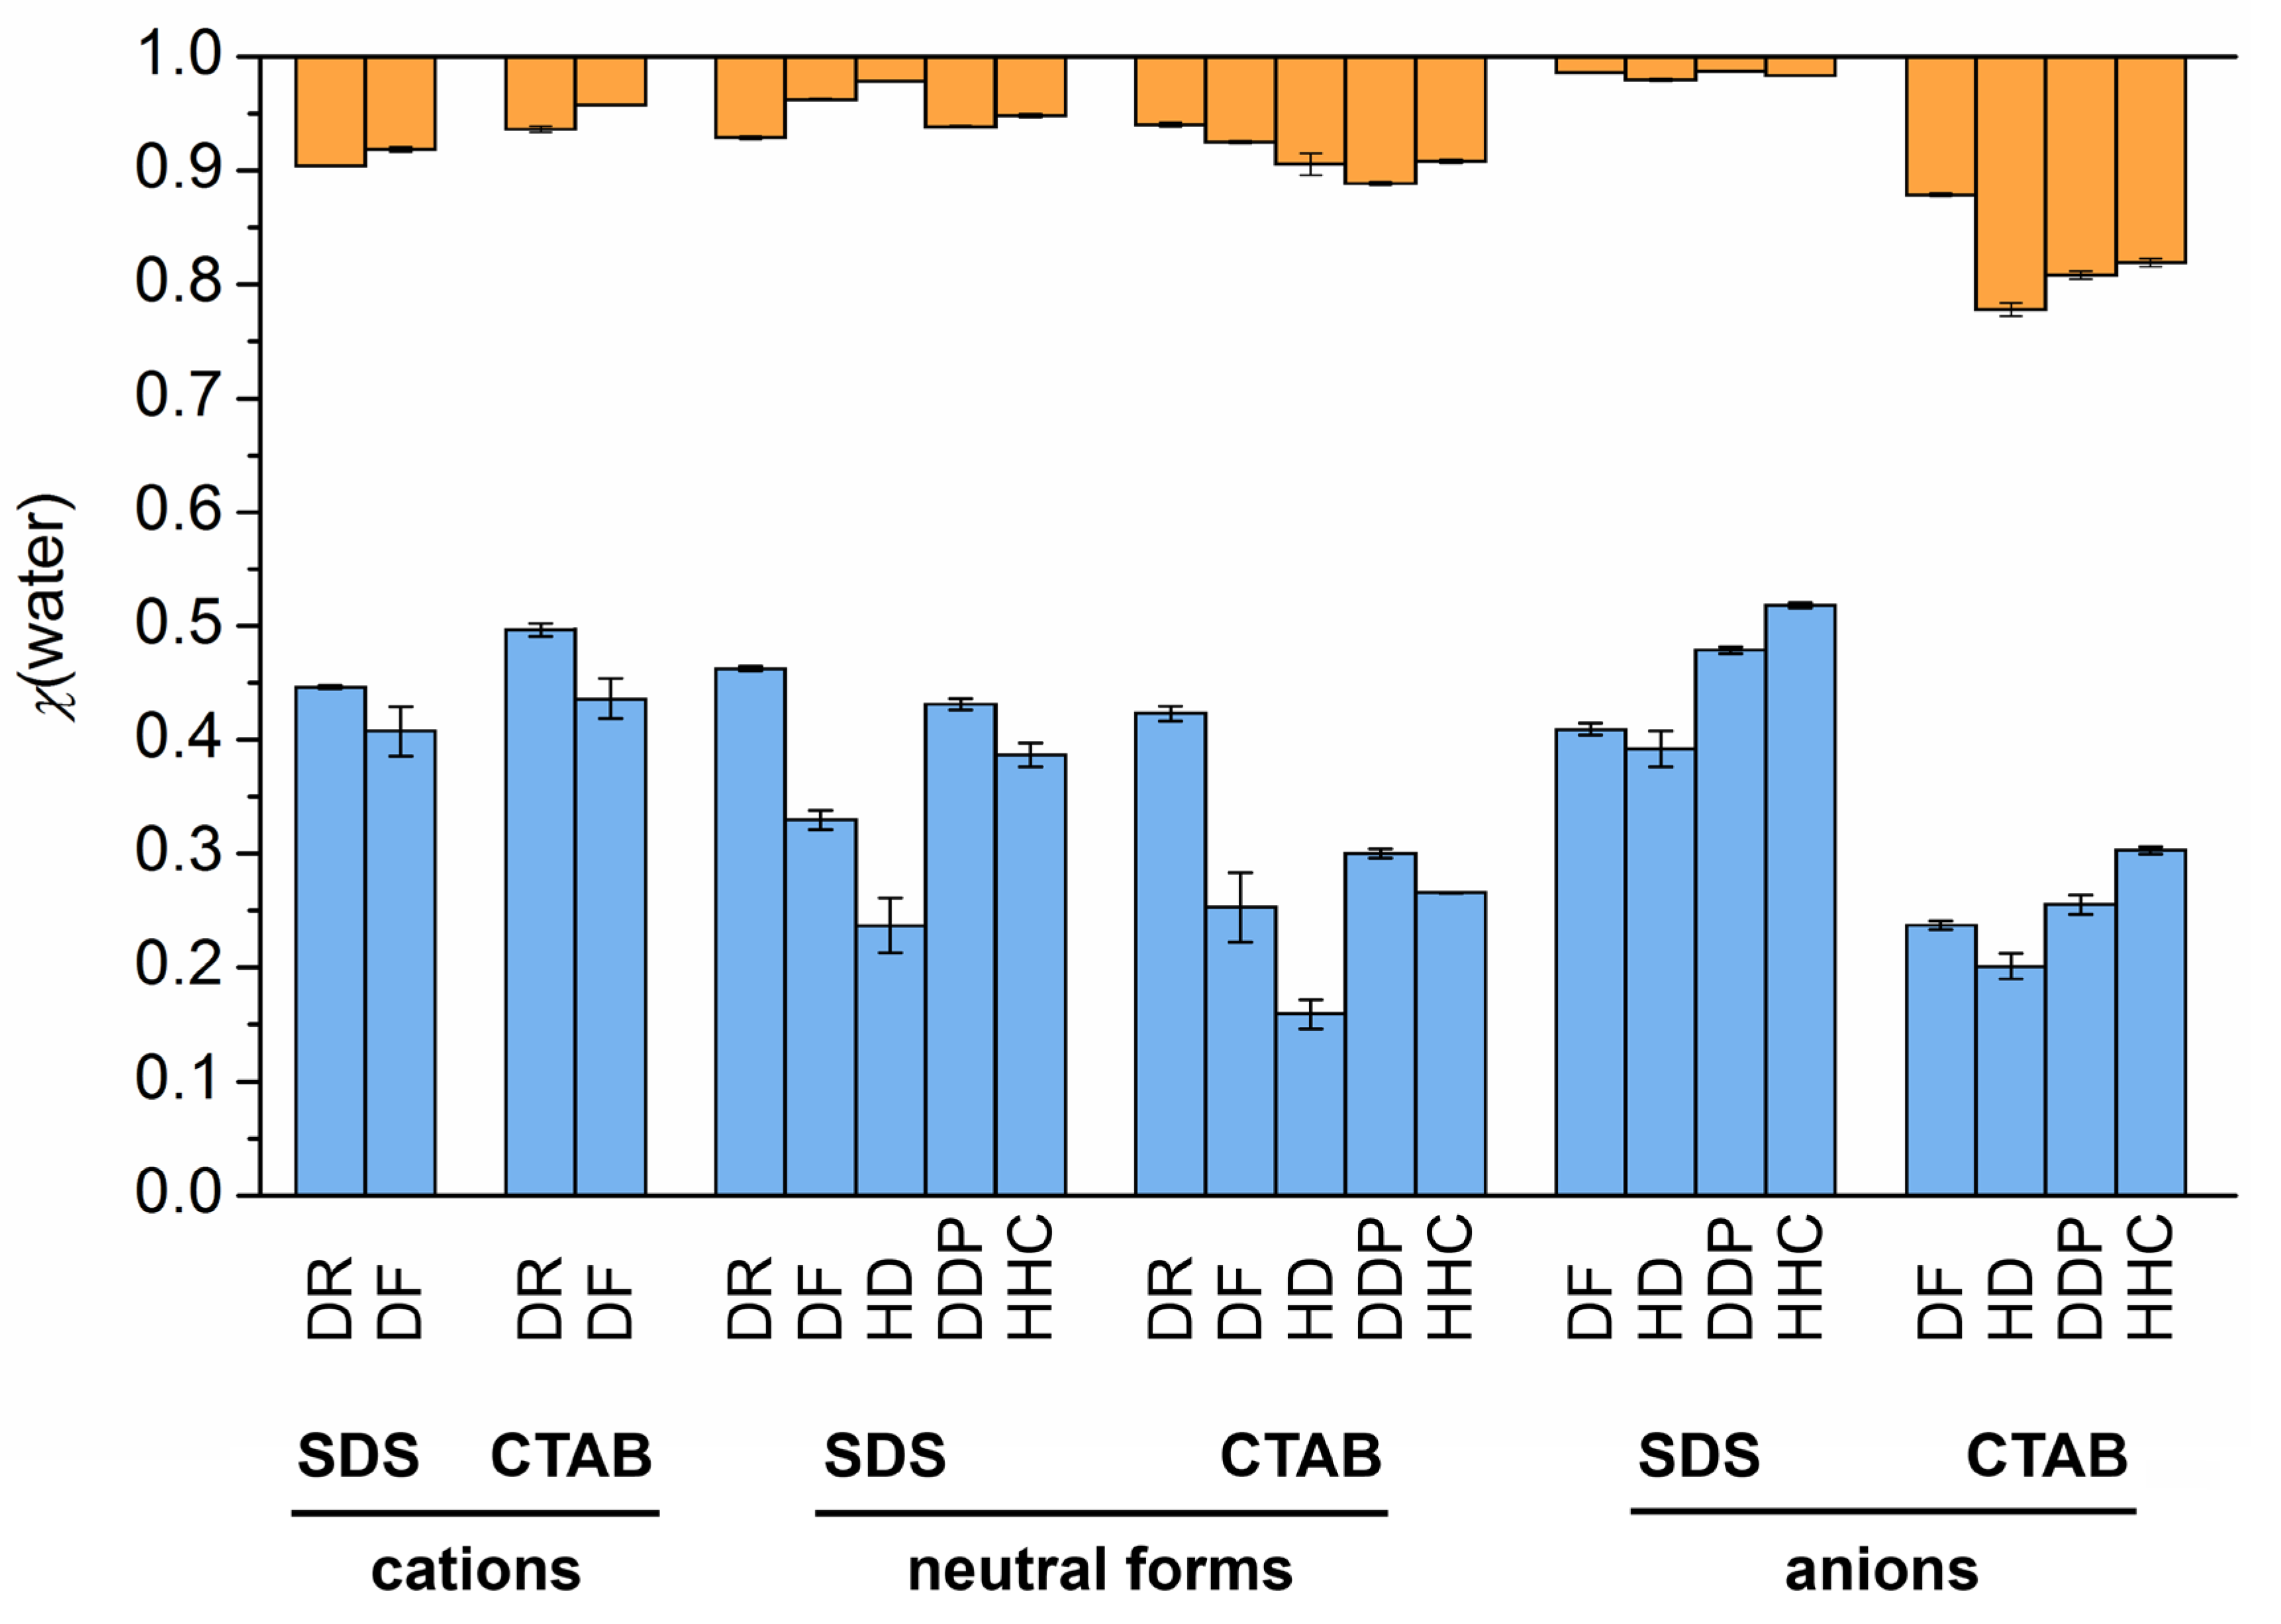
Another essential question that we examined is the local environment, or microenvironment, of the dye molecules. In the surface layer of ionic surfactant micelles, water, hydrocarbon, and electrolyte contact the dye simultaneously, and their proportion affects its visible absorption spectrum. We employed the following approach to elucidate this point. At each time point, the atoms located within 0.4 nm from the dye molecule were enumerated and then divided into three categories: belonging to the micelle hydrocarbon core, belonging to the surfactant headgroups, or belonging to the water molecules. The time-average number of atoms of each category was then computed and converted to the molar fraction of the corresponding component (hydrocarbon, headgroups, or water) in the dye microenvironment. The values for the discussed dyes are presented in
Figure 13. The protonated forms of all the dyes (except RD-PhtBu) have a similar hydration in both SDS and CTAB micelles, regardless of the substituent and surface charge. Only RD-PhtBu is considerably less hydrated, which is natural for its deep localization in the micelles.
For zwitterions, the influence of substituents is somewhat stronger.
Zwitterions in CTAB micelles are ~20% less hydrated than in SDS ones (the average difference of χ(water) is ~0.08 out of ~0.38).
The molar fraction of headgroups around the dye molecules is short (<0.1). Zwitterions in CTAB and cations in SDS have ca. 2-fold more headgroups around than in the other cases.
Overall, if RD-PhtBu is not considered, the degree of hydration varies in a rather narrow interval. This can be explained by the large size of the betaine dye molecules, which facilitates contact with water, and their quite similar localization.
To get additional insight, similar calculations were performed for the individual phenolic O atom,
Figure 14. As will be discussed below, its microenvironment is of a particular importance.
Here, the substituents pronouncedly affect χ(water) in micelles of both kinds. This is natural because of their proximity to the phenolic O atom.
The hydration of the OH group in protonated forms depends only weakly on the surface charge, as it was observed for the whole molecule.
Oppositely, the O− atom of zwitterions is much better hydrated in SDS than in CTAB micelles: the χ(water) difference is ca. 0.4.
While PhtBu shows the weakest hydration of the OH group among the cations (it is almost isolated from water), RD-COOH is at this place among zwitterions. This occurs due to the competition for water with the COO− group in the latter case: the molecule is oriented in such a way that COO− is hydrated well, while OH is mostly immersed into the micellar hydrocarbon core.
Surprisingly, the effect of substituents does not correlate with their steric demand. Under the same conditions, RD-tBu and RD-Ph have the highest χ(water) together with RD-H despite of the bulky R3 groups. Instead, RD-Cl and RD-cyclo9 have lower χ(water), succeeded by RD-PhtBu.
The O− atom of zwitterions strongly attracts cationic headgroups and repulse anionic ones. Instead, the OH group of cations interacts similarly with both kinds of headgroups.
The hydration efficiency of O− atom of the zwitterions +D− in SDS micelles decreases in the following sequence: RD-tBu > RD-H > RD-Ph > RD-Cl >, etc. In turn, in CTAB micelles, an interaction of the negative oxygen with the positively charged alkylammonium groups takes place. The difference between the hydration of cations +DH in SDS and CTAB micelles is not significant. The special cases of the RD-PhtBu and the anion COOH (RD-COO−) in CTAB micelles are quite understandable.
5.5. Influence of Other Factors on the Aforementioned Characteristics
The influence of the length of the hydrocarbon chain of a surfactant on the state of the dye molecule in the micelles was studied separately. For this purpose, simulations of the RD-Ph zwitterion in DTAB and SCS micelles were carried out. In the latter case, the temperature was 50 °C, since at room temperature SCS does not form micelles. To ensure the possibility of a correct comparison with SCS, the simulation of RD-Ph in SDS micelles was repeated at this temperature. It was found that the indicator dye is localized deeper in DTAB micelles than in SDS micelles with the same hydrocarbon chain.
Compared with CTAB micelles, in DTAB micelles the pyridinium part of the indicator molecule is immersed deeper due to the fact that the probability of the orientation shown in
Figure 10b (
Figure 15B) is higher. On the contrary, in the micelles of SCS and SDS (at 50 °C), the molecule is localized and oriented almost similarly.
Thus, the position of the molecule of standard Reichardt’s dye in surfactant micelles during the transition from a hydrocarbon chain of one length to another may change differently, depending on the character of the headgroups.
With regard to the microenvironment, in surfactant micelles with a longer hydrocarbon chain, the hydration of both the molecule as a whole and its O atom somewhat decreases, while the fraction of hydrocarbon around it increases [
57].
In addition to anionic and cationic surfactants, RD-Ph was studied in micelles of the zwitterionic surfactant CDAPSn. It was found that the location and microenvironment of the dye in these micelles are generally similar to those in the micelles of CTAB. The dye molecule is located 0.1–0.2 nm (zwitterionic form) or 0.3–0.4 nm (cationic form) closer to the surface than in CTAB micelles. It is important to note that the molecule is almost not in contact with the negatively charged SO3− fragment, i.e., it is actually surrounded by positively charged [CH2N(CH3)2CH2]+ fragments. This makes its microenvironment in this zwitterionic surfactant close to that in the cationic surfactant CTAB.
Finally, using the example of SDS micelles, the effect of temperature on the state of the solubilized dye in the zwitterionic form was studied. It can be seen that, as the temperature increases from 298 K to 310 K and 323 K, the dye gradually immerses into the micelle, although the difference is small (~0.1 nm) and is observed primarily for the pyridinium fragment of the molecule (
Figure 15A). The orientation of the dye remains generally unchanged (
Figure 16).
The effect of temperature on the microenvironment of the molecule is also insignificant, but in the microenvironment of the O atom the water content gradually decreases from 10.30 ± 0.04 at 298 K to 10.28 ± 0.14 and 9.97 ± 0.09 atoms at 310 K and 323 K, respectively. This can be caused by the thermal expansion of water, because the microenvironment of a constant volume accommodates fewer molecules [
57].
5.6. Hydrogen Bonding of the Solvatochromic Betaine Dyes in Surfactant Micelles
Formation of hydrogen bonds through the phenolic O atom was shown to affect the spectrum of Reichardt’s dyes. MD simulation allows calculating the average number of hydrogen bonds formed between the chosen species,
nhb; therefore, we examined this point in more detail for standard Reichardt’s dye RD-Ph. We used the following criteria to identify an H-bond: (a) donor–acceptor distance no longer than 0.35 nm, and (b) angle ∠ (H atom; donor; acceptor) no more than 30°. As the acceptor, the phenolic O atom was chosen, the donors were water molecules. The results for micellar solutions, as well as for pure water solutions, are listed in
Table 4 (data for selected entire organic molecular solvents and an ionic liquid bmim
+PF
6− are given for comparison). The values of
parameter of these solutions are shown alongside for the Discussion below.
This parameter is defined as follows:
The numbers 30.7 and 32.4 are chosen so that the
values for water and tetramethylsilane are 1.00 and 0.00, respectively. Reichardt’s
parameter is:
Here,
h is the Planck constant,
c is the speed of light,
is the wavenumber, cm
−1,
is the Avogadro number, and
is the wavelength, nm, of the charge-transfer absorption band of the dye. The indicator dye denoted here as RD-Ph was numbered “30” in the original paper, which described a series of similar compounds [
126]. This dye is now known as standard Reichardt’s solvatochromic dye.
Table 4.
Calculated number of hydrogen bonds formed by the O atom of the standard dye RD-Ph with water and the experimentally measured parameter of micelles and organic solutions (in italic).
Table 4.
Calculated number of hydrogen bonds formed by the O atom of the standard dye RD-Ph with water and the experimentally measured parameter of micelles and organic solutions (in italic).
| Surfactant | t, °C | nhb | |
|---|
| No (pure water) | 25 | 2.17 | 1.000 |
| No (pure water) | 50 | 2.08 | 0.969 b |
| SDS | 25 | 1.85 | 0.828 |
| SDS | 50 | 1.78 | 0.810 |
| SCS | 50 | 1.74 | 0.783 |
| Methanol | 25 | — | 0.762 |
| DTAB | 25 | 1.16 | 0.716 c |
| CTAB | 25 | 1.12 | 0.687 d,e |
| bmim+PF6− | 25 | — | 0.667 |
| CDAPSn | 25 | 1.01 | 0.657 d |
| Ethanol | 25 | — | 0.654 |
| Acetonitrile | 25 | — | 0.460 |
| Dimethyl sulfoxide | 25 | — | 0.444 |
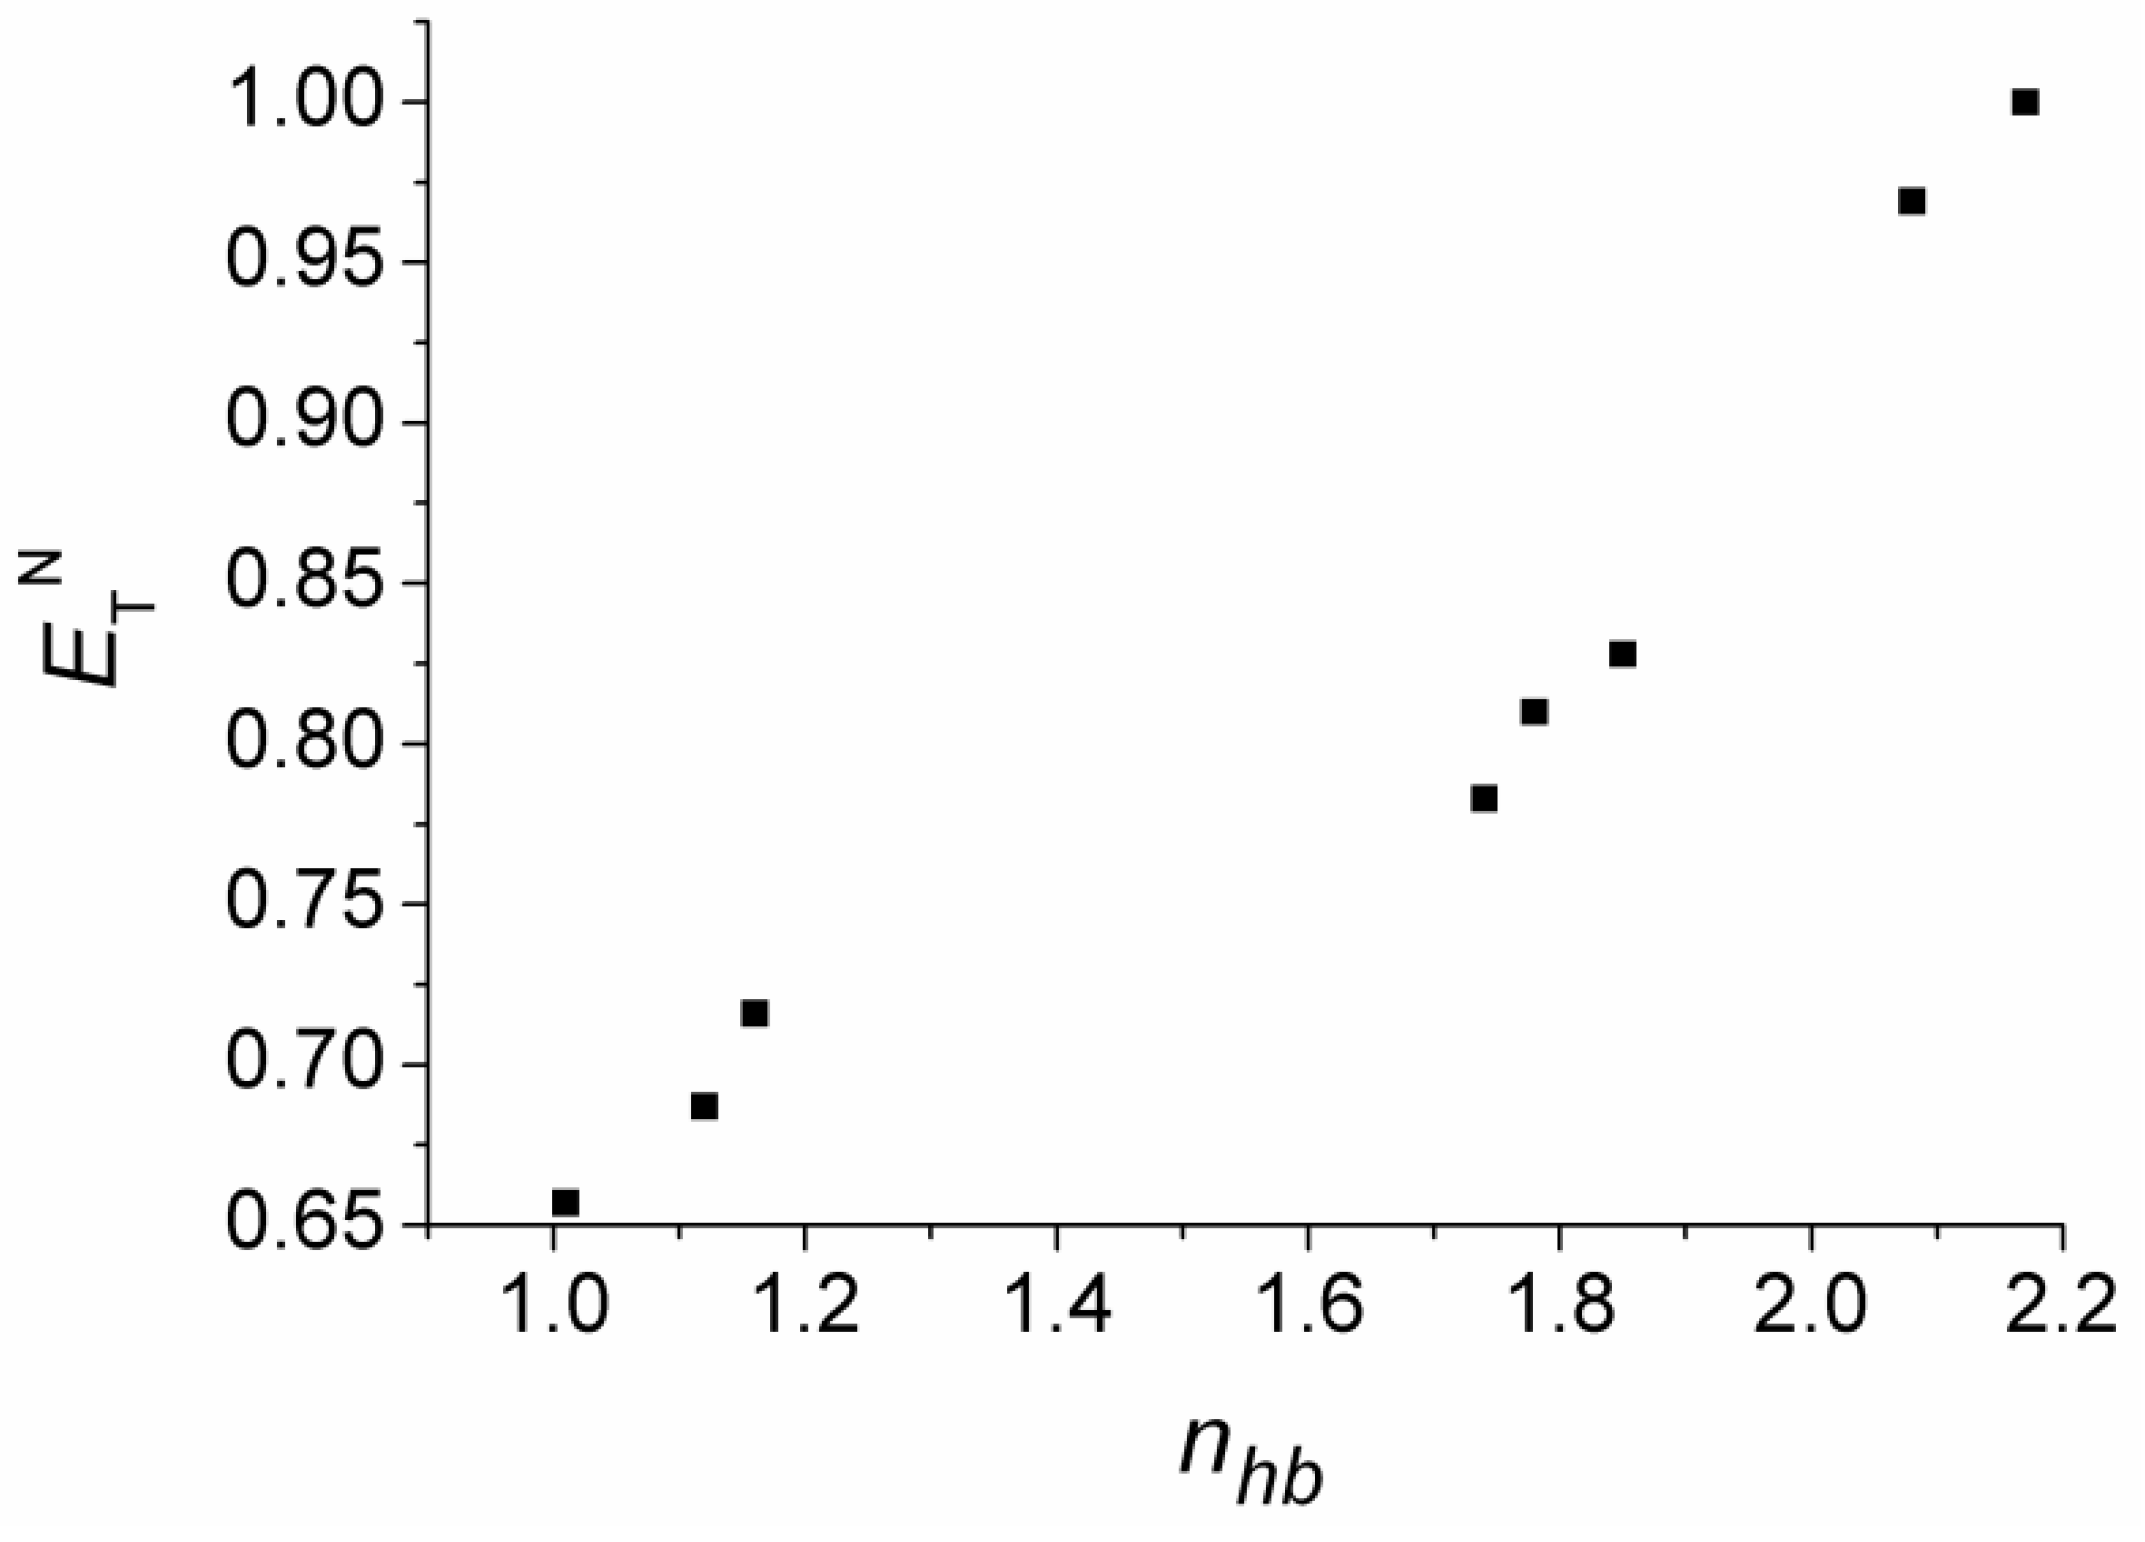
An interesting observation follows from
Table 4: the
(
nhb) dependence is monotonic (
Figure 17). The formation of extra hydrogen bonds with surrounding water proportionally increases the measured polarity parameter. The points in
Figure 16 form three separate groups: alkylammonium surfactants (left), alkylsulfate surfactants (middle), and water (right). Within each group, the dependence is close to linear with almost the same slope: 0.39 for the first two groups and 0.34 for the third one.
This observation has a clear theoretical justification: in the total excitation energy of a Reichardt’s dye molecule a term can be distinguished that corresponds to the difference in the hydrogen-bonding energy between the electronic ground and excited states. It is natural to assume that the number of H-bonds in both states is the same, because according to the Franck–Condon principle, the system has no time to rearrange during the excitation–relaxation act. Therefore, this term is proportional to the number of H-bonds in the ground state (Equation (5)). This explains the linearity of the dependence
vs.
nhb of micellar solutions.
where
E0 and
E1 are the ground and excited state energies of the RD-Ph molecule, Δ
Ehb and Δ
Enon-hb are contributions of hydrogen bonding and of other interactions to
ET(30),
ehb 0 and
ehb 1 are the average energies of a single RD-Ph—water H-bond in the ground and excited states.
Beginning from the publication by Zachariasse et al. [
122], there is a number of papers that give evidence for higher values of the
parameter of SDS and other anionic surfactants as compared with that of cationic ones [
14,
19]. For example, in our laboratory, the values for 16 different anionic surfactant systems, at different concentrations, ionic strength, and temperature, including microemulsions, are determined to be within the range of 0.779–0.835 [
14]. For nine different cationic surfactant systems,
was 0.623 to 0.708, whereas for seven nonionic surfactants, it was 0.645–0.702 [
14]. On the first glance, this allows concluding that the surface of the anionic surfactants is better hydrated than that of the cationic ones.
Moreover, it would not be an exaggeration to say that at least a dozen of publications give evidence for a more hydrated or more polar state of different molecular probes in SDS micelles as compared with those in the case of CTAB. Such information is provided by visible spectra of nitroxides [
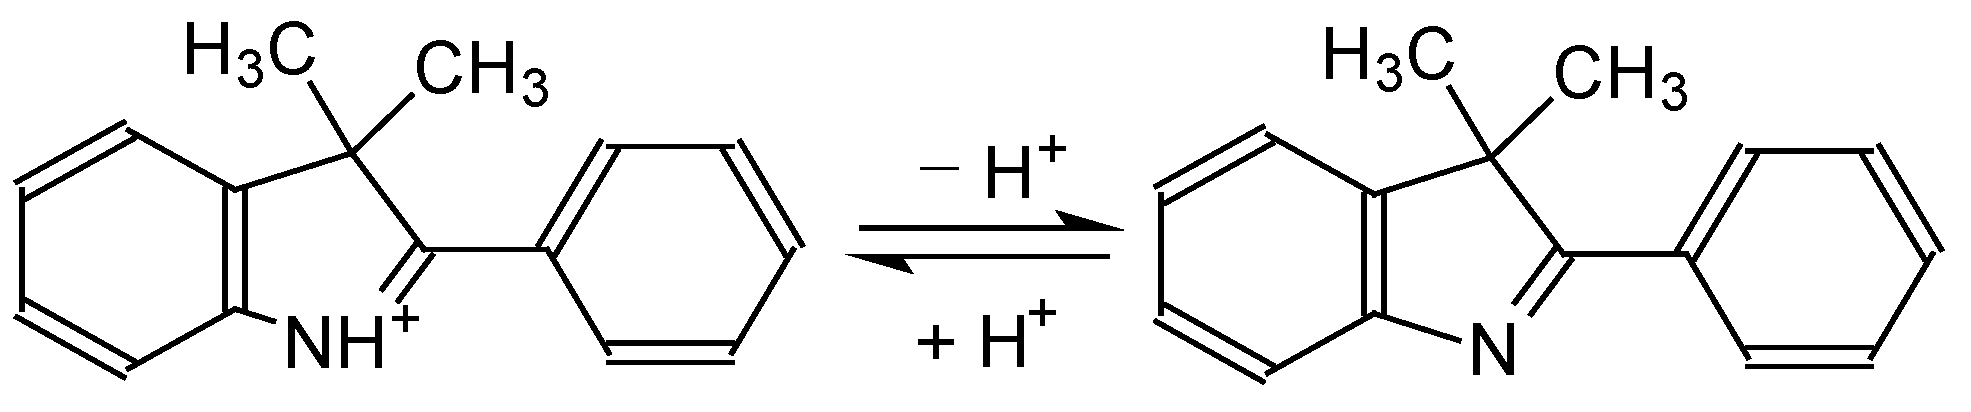
129], fluorescence of 3,3-dimethyl-2-pheny1-3H-indole [
130], fluorescence of rose Bengal B [
131], absorption and
of this dye [
132], and position of the visible absorption maximum of the anion of 4-
n-heptadecyl-7-hydroxy coumarin [
133]. The formation of the nonpolar lactone of
5-(
N-octadecanoyl)aminofluorescein is less expressed in the SDS micellar aqueous solution as compared with cationic and nonionic surfactants micellar systems [
134].
MD simulations demonstrate similar hydration of surfactant ions in anionic and cationic micelles if the tail length is the same (
Figure 1). In contrast, it should be noted that the Krafft temperature for SCS is approximately 30 °C higher than that of CTAB. This allows assuming that the Stern layer of the SCS is less hydrated than in the case of CTAB. At the same time, the
value for SCS, 0.783, even after taking into account the temperature influence (see
Table 4), can be estimated at 25 °C as 0.801 and is substantially higher than the value
= 0.687 for CTAB. Additionally, the
value for SDS, 0.828, is substantially higher than that for DTAB, 0.716–0.724. The corresponding values for CTAC and CPC are close to that for CTAB, and the same is true for DTAB and DTAC [
14,
19]. At the same time,
Figure 1 shows similar hydration of the Stern layers of DTAB and SDS.
Therefore, the different behavior of numerous molecular probes in SDS and CTAB is caused by a more pronounced hydration of foreign molecules involved in the Stern layer of SDS, despite comparable water content on the surfaces of the two micelles. Hence, a hypothesis about the more pronounced hydrogen bond ability of water molecules in anionic micelles can be deduced. In any case, the resulting effect manifests itself in the form of an (apparently) more polar surface of SDS micelles.
Here, it is appropriate to recall a new paper, that allows to shed additional light upon the origin of the
and, accordingly,
values [
135]. The authors consider the problem of one of the most common solvatochromic indicators, the aforementioned Reichardt’s dye, in terms of micro- and macrosolvation. In this work, based on the study of IR spectra in an argon matrix with water additives, it was shown that the direct formation of a hydrogen bond between a water molecule and the oxygen atom of the indicator dye does not itself introduce fundamental changes in the dye, but enhances the effect of the entire solvent continuum. So, even if the true polarity of the micellar surface of CTAB and SDS is similar, more numerous hydrogen bonds in the last case cause an
increase.
In some cases, the location character of the solvatochromic or solvatofluoric dyes is more specific. For example, Pal et al. report that some fluorescent 3H-indoles are able to recognize two different sites in SDS micelles, while only one type of locus is observed in the case of CTAB micelles [
136]. Another very popular fluorescent molecular probe is pyrene [
137]. Thiosemicarbazide and thiosemicarbazide pyrene derivatives are also used for examining CTAB and SDS micelles [
137]. The location of pyrene in surfactant micelles will be considered in
Section 9.
7. Experimental Determination of the Surface Electrical Potential of Micelles Using Acid–Base Indicators
Now it is important to consider different methods used for the Ψ determination (Equation (7)), first, for evaluation of the
in ionic micelles. This question has been systematized by Grieser and Drummond [
13] and afterwards discussed in several articles from this group [
10,
14,
224].
The first approach is based on equating the
to
[
139,
145]. However, it was revealed that as a rule, the
value in nonionic surfactant micelles substantially differs from the value in water [
142,
146,
225]. The above assumption is reasonable only if the surface is well hydrated, and there are some other reasons for using such an approach [
35,
36].
The second approach consists in screening the surface charge of micelles by high concentrations of an electrolyte in the bulk (aqueous) phase [
18,
169,
170,
226]. This allows consider the
value in the same ionic micelles at high ionic strength as the
. However, there is some evidence for incomplete charge screening even at several moles per liter of electrolytes, and too high concentrations also strongly influence the viscosity and other properties of the aqueous phase [
10,
14,
18,
156,
157,
163,
164]. Contrary to the micellar solutions of CTAB and nonionic surfactants, in the case of SDS the precipitation at high NaCl concentrations may occur [
149]. High ionic strength often leads to polymorphic transformations of the micelles. Additionally, the interpretation of the pH measurements using glass electrodes in cells with liquid junction in such salt solutions becomes less obvious.
The third approach uses the
value of an indicator in water–organic solvents for estimating the
value. In this case, two steps are to be made: (i) the composition of a water–organic solvent “s” should be selected, and (ii) the
value should be equated to the difference (
−
) [
19,
133,
134,
144,
147,
156,
157,
163,
164,
227,
228]. The choice of the appropriate composition of the binary solvent is made using the absorption maximum of the dye. This value must coincide with that in the micelles, and the relative permittivity of the mixed solvent is equated to that of the micellar pseudophase. However, it should be remembered that both
values and
s in isodielectric solvents sometimes differ substantially. Additionally, the
values used in the cited papers differ from those estimated by the commonly accepted tetraphenylborate assumption [
10,
14,
224].
The fourth approach proposes to use the
value in micelles of nonionic surfactants as the
in ionic micelles [
10,
13,
14,
62,
95,
144,
146,
149,
229]. This method is probably the most often used. The idea of equating the
to the
of the same indicator located at a noncharged surface was also implemented at studying mono- and multilayers [
40,
41,
43,
44,
45].
The fifth approach presumes utilization of two indicators, which are cationic and nonionic acids, HB
+ and HA, respectively [
99,
144,
162,
183]. The main idea consists in the assumption
=
for the two indicators. This is based on comparing the dependence of the
s of a cationic and neutral hydrophobic coumarins [
144]. Our experiments with the
n-decylfluorescein that is a dual cationic and neutral acid two-step indicator demonstrated that the
=
assumption is not universal [
14].
However, the determination of Ψ values both by different approaches and by different indicators, as a rule, leads to different results for the same ionic micelle.
In
Table 7,
Table 8,
Table 9,
Table 10 and
Table 11, some examples of the Ψ scatter are presented. Here, the
values in micelles of nonionic surfactants were used as the
in ionic micelles, Equation (8). The data refer to the complete binding by all kinds of micelles under consideration, as a rule, at 25 °C or room temperature. The ionic strength is indicated if the exact value is available in the cited papers. At low ionic strength, its variation has a particularly noticeable effect on the Ψ value.
The
values of sulfonephthaleins in cationic micelles gradually increase from bromophenol blue to thymol blue [
167,
168,
175]. For example, Politi and Fendler [
167] reported the values
= –1.25 (bromocresol green); –1.05 (bromophenol red); –0.9 (bromothymol blue); and –0.2 (thymol blue) for a 0.008 M CTAB solution, ionic strength 0.01 M NaCl. Kulichenko et al. [
175] reported the values
= –1.89 (bromophenol blue); –1.51 (bromocresol green); –1.21 (bromocresol purple); –0.70 (bromothymol blue); –0.85 (phenol red); –0.54 (
m-cresol purple); –0.74 (cresol red); and –0.20 (thymol blue) for a 0.06 M tridecylpyridinium bromide solution. Rosendorfová and Čermáková studied three sulfonephthaleins in micellar solutions of a cationic surfactant Septones, 1-(ethoxycarbonyl)-pentadecyl-trimethylammonium bromide (
Scheme 13) [
168]:
At ionic strength 0.2 M, the values
= –0.80 (bromophenol blue); –0.45 (bromocresol green); and +0.12 (phenol red) were determined [
168]. Our study for eight sulfonephthaleins in CPC micelles at ionic strength 0.05 M demonstrated the increase in
from –2.16 for bromophenol blue to –0.37 for thymol blue [
230]. In CTAB at KBr + HBr or KBr + buffer concentrations of 0.005 M, the
s of four sulfonephthaleins change from –2.11 to –0.43 for bromophenol blue to thymol blue, respectively [
231]. Importantly, the same sequence of the
s of the standard series of sulfonephthaleins is observed in binary water–acetone solvents [
232] and in other mixtures of non-hydrogen bond donor solvents (acetonitrile, dimethyl sulfoxide) [
213]. In the last named systems, the
values are substantially positive. It should be recalled here that, while studying acid–base reactions in CTAB micelles, Minch et al. [
233] noted that “intramicellar water has a lower tendency to hydrogen bond with organic molecules than “ordinary” water”. Though the
s in cationic micelles are negative owing to the positive Ψ values, the differentiating influence of this kind of the organized solutions is the same as in the above solvents. The more pronounced the delocalization of the negative charge in the R
2− anion is, the lower is the
value. However, the
values in nonionic micelles obey other regularities. Here, the total hydrophobicity of the compounds is of key significance. Obviously, the use of the
values of these indicators in nonionic micelles will lead to different Ψ values for the same ionic micelles as calculated according to Equation (8).
The data gathered in
Table 7,
Table 8,
Table 9,
Table 10 and
Table 11 may be supplemented by the results reported by Pal and Yana, who determined the
s of seven hydroxyanthraquinones (
Scheme 14) in micelles of cationic, anionic, and nonionic surfactants at an ionic strength of 0.3 M, 25 °C [
149].
The authors compare the electronic absorption spectra and fluorescence in water, organic solvents, and micellar media, and demonstrate the increase and decrease in
values along with increasing concentration of NaCl in CTAB and SDS micellar solutions, respectively. This study presents an abundant material demonstrating the role of the dye location in the interfacial region. The Ψ values, as determined by Equation (8) using the
values in Triton X-100 micelles as
of ionic micelles, vary in a wide range, and in some cases are positive even in SDS micelles [
149].
Fernandez and Fromherz [
144] used the long-tailed indicators 4-undecyl-7-hydroxycoumarin and 4-heptadecyl-7-(dimethylamino)coumarin. At CTAB and SDS concentrations of 0.024 M, the Ψ values at low bulk ionic strength were determined as +148 and −137 mV, respectively. The
values of the indicators, 8.85 and 1.25, were determined in nonionic micelles of Triton X-100 [
144]. The indicator 4-heptadecyl-7-hydroxycoumarin was used by Hartland et al. [
95] for determination of the Ψ value of the SDS micelles at different NaCl concentrations; the
= 9.10 of the indicator in C
12E
8 micelles was used for calculations. At 0.02 M SDS, the Ψ values are −141; −125; −110 mV at 0.007; 0.02; and 0.065 M NaCl, respectively [
95]. Simultaneously, the Ψ values for micelles of series surfactants were determined with this indicator [
133].
Concluding, the Ψ value of the interfacial region of a given micelle at a fixed ionic strength can vary within a wide range, as obtained with different acid–base indicators.
9. Some Other Reporter Molecules
Apart from indicator dyes, another instrument used to provide information about hydration of micelles are spin probes. We investigated a single probe, namely, methyl-5-doxylstearate (
Scheme 17) that was previously examined in SDS and DTAB micelles [
235,
236].
The EPR measurements were originally interpreted as the molar fraction of water in the Stern layer, which was found to be 0.68 in the anionic micelles and 0.44 in the cationic ones. This stays in line with the information from previously discussed dyes, which in general shows higher hydration of the former micelles. We hypothesized that the values are relevant rather to the microenvironment of the spin label alone than for the entire Stern layer. Our simulations of these systems showed that hydration of the O atom carrying the unpaired electron in these micelles is 0.64 and 0.39 if compared with pure water solution, and number of O˙—water hydrogen bonds reduces in a similar proportion. At the same time, hydration of the whole molecule is almost the same in both micelles [
63].
Fluorescent dyes are another important group of molecular probes [
22,
23,
24,
25,
26,
27,
28,
29,
30,
31,
130,
131,
134,
149,
237,
238,
239,
240,
241]. An example of a fluorescent molecular probe that is not a dye in the traditional sense is the above mentioned pyrene [
137]. Its solubility in aqueous micellar solutions is almost five orders of magnitude higher than in water [
242]. The specific features of pyrene emission were used to determine the cmc values of surfactants, micellar polarity, and to investigate the extent of water penetration in micellar systems [
243,
244], to study the partition of
n-pentanol [
95],
n-hexanol, and
n-heptanol [
245] between bulk water and the SDS micelles. MD simulations of the state of pyrene in SDS and CTAB micelles were studied in [
246,
247], respectively. The study revealed that the pyrene molecule is located in the last-named micelles in a more polar region than in SDS micelles [
137,
246]. The reason is the interaction of the electron-rich pyrene ring with the quaternary ammonium groups [
137,
247]. As a result, the pyrene molecule is located not only in the interior cavity, but also in the palisade layer of the CTAB micelles [
247]. By contrast, in the SDS micelles, the pyrene molecule is located in the hydrophobic core region only [
246].
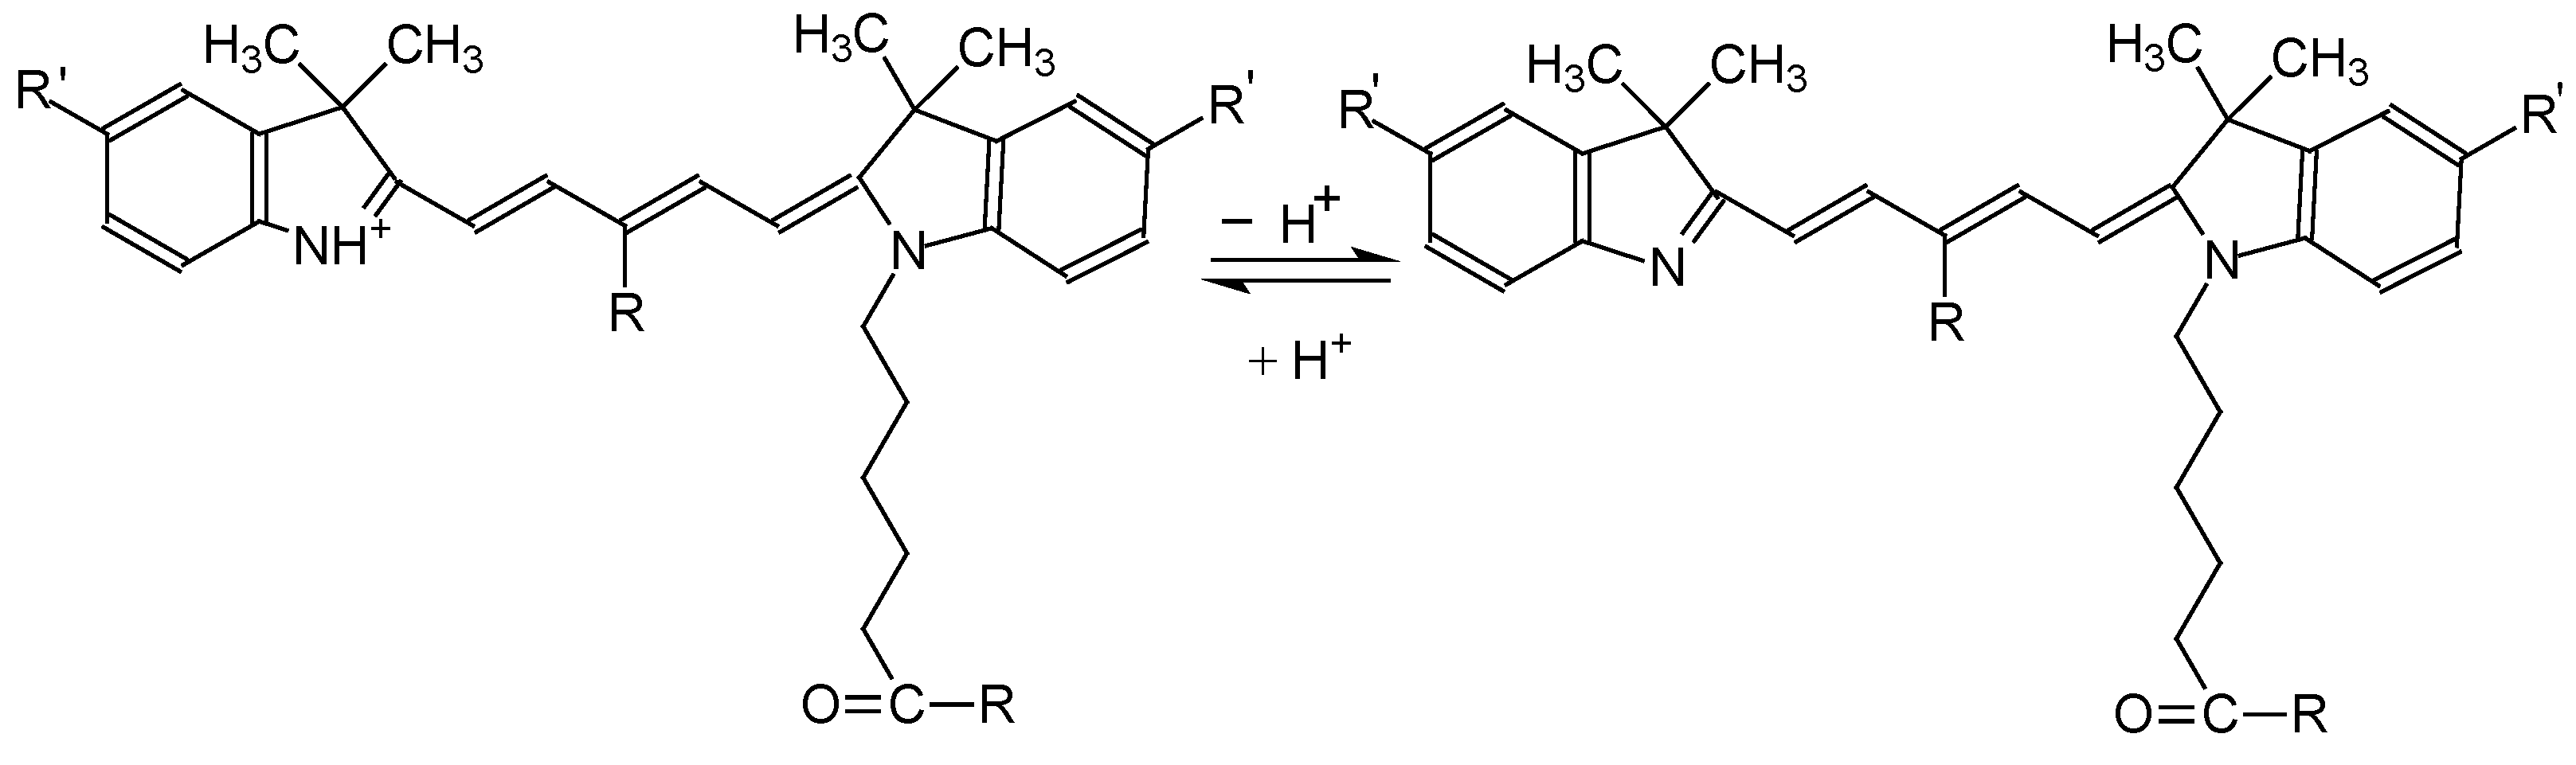
The acid–base indicators considered in the present paper also belong to fluorophores, e.g., coumarins [
23,
25], rhodamines [
24,
31,
51,
52,
151,
152,
153,
154,
155], and fluorescein and its derivatives [
24,
29,
30,
131,
134,
240]. Additionally, fluorescence is used also for determination of the
and Ψ values not only for coumarins (see
Section 6.1), but also for fluorescein dyes [
248]. Therefore, the results of MD modeling of these compounds in micellar media presented above can be useful for a better understanding of the systems where they are used as fluorescent molecular probes, too.
At last, a recent application of our approach for understanding the behavior of substrates in calixarene-based catalytic systems should be mentioned [
249].
10. Conclusions
10.1. Molecular Dynamis Modeling of Micelles
Molecular dynamics modeling of SDS, CTAB, and some other surfactant micelles in water makes it possible to reveal their structure, hydration, and counterion binding. The electrical potential, Ψ, as a function of the distance from the micellar surface and bulk ionic strength may be computed and interpreted in terms of the surface potential Ψ0 and the Stern layer potential Ψδ. Numerical methods of solving the Poisson–Boltzmann equation enable using atomic models of micelles instead of idealized spherical and cylindrical models.
Consideration of the surfactant ions DS− and CTA+ in water without counterions results in appearance of two small micelles in both cases. Hence, the hydrophobic association of the hydrocarbon tails balances the repulsion of the charged headgroups of these small “bare” micelles. The experimental verification is impossible in this case.
10.2. Location, Orientation, and Hydration of Seven Reichardt’s Solvatochromic Dyes in Micelles
In CTAB micelles, the dye zwitterions, +D−, penetrate deeper than the cations. This is not the case in SDS micelles. The dye RD-PhtBu in both forms is situated in the hydrocarbon region. The same is found but much less pronounced for the zwitterions of RD-tBu and RD-cyclo9 in SDS micelles and that of RD-tBu in CTAB.
For the zwitterions, +D−, of the dyes RD-H, RD-Cl, RD-cyclo9, and RD-tBu, the horizontal orientation is most probable, and the vertical one is sometimes found in SDS micelles. For the +DH cations, the horizontal orientation predominates in both kinds of micelles. The inverted orientation, with the phenol part directed to the micellar center, is probable for the cation of the most hydrophobic dye, RD-PhtBu, and for the RD-COOH dye in both forms bearing the OH group.
For the standard solvatochromic dye, 4-(2,4,6-triphenylpyridinium-1-yl)-2,6-diphenylphenolate, RD-Ph, the horizontal orientation is more typical. The orientation, intermediate between inverted and horizontal, can be sometimes expected only for the colorless cation.
The obtained data do not contradict intuitive expectations based on the concepts of hydrophobicity and hydrophilicity of molecules, ions, and their individual fragments. For example, the dye RD-PhtBu, bearing five additional C(CH3)3 groups, is always most deeply immersed into the micelles of both types and hence less hydrated, though some contacts with water molecules nevertheless take place owing to the dynamic character of the surfactant micelles.
This is not the case for solvation of the oxygen atom of the O− and OH groups. Indeed, the hydration of the phenolate oxygen of the +D− forms is much more pronounced in SDS than in CTAB micelles. This is more than a convincing confirmation of the higher value of the value in SDS micelles than in the CTAB ones.
10.3. Hydration of Surfactant Micellar Surfaces: SDS vs. CTAB
MD modeling does not demonstrate a serious difference in the hydration of micellar surfaces of anionic surfactants compared to cationic ones at the same tail length. The consideration of the Krafft temperature allows expecting even a better hydration in the case of CTAB micelles. Therefore, the pronounced exceeding of the values for SDS and other anionic surfactant micelles as compared with those for CTAB is caused by better hydration of the betaine dye. The same can be said about the data obtained with other molecular probes. Hence, it is more correct to speak about the more pronounced hydrogen-binding ability of water molecules in anionic micelles than about better hydration of the anionic micelles themselves.
10.4. Acid–Base Indicators in Surfactant Micelles: Molecular Dynamics Modeling
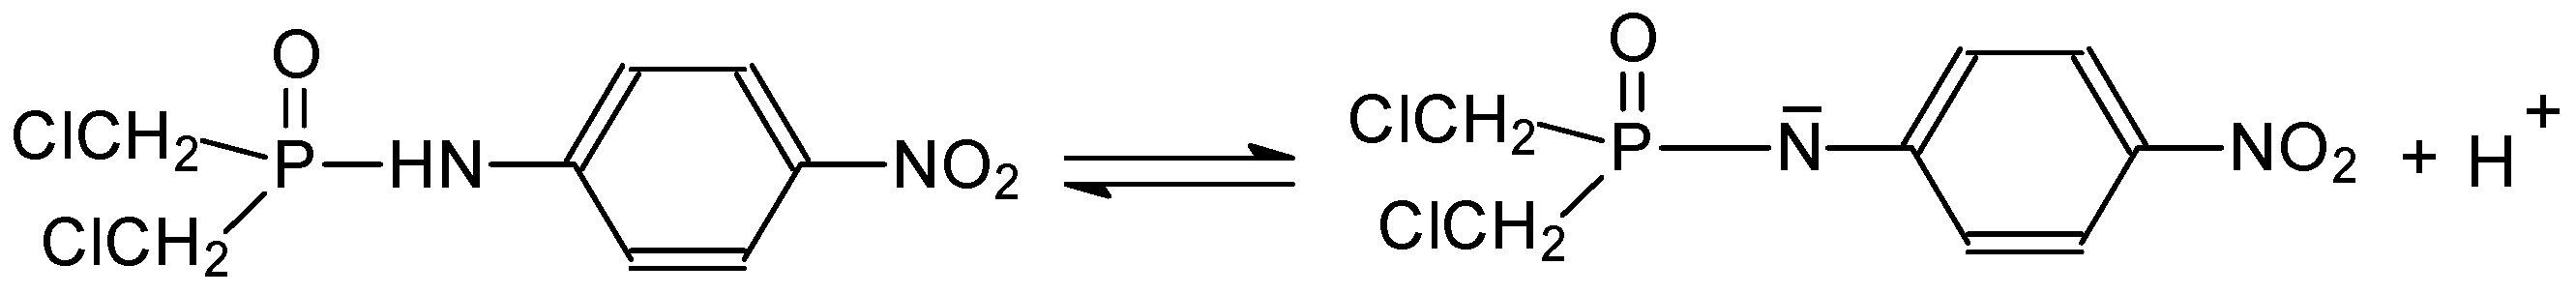
Location, orientation, and hydration of several popular acid–base indicators, used in experiments of Ψ determination, were studied using molecular dynamics simulation. They are 4-[(E)-([1,1′-biphenyl]-4-yl)diazenyl]-2-nitrophenol, a dye proposed in the pioneering work by Hartley and Roe as early as 1940 [
139], 4-
n-heptadecyl-7-hydroxycoumarin, a standard indicator used for this purpose, and three other dyes.
The simulation results generally consistent with the intuitive assumption about the location of acid–base indicators. The dyes are located in such a way that the ionizing groups remain in contact with water and on the surface, while the chromophore part can either lie at the interface between the hydrocarbon core and water, or be immersed in the core. Two positions can be observed for the same molecule as alternating. The immersion depth nontrivially depends on the state of protonation.
The vertical orientation is typical for both forms of 2,6-dinitro-4-n-dodecylphenol and 4-n-heptadecyl-7-hydroxycoumarin, neutral and anionic forms of n-decylfluorescein, cationic form of N,N′-di-n-octadecylrhodamine, and for neutral form of the Hartley dye; this is true for micelles of both charges. The horizontal orientation is typical for anionic forms of the Hartley dye and n-decylfluorescein, for the neutral form of N,N′-di-n-octadecylrhodamine; and it is also observed for some other cases.
Regarding the hydration of acid–base dyes, the important factor is the protolytic form and micelle charge. The neutral (including zwitterionic) forms are slightly more hydrated in anionic micelles, while the anionic forms are much more hydrated. This is observed both for entire dye molecule and for its ionizing group; however, the particular values are dissimilar.
10.5. Determination of the Electrical Surface Potential of Micelles Using Acid–Base Indicators
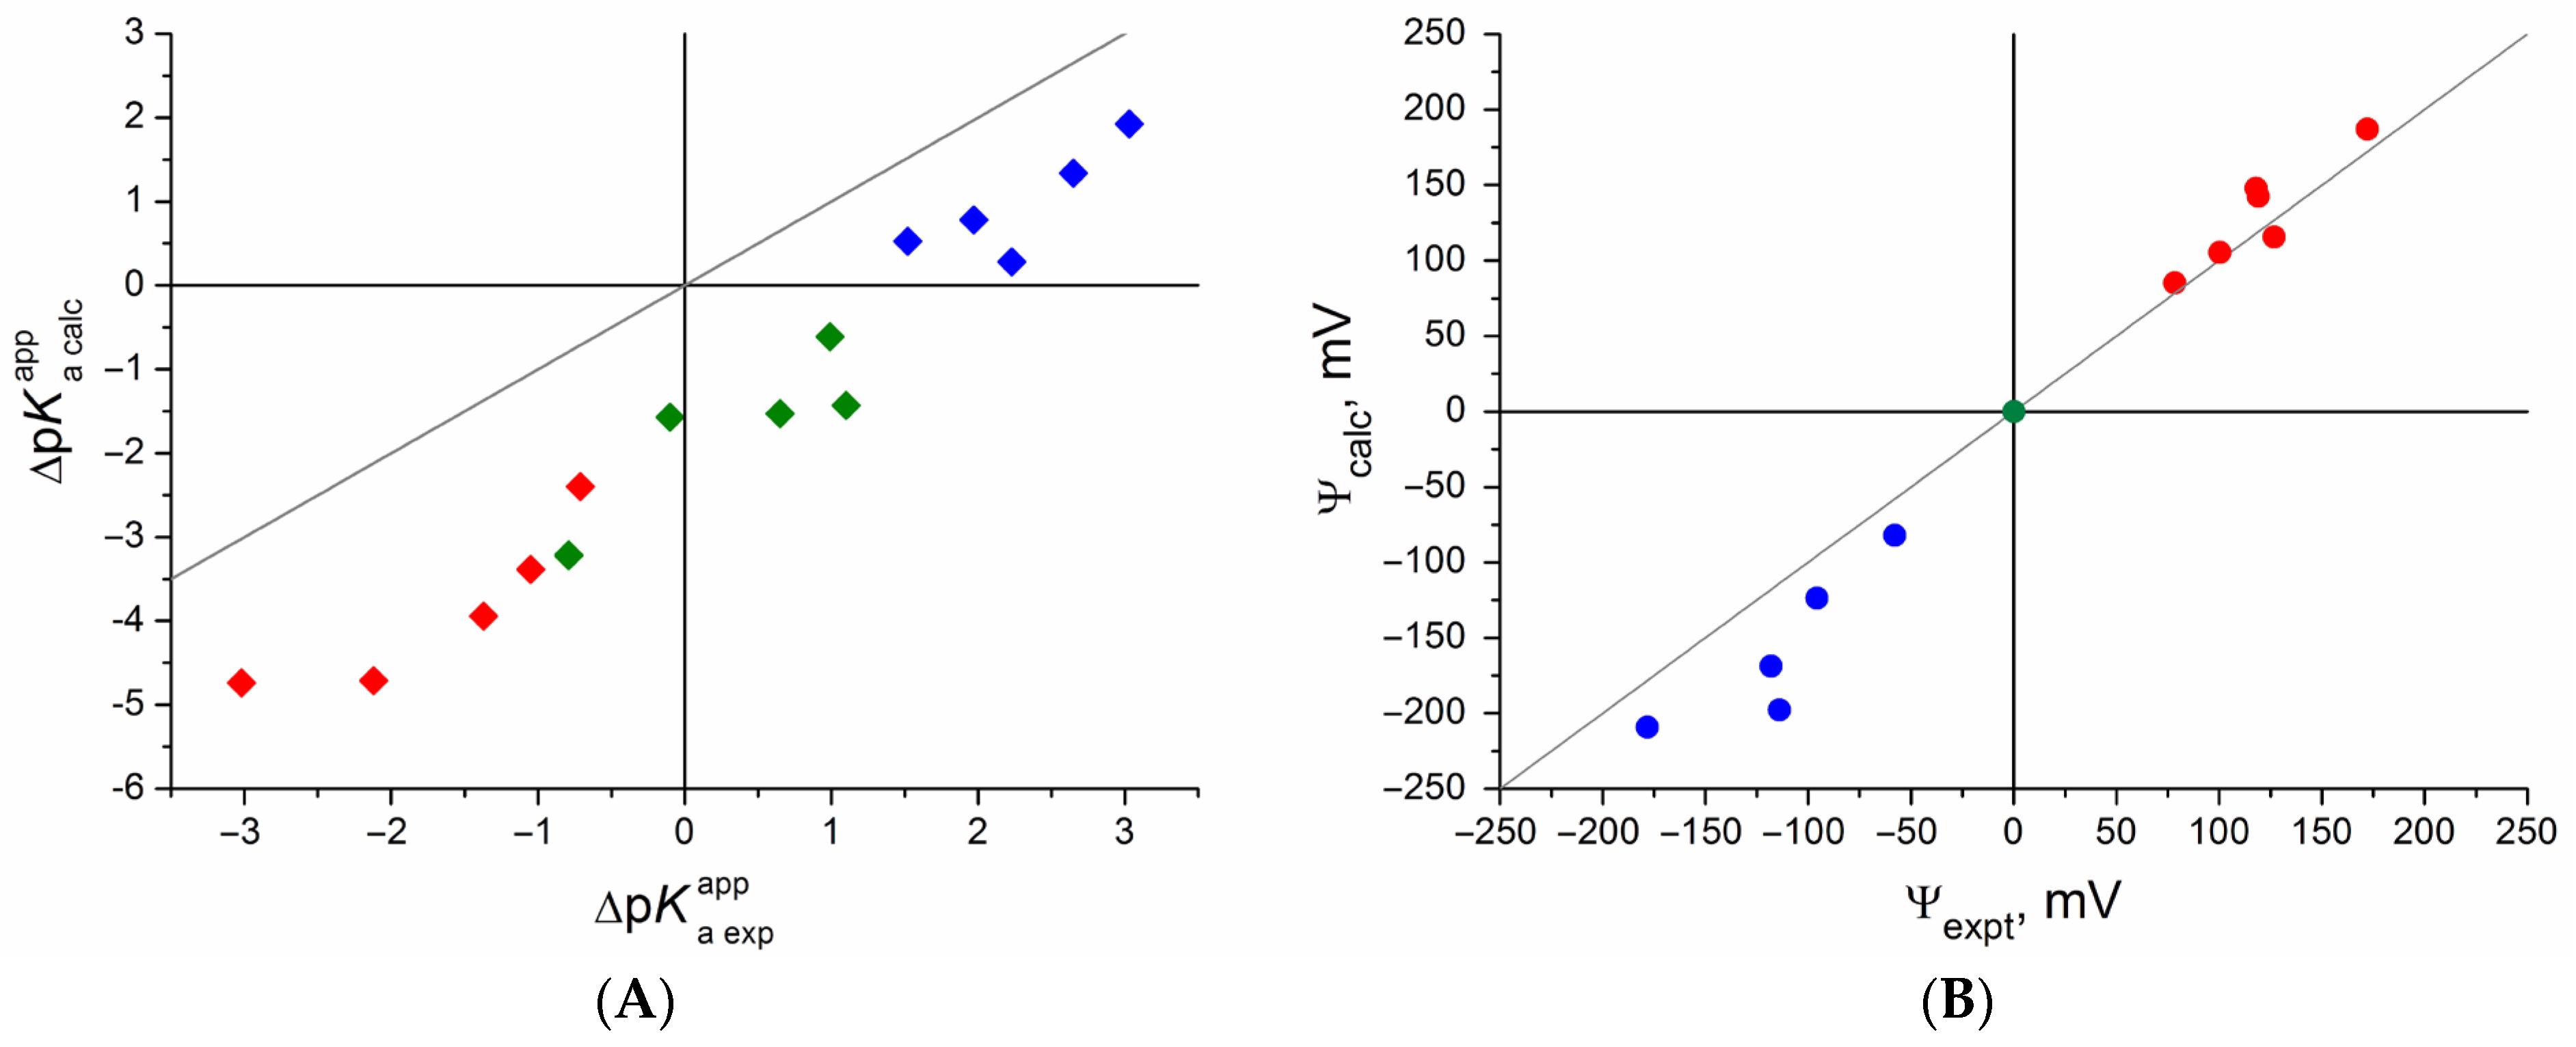
Utilization of techniques for computing free energy changes allows finding values for transferring a dye molecule from water to micelles. The results appear strongly distorted. However, the correlation between experimental and computed values is pronounced and linear. The distortion is explained by the poor reproduction of the hydration energy by used potential models.
Nevertheless, if is computed for both ionic and nonionic micelles, then Ψ can be found from the difference between the values in nonionic and ionic micelles. It may be called in silico implementation of the “wet” method. The calculated values agree well with the experiment: there is almost a quantitative match for CTAB and 35% (in average) overestimation for SDS. The reason is the partial cancellation of error of input values.
The in silico calculation of Ψ is accurate enough to reproduce the variation in Ψ values of the same micelles as determined by different indicators. Hence, this variation is an intrinsic problem of the indicator method of estimating Ψ. We did not find a correlation between reported Ψ values and such characteristics of micelle + indicator aggregates as depth of immersion of the indicator in micelle and its hydration.
Still, the set of dyes currently under consideration is limited, and only TX-100 was studied as nonionic surfactant and used in the assumption that . Therefore, there is room for further developing this issue.


