Article

An X-ray and Neutron Scattering Study of Aqueous MgCl2 Solution in the Gigapascal Pressure Range

1
Key Laboratory of Salt Lake Resources Chemistry of Qinghai Province, Qinghai Institute of Salt Lakes, Chinese Academy of Sciences, Xining 810008, China
2
Department of Chemistry, Faculty of Science, Fukuoka University, Jonan 814-0180, Fukuoka, Japan
3
Synchrotron Radiation Research Center, National Institutes for Quantum and Radiological Science and Technology, Sayo 679-5148, Hyogo, Japan
4
Neutron Science and Technology Center, Comprehensive Research Organization for Science and Society, 162-1, Shirakata 319-1106, Tokai, Japan
5
J-PARC Center, Japan Atomic Energy Agency, 2–4, Shirakata 319-1195, Tokai, Japan
*
Author to whom correspondence should be addressed.
Present address: Research Institute, Maeda Road, 208 Oohata, Tsuchiura 300-4111, Ibaraki, Japan.
Liquids 2023, 3(3), 288-302; https://doi.org/10.3390/liquids3030019
Submission received: 16 May 2023 / Revised: 20 June 2023 / Accepted: 22 June 2023 / Published: 4 July 2023
(This article belongs to the Special Issue Hydration of Ions in Aqueous Solution)

Abstract

:
The structure of electrolyte solutions under pressure at a molecular level is a crucial issue in the fundamental science of understanding the nature of ion solvation and association and application fields, such as geological processes on the Earth, pressure-induced protein denaturation, and supercritical water technology. We report the structure of an aqueous 2 m (=mol kg−1) MgCl2 solution at pressures from 0.1 MPa to 4 GPa and temperatures from 300 to 500 K revealed by X-ray- and neutron-scattering measurements. The scattering data are analyzed by empirical potential structure refinement (EPSR) modeling to derive the pair distribution functions, coordination number distributions, angle distributions, and spatial density functions (3D structure) as a function of pressure and temperature. Mg2+ forms rigid solvation shells extended to the third shell; the first solvation shell of six-fold octahedral coordination with about six water molecules at 0 GPa transforms into about five water molecules and one Cl due to the formation of the contact ion pairs in the GPa pressure range. The Cl solvation shows a substantial pressure dependence; the coordination number of a water oxygen atom around Cl increases from 8 at 0.1 MPa/300 K to 10 at 4 GPa/500 K. The solvent water transforms the tetrahedral network structure at 0.1 MPa/300 K to a densely packed structure in the GPa pressure range; the number of water oxygen atoms around a central water molecule gradually increases from 4.6 at 0.1 MPa/298 K to 8.4 at 4 GPa/500 K.

1. Introduction

Understanding the nature of Mg2+ solvation is an important issue since Mg2+ plays an essential role in various application fields, such as biological systems [1], environmental aerosols [2], and geological processes in the Earth [3]. Mg2+ affects many cellular functions, including the transport of K+ and Ca2+; and modulates signal transduction, energy metabolism, and cell proliferation [1]. Mg2+ is the second cation rich in seawater and lake water after Na+. Thus, Mg2+ affects the properties of sea salt aerosols in an atmospheric environment [2]. Most investigations on Mg2+ solvation in aqueous solutions have been performed under ambient conditions. When high pressure of gigapascals (GPa) is applied to aqueous solutions, the hydrogen bonding of solvent water is greatly perturbed [4], followed by a possible change in ion solvation. Thus, investigation of Mg2+ solvation in the GPa pressure range will provide valuable information for the nature of ion solvation and association.
Furthermore, electrolyte solutions in the GPa pressure range exist in the Earth’s upper mantle and play critical roles in geological processes, such as earthquakes, and growing magma, followed by the eruption of a volcano [3]. Due to the development of a high-pressure cell and data acquisition techniques at synchrotron and pulsed neutron sources, high-pressure and high-temperature X-ray- and neutron-scattering measurements in the GPa pressure range became possible. Many studies have been conducted on aqueous solutions of electrolytes, such as NaCl [5,6,7], RbCl [8], CaCl2 [9,10], and CeCl3 [11].
The Mg2+ solvation was investigated at a molecular level under ambient conditions by various techniques, such as X-ray scattering [12,13], neutron scattering [14,15], classical molecular dynamics (MD) simulations [16,17,18,19,20,21], and ab initio MD simulation [15,22,23,24]. The results are consistent with the conclusion that Mg2+ has a rigid solvation shell of six water molecules arranged in an octahedral geometry. The Mg2+-H2O distance ranges from 1.92 to 2.12 Å, depending on the methods and pair potentials employed. These features of Mg2+ solvation differ from the Ca2+ solvation, with seven and eight water molecules in an almost equal population in the first solvation shell at 0.1 MPa [9,10]. When the solution is compressed to 1 GPa/300 K, the distribution of water molecules around Ca2+ becomes sharp and has a maximum of eight [10]. The distance of the Ca2+-OW(I) (2.44 Å) does not change significantly with pressure (OW(I) is a water oxygen atom in the first solvation shell). However, the Ca2+-HW(I) distance is shortened from 3.13 Å at 0.1 MPa to 3.10 Å at 4 GPa (HW(I) is a water hydrogen atom in the first solvation shell). This result suggested that the orientation of the water dipole around Ca2+ is affected by pressure. The contact and solvent-shared ion pairs between Ca2+ and Cl are formed with Ca2+-Cl distances of 2.82 and 5.0 Å, respectively [10]. There are no appreciable changes in the coordination number of Ca2+-Cl at 0.2–0.3 with pressure. It is interesting to see the behavior of Mg2+ solvation and association in the GPa pressure range and compare it with the Ca2+ solvation from a biological point of view [1].
In this study, we perform X-ray- and neutron-scattering measurements on a 2 m MgCl2 aqueous solution at ambient pressure to 4 GPa and temperatures of 300 and 500 K. An EPSR modeling method is employed to analyze both X-ray- and neutron-scattering data together to extract the pair distribution functions, coordination number distributions, angle distribution (orientational correlation), and spatial density functions (3D structure) in aqueous electrolyte solutions. We show the effects of pressure and temperature on ion solvation and association, and solvent water structure.

2. Materials and Methods

2.1. Sample Solutions

Magnesium chloride (MgCl2, 99.99%, Sigma-Aldrich, St. Louis, MO, USA), commercially available, was used without further purification. MgCl2 powder was dried in a vacuum oven at 393 K for 3 h and then cooled in a desiccator at room temperature. Deuterium oxide (D2O) (99.8 atom %D) was purchased from Kanto Chemical Ltd., Chuo-ku, Tokyo, Japan. For X-ray-scattering measurements, a required amount of dried MgCl2 powder was weighed and dissolved into degassed H2O to prepare a 2 m solution. For neutron-scattering experiments, a 2 m MgCl2 aqueous solution in D2O was prepared in a similar way to the X-ray sample in a nitrogen-filled glove box to avoid contamination of light water (H2O) since the incoherent scattering cross-section of H is about 40 times larger than D ( σ i H = 80.27   barns ,   σ i D = 2.05   barns ) .

2.2. Experimental PT Condition and Density Estimation

Figure 1 shows the phase diagram of water. The red open circles are thermodynamic states for X-ray-scattering measurements, and the solid red arrows show the experimental pressure and temperature path. The black-filled circles show those for neutron scattering experiments, and the black dashed arrows are the experimental PT path, which was carefully chosen to avoid the sample blowout by compression at high temperatures. The densities of the sample solutions were measured at 300 K with a vibrational densitometer (Anton Paar GmbH, Graz, Austria, DMA48). Those at high temperatures and high pressures were estimated from the densities of water in the corresponding thermodynamic states available in the literature [25]. Table 1 summarizes the compositions and densities at the measured pressures and temperatures.

2.3. X-ray Scattering Measurements

A sample solution was inserted into a diamond cylindrical cell of 1.5 mm in inner diameter and 1.2 mm in height, which was capped with a thin gold foil and placed in a high-pressure cell assembly, as shown in Figure S1, Supplementary Materials [27]. The incident X-ray beam size was 300 μm (width) and 50 μm (height). The applied pressure was estimated from the equation of state of NaCl of the lattice constant of NaCl powder pellets placed below the diamond cell measured at various thermodynamic states [28]. The sample was heated by applying AC to the graphite heater surrounding the pressure cell. The sample temperature was estimated from the temperature-electric power relation of the power applied to the heater [29]. High-pressure X-ray-scattering experiments were done at 1 GPa/300 and 500 K, 2 GPa/500 K, and 4 GPa/500 K on a high-pressure X-ray diffractometer installed at BL14B1 of SPring-8 [30]. X-ray-scattering data were collected in an energy-dispersive mode with a Ge-SSD over an energy I region of 40~140 keV at the scattering angles (2θ) from 4° to 24° with an increment of 2° to 4°, which corresponded to the magnitude of the scattering vector Q = (4π/hc)Esin θ (h is the Planck constant, and c is the velocity of light) of 0.5–13.85 Å−1. A set of scattering patterns measured at different scattering angles was empirically merged into the whole Q-range values [27,28]. The experimental scattering data were normalized to the absolute units (electrons) in the usual manner [31] and then corrected for incoherent scattering. The interference functions, F(Q), were obtained by Equation (1).
F Q = I coh Q x i f i 2 Q x i f i 2 Q
Here, Icoh(Q) denotes the coherent scattering intensity per atom, and xi and fi are the atomic fraction and atomic-scattering factor of atom i, respectively.

2.4. Neutron Scattering Measurements

A sample solution under ambient conditions was inserted in a cylindrical vanadium cell (2.8 mm in inner diameter, 0.1 mm in thickness, and 30 mm in height) and sealed with an indium wire. Under high-pressure conditions, a sample solution was inserted into a cylindrical Teflon cell (5.5 mm in inner diameter and 6.5 mm in inner height) against corrosion by aqueous salt solutions at high temperatures. The Teflon cell was loaded in a high-pressure cell assembly, as shown in Figure S2. The neutron scattering experiments were carried out on a PLANET high-pressure diffractometer, equipped with the six-axis multi-anvil press ATSUHIME [32], at BL11 of a pulsed neutron facility, J-PARC MLF [33]. The scattered neutrons were collected with 160 3He position-sensitive detectors placed at the scattering angle (2θ) of 90° for each side with the horizontal and vertical coverage of 90 ± 11.3° and 0 ± 34.6°, respectively. The wavelength (λ) range used was 0. 2–12 Å, corresponding to the amplitude of wavevector Q (=4πsinθ/λ) of 0.8–40 Å−1. Neutron-scattering measurements were performed at 0.1 MPa/298 K, 0.65 GPa/298 K, 0.63 GPa/523 K, and 4.5 GPa at 523 K according to the pressure and temperature path, as is shown in Figure 1. This path was chosen to avoid the sample blowout by compression at high temperatures. A vanadium rod with the same dimension as the sample was placed in the high-pressure cell and measured at the same thermodynamic states as the sample solution. An empty cell at each pressure point was prepared and measured at ambient conditions to estimate the background. The time for measurements at the ambient condition was 6 h for a sample, 6 h for a vanadium rod, and 3 h for an empty can. For high-pressure, the measurements were 9 h at 1 GPa and 13 h at 4 GPa for the sample, 6 h for the vanadium rod at 1 and 4 GPa, and 6 h for each empty cell.
Small Bragg peaks from a vanadium rod were removed. The corresponding regions were interpolated using data outside of this range. Normalization by proton intensities was applied to the total cross-sections of a sample, a vanadium rod, and an empty cell and binned as an increment of Q = 0.01 Å–1. The scattered data were corrected for absorption by the sample and the cell [34] and multiple scattering [35], and then normalized to the absolute units (barns) by using the data of the vanadium rod. After subtraction of the incoherent scattering, the structure factor S(Q) was calculated by Equation (2). All the data treatments were performed with a program nvaSq [36].
S Q = d σ d Ω ( x i b i 2 ) ( x i b i ) 2 ( x i b i ) 2
where d σ d Ω , xi, and bi are the differential scattering cross-section, atomic fractions, and coherent-scattering length of atom i, respectively. The coherent-scattering length, absorption, and incoherent cross-sections of all atoms except for D were taken from the literature [37]. The absorption and incoherent cross-sections for D were calculated by a least-squares fitting procedure using the experimentally obtained total cross-section of D2O [38]. The inelastic correction was made by the Kameda method [39] and, subsequently, a third-order polynomial equation. The S(Q) data not available in the experiments below Q < 0.2 Å–1 were obtained by extrapolation.
The radial distribution function G(r) were obtained by the Fourier transform of S(Q) by Equation (3).
G r = 1 + 1 2 π 2 r ρ 0 Q m i n Q m a x Q S Q 1 sin Q r d Q  
Unphysical ripples below 0.7 Å in the radial distribution functions were corrected in a usual manner [36]. The structure factors S(Q) were transformed to the interference functions F(Q) used in the EPSR calculations by Equation (4).
F Q = [ ( x i b i ) 2 S Q 1 ]     /   x i b i 2 Q
An overall scaling factor of F(Q) was finally obtained by a least-squares fitting procedure applied to the experimental F(Q) values over 10–30 Å−1 compared with the theoretical ones of the intramolecular O–D and D–D interactions in a D2O molecule. An overall scaling factor, the intramolecular distances, and the root mean square amplitudes were treated as independent variables. The OriginPro software 2022b was used for the calculations [40].

2.5. EPSR Modeling

EPSR calculations were performed in a cubic cell, including 40 Mg2+, 80 Cl, and 1000 D2O, to reproduce the composition of a 2 m MgCl2 aqueous solution. Monte Carlo calculations were carried out using the seed potentials to equilibrate the system. The parameter values of the Lennard-Jones potential in this study were taken from the literature for Mg2+ [20], Cl [41], and water from the SPC/E model [42]. Various parameter values were proposed for Mg2+ to reproduce the experimental values, such as the Mg2+-H2O distance, solvation energy, and ion association [13,16,17,18,19,20,21]. In this study, we employed those in Ref. [20] to reproduce the solvation energy and contact ion pair formation to meet our aims. The simulated interference function Fsim(Q) is defined as Equation (5).
F s i m Q = i j 2 δ i j x i x j b i b j s i j Q
Here, parameter δij = 0 for ij and =1 for i = j and sij(Q) the partial structure factors of atom pair i and j. According to Equation (5), the contributions of all-atom pairs to X-ray- and neutron-scattering intensities were calculated and shown in Figure S2. The O–O and O–H of solvent water and Cl–O and Mg–O pairs due to ion solvation are distinct in X-ray scattering, whereas the D–D and O–D of solvent water are major contributions, and the water O–O. Moreover, Cl–H pairs of Cl solvation are significant in neutron scattering. Thus, the complementary use of X-ray- and neutron-scattering data is an advantage for EPSR calculations. In the present study, X-ray- and neutron-scattering data were employed for EPSR calculations except for 2 GPa/500 K, where only X-ray-scattering data were available. Unfortunately, the pressure and temperature values at which X-ray- and neutron-scattering data were taken were slightly different for 1 and 4 GPa data. In this study, no correction was applied to the S(Q) and G(r) shapes or the number densities to avoid artificial modifications. The number density difference estimated from the pressure dependence of ρ(dρ/dP) and the pressure difference (ΔP) were 5.4%, 2.0%, and 3.2%, at 1.0 GPa/500 K, 1.0 GPa/500 K, and 4.0 GPa/500 K, respectively, which would affect the coordination number. The pair potentials were empirically optimized from the initial ones by comparing the simulated and experimental data. The above calculations were continued until good agreements were obtained between the simulated and experimental interference functions. Then, we calculate the pair distribution functions (pdfs), coordination number (CN) distributions, angle distributions (orientational correlation), and spatial density functions (SDF, 3D structure). The CN of atom j around atom i was calculated from the corresponding pdf gij(r) by Equation (6),
C N i j = 4 π ρ j r m i n r m a x g i j r r 2 d r    
where ρj is the number density of atom j, and rmin and rmax are the lower and upper limits to define the coordination shell. The present study took rmax as the first minimum of pdf. The parameters and references of each element for EPSR calculations are given in Table 2. The detailed procedure in EPSR modeling has been described in Refs. [43,44,45].

3. Results

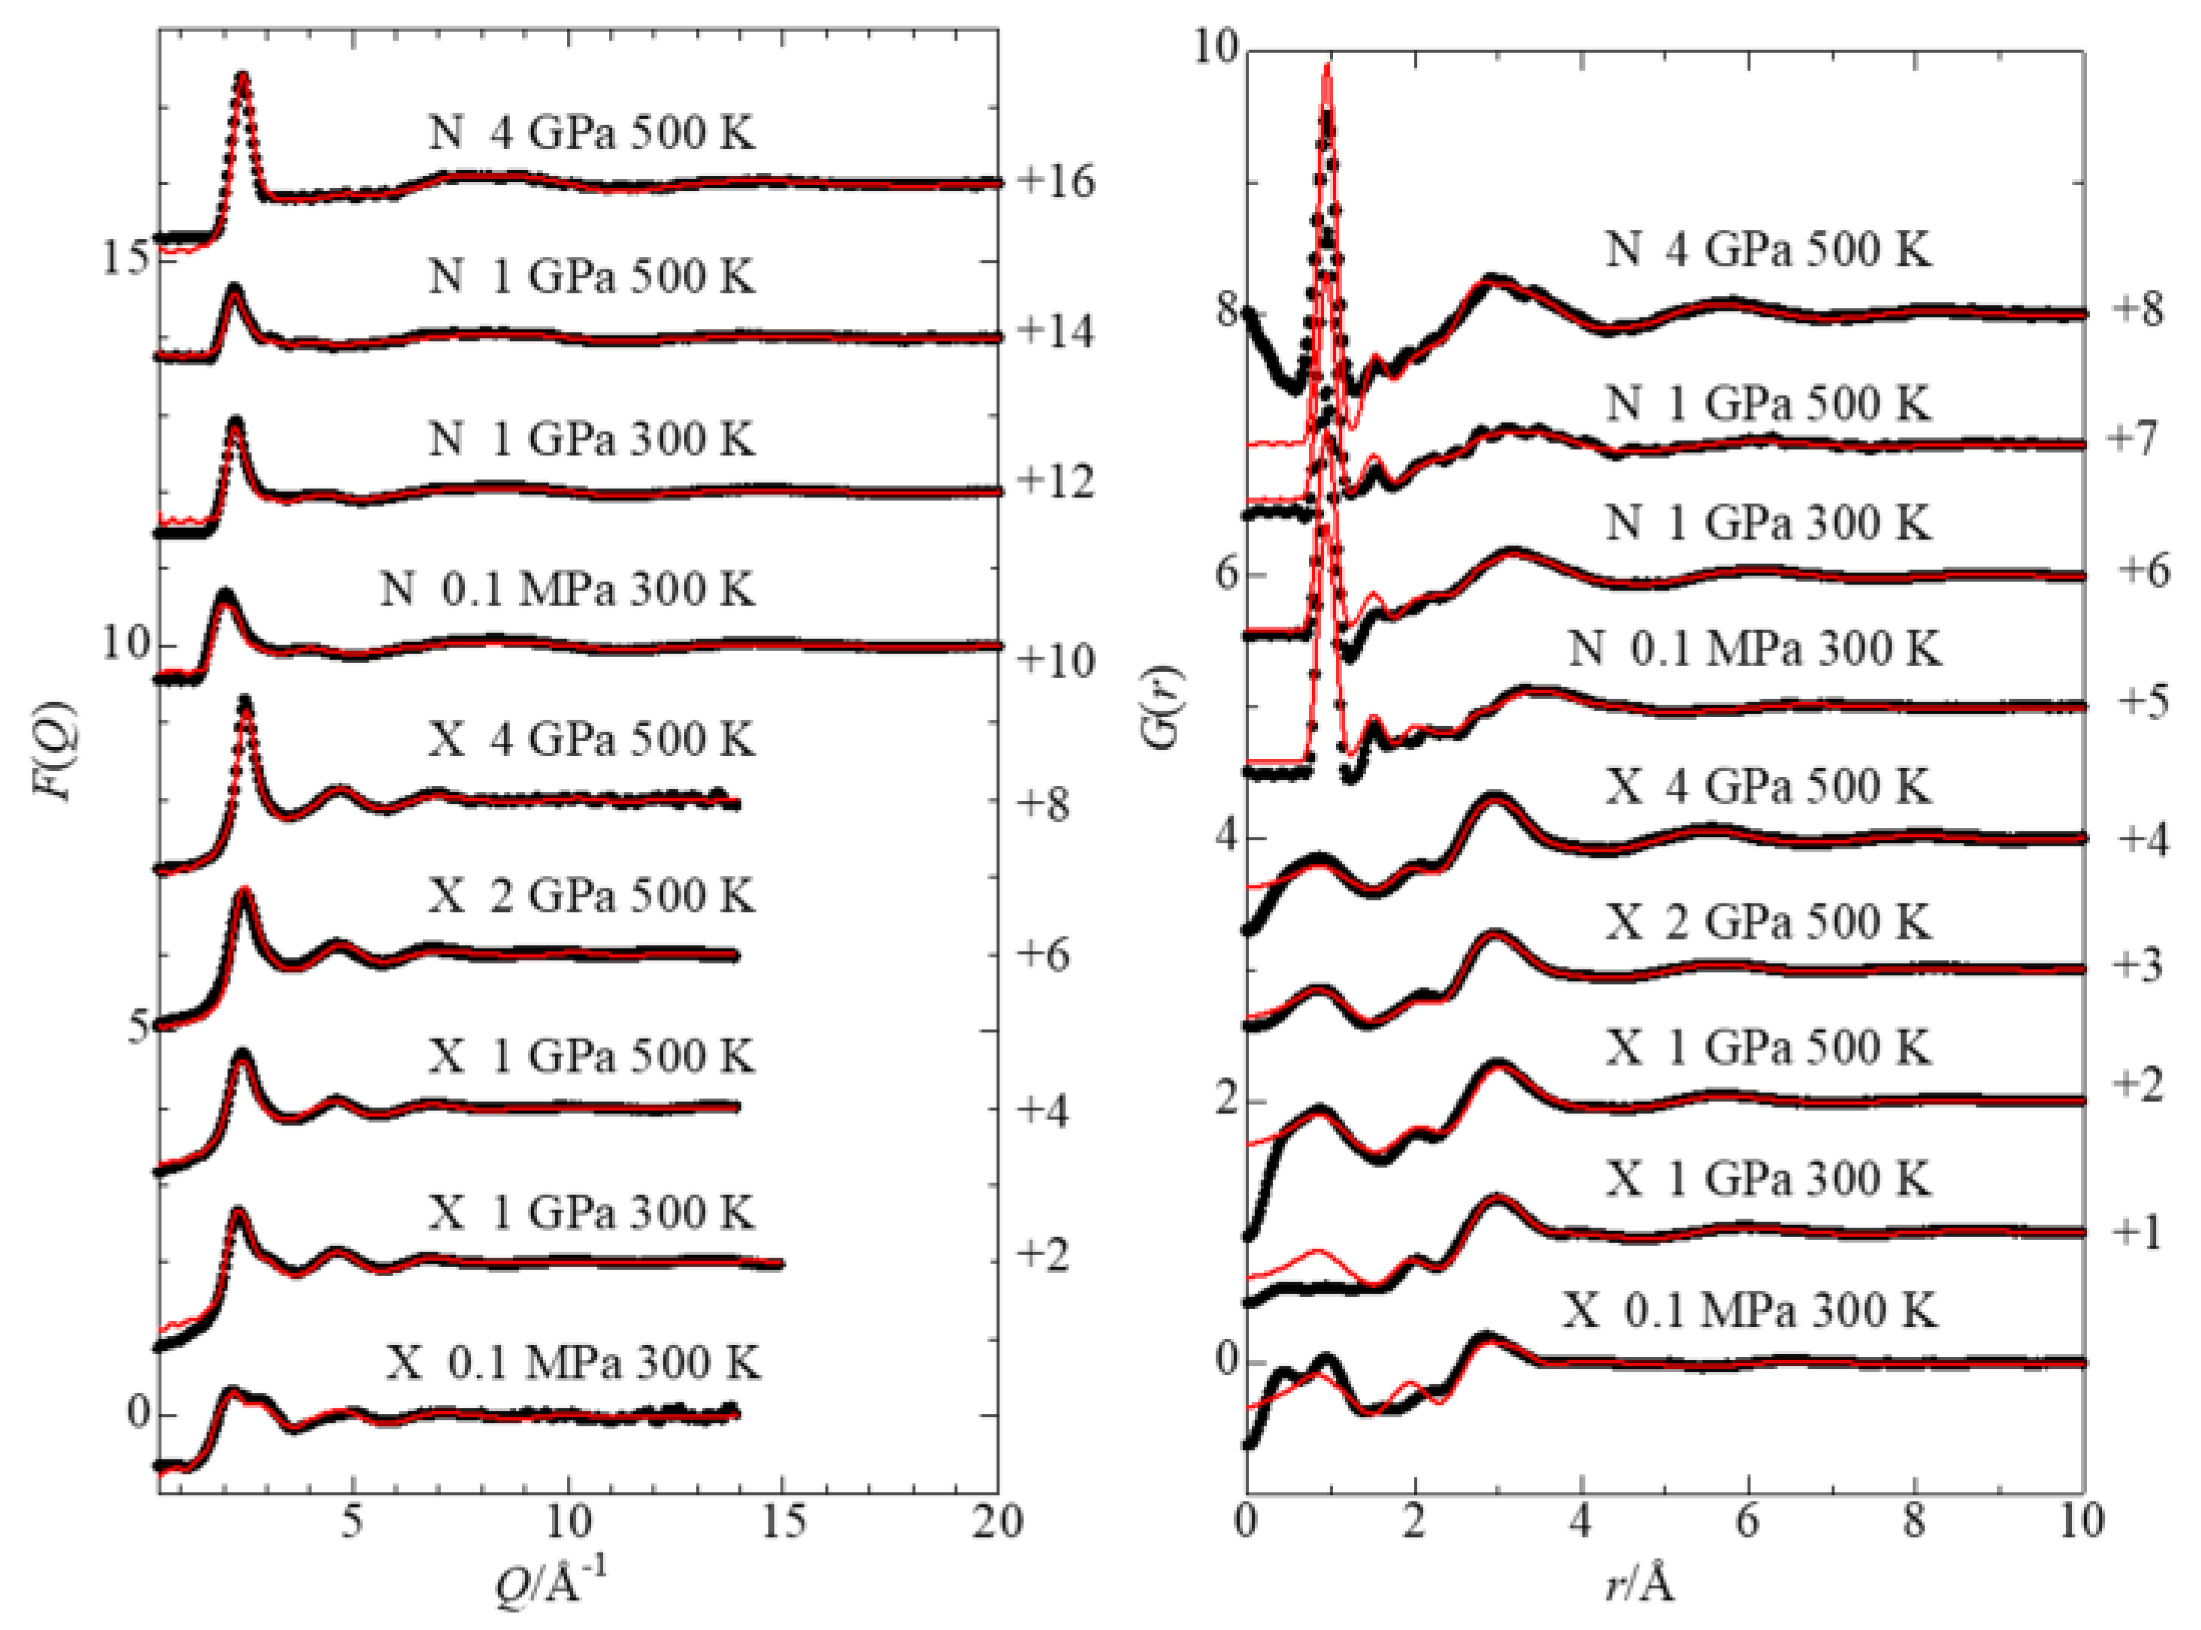
3.1. Interference Functions and Radial Distribution Functions
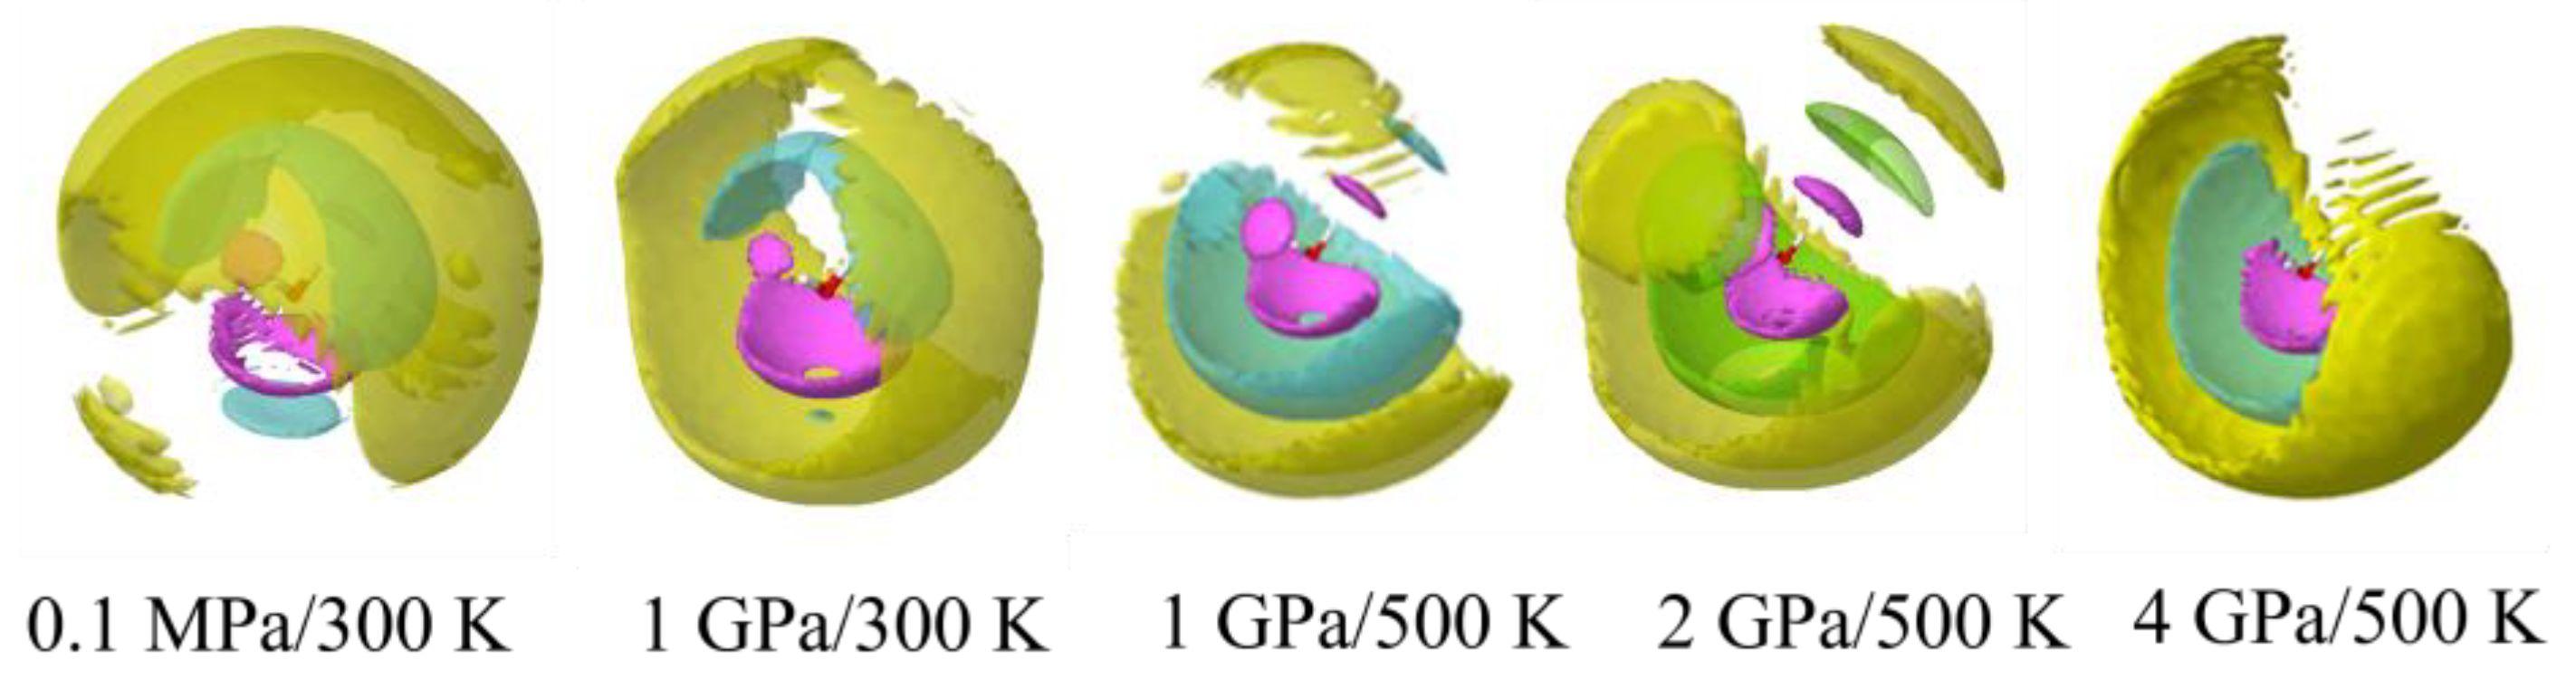
Figure 2 shows the X-ray and neutron experimental interference functions and corresponding radial distribution functions obtained by the experiments (black dots) and EPSR modeling (red lines) of an aqueous 2 m MgCl2 solution as a function of pressure and temperature. Symbols X and N denote X-ray and neutron scattering, respectively. In the neutron interference functions, a hump observed at Q ~ 4 Å–1 at 0.1 MPa/300 K gradually decreases and becomes a plateau at 4 GPa/500 K. On the other hand, the X-ray interference function has first double peaks at 2–3 Å–1 at 0.1 MPa/300 K, merging into a single sharp peak at 4 GPa/500 K. These characteristic features suggest the disruption of the tetrahedral hydrogen-bonded network in water with increasing pressure and temperature [4,46]. In the X-ray radial distribution functions, there are peaks at 1.0, 2.0, and 3.0 Å, which are ascribed to the intramolecular O–H bonds within water molecules, Mg2+–O(H2O) bonds due to Mg2+ solvation, and an overlap of the first neighbor O–O bonds of solvent water and Cl—O(H2O) bonds of Cl solvation. In the neutron radial distribution functions, peaks at 0.96 Å and 1.55Å are assigned to the intramolecular O–D and D–D interactions within a D2O molecule, respectively. The broad peak is seen at about 3.3 Å at 0.1 MPa/300 K and shifts to about 3.0 Å with new broad peaks evolved at 5.9 and 8 Å in the GPa pressure range, indicating the structure change in solvent water because of its dominant contributions to the neutron data as seen in Figure S3.

3.2. Mg2+ Solvation

The structural information of Mg2+ solvation is obtained from the pdfs of Mg–Ow and Mg–Hw pairs shown in Figure 3 (left). The numerical values are given in Table S1 of the Supplementary Materials. Table 3 summarizes the peak positions corresponding to the interatomic distances of the first (I) and second (II) coordination shells of Mg2+. The first neighbor Mg–OW(I) distance is almost constant at 1.92 Å over the pressure range measured, suggesting a rigid solvation shell. The value for the Mg–OW(I) distance obtained in this study agrees with a lower limit of the Mg–OW(I) distances from 1.92 to 2.14 Å reported in the literature [12,13,14,15,16,17,18,19,20,21,22,23,24]. Despite the constant Mg–OW(I) distance, the Mg–HW(I) distance is sensitive to pressure and temperature. At 300 K, the compression to 1 GPa does not significantly affect the Mg–HW(I) distance at 2.58 Å. However, it becomes longer to 2.61 Å while elevating the temperature to 500 K. The second neighbor Mg–OW(II) distance shows an appreciable change with pressure and temperature. As the pressure increases from 0.1 MPa to 1 GPa at 300 K, the Mg-OW(II) distance is lengthened from 3.78 to 4.53 Å but is shortened to 4.14 Å while elevating the temperature to 500 K. At 500 K, the compression from 1 to 4 GPa shortens the Mg-OW(II) distance from 4.14 to 3.99 Å.
Figure 3 (right) shows the CN distribution of Mg–OW(I) and Mg–HW(I) pairs. Table 3 summarizes the mean coordination number calculated by Equation (6). The Mg–OW(I) pair has a single peak at six at 0.1 MPa/300 K. With increasing pressure and temperature, the population of the six-fold coordination decreases, and five- and four-fold coordination gradually increases. This decrease in CN of Mg–OW(I) is compensated by an increase in CN of Mg2+–Cl due to the formation of contact ion pairs, as discussed later. The CN for Mg–HW(I) is twice that of Mg–OW(I). These findings demonstrate a rigid solvation shell of six-fold coordination of Mg2+.
Figure 4 shows the angle distributions of ∠OW–Mg–OW and ∠Mg–OW–HW. The ∠OW–Mg–OW angle has maxima at 90° and 180°, which correspond to cis- and trans-positions of solvated water molecules of an octahedral geometry. The ∠Mg–OW–HW angle shows a maximum of 126°, leading to the tilt angle of the water dipole from the Mg–Ow direction of 26°. This tilt angle does not agree with the value (0°) estimated by an MD simulation [16]. Since the ∠Mg–OW–HW angle is widely distributed around 126°, the tilt angle of the water dipole would be widely distributed around 26°. With increasing pressure and temperature, the distributions at 90° and 180° slightly broaden, much less than those for Cl solvation and solvent water shown later. These features again support a rigid octahedral solvation shell of Mg2+ over the pressure range measured. The present result contrasts the relatively flexible Ca2+ solvation at high pressures in an aqueous CaCl2 solution [9,10]. This rigid solvation shell of Mg2+ could be responsible for many cellular functions in biological systems.

3.3. Cl Solvation

Figure 5 shows the pdfs (left frames) and the corresponding CN distributions (right frames) of Cl–Ow and Cl–Hw pairs, respectively. The numerical values are given in Table S1 of Supplementary Materials. The pdf of Cl–Ow shows the first peak at 3.1–3.2 Å due to Cl solvation. The broad peak appears at 5.67 Å, corresponding to the second solvation shell of Cl. It should be noted that the third peak evolved at 8 Å at 4 GPa/500 K. With elevating temperature and pressure, the first peak gradually becomes more asymmetrical toward the longer distance, suggesting more water molecules entering into the solvation shell of Cl. In the pdfs of Cl–HW pairs, the first peak is observed at 2.2–2.3 Å, ascribed to the first-neighbor hydrogen-bonded Cl H-OH interactions, whereas the second broad peak at 3.6 Å corresponds to the interatomic distance between Cl- and another water hydrogen atom. With increasing temperature and pressure, the height of both peaks gradually decreases, and the peak becomes asymmetric toward the long-distance side, which is consistent with the changes of Cl–OW pairs with temperature and pressure. The Cl–OW (I) and Cl–HW (I) distances follow an expected change with pressure and temperature, i.e., both distances decrease upon compression and increase with elevating temperature.
Figure 5 (right frames) shows the CN distributions of Cl–OW pairs. The CN distributions of Cl–OW pairs gradually become broader and shift to larger values with increasing pressure and temperature, corresponding to the asymmetry of the first peak in the Cl–Ow pdfs. Table 3 summarizes the mean CN of Cl–OW. The mean CN of Cl–OW changes from 8.2 ± 1.2 at 0.1 MPa/300 K to 14.0 ± 1.4 at 4 GPa/500 K, contrasting sharply with the change in the mean CN of Mg–OW. Here, it is noted that the uncertainties in the coordination number are larger than the estimated errors in the number densities by slightly different thermodynamic states employed in neutron scattering experiments stated in the experimental section. As discussed in the next section, the increase in the CN of Cl is probably ascribed to an increase in non-hydrogen bonded water molecules at high pressures and temperatures. On the other hand, interestingly, the CN of Cl–HW(I) remains almost unchanged (6.7 ± 1.1 at 0.1 MPa/300 K and 6.2 ± 1.6 at 4 GPa/500 K). This result suggests strong Cl H-OH hydrogen bonds. The discrepancy between the mean CNs of Cl–Ow and Cl–Hw in the GPa pressure range indicates that most excess oxygen atoms belong to water molecules not forming hydrogen bonds with Cl.
The angle distribution of ∠ Ow–Cl–Ow and ∠ Cl–Hw–Ow are plotted in Figure 6. In the distribution of ∠ Ow–Cl–Ow at 0.1 MPa/300 K, there is a dominant peak at 49° and a subdominant, broad peak at 84°. When the pressure is increased to 1 GPa at 300 K, the two peaks shift to 51° and 77°, respectively. The subdominant peak disappears at 1–4 GPa and 500 K, and a peak is evolved at 94°. The distribution of ∠ Cl–Hw–Ow angle peaks close to 180°, showing the almost linear Cl Hw–Ow hydrogen bonds. With increasing pressure and temperature, the distribution broadens due to the distortion of the hydrogen bonds.

3.4. Solvent Water

From our previous studies of aqueous 3 m NaCl [5,7], 3 m RbCl [8], 2 m CaCl2 [10], and 1 m CeCl3 [11] solutions in the GPa pressure range, we found that the tetrahedral network structure of solvent water at 0.1 MPa/300 K transforms to a random dense-packing structure in the GPa pressure range. As seen in the pdfs of Ow–Ow in Figure 7 (left frame), three peaks are observed at 2.8, 4.1, and 6.8 Å, characteristic for the tetrahedral network structure of water, at 0.1 MPa/300 K. The structure parameters are summarized in Table 4. When the solution is compressed to 1 GPa/300 K, the second and third peaks slightly shift to the shorter distance side. However, the full feature of the OW–OW pdf does not change, showing that the tetrahedral water structure remains at 1 GPa/300 K. This finding is in contrast with the case of a 3 m NaCl aqueous solution where the tetrahedral structure is completely broken down at 1 GPa/298 K [7]. This structural difference of solvent water is ascribed to the solute concentrations, i.e., more water molecules are present in a 2 m MgCl2 solution than in a 3 m NaCl solution. A similar change in solvent water’s structure has also been observed for a 1 m CeCl3 solution [11]. When the solution is heated to 500 K at 1 GPa, the OW–OW pdfs show a drastic change in the second and third peaks evolved at 5.6 and 8.2 Å, respectively, showing the transformation to a random dense-packing structure. In addition, the first peak at 2.8 Å becomes broader to the long-distance side, suggesting an increase in non-hydrogen bonded water molecules at the interstitial sites.
The detailed picture of hydrogen bonds between solvent water molecules with pressure and temperature is seen in pdfs of OW–HW in Figure 7 (left frame). Over the pressure and temperature range measured, the peak at 1.8 Å due to the intermolecular O-H hydron bonds is observed, demonstrating that the hydrogen bonds are preserved even at 4 GPa/500 K. The OW–HW distance is lengthened from 1.80 Å at 0.1 MPa/300 K to 2.07 Å at 1 GPa/300 K. Thus, although the tetrahedral network structure retains at 1 GPa/300 K, the hydrogen bonds are largely distorted by compression. When the temperature is elevated to 500 K at 1 GPa, the OW–HW distance is shortened; upon compression to 4 GPa, the OW–HW distance is further shortened to 1.7 Å. The CN distribution of OW–HW does not change largely with pressure and temperature, in contrast with the OW–OW. This finding suggests that pressure and temperature do not considerably affect the first-neighbor OW–HW.
The structural change of solvent water with pressure and temperature is again discussed from the distribution of ∠Ow–Ow–Ow and ∠Ow–Hw–Ow angles, as seen in Figure 8. We can see 60° and 90° πεακσ in ∠Ow–Ow–Ow at 0.1 MPa/300 K. The latter angle is close to 109°, showing the presence of the tetrahedral hydrogen-bonded network. The sharp peak at 60° originates from non-hydrogen bonded or interstitial water molecules. Upon compression to 1 GPa at 300 K, both peaks decrease, suggesting the distortion of the network structure. Heating the solution to 500 K at 1 GPa results in the disappearance of the 90° peak and broadening of the 60° peak. Furthermore, very broad peaks evolved at approximately 116 and 180°. The drastic change in ∠Ow–Ow–Ow corresponds to transforming the tetrahedral structure into a dense random-packing arrangement. The results are consistent with 3 m and 5 m aqueous NaCl solutions [5,6].
The geometry of the intermolecular OW–HW hydrogen bonds is seen in the distribution of ∠Ow–Hw–Ow. A unique peak at 180° appears over the pressure and temperature measured. However, in the GPa pressure range, the peak is gradually lowered, and the tail of the distribution is widened to 110°. Thus, the intermolecular OW–HW hydrogen bonds are almost linear but distorted in the GPa pressure range.
Figure 9 shows the change in the spatial density functions of the first-, second-, and third-neighbor water oxygen atoms around a central water molecule with pressure and temperature. We can see the tetrahedral hydrogen-bonded network structure at 0.1 MPa/300 K, which remains at 1 GPa/300 K. With increasing pressure and temperature, the water molecules hydrogen bonded to the hydrogen atoms of a central water molecule decrease, showing the distortion of hydrogen bonds. On the other hand, the lobe of water molecules on the lone-pair electron side of a central water molecule expands, and finally, a dense-packing structure of solvent water molecules at 4 GPa/500 K.

3.5. Ion Association

Structural information on ion association is obtained from the pdfs of Mg–Cl, as shown in Figure 10. The peak positions are given in Table 3. At 0.1 MPa/300 K, there is a small peak at 2.37 Å and a large, broad peak at 4–5.5 Å. The 2.37 Å peak is ascribed to the contact ion pairs (CIP) Mg2+–Cl since the distance is close to the sum of the Shannon effective ionic radii of Mg2+ (0.57 Å) and Cl (1.81 Å) [47]. The second peak should originate from the solvent-shared ion pairs (SSIP) Mg2+ OH2 Cl estimated from the interatomic distances of Mg–OW (1.92 Å) and CL–OW (3.18 Å). Under ambient conditions, SSIP is preferable to CIP since water molecules surround Mg2+. When the pressure is increased to 1 GPa at 300 K, the first peak of CIP is enhanced, and that of SSIP is lowered, showing that CIP is more favorable than SSIP. The formation of CIP is promoted by increasing the temperature to 500 K at 1 GPa. However, with further compression to 2 and 4 GPa at 500 K, CIP decrease. As seen in Table 3, the mean CN of Mg–Cl reflects the above change of CIP and SSIP with pressure and temperature. In Figure 10 (right frame), the CN distribution of Mg–Cl extends to CN = 3, suggesting the formation of higher ion pairs in the GPa pressure range.

4. Conclusions

Ion solvation, association, and water structure in a 2 m MgCl2 aqueous solution have been revealed in the GPa pressure range by X-ray- and neutron-scattering experiments combined with EPSR modeling. Over pressures from 0.1 MPa to 4 GPa, Mg2+ maintain an octahedral solvation shell comprising six water molecules at 0.1 MPa/300 K, one of which is replaced by one Cl in the GPa pressure range due to the formation of CIP. The orientational correlation of solvated water dipoles around Mg2+ does not change significantly with pressure and temperature, but the distribution of the dipole orientation becomes broadened in the GPa pressure range. On the contrary, the solvation structure of Cl is drastically changed upon compression to GPa; the mean CN of water oxygen atoms around Cl increases from 8.2 at 0.1 MPa/300 K to 10.1 at 4 GPa/500 K. On the other hand, the CN of the water hydrogen atom surrounding Cl remains at about six regardless of pressure due to linear Cl H-OH bonds. These results suggest some of the solvated water molecules present slightly distant from Cl without forming hydrogen bonds with Cl. Compression of solvent water to a GPa pressure range transforms the tetrahedral hydrogen-bonded network structure to a dense random packing arrangement, as evidenced by the mean CN change from 4.6 at 0.1 MPa/300 K to 8.4 at 4 GPa/500 K, accompanied by distortion of hydrogen bonds. In a pressure range from 0.1 MPa to 4 GPa, the intermolecular OW–HW(I)–OW hydrogen bonds are linear but distorted in the GPa pressure range. CIP and multiple IPs are promoted with increasing pressure and temperature.

Supplementary Materials

The following supporting information can be downloaded at: https://www.mdpi.com/article/10.3390/liquids3030019/s1. Figure S1: A high-pressure cell assembly for X-ray-scattering experiments; Figure S2: A high-pressure cell assembly for neutron scattering experiments; Figure S3: Comparison of the contributions of atom pairs of a 2 m MgCl2 aqueous solution to X-ray- and neutron-scattering intensities. Table S1: Tabulated data of pair distribution functions g(r) of Mg–Ow, Mg–Hw, Cl–Ow, and Cl–Hw in different thermodynamic states. The g(r) values of Mg–Ow and Cl–Ow are given at 2 GPa/500 K for X-ray scattering.

Author Contributions

Conceptualization, writing-original draft preparation-review, and editing: T.Y.; X-ray experiments: T.Y., N.F., K.Y. and Y.K.; X-ray data analysis: T.Y., N.F. and Y.K.; neutron experiments: T.Y., S.M. and T.H.; neutron data analysis: T.Y., writing—review and editing: T.Y., K.Y., Y.K. and T.H. All authors have read and agreed to the published version of the manuscript.

Funding

This work was supported in part by JSPS KAKENHI (No. 19K05551).

Data Availability Statement

The data can be obtained through reasonable demand from the authors.

Acknowledgments

The X-ray-scattering experiments were performed under the Shared Facility Use Program of the Japan Atomic Energy Agency with the approval of the Japan Synchrotron Radiation Research Institute (No. 2012B3623). The neutron scattering experiments at J-PARC’s Materials and Life Science Experimental Facility were performed under a user program (Proposal Nos. 2015A0179 and 2017B0179).

Conflicts of Interest

The authors declare no conflict of interest.

References

  1. Saris, N.-E.L.; Mervaala, E.; Karppanen, H.; Khawaja, J.A.; Lewenstam, A. Magnesium, An update on physiological, clinical and analytical aspects. Clin. Chim. Acta 2000, 294, 1–26. [Google Scholar] [CrossRef] [PubMed]
  2. Zhao, L.-J.; Zhang, Y.-H.; Wei, Z.-F.; Cheng, H.; Li, X.-H. Magnesium sulfate aerosols studied by FTIR spectroscopy: Hygroscopic properties, supersaturated structures, and implications for seawater aerosols. J. Phys. Chem. A 2006, 110, 951–958. [Google Scholar] [CrossRef] [PubMed]
  3. Hirschmann, M.; Kohlstedt, D. Water in Earth’s Mantle. Phys. Today 2012, 65, 40–45. [Google Scholar] [CrossRef]
  4. Yamaguchi, T.; Fujimura, K.; Uchi, K.; Yoshida, K.; Katayama, Y. Structure of water from water to 4 GPa revealed by energy-dispersive X-ray diffraction combined with empirical potential structure refinement modeling. J. Mol. Liq. 2012, 176, 44–51. [Google Scholar] [CrossRef]
  5. Yamaguchi, T.; Fukuyama, N.; Yoshida, K.; Katayama, Y. Ion solvation and water structure in an aqueous sodium chloride solution in the gigapascal pressure range. J. Phys. Chem. Lett. 2021, 12, 250–256. [Google Scholar] [CrossRef]
  6. Polidori, A.; Rowlands, R.F.; Zeidler, A.; Salanne, M.; Fischer, H.E.; Annighöfer, B.; Klotz, S.; Salmon, P.S. Structure and dynamics of aqueous NaCl solutions at high temperatures and pressures. J. Chem. Phys. 2021, 155, 194506. [Google Scholar] [CrossRef]
  7. Yamaguchi, T.; Yoshida, K.; Machida, S.; Hattori, T. Neutron scattering on an aqueous sodium chloride solution in the gigapascal pressure range. J. Mol. Liq. 2022, 365, 120181. [Google Scholar] [CrossRef]
  8. Zhang, W.-Q.; Yamaguchi, T.; Fang, C.-H.; Yoshida, K.; Zhou, Y.-Q.; Zhu, F.-Y.; Machida, S.; Hattori, T.; Li, W. Structure of an aqueous RbCl solution in the gigapascal pressure range by neutron diffraction combined with empirical potential structure refinement modeling. J. Mol. Liq. 2022, 348, 118080. [Google Scholar] [CrossRef]
  9. Takamuku, T.; Yagafarov, O.F.; Katayama, Y.; Umeki, T. Structure of aqueous calcium chloride solutions by energy-dispersive x-ray diffraction under high temperatures and high pressures. Bunseki Kagaku 2015, 64, 203. (In Japanese) [Google Scholar] [CrossRef] [Green Version]
  10. Yamaguchi, T.; Nishino, M.; Yoshida, K.; Takumi, M.; Nagata, K.; Hattori, T. Ion hydration and association in an aqueous calcium chloride solution in the GPa range. Eur. J. Inorg. Chem. 2019, 2019, 1170–1177. [Google Scholar] [CrossRef]
  11. Yamaguchi, T.; Fukuyama, N.; Yoshida, K.; Katayama, Y. Ion solvation and association and water structure in an aqueous cerium(III) chloride solution in the gigapascal pressure range. Anal. Sci. 2022, 38, 409–417. [Google Scholar] [CrossRef] [PubMed]
  12. Caminiti, R.; Licheri, G.; Piccaluga, G.; Pinna, G. X-ray diffraction study of MgCl2 aqueous solution. J. Appl. Crystallogr. 1979, 12, 34–38. [Google Scholar] [CrossRef]
  13. Persson, I. Structures of hydrated metal ions in the solid state and aqueous solution. Liquids 2022, 2, 210–242. [Google Scholar] [CrossRef]
  14. Bruni, F.; Imberti, S.; Mancinelli, R.; Ricci, M.A. Aqueous solutions of divalent chlorides; ions hydration shell and water structure. J. Chem. Phys. 2012, 136, 064520. [Google Scholar] [CrossRef]
  15. Duboué-Dijon, E.; Mason, P.E.; Fischer, H.E.; Jungwirth, P. Hydration and ion pairing in aqueous Mg2+ and Zn2+ solutions; force-field description aided by neutron scattering experiments and ab initio molecular dynamics simulations. J. Phys. Chem. B 2018, 122, 3296–3306. [Google Scholar] [CrossRef] [Green Version]
  16. Szász, G.I.; Dietz, W.; Heinzinger, K.; Pálinkás, G.; Tadnai, T. On the orientation of water molecules in the hydration shell of the ions in an MgCl2 solution. Chem. Phys. Lett. 1982, 92, 388–392. [Google Scholar] [CrossRef]
  17. Jiao, D.; King, C.; Grossfield, A.; Darden, T.A.; Ren, P. Simulation of Ca2+ and Mg2+ solvation using polarizable atomic multipole potential. J. Phys. Chem. B 2006, 110, 18553–18559. [Google Scholar] [CrossRef]
  18. Callahan, K.M.; Casillas-Ituarte, N.N.; Roeselová, M.; Allen, H.C.; Tobias, D.J. Solvation of magnesium dication; molecular dynamics simulation and vibrational spectroscopic study of magnesium chloride in aqueous solution. J. Phys. Chem. A 2010, 114, 5141–5148. [Google Scholar] [CrossRef]
  19. Mamatkulov, S.; Fyta, M.; Netz, R.R. Force fields for divalent cations based on single-ion and ion-pair properties. J. Chem. Phys. 2013, 138, 024505. [Google Scholar] [CrossRef] [Green Version]
  20. Mamatkulov, S.; Scwierz, N. Force fields for monovalent and divalent metal cations in TIP3P water based on thermodynamic and kinetic properties. J. Chem. Phys. 2018, 148, 074504. [Google Scholar] [CrossRef]
  21. Zeron, I.M.; Abascal, J.L.F.; Vega, C. A force field of Li+, Na+, K+, Mg2+, Ca2+, Cl-, and SO42- in aqueous solution based on the TIP4P/2005 water model and scaled charges for the ions. J. Chem. Phys. 2019, 151, 134504. [Google Scholar] [CrossRef]
  22. Ikeda, T.; Boero, M.; Terakura, K. Hydration properties of magnesium and calcium ions from constrained first-principles molecular dynamics. J. Chem. Phys. 2007, 127, 074503. [Google Scholar] [CrossRef] [PubMed]
  23. Tommaso, D.D.; de Leeuw, N.H. Structure and dynamics of the hydrated magnesium ion and of the solvated magnesium carbonates; insights from first principles simulations. Phys. Chem. Chem. Phys. 2010, 12, 894–901. [Google Scholar] [CrossRef] [PubMed]
  24. Delgado, A.A.A.; Sethio, D.; Kraka, E. Assessing the intrinsic strengths of ion-solvent and solvent0-solvent interactions for hydrated Mg2+ clusters. Inorganics 2021, 9, 31. [Google Scholar] [CrossRef]
  25. Wagner, W.; Pruβ, A. The IAPWS Formulation 1995 for the Thermodynamic Properties of Ordinary Water Substance for General and Scientific Use. J. Phys. Chem. Ref. Data 2002, 31, 387. [Google Scholar] [CrossRef]
  26. Eisenberg, D.; Kauzmann, W. The Structure and Properties of Water; Oxford University Press: Oxford, UK, 2006. [Google Scholar]
  27. Tsuji, K.; Yaoita, K.; Imai, M.; Shimomura, O.; Kikegawa, T. Measurements of X-ray Diffraction for Liquid Metals under High Pressure. Rev. Sci. Instrum. 1989, 60, 2425. [Google Scholar] [CrossRef]
  28. Decker, D.L. High-Pressure Equation of State for NaCl, KCl, and CsCl. J. Appl. Phys. 1971, 42, 3239. [Google Scholar] [CrossRef] [Green Version]
  29. Datchi, F.; Loubeyre, P.; LeToullec, R. Extended and Accurate Determination of the Melting Curves of Argon, Helium, Ice (H2O), and Hydrogen (H2). Phys. Rev. B 2000, 61, 6535. [Google Scholar] [CrossRef]
  30. Utsumi, W.; Funakoshi, K.; Katayama, Y.; Yamanaka, M.; Okada, T.; Shimomura, O. High-Pressure Science with a Multi-Anvil Apparatus at SPring-8. J. Phys. Condens. Matter 2002, 14, 10497–10504. [Google Scholar] [CrossRef]
  31. Kaplow, R.; Strong, S.L.; Averbach, B.L. Radial Density Functions for Liquid Mercury and Lead. Phys. Rev. 1965, 138, A1336. [Google Scholar] [CrossRef]
  32. Sano-Furukawa, A.; Hattori, T.; Arima, H.; Yamada, A.; Tabata, S.; Kondo, M.; Nakamura, A.; Kagi, H.; Yagi, T. Six-axis multi-anvil press for high-pressure, high-temperature neutron diffraction experiments. Rev. Sci. Instrum. 2014, 85, 113905. [Google Scholar] [CrossRef]
  33. Hattori, T.; Sano-Furukawa, A.; Arima, H.; Komatsu, K.; Yamada, A.; Inamura, Y.; Nakatani, T.; Seto, Y.; Nagai, T.; Tsumi, W.; et al. Design and performance of high-pressure PLANET beamline at pulsed neutron source at J-PARC. Nucl. Instrum. Methods Phys. Res. 2015, A780, 55–67. [Google Scholar] [CrossRef]
  34. Paalman, H.H.; Pings, C.J. Numerical evaluation of X-ray absorption factors for cylindrical samples and annular sample cells. J. Appl. Phys. 1962, 33, 2635. [Google Scholar] [CrossRef]
  35. Blech, I.A.; Averbach, B.L. Multiple scattering of neutrons in vanadium and copper. Phys. Rev. 1965, 137, A1113. [Google Scholar] [CrossRef]
  36. NOVA Group, Institute of Materials Structure Science, Tsukuba, Ibaraki 305-080, Japan. Program nvaSq Manual. Available online: https://research.kek.jp/group/hydrogen/reduction/index.html (accessed on 26 June 2023). (In Japanese).
  37. Sears, V.F. Neutron scattering lengths and cross sections. Neutron News 1992, 3, 26. [Google Scholar] [CrossRef]
  38. Granada, J.R.; Gillette, V.H.; Mayer, R.E. Neutron cross sections and thermalization parameters using a synthetic scattering function. II: Applications to H2O, D2O, and C6H6. Phys. Rev. A 1987, 36, 5594. [Google Scholar] [CrossRef] [PubMed]
  39. Kameda, Y.; Sasaki, M.; Usuki, T.; Othomo, T.; Itoh, K.; Suzuya, K.; Fukunaga, T. Inelasticity effects on neutron scattering intensities of the null-H2O. J. Neutron Res. 2003, 11, 153–163. [Google Scholar] [CrossRef]
  40. OriginPro. The Ultimate Software for Graphing and Analysis; OriginLab Corp.: Northampton, MA, USA, 2022. [Google Scholar]
  41. Druchok, M.; Holovko, M. Molecular dynamics study of ion hydration under pressure. J. Mol. Liq. 2011, 159, 24–30. [Google Scholar] [CrossRef]
  42. Berendsen, H.J.C.; Grigera, J.R.; Straatsma, T.P. The Missing Term in Effective Pair Potentials. J. Phys. Chem. 1987, 91, 6269. [Google Scholar] [CrossRef]
  43. Soper, A.K. Computer simulation as a tool for the interpretation of total scattering data from glasses and liquids. Mol. Simul. 2012, 38, 1171–1185. [Google Scholar] [CrossRef]
  44. Soper, A.K. Empirical potential Monte Carlo simulation of fluid structure. Chem. Phys. 1996, 202, 295–306. [Google Scholar] [CrossRef]
  45. Soper, A.K. Partial structure factors from disordered materials diffraction data: An approach using empirical potential structure refinement. Phys. Rev. B 2005, 72, 104204. [Google Scholar] [CrossRef]
  46. Amann-Winkel, K.; Bellissent-Funel, M.-C.; Bove, L.E.; Loerting, T.; Nilsson, A.; Paciaroni, A.; Schlesinger, D.; Skinner, L. X-ray and Neutron Scattering of Water. Chem. Rev. 2016, 116, 7570–7589. [Google Scholar] [CrossRef] [PubMed] [Green Version]
  47. Shannon, R.D. Revised effective ionic radii and systematic studies of interatomic distances in halide and chalcogenides. Acta Crystallogr. 1976, A32, 751–767. [Google Scholar] [CrossRef]
Figure 1. Phase diagram of H2O [26] and thermodynamic states where the scattering data of a 2 m MgCl2 aqueous solution were taken in this study. Red and black circles correspond to PT conditions for X-ray- and neutron-scattering measurements. Red solid and black dashed arrows show the experimental pressure and temperature path for the X-ray- and neutron-scattering experiments.
Liquids 03 00019 g001
Figure 2. X-ray and neutron interference functions (left frame) and the radial distribution functions (right frame) obtained by experiments (black dots) and EPSR modeling (red lines) of 2 m MgCl2 aqueous solutions as a function of pressure and temperature. X and N denote X-ray and neutron, respectively.
Liquids 03 00019 g002
Figure 3. Pdfs (left frames) and CN distributions (right frames) of Mg–Ow and Mg–Hw pairs in 2 m MgCl2 aqueous solutions in different thermodynamic states obtained by EPSR modeling.
Liquids 03 00019 g003
Figure 4. Angle distributions of ∠ Ow–Mg–Ow and ∠ Mg–Ow–Hw for the Mg2+ solvation in 2 m MgCl2 aqueous solutions in different thermodynamic states obtained by EPSR modeling.
Liquids 03 00019 g004
Figure 5. Pdfs (left frames) and the CN distributions (right frames) of Cl–Ow and Cl–Hw pairs in 2 m MgCl2 aqueous solutions in different thermodynamic states obtained by EPSR modeling.
Liquids 03 00019 g005
Figure 6. Angle distributions of ∠ Ow–Cl–Ow and ∠ Cl–Hw–Ow for the Clsolvation in 2 m MgCl2 aqueous solutions in different thermodynamic states.
Liquids 03 00019 g006
Figure 7. Pair distribution functions (left frames) and the coordination number distributions (right frames) of Ow–Ow and Ow–Hw pairs for solvent water in 2 m MgCl2 aqueous solutions in different thermodynamic states obtained by EPSR modeling.
Liquids 03 00019 g007
Figure 8. Distributions of ∠ Ow-Ow–Ow and ∠ Ow–Hw–Ow angles of solvent water in 2 m MgCl2 aqueous solutions in different thermodynamic states obtained by EPSR modeling.
Liquids 03 00019 g008
Figure 9. Spatial density functions of the nearest-neighbor water oxygen around a central water molecule for solvent water in 2 m MgCl2 aqueous solutions in different thermodynamic states. Red and white balls at the center denote a water molecule’s oxygen and hydrogen atoms, respectively. The pink, green, and yellow lobes represent the first, second, and third neighbor water oxygen distributions, respectively.
Liquids 03 00019 g009
Figure 10. Pair distribution functions (left frame) and coordination number distributions (right frame) of Mg–Cl pairs for the ion association in different thermodynamic states in 2 m MgCl2 aqueous solutions obtained by EPSR modeling.
Liquids 03 00019 g010
Table 1. Concentration c, bulk densities dX and dN, the atomic number densities ρS of a sample solution, and measured conditions of aqueous MgCl2 solutions. X and N denote X-ray and neutron-scattering, respectively.
Abbreviationc/mol dm–3dX/g cm–3dN/g cm–3ρS/atoms Å–3PX/GPaPN/GPaTX/KTN/KMethod
0.1 MPa 300 K2.0241.1131.2040.095771.0 × 10−41.0 × 10−4300298X, N
1 GPa 300 K2.3971.3771.4260.11341.00.65300298X, N
1 GPa 500 K2.1251.2691.2640.10051.00.63500523X, N
2 GPa 500 K2.0201.3960.13862.0500X
4 GPa 500 K2.4391.4591.4510.13883.84.5500523X, N
Table 2. Potential parameter values for each element.
Atomsε/kJ mol–1 σ / Å Atomic MassCoulomb Charge/eRefs.
Mg2+0.00402.6324.312[20]
Cl0.41874.4035−1[41]
Ow0.653.1616.00−0.8476[42]
Hw0.000.002.000.4238[42]
Table 3. Interatomic distances (r) and coordination numbers (CN) of the individual atom pairs in a 2 m MgCl2 aqueous solution at various pressures and temperatures. I and II denote the first- and second-coordination shells, respectively. rmax is the upper limit of integration in Equation (5) to define the coordination shell. The uncertainties in the interatomic distance are estimated as 0.02 and 0.04 Å for the first and outer shells, respectively.
P, T ParameterMg–Ow(I)Mg–Hw(I)Mg–Ow(II)Cl–Ow(I)Cl–Hw(I)Cl–Ow(II)Mg–Cl(I)Mg–Cl(II)
0.1 MPa/
300 K
r/Å1.922.583.783.182.325.762.374.32
C.N.6.0 ± 0.212.0 ± 0.4 8.2 ± 1.26.7 ± 1.1 0.01 ± 0.12
rmax2.403.15 4.053.00 3.21
1 GPa/
300 K
r/Å1.922.584.533.142.244.41, 5.752.334.57
C.N.5.0 ± 1.310.2 ± 2.6 8.2 ± 1.86.2 ± 2.0 0.78 ± 0.90
rmax2.373.09 3.872.91 3.15
1 GPa/
500 K
r/Å1.922.614.143.212.315.862.194.50
C.N.4.2 ± 2.08.6 ± 4.0 8.4 ± 2.24.0 ± 2.0 1.12 ± 1.27
rmax2.583.18 4.172.88 2.85
2 GPa/r/Å1.924.033.125.702.354.34
500 KC.N.5.3 ± 0.9 14.2 ± 1.5 0.65 ± 0.75
rmax2.32 4.19 3.00
4 GPa/500 Kr/Å1.932.613.993.142.185.732.364.34
C.N.5.6 ± 0.711.4 ± 1.2 14.0 ± 1.46.2 ± 1.6 0.33 ± 0.54
rmax2.313.07 4.152.72 3.30
Table 4. Interatomic distances (r) and coordination numbers (CN) of Ow–Ow and Ow–Dw for solvent water in 2 m MgCl2 aqueous solutions under the four thermodynamic conditions. I, II, and III denote the first-, second-, and third-coordination shells, respectively. rmax is the upper limit of the integration Equation (5). The uncertainties in the interatomic distance are estimated as 0.01 and 0.03 Å for the first and outer shells, respectively.
P, TParametersOw–Ow(I)Ow–Hw(I)Ow–Ow(II)Ow–Ow(III)
0.1 MPa/
300 K
r/Å2.761.803.91–4.806.63
C.N.4.6 ± 1.71.1 ± 0.90
rmax3.392.04
1 GPa/
300 K
r/Å2.792.073.846.09
C.N.6.3 ± 1.81.3 ± 1.0
rmax1.82.13
1 GPa/
500 K
r/Å2.851.985.618.22
C.N.7.6 ± 1.71.5 ± 1.1
rmax3.782.22
2 GPa/r/Å2.71 5.317.99
500 KC.N.9.5 ± 1.5
rmax3.63
4 GPa/
500 K
r/Å2.741.745.387.83
C.N.8.4 ± 1.60.88 ± 0.84
rmax3.691.98
Disclaimer/Publisher’s Note: The statements, opinions and data contained in all publications are solely those of the individual author(s) and contributor(s) and not of MDPI and/or the editor(s). MDPI and/or the editor(s) disclaim responsibility for any injury to people or property resulting from any ideas, methods, instructions or products referred to in the content.

