Article

Liquid-State Volumetric Properties of a Set of Alcohols with Up to Five Carbon Atoms

División de Ingeniería Térmica e Instrumentación (IDeTIC), Universidad de Las Palmas de Gran Canaria, 35017 Las Palmas de Gran Canaria, Spain
*
Author to whom correspondence should be addressed.
Liquids 2022, 2(1), 1-13; https://doi.org/10.3390/liquids2010001
Submission received: 25 October 2021 / Revised: 1 December 2021 / Accepted: 30 December 2021 / Published: 4 January 2022
(This article belongs to the Section Chemical Physics of Liquids)

Abstract

:
This work provides density data (~1300 values) of 14 alcohols with up to five carbon atoms at p ∈ [0.1–40] MPa and T ∈ [278–358] K. The information obtained is modeled with a convenient reformulation of the Tait equation from which the volumetric coefficients, α and β, are derived both analytically and numerically. The general EoS containing α and β is also used for checking the consistency of the hypothesis on the invariability of the cited thermophysic parameters. The results obtained can be considered reliable because of the low estimated errors between the experimental data and those of the literature, which are below 0.4% for volume, while for the volumetric coefficients there is always a reference diverging 10%, or less, from the proposed model estimations. By including the averages of α and β into the general state of equation the errors increase, being <15%, compared to those based on the Tait equation. Hence, the assumption on the stability of the volumetric coefficients in this working interval is sufficient to make rough estimations of the molar volume of the selected alcohols.

1. Introduction

One option to reduce the dependence that today’s society has on fossil fuels (oil, coal, natural gas, etc.) is its replacement by biofuels obtained from renewable raw materials, such as certain natural resources and biomass. Biofuels can be solid, liquid, or gaseous. The group of liquids includes, as most prominent, biodiesel and bioalcohols. Of the latter, obtained mainly by the fermentation of starch or sugar, biomass, and residues, the bioethanol and biomethanol appear as the more highlighted; moreover, the use of higher alcohols has been demonstrated for the near future, generating a wide range of bioalcohols, such as biopropanol and even biopentanol [1]. Likewise, in recent years, the interest in using bioalcohols as fuels has been addressed towards isomers made of 4 or 5 carbon atoms. This is due to their high energy density and cetane-index, high combustion quality, and their lower moisture absorption, compared to primary alcohols. Moreover, by themselves they are compatible with currently available compression ignition engines (diesel engines) and by forming blends with diesel or biodiesel [2]. This is a significant advantage since it implies that their use does not require drastic modifications, or replacement of the existing engines.
Currently, diesel engines can reach common-rail pressures up to 2000 bar [3]. Thence, the intended use of these alcohols as fuels requires an extensive knowledge of their properties under those extreme conditions.
This work addresses the analysis of the volumetric behavior of 14 alcohols, CnH2n+1(OH), five normal and nine isomers, formed by up to five carbon atoms, from methanol (n = 1) to pentanol (n = 5), in the interval of pressures, p ∈ [0.1–40] MPa, and temperatures, T ∈ [278–358] K. The literature contains dense information on densities for some of the selected alcohols [4,5,6,7,8,9,10,11,12,13,14,15,16,17,18,19,20], while, for others, the existing information is scarce [21,22,23]. The main characteristics of the information gathered from literature are summarized in Table 1, detailing the number of references concerning each alcohol, the temperature range and maximum pressure of the measurements, and their specific references. For those alcohols highly referenced in the literature, only the three most recent have been selected. Although the initial idea was to obtain measurements for alcohols with n ≥ 3, the values for methanol and ethanol were also determined to validate the experimental technique deployed in this work, comparing them with those from literature. The main goal of this work is to expand the existing high-pressure density database, including original data for the 3-methylbutan-2-ol, measured here for the first time. The (p,ρ,T) information acquired in this work is used to check the validity of an equation of state (EoS), similar to that of Tait [24] for the compounds of this nature. In addition, other volumetric parameters are calculated.

2. Materials and Methods

2.1. Materials

The alcohols used in this work were from Sigma-Aldrich with the highest commercial quality. The purity indicated by the manufacturer was checked using gas chromatography GC, and the moisture using the Karl–Fischer method. Those products that showed moisture higher than 300 ppm, were subsequently treated with molecular sieve, from Fluka, 3Å for several days until the water content was kept under this threshold. Before use, the compounds were also degasified with ultrasound for several hours. The final purity, measured by GC, was slightly higher than that given by the manufacturer. However, as an additional quality control, the density ρ and refractive index nD of all alcohols was determined at atmospheric pressure and at 298.15 K, such as indicated below, being our measurements in agreement with those provided in literature [25,26,27,28,29], Table S1 (Supplementary Material). The water used for calibration was obtained in our laboratory by multiple distillation, degassing it before use, being the final conductance smaller than 1 μS.

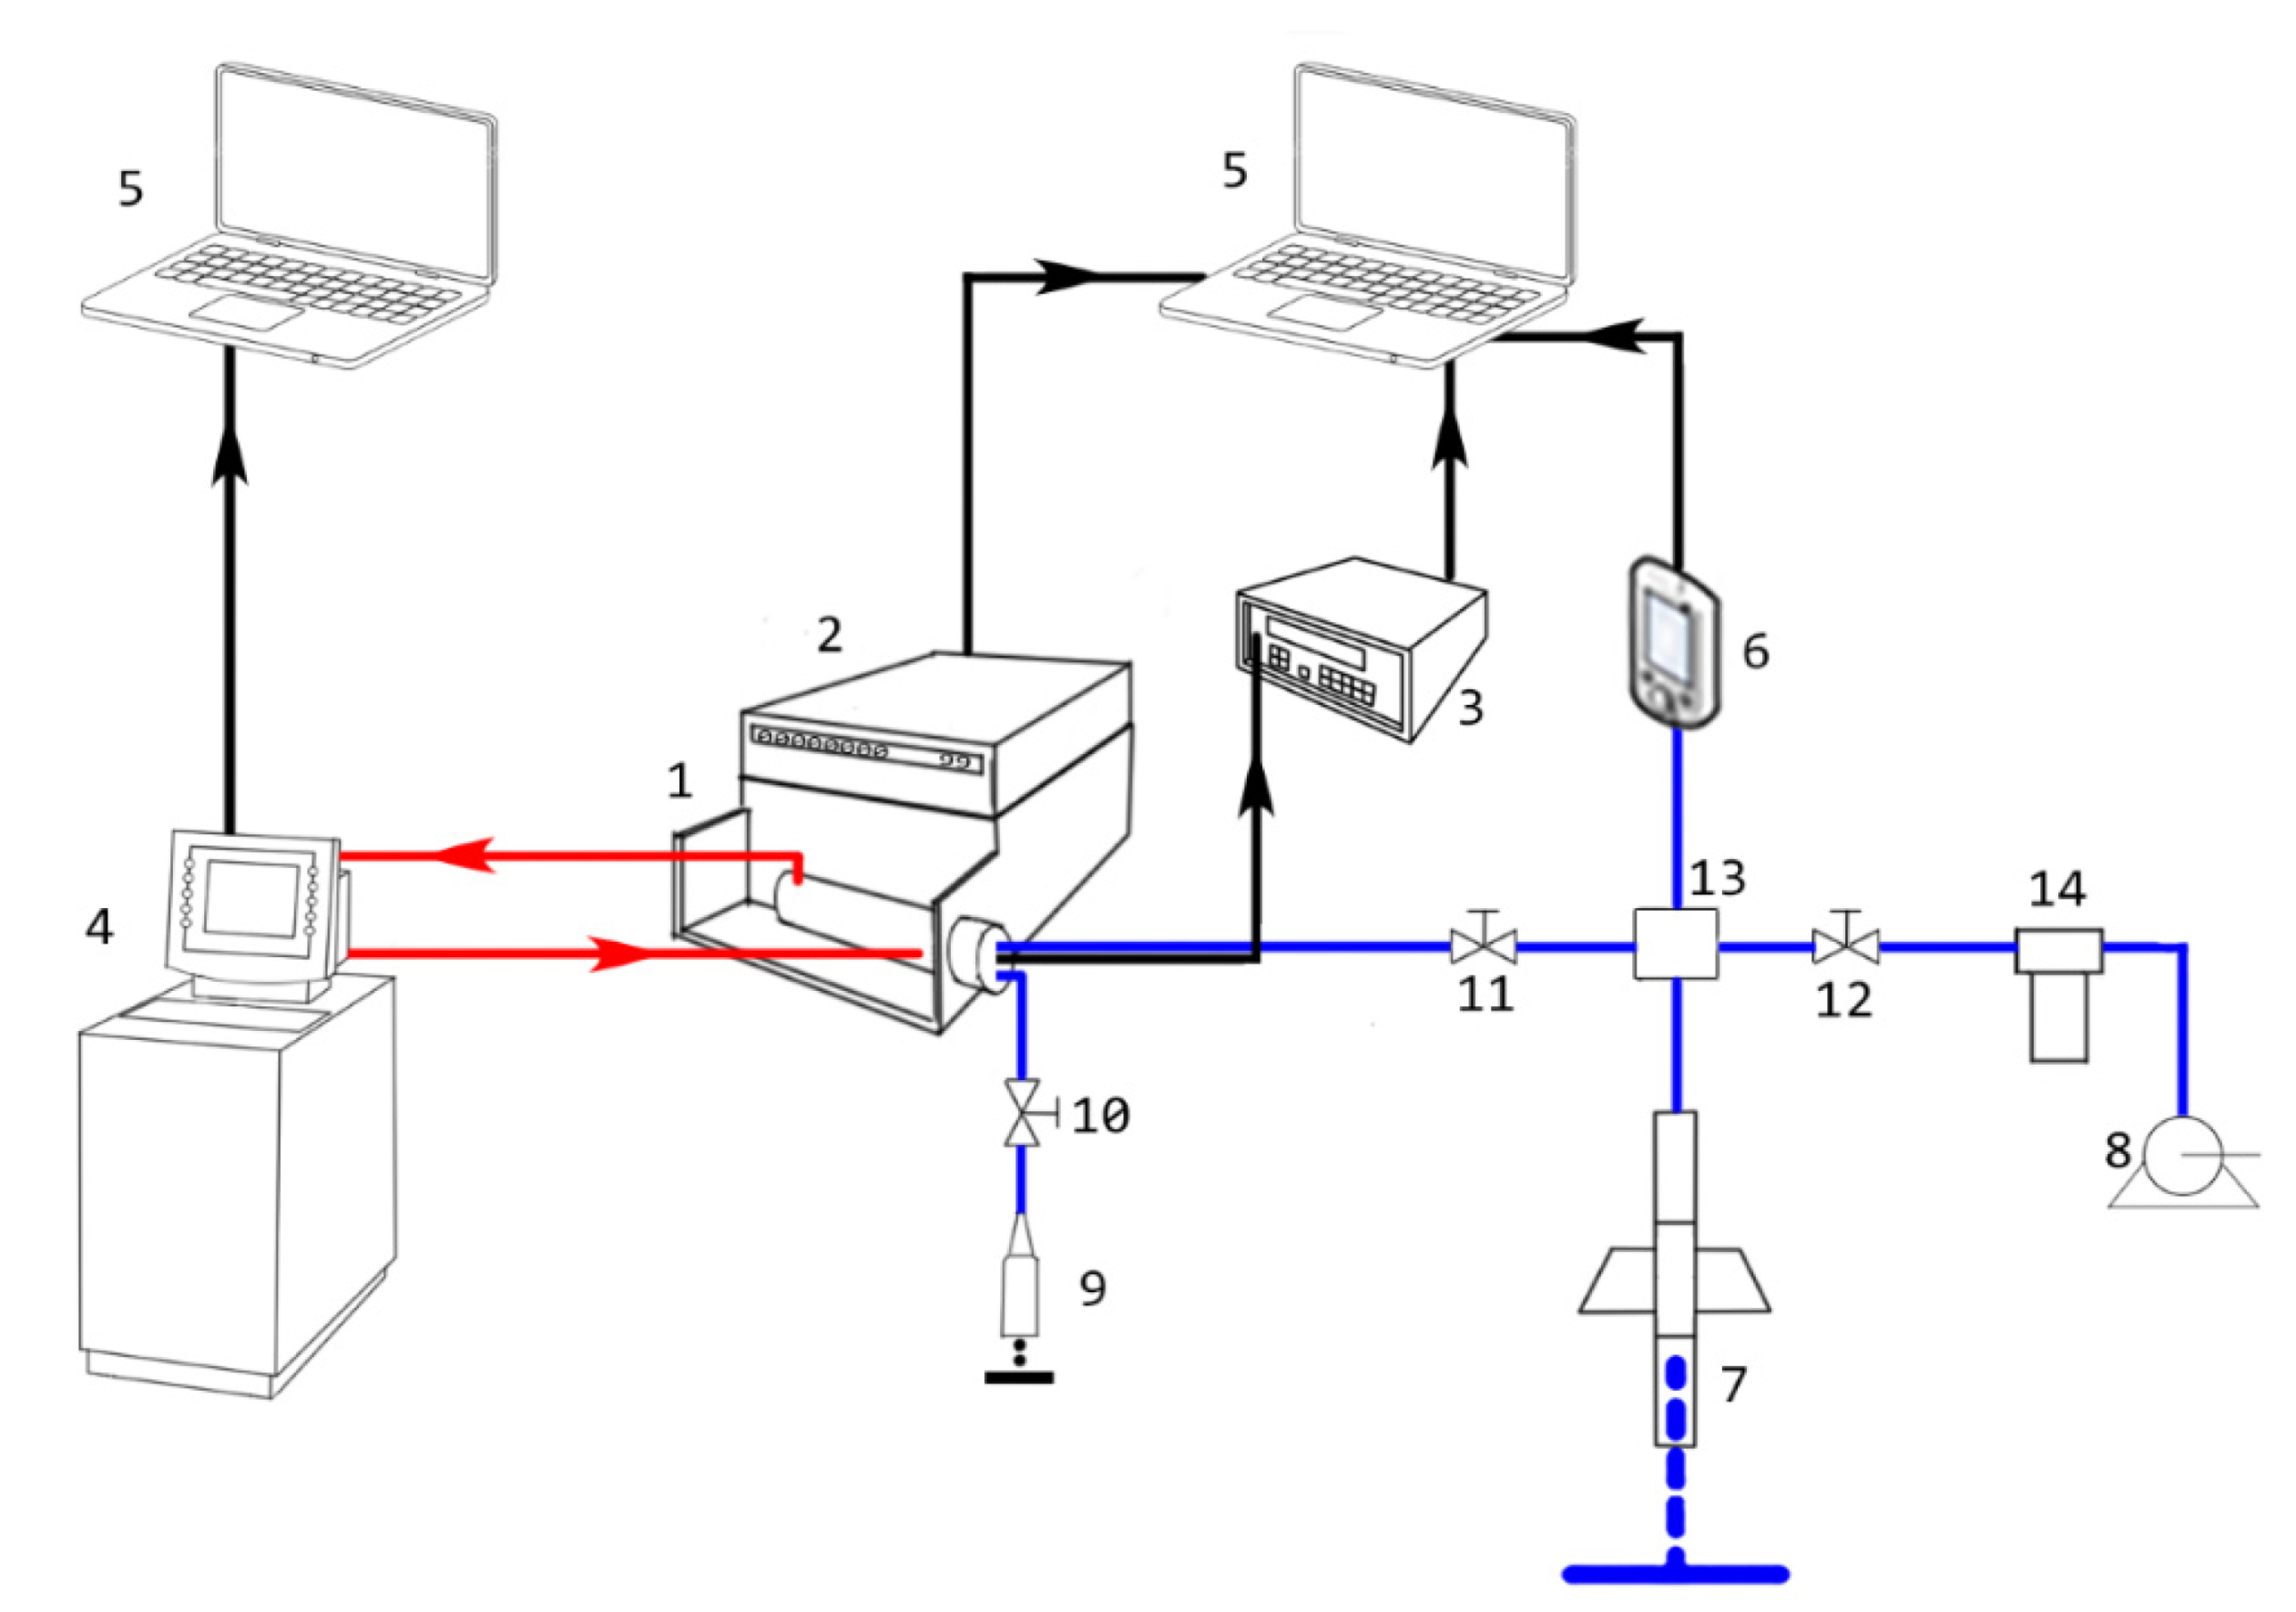
2.2. Apparatus and Experimental Technique

2.2.1. Characterization of Pure Compounds

The characteristics of the equipment used to assess the quality of the compounds are indicated. A chromatograph Varian, model 450, equipped with a HP-5 column and FID was employed for determining the purity of the compounds. The moisture was determined using a Karl–Fischer coulometric titrator, model C-20, from Mettler. Densities ρ, were measured with an Anton-Paar-60/602 digital densimeter, (ρ ± 0.02) kg·m−3, calibrated with water and nonane as usual in our laboratory [30]. For the nD’s a refractometer type Abbe, from Suzi, was used, with a reading precision of nD ± 0.0005. Both devices were connected to a circulating water bath Polyscience 1166D, keeping a temperature control at T ± 0.01 K.

2.2.2. Measurements of p-rho-T

Densities of alcohols selected for this work were measured into the following temperature and pressure intervals: p ∈ [0.1–40] MPa and T ∈ [278.15–353.15] K. An installation like that shown in Figure 1 was designed and built in our laboratory.
The mechanical oscillation densimeter, from Anton Paar, model DMA-512, with an estimated uncertainty of ±0.1 kg·m−3, was connected to a circulating bath Haake C25P to stabilize the temperature into the measuring cell at T ± 0.01 K. The oscillation period was achieved with a frequency-counter from the same manufacturer, model DMA-60, with an 8-digit reading display. A manual pressure generator HiP, model 50-6-15, was used, indicating the raised pressure in the digital manometer AE (6), model DMM-Evolution, whose reading uncertainty is (0.15%)p. The cell temperature was monitored with a digital thermometer ASL F25, T ± 0.01 K.
The calibration of the densimeter was done by conveniently modifying the procedure of Lagourette et al. [31], which relates the density of a substance with the period, Λ, of a response wave of a vibrating tube holding the sample by Equation (1).
ρ ( p , T ) = a ( T ) Λ 2 ( p , T ) + b ( p , T )
To obtain the parameters a and b, the response period is measured when the cell is full of water at different calibration pressures and temperatures, and also when it is submitted to vacuum at different temperatures. From this information and considering the reference values for the density of water [32], the parameters a and b are calculated using Equation (2).
a ( T ) = ρ w ( T , 0.1 MPa ) Λ w 2 ( T , 0.1 MPa ) Λ 0 2 ( T ) b ( T , p ) = ρ w ( T , p ) a ( T ) Λ w 2 ( T , p )
It should be noted that Equation (2) just provides values for a and b at calibration conditions, but it does not allow interpolation; however, the former expressions provide a discrete mesh of values for a and b. As densities are to be evaluated at different temperatures and pressures, in this work the polynomials described by the following equations are used to relate the mentioned constants with T and p. That is,
a ( T ) = a 0 + a 1 T b ( T , p ) = b 0 + b 1 T + b 2 p
Hence, the calibration is constituted by a set of parameters for Equation (3) that enable the interpolation of a and b constants within the calibration T,p-interval to be used in Equation (1). These parameters of the calibration curve were obtained by a least-squares fitting of the calculated values with Equation (2) at different temperatures and pressures, which are summarized in Table 2.

2.3. Modeling

Density data were correlated using a form of the Tait equation [24] for the molar volume (v = M/ρ). That relationship is obtained from the definition of the isothermal compressibility coefficient, making the slope, (∂v/∂p)T, guided by a hyperbolic relationship of the type:
v p = A B + p
v 0 v d v = p 0 p A B + p d p whose solving produces
v = v 0 + A ln ( B + p B + p 0 )
A common variation of this equation to define the relationship v = v (T) is to establish the coefficients A and B as a functions of temperature, i.e., A(T), B(T), and to choose a reference volume at a reference pressure, p0, but at different temperatures, v0 (p0,T). The indicated relationships are adequately represented by quadratic functions in such a way that Equation (5) can be used over a wide range of temperatures and pressures. This is,
v ( p , T ) = v 0 ( p 0 , T ) + A ( T ) ln [ B ( T ) + p B ( T ) + p 0 ]
where:
v 0 ( T ) = v 00 + v 01 T + v 02 T 2 ; A ( T ) = A 0 + A 1 T + A 2 T 2 ; B ( T ) = B 0 + B 1 T + B 2 T 2
The parametrization procedure to correlate Equation (6) with the experimental data consists of the following stages:
i.
define the first relationship of Equation (7) in the isobaric corresponding to the reference pressure (0.1 MPa);
ii.
establish the parameters of the coefficients A(T) and B(T).
For both stages, the Simplex method from Nelder-Mead, Lagarias [33] is used to minimize the variance, sv, of the model, expressed as:
s v = [ i = 1 N ( v i , exp v i , cal ) 2 / N ] 1 / 2
where N is the size of the dataset and the subindices “exp” and “cal” refer to experimental observations and calculated values, respectively.
The two volumetric coefficients, the expansion coefficient, α, and that of isothermal compressibility, β, were both derived from the Tait equation to provide more solid evidence of the reliability of the obtained parametrizations. Given their definitions, these two coefficients inform about the stability of the slope of the volume. The expressions for both are:
α ( p , T ) = 1 v ( v T ) p = 1 v [ v 0 , T ( T ) + A T ( T ) ln ( B ( T ) + p B ( T ) + p 0 ) A ( T ) p 0 , T ( B ( T ) + p 0 ) + ( p p 0 ) ( B T ( T ) p 0 , T ) ( B ( T ) + p ) ( B ( T ) + p 0 ) ]
β ( p , T ) = 1 v ( v p ) T = 1 v [ A ( T ) B ( T ) + p ]
where v0,T (T) = (∂v0/∂T)p, AT(T) = (∂A/∂T)p, BT (T) = (∂B/∂T)p, p0,T (T) = (∂p0/∂T)p.
Although in this work the reference pressure, p0, was chosen to be independent from temperature, Equation (9) is generally applicable to any other hypothesis of this quantity. For example, Ihmels and Gmehling [34] modified the Tait equation by proposing a reference pressure for each isothermal matching with the vapor pressure of the pure compound. For this modification, our derived expression for the volumetric expansion coefficient also applies.
The calculated volumetric coefficients are compared with those found in the literature. The data are sparsely distributed among several references [26,35,36,37,38,39,40,41,42], showing different experimental techniques. In the first six references the volumetric coefficients are compared directly from Equations (9) and (10). However, the values provided by Egorov [41,42] are average values (see Equation (11)) of the isothermal compressibility over pressure, while those of Riddick et al. [26] are averaged over temperature, t ∈ [0, 40] °C, at atmospheric pressure. The main characteristics of the literature data on volumetric coefficients are summarized in Table 3. Thus, an additional expression based on Equations (9) and (10) is used to enable the comparison between the proposed model and these last references.
y ^ = 1 φ 1 φ 0 φ 0 φ 1 y ( φ | φ ¯ ) d φ
In the Equation (11) we denote by y either the volumetric coefficients α or β, and y ^ their corresponding averaged values. Moreover, φ is the variable to which y is (T or p) averaged over the interval φ [ φ 0 , φ 1 ] , while φ ¯ is its complementary variable, which is held constant at an arbitrary condition. Therefore, the function, y(φ| φ ¯ ) reads as y-function of φ at constant φ ¯ . It is frequent to find in the literature [26], average values of the volumetric thermal coefficients; so, the simplest way to estimate approximate values of the molar volumes, v, and densities, ρ = Mm/v, is to assume that the volumetric coefficients are constant over a more or less wide range of conditions and solve the following differential equation of state:
d v v = α d T β d p v ( p , T ) = v 0 ( p 0 , T 0 ) exp [ α ^ ( T T 0 ) β ^ ( p p 0 ) ]
Equation (12) holds when the volumetric coefficients are constant over the integration interval. In this work, the derivatives of the molar volume, Equations (9) and (10) are used to test the above relationship for all datasets. For this, the average values of the volumetric coefficients are determined over the entire p-T domain according to the following expression:
y ^ p T = 1 ( T 1 T 0 ) ( p 1 p 0 ) p 0 p 1 T 0 T 1 y ( p , T ) d T d p
where y ^ p T is the average of a generic volumetric coefficient, and the subscript indicates that this is done throughout the domain. The selected integration interval for T was [278–313] K, except for 2-methylpropan-2-ol, for which it took 303 and 338 K, to avoid the solid–liquid saturation curve. However, on average the entire pressure range is used.

3. Results and Discussion

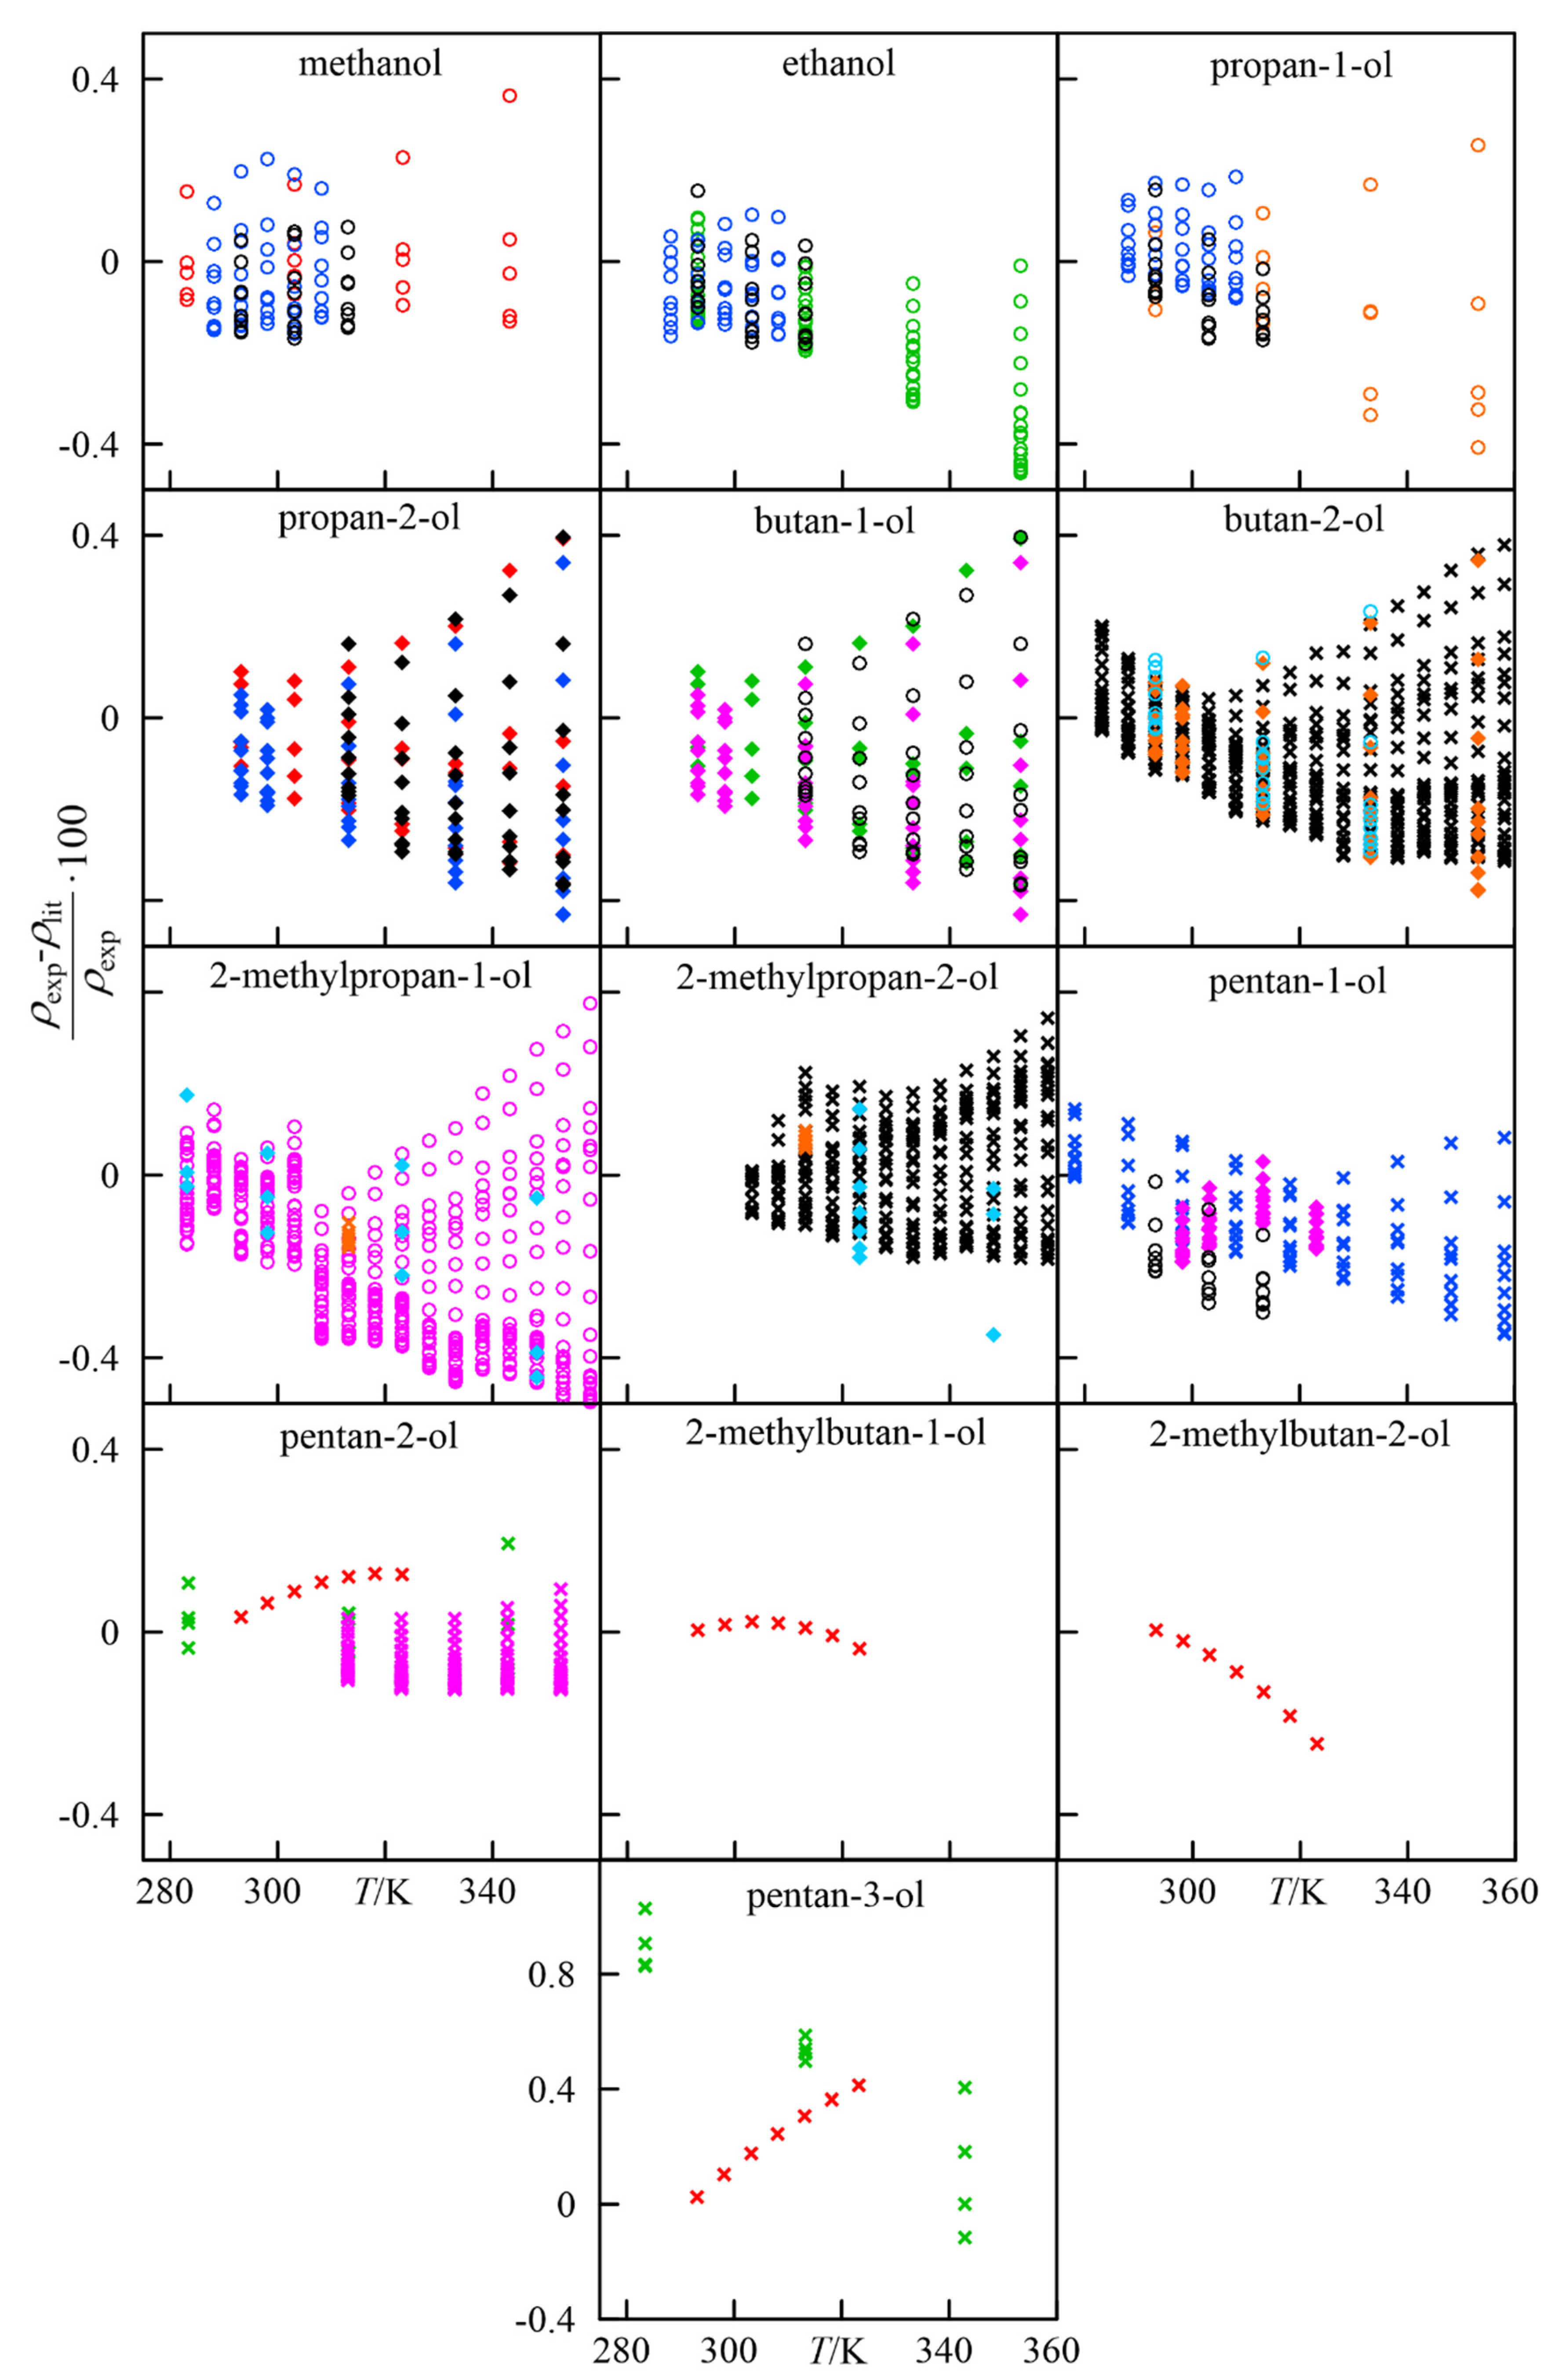
3.1. Comparison to Literature Data

The values of density measurements for each of the alcohols at the working pressures, p ∈ [0.1–40] MPa, and temperatures, T ∈ [278.15–353.15] K, are summarized in Table S2. The limits of these two variables were conveniently delimited for methanol, ethanol, propan-2-ol, and 2-methylpropan-2-ol, considering the values established by the corresponding solid–liquid and vapor–liquid saturation curves, and also by the restriction of the experimental apparatus. Experimental results obtained were compared with those of literature indicated in Table 1, expressing the corresponding relative deviations graphically, see Figure 2. It is remarkable for all compounds the increase in the discrepancy observed as the temperature increases. However, the greatest difference observed (≈1%) corresponds to pentan-3-ol, in relation to the values by Wappmann et al. [21]. For the rest of the alcohols, the relative deviations are in an interval oscillating in ±0.4%. A complementary discussion on some concrete cases is detailed below:
  • methanol and ethanol: up to T ≈ 320 K, the literature values and those provided in this work deviate up to ±0.2% for the whole pressure range considered here. At higher temperatures, the deviations increase up to 0.4%. These values are acceptable, confirming the suitability of the experimental method used in our work.
  • propan-1-ol, propan-2-ol, butan-1-ol, butan-2-ol, 2-methylpropan-1-ol, pentan-1-ol: a strong increase in the relative deviations between the experiments and literature is observed for these compounds as temperature increases. Nevertheless, the differences are below 0.4%.
  • 2-methylpropan-2-ol: experimental data provided for this compound is limited by its solid–liquid saturation curve. It is also observed that the deviations are insensitive to an increase in the temperature, and the deviations are within the interval established by other alcohols.
  • pentan-2-ol, pentan-3-ol, 2-methylbutan-1-ol, 2-methylbutan-2-ol, 3-methylbutan-2-ol: literature data for these systems are scarce, therefore no objective comparison of our measurements can be made. At T = 280 K, pentan-3-ol shows the highest deviation observed in this work, ≈1%. No p-v-T data have been found for 3-methylbutan-2-ol, so the information presented here is novel.

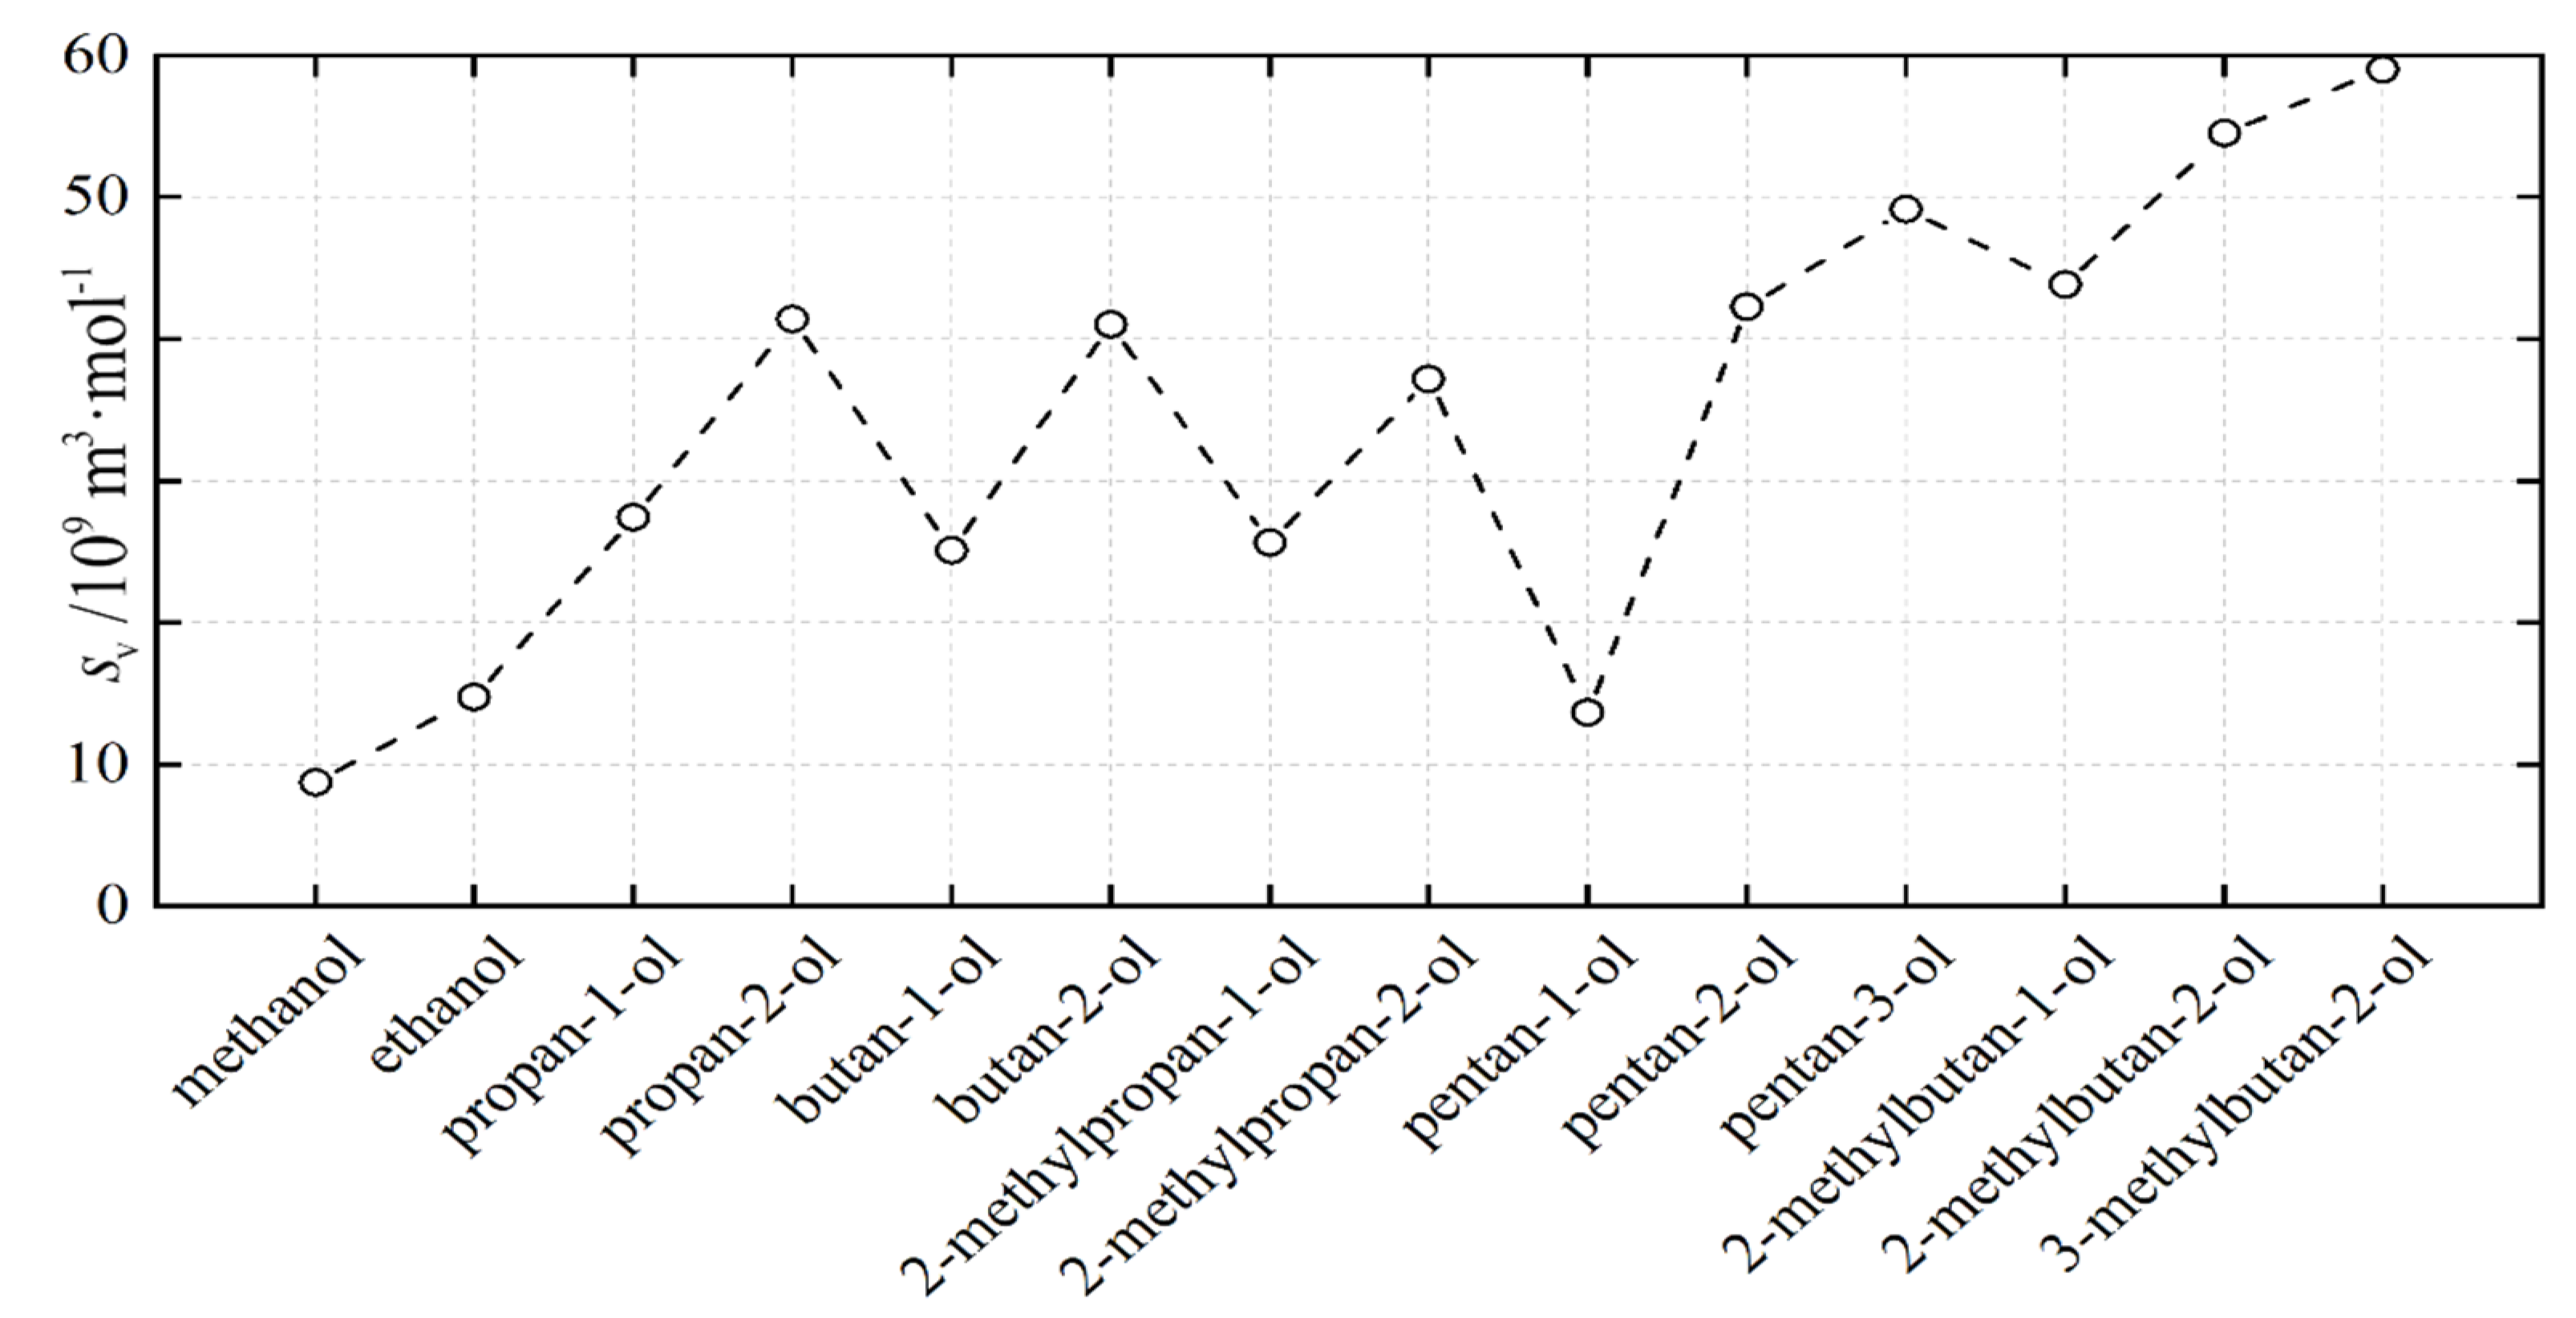
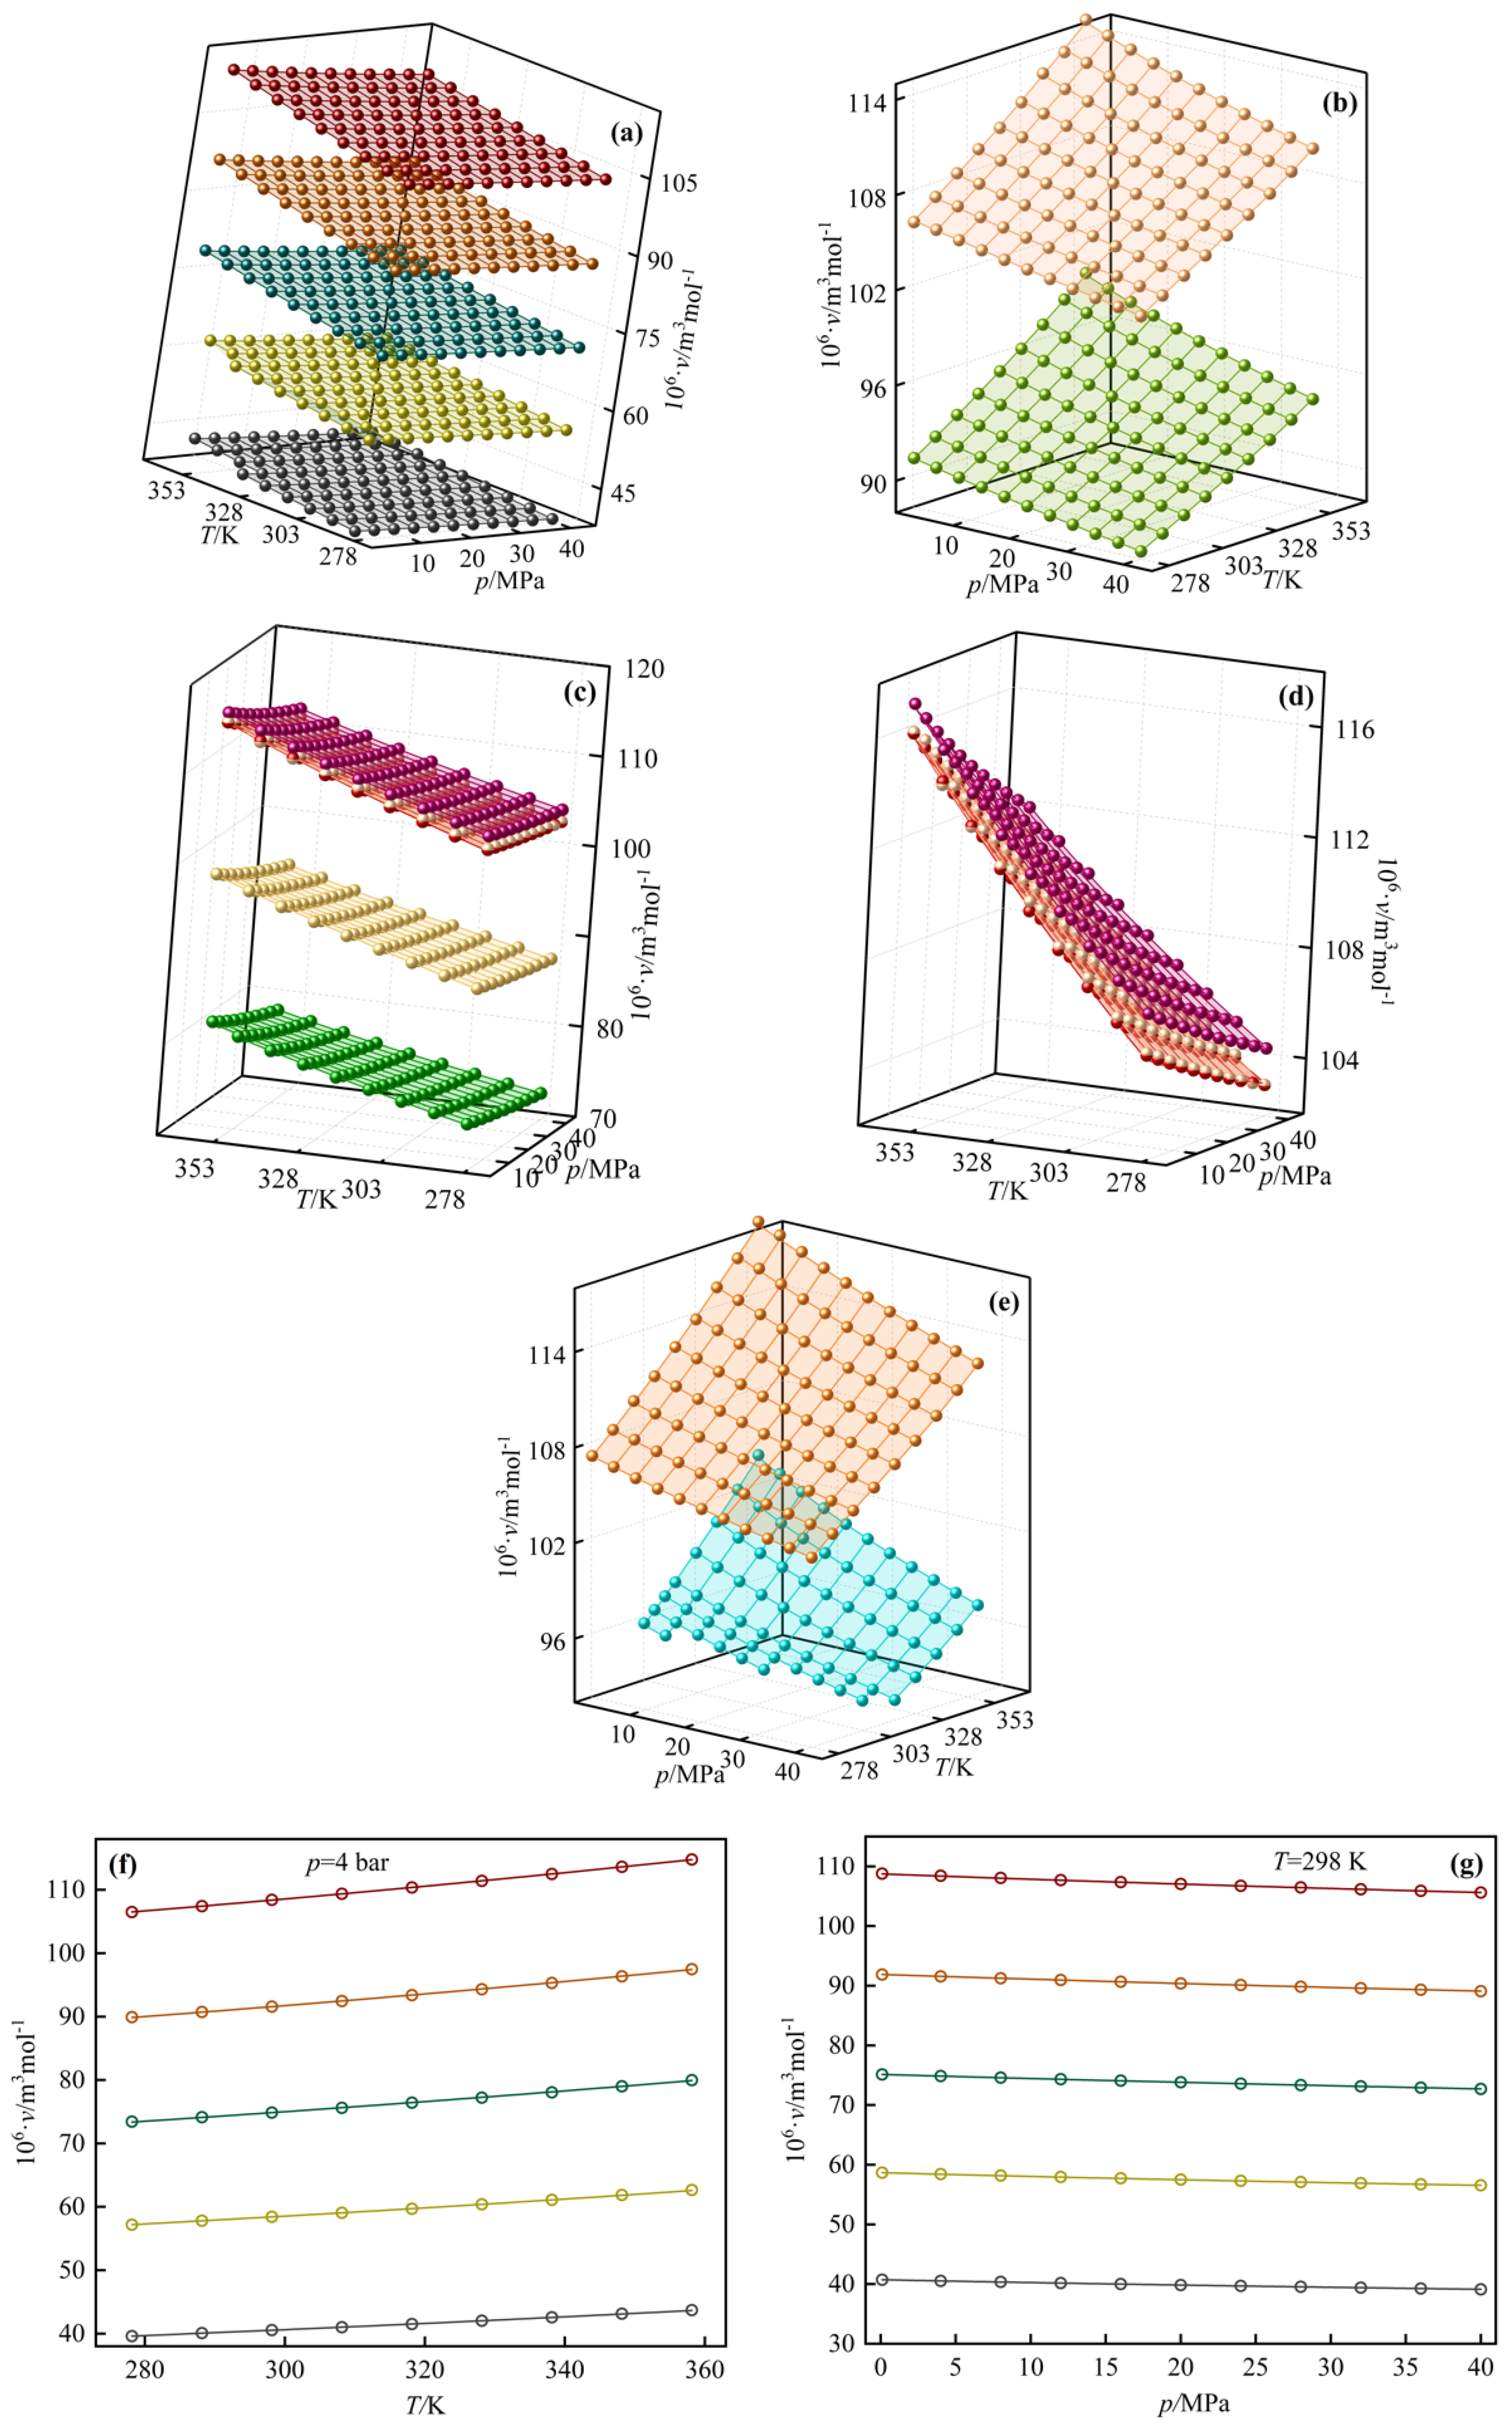
3.2. Modeling Results

The parameters resulting from the indicated procedure, for Equations (6) and (7), are presented in Table 4. It is noteworthy that the order of magnitude of the deviations between the model estimations and the experimental data, 10−8 m3 mol−1, coincides with the uncertainty of the apparatus. A progressive increase in the deviations with the molecular weight of the alcohol is observed, with a maximum difference corresponding to 3-methylbutan-2-ol (Figure 3), typical of the difficulty in measuring the heavier alcohols.
Equation (6) acceptably represents the experimental information v = v (p,T), from a qualitative and quantitative point of view. The accuracy of the proposed modeling can be observed in Figure 4. In the latter, the alcohols are grouped with respect to the position of the -OH functional group as well as their structure, distinguishing linear from branched chains. It can be seen that the molar volumes of the isomers are almost identical to each other, which is evidenced in Figure 4c. In addition, Figure 4f,g clearly depicts the variation of the mole volume of alcohols with temperature at constant p = 4 bar and with pressure at constant temperature of T = 298 K, being the first more acute than the second in the range of the experimental conditions.
As mentioned in Section 2.3, the values of the α and β coefficients are calculated using Equations (9) and (10), and also with Equation (11) when it is necessary to average the last two quantities. The calculations made with the proposed model here, similar to that of Tait, are compared with the values collected from literature according to Table 3. The estimated overall Mean Absolute Relative Deviations (MARD), Equation (14), for each component corresponding to each reference are summarized in Table 5.
M A R D = 100 N lit · k = 1 N lit | | y k , lit y k , calc | y k , lit |
where yk,lit and yk,calc are the generic volumetric coefficients of the “k-th” observation both extracted from the literature and calculated, respectively; Nlit is the number of observations contained in each reference database.
As mentioned, the agreement between the estimations made with the version presented of Tait equation and those from literature is reasonably good. However, an outlier was found when comparing with reference [41] in β, since for almost all compounds there is a reference showing a discrepancy around 10% or less. Despite this, the concordance of the proposed model with the available information, both from literature and our experimental data, shows the reliability of the obtained parametrizations for each pure compound.
Assuming that the volumetric coefficients are constant over the working range of p and T provided interesting results. Thus, Equation (13), particularized for both alpha and beta coefficients, is introduced into Equation (12) to determine the v (p,T) of pure compounds. The corresponding calculations are summarized in Table 6; in addition, the increase in relative error is also calculated when the last equation is considered instead of the first. For each compound, the hypothesis of constant volumetric coefficients throughout the range lead to an increase in estimation errors, which are below 15%, and even below 10% for most of them, except for the tert-butanol. This result was expected, but even so, the increments are small and the reliability of the rough estimates made with the simplified equation of state, Equation (12), could be accepted, which would be quite useful to calculate v (p,T) values.

4. Conclusions

This work reports the experimental data of the variables p-rho-T of 14 alcohols (primary, secondary and tertiary) with up to five carbon atoms. A database with more than 1300 values was generated, see SM, within the intervals of p ∈ [0.1–40] MPa, and T ∈ [278–358] K. The measured values are acceptable and agree well with those existing in literature, presenting relative errors of the order of 0.4%. For several alcohols, the range of p and T measurements was extended compared to the literature; measurements for 3-methylbutan-2-ol, are published for the first time in this work, and the values obtained being consistent with those found for the other alcohols. The modeling with a different version of the original Tait equation provided good results. From it, other derived properties were estimated, such as the volumetric coefficients, whose comparison with those from literature certified the stability of the parametrization carried out. The use of the averages of the last two quantities in the general EoS containing the alpha and beta coefficients, provided acceptable rough estimates of the molar volumes in the working interval, but showing higher errors (5 ≤ ΔMARD ≤ 15) than those obtained with the modified Tait equation.

Supplementary Materials

The following are available online at https://www.mdpi.com/article/10.3390/liquids2010001/s1, Table S1: Densities and refractive indices of pure alcohols at T = 298.15 K and atmospheric pressure (≈98.9 kPa), Table S2: Experimental p,ρ,T values.

Author Contributions

Conceptualization, J.O.; data curation, B.L., J.A.Y. and A.S.; formal analysis, L.F.; investigation, J.O. and A.S.; methodology, J.O. and L.F.; project administration, J.O.; Resources, B.L. and J.A.Y.; software, A.S. and B.L.; Supervision, J.O.; Writing—original draft, B.L. and A.S.; Writing—review & editing, J.O. All authors have read and agreed to the published version of the manuscript.

Funding

This research eas partially funded by the Spanish Ministry of Science and Innovation, under grant number PGC2018-0++521-B-I00.

Institutional Review Board Statement

Not applicable.

Informed Consent Statement

Not applicable.

Data Availability Statement

Not applicable.

Acknowledgments

The authors are grateful for the funding from the Spanish Ministry of Science and Innovation (PGC2018-099521-B-I00). B.L. appreciates the financial of contract PRE2019-087401. All authors have agreed to mention this acknowledgment.

Conflicts of Interest

The authors declare no conflict of interest.

References

  1. Kumar, B.R.; Saravanan, S. Use of higher alcohol biofuels in diesel engines: A review. Renew. Sustain. Energy Rev. 2016, 60, 84–115. [Google Scholar] [CrossRef]
  2. Babu, V.B.M.V.; Murthy, M.M.K.M.; Rao, G.A.P. Butanol and pentanol: The promising biofuels for CI engines—A review. Renew. Sustain. Energy Rev. 2017, 78, 1068–1088. [Google Scholar] [CrossRef]
  3. High Pressure Common Rail—An overview|ScienceDirect Topics, (n.d.). Available online: https://www.sciencedirect.com/topics/engineering/high-pressure-common-rail (accessed on 17 June 2021).
  4. Scholz, C.W.; Frotscher, O.; Pohl, S.; Span, R.; Richter, M. Measurement and correlation of the (p, ρ, t) behavior of liquid methanol at temperatures from 283.15 to 423.15 k and pressures up to 90 mpa. Ind. Eng. Chem. Res. 2021, 60, 3745–3757. [Google Scholar] [CrossRef]
  5. Muche, D.N.F.; Olivieri, G.V.; Torres, R.B. Density and Derived Properties of Binary Mixtures Containing{2-(Dimethylamino)ethyl Methacrylate + Alcohols} at Temperatures from T = (293.15 to 313.15) K and Pressures of up to 35 MPa. J. Chem. Eng. Data 2019, 64, 1909–1921. [Google Scholar] [CrossRef]
  6. Alaoui, F.E.M.; Aguilar, F.; González-Fernández, M.J.; el Amarti, A.; Montero, E.A. Oxygenated Compounds + Hydrocarbon Mixtures in Fuels and Biofuels: Excess Enthalpies of Ternary Mixtures Containing 1-Butoxybutane + Propan-1-ol +1-Hex-1-ene, or Heptane, or 2,2,4-Trimethylpentane at (298.15 and 313.15) K. J. Chem. Eng. Data 2014, 59, 2856–2864. [Google Scholar] [CrossRef]
  7. Muñoz-Rujas, N.; Aguilar, F.; García-Alonso, J.M.; Montero, E.A. Thermodynamics of binary mixtures 1-ethoxy-1,1,2,2,3,3,4,4,4-nonafluorobutane (HFE-7200) + 2-propanol: High pressure density, speed of sound and derivative properties. J. Chem. Thermodyn. 2019, 131, 630–647. [Google Scholar] [CrossRef]
  8. Gómez-Álvarez, P.; González-Salgado, D.; Bazile, J.P.; Bessieres, D.; Plantier, F. Excess second-order thermodynamic derivatives of the{2-propanol+water} system from 313.15K to 403.15K up to 140MPa. Experimental and Monte Carlo simulation study. Fluid Phase Equilib. 2013, 358, 7–26. [Google Scholar] [CrossRef]
  9. Alaoui, F.E.M.; Montero, E.A.; Bazile, J.P.; Aguilar, F.; Boned, C. Liquid density of oxygenated additive 2-propanol at pressures up to 140 MPa and from 293.15 K to 403.15 K. J. Chem. Thermodyn. 2012, 54, 358–365. [Google Scholar] [CrossRef]
  10. Pimentel-Rodas, A.; Galicia-Luna, L.A.; Castro-Arellano, J.J. Viscosity and Density of n-Alcohols at Temperatures between (298.15 and 323.15) K and Pressures up to 30 MPa. J. Chem. Eng. Data 2019, 64, 324–336. [Google Scholar] [CrossRef]
  11. Fang, D.; Meng, X.; Wu, J. Compressed Liquid Densities of Binary Mixtures of 1-Butanol and Diethylene Glycol Dimethyl Ether from (283 to 363) K at Pressures up to 100 MPa. J. Chem. Eng. Data 2017, 62, 2937–2943. [Google Scholar] [CrossRef]
  12. Torín-Ollarves, G.; Martín, C.; Segovia, J. Thermophysical properties of 1,2,4-trimethylbenzene in admixtures with 1-butanol or 2-butanol at high pressures. J. Chem. Thermodyn. 2017, 111, 41–51. [Google Scholar] [CrossRef]
  13. Bravo-Sánchez, M.G.; Guerrero-Zárate, D.; Iglesias-Silva, G.A.; Estrada-Baltazar, A.; Bouchot, C. P-ρ-T Data for 2-Butanol and tert-Butanol from 283.15 to 363.15 K and 303.15 to 363.15 K at Pressures up to 66 MPa. J. Chem. Eng. Data 2016, 61, 1555–1565. [Google Scholar] [CrossRef]
  14. Dakkach, M.; Aguilar, F.; Alaoui, F.E.M.; Montero, E.A. Liquid density of oxygenated additives to biofuels: 2-Butanol at pressures up to 140 MPa and temperatures from (293.15 to 393.27) K. J. Chem. Thermodyn. 2015, 89, 278–285. [Google Scholar] [CrossRef]
  15. Iglesias-Silva, G.A.; Bravo-Sánchez, M.; Estrada-Baltazar, A.; Bouchot, C.; Hall, K.R. P-ρ-T Data for 1-Butanol and Isobutyl Alcohol from (283.15 to 363.15) K at Pressures up to 66 MPa. J. Chem. Eng. Data 2015, 60, 1076–1090. [Google Scholar] [CrossRef]
  16. Kodama, D.; Kato, M.; Kaneko, T. Volumetric behavior of carbon dioxide+2-methyl-1-propanol and carbon dioxide+2-methyl-2-propanol mixtures at 313.15K. Fluid Phase Equilib. 2013, 357, 57–63. [Google Scholar] [CrossRef]
  17. Kubota, H.; Tanaka, Y.; Makita, T. Volumetric behavior of pure alcohols and their water mixtures under high pressure. Int. J. Thermophys. 1987, 8, 47–70. [Google Scholar] [CrossRef]
  18. Dávila, M.J.; Alcalde, R.; Atilhan, M.; Aparicio, S. PρT measurements and derived properties of liquid 1-alkanols. J. Chem. Thermodyn. 2012, 47, 241–259. [Google Scholar] [CrossRef]
  19. Sommer, D.; Kleinrahm, R.; Span, R.; Wagner, W. Measurement and correlation of the (p, ρ, T) relation of liquid cyclohexane, toluene, and ethanol in the temperature range from 233.15 K to 473.15 K at pressures up to 30 MPa for use as density reference liquids. J. Chem. Thermodyn. 2011, 43, 117–132. [Google Scholar] [CrossRef]
  20. Olivieri, G.V.; Torres, R.B. Thermodynamic and spectroscopic study of binary mixtures containing {dimethyl carbonate (DMC) + alcohols} at T = (288.15–308.15) K and p = (0.1–40) MPa: Experimental study and modelling. J. Chem. Thermodyn. 2019, 133, 229–260. [Google Scholar] [CrossRef]
  21. Wappmann, S.; Karger, N.; Lüdemann, H.D. pVT Data of Liquid 1-, 2-, and 3-Pentanol from 10 to 200 MPa and from 233 to 433 K. J. Chem. Eng. Data 1995, 40, 233–236. [Google Scholar] [CrossRef]
  22. Zúñiga-Moreno, A.; Galicia-Luna, L.A. Compressed Liquid Densities of 1-Pentanol and 2-Pentanol from 313 to 363 K at Pressures to 25 MPa. Int. J. Thermophys. 2007, 28, 146–162. [Google Scholar] [CrossRef]
  23. Bennett, R.G.; Hall, G.H.; Calderwood, J.H. The pressure dependence of the static permittivity of pentanol isomers. J. Phys. D Appl. Phys. 1973, 6, 781–789. [Google Scholar] [CrossRef]
  24. Tait, P.G. Report on Some of the Physical Properties of Fresh Water and of Sea Water; Thomson, C.W., Murray, J., Eds.; Johnson Reprint Corporation: New York, NY, USA, 1888; Volume 2. [Google Scholar]
  25. Aminabhavi, T.M.; Aralaguppi, M.I.; Harogoppad, S.B.; Balundgi, R.H. Densities, Viscosities, Refractive Indices, and Speeds of Sound for Methyl Acetoacetate + Aliphatic Alcohols (C1–C8). J. Chem. Eng. Data 1993, 38, 31–39. [Google Scholar] [CrossRef]
  26. Riddick, J.A.; Bunger, W.B.; Sakano, T.K.; Weissberger, A. Organic Solvents: Physical Properties and Methods of Purification, 4th ed.; Wiley: New York, NY, USA, 1986. [Google Scholar]
  27. Canosa, J.; Rodríguez, A.; Orge, B.; Iglesias, M.; Tojo, J. Densities, Refractive Indices, and Derived Excess Properties of the System Methyl Acetate + Methanol + 2-Butanol at 298.15 K. J. Chem. Eng. Data 1997, 42, 1121–1125. [Google Scholar] [CrossRef]
  28. Fuangfoo, S.; Viswanath, D.S. Densities and viscosities of 2-methoxy-2-methylpropane + 2-methyl-2-propanol at 303.15 and 313.15 K. J. Chem. Eng. Data 1993, 38, 404–406. [Google Scholar] [CrossRef]
  29. Wilhoit, R.; Zwolinski, B. Physical and Thermodynamic Properties of Aliphatic Alcohols. J. Phys. Chem. Ref. Data 1973, 2 (Suppl. 1). Available online: https://apps.dtic.mil/sti/citations/ADD095038 (accessed on 10 October 2021).
  30. Ortega, J.; Matos, J.S. Estimation of the isobaric expansivities from several equations of molar refraction for some pure organic compounds. Mater. Chem. Phys. 1986, 15, 415–425. [Google Scholar] [CrossRef]
  31. Lagourette, B.; Boned, C.; Saint-Guirons, H.; Xans, P.; Zhou, H. Densimeter calibration method versus temperature and pressure. Meas. Sci. Technol. 1992, 3, 699–703. [Google Scholar] [CrossRef]
  32. Kell, G.S.; Whalley, E. Reanalysis of the density of liquid water in the range 0–150 °C and 0–1 kbar. J. Chem. Phys. 1975, 62, 3496–3503. [Google Scholar] [CrossRef]
  33. Lagarias, J.C.; Reeds, J.A.; Wright, M.H.; Wright, P.E. Convergence Properties of the Nelder--Mead Simplex Method in Low Dimensions. SIAM J. Optim. 1998, 9, 112–147. [Google Scholar] [CrossRef] [Green Version]
  34. Ihmels, E.C.; Gmehling, J. Liquid Densities and Excess Volumes of Diisopropyl Ether (DIPE) + 1-Butanol Mixtures from 273 to 473 K and Pressures up to 35 MPa. J. Chem. Eng. Data 2002, 47, 1314–1319. [Google Scholar] [CrossRef]
  35. Taravillo, M.; Pérez, F.J.; Núñez, J.; Cáceres, M.; Baonza, V.G. Thermodynamic Properties of Compressed Liquid Methanol in the Vicinity of the Freezing Line. J. Chem. Eng. Data 2007, 52, 481–486. [Google Scholar] [CrossRef]
  36. Navia, P.; Troncoso, J.; Romaní, L. Isobaric thermal expansivity behaviour against temperature and pressure of associating fluids. J. Chem. Thermodyn. 2010, 42, 23–27. [Google Scholar] [CrossRef]
  37. Navia, P.; Troncoso, J.; Romaní, L. New calibration methodology for calorimetric determination of isobaric thermal expansivity of liquids as a function of temperature and pressure. J. Chem. Thermodyn. 2008, 40, 1607–1611. [Google Scholar] [CrossRef]
  38. Peña, M.D.; Tardajos, G. Isothermal compressibilities of n-1-alcohols from methanol to 1-dodecanol at 298.15, 308.15, 318.15, and 333.15 K. J. Chem. Thermodyn. 1979, 11, 441–445. [Google Scholar] [CrossRef]
  39. Alavianmehr, M.M.; Hemmati, N.; Ghodrati, H. Excess molar volumes, excess thermal expansion coefficients and isentropic compressibility deviations for binary mixtures of benzyl alcohol + (1-butanol, 2-butanol, 2-methyl-1-butanol and tert -butanol) at T = (298.15 − 328.15) K and ambient pressure. Phys. Chem. Liq. 2017, 55, 85–99. [Google Scholar] [CrossRef]
  40. Sahli, B.P.; Gager, H.; Richard, A.J. Ultracentrifugal studies of the isothermal compressibilities of organic alcohols and alkanes. Correlation with surface tension. J. Chem. Thermodyn. 1976, 8, 179–188. [Google Scholar] [CrossRef]
  41. Egorov, G.I.; Makarov, D.M. Compressibility coefficients of water-2-propanol mixtures over the temperature and pressure ranges 278–323.15 K and 1–1000 bar. Russ. J. Phys. Chem. A 2008, 82, 1037–1041. [Google Scholar] [CrossRef]
  42. Egorov, G.I.; Makarov, D.M.; Kolker, A.M. Liquid phase PVTx properties of (water+tert-butanol) binary mixtures at temperatures from 278.15 to 323.15 K and pressures from 0.1 to 100 MPa. J. Chem. Thermodyn. 2013, 61, 161–168. [Google Scholar] [CrossRef]
Figure 1. Installation for measuring p-rho-T. 1: densimeter; 2. frequency-meter; 3. thermometer; 4. thermostatic bath; 5. computers; 6. pressure gauge; 7. high-pressure generator; 8. vacuum pump; 9. syringe; 10–12. valves; 13. T-junction; 14. reservoir.
Liquids 02 00001 g001
Figure 2. Percentage deviation between our measurements and those from the available literature. () [4], (◯) [5], () [12], () [13], () [14], () [15], (♦) [16], () [17], () [18], () [19], () [20], (✕) [6], () [7], () [8], (✕) [9], () [10], (✕) [11], (✕) [21], (✕) [22], (✕) [23].
Liquids 02 00001 g002
Figure 3. Deviations, Equation (8), between the measured data and those by the model, Equations (6) and (7).
Liquids 02 00001 g003
Figure 4. Experimental p-v-T data for (λ) methanol, () ethanol, () propan-1-ol, () propan-2-ol, () butan-1-ol, () butan-2-ol, () 2-methylpropan-1-ol, () 2-methylpropan-2-ol, () pentan-1-ol, () pentan-2-ol, () pentan-3-ol, () 2-methylbutan-1-ol, () 2-methylbutan-2-ol, () 3-methylbutan-2-ol. Lines and surfaces correspond to values calculated with model of Equation (6). (a) Linear primary alcohols; (b) branched primary alcohols; (c) secondary alcohols; (d) secondary pentanol-isomers detail; (e) tertiary alcohols; (f) primary alcohols v-T at constant p; (g) primary alcohols p-v at constant T.
Liquids 02 00001 g004
Table 1. References having high-pressure density data of the selected alcohols for this work. For the alcohols showing a large number of references, only the three most recent are indicated.
AlcoholNo. of
References
ΔT/K/p/MPaSelected References
methanol45283–423/40[4,5,13]
ethanol43233–473/40[5,12,13]
propan-1-ol27288–313/40[5,13,14]
propan-2-ol21293–403/140[15,16,17]
butan-1-ol28293–363/100[5,18,19]
butan-2-ol8283–393/140[6,7,20]
2-methylpropan-1-ol7283–363/66[8,9,10]
2-methylpropan-2-ol3303–363/66[6,9,10]
pentan-1-ol14293–323/35[5,11,18]
pentan-2-ol3233–433/100[21,22,23]
pentan-3-ol2233–433/100[21,23]
2-methylbutan-1-ol1293–323/400[23]
2-methylbutan-2-ol1293–323/400[23]
3-methylbutan-2-ol0--
Table 2. Calibration constants of the Anton Paar DMA-512.
a0a1b0b1b2
5.7258 × 10⁴−2.2876 × 101−6.7907 × 1032.8953 × 10−1−2.1857 × 10⁻⁴
Table 3. Description of the literature dataset on the volumetric coefficients (α and β).
Ref.Type of RefAlcohols *p or T AveragedT-Range Kp-Range MPa
[26]α●,■,🞜,✚,🞫,▽,▲,▼,✱T273–3130.1
[35]αNone278–3000.6–45
[36]α●,■,🞜,▽,▲,▼None278–3285–45
[37]α🞜None278–3285–45
[38]β●,■,🞜,▽None298–3330.1
[39]α🞜,✚,△,🞱None298–3280.1
[40]β●,■,◯,☐,✚,🞫,▽,▲,▼,🞱,✱,🞽None293,2980.1
[41]βp278–3230.1–[10–100]
[42]βp3230.1–[10–100]
* (●) methanol; (■) ethanol; (◯) propan-1-ol; (☐) propan-2-ol; (🞜) butan-1-ol: (✚) butan-2-ol (🞫) 2-methylpropan-1-ol; (△) 2-methylpropan-2-ol; (▽) pentan-1-ol; (▲) pentan-2-ol; (▼) pentan-3-ol; (🞱) 2-methylbutan-1-ol; (✱) 2-methylbutan-2-ol; (🞽) 3-methylbutan-2-ol.
Table 4. Fitted values of parameters of Equations (6) and (7) using Equation (8). Outcomes from Equation (6) are in m3·mol−1. Inputs to that equation are expected in T/K and p/kPa.
105 × v01010 × v11011 × v2106 × A0108 × A11011 × A210−4 × B010−2 × B1100 × B2109 × sv
methanol32.86637.28876.018−16.61110.286−19.77743.734−22.16432.9388.75
ethanol48.78313.63610.671−40.28625.316−44.82571.715−39.96661.14614.8
propan-1-ol62.4705.4.82512.419−23.61811.888−21.05790.632−46.43964.44827.4
propan-2-ol63.63391.50214.736−18.87013.270−29.53246.334−25.66640.83741.4
butan-1-ol78.391−78.20915.459−23.16510.210−17.77887.189−43.00357.70725.1
butan-2-ol76.892−10.92017.811−52.04831.730−54.940104.11−58.65487.16141.0
2-methylpropa-1-ol79.101−17.51616.101−48.42927.575−45.90094.187−50.77272.75925.7
2-methylpropan-2-ol75.148−27.97323.04034.296−16.367−49.35844.287−22.23730.62137.2
pentan-1ol94.496−39.69217.359−53.12528.621−45.91486.932−43.90259.74013.7
pentan-2-ol92.731−47.50820.494−64.77323.970−9.41152.288−25.57235.11242.3
pentan-3-ol90.103−25.97221.10253.000−33.85745.474−48.32397.447−18.89449.1
2-methylbutan-1-ol91.90329.32017.217−122.5965.366−94.969240.78−130.1618.11143.8
2-methylbutan-2-ol91.025−55.38122.791−193.32128.08−223.73156.09−95.59515.57554.5
3-methylbutan-2-ol91.082−47.75520.931−171.27117.06−215.51148.87−90.31615.23459.0
Table 5. Comparison between literature values of the volumetric expansion coefficient and isothermal compressibility to those computed with Equations (9)–(11).
αβ
Compound/Ref.[35][36][37][39][26][38][40][41] *[42] *
methanol0.81 0.660.920.82
ethanol 2.43 0.460.820.45
propan-1-ol 13.71 9.052.345.65
propan-2-ol 1.733.98 2.0664.04
butan-1-ol 4.724.472.744.69
butan-2-ol 23.52 1.74
2-methylpropa-1-ol 4.085.46
2-methylpropan-2-ol 10.62
pentan-1ol 10.89 1.841.171.88
pentan-2-ol 17.12 9.14 1.19
pentan-3-ol 18.02 4.7527.99 0.53
2-methylbutan-1-ol 10.25
2-methylbutan-2-ol 11.69 7.17
3-methylbutan-2-ol 11.68
* Errors provided for a comparison made, in the same interval as the one used in this work. If the comparison is made using the whole reference interval, the MARD for both references would be 77.20 and 24.48, respectively.
Table 6. Averaged values, Equation (11), of α/K−1 and β/kPa−1 within the range T ∈ [278–353] K and p ∈ [0.1–40] MPa along with MARDs related to molar volume estimations made with Equation (6) (rigorous) and Equation (12) (simplified) equations of state.
10 4   α ^ p T   K 1 10 7   β ^ p T   kPa 1 MARD Tait
Equation (6)
MARD
Equation (10)
ΔMARD *
methanol10.689.9260.010.1912.38
ethanol9.8289.1220.020.2010.93
propan-1-ol9.2668.0880.030.195.71
propan-2-ol9.7949.0590.040.235.04
butan-1-ol8.7717.6310.020.187.31
butan-2-ol9.8127.9420.030.236.16
2-methylpropa-1-ol8.8588.1080.020.209.05
2-methylpropan-2-ol12.2211.480.030.185.75
pentan-1ol8.2497.2160.010.1615.03
pentan-2-ol9.2287.6750.030.216.51
pentan-3-ol9.7257.3930.030.235.96
2-methylbutan-1-ol8.7407.2160.030.258.10
2-methylbutan-2-ol10.788.3430.030.216.00
3-methylbutan-2-ol10.007.5730.030.246.09
* ΔMARD = (MARD{Equation (12)} − MARD{Equation (6)})/MARD{Equation (6)}·100.
Publisher’s Note: MDPI stays neutral with regard to jurisdictional claims in published maps and institutional affiliations.

