


Abstract
In this study, previously selected lactic acid bacteria (LAB)—Leuconostoc mesenteroides, Lacticaseibacillus paracasei, and Loigolactobacillus coryniformis—as well as kefir ferment were evaluated as adjunct cultures in pasteurized goat’s milk cheese. Microbiological and physicochemical attributes of cheese treatments were characterized during the 60-day maturation period, whereas texture profile, proximate composition, and sensory analysis were carried out in the final product. Mesophiles and LAB remained high (>8 log10 CFU/g) throughout maturation, whereas the control exhibited significantly lower counts (~7 log10 CFU/g; p < 0.001). For Staphylococcus aureus, the most pronounced reductions occurred in kefir > L. mesenteroides > LAB cocktail, with final counts of 3.67 ± 0.241, 4.26 ± 0.241, and 4.36 ± 0.241 log10 CFU/g, respectively. Cheeses containing adjunct cultures exhibited higher titratable acidity (up to 0.1971 ± 0.0180 g lactic acid/kg cheese) and lower pH (5.41 ± 0.0526), indicating a quicker acidification process during ripening. Kefir > L. mesenteroides > LAB cocktail cheeses achieved the highest overall acceptance scores (9.15 ± 0.285, 8.44 ± 0.285, and 8.39 ± 0.285, respectively), being characterized by perceivably less holes, softer, less crumbly, and non-rubbery texture. Incorporation of kefir and selected LAB strains can be considered as effective functional adjunct cultures for artisanal goat cheese production.
1. Introduction
Goat’s milk is one of the most promising dairy raw materials, driven by growing consumer demand for products with distinctive sensory characteristics and nutritional benefits [1]. It plays a particularly important role in the production of traditional cheese by small-scale dairies in the Mediterranean and southeastern European regions, where goat farming remains closely tied to local breeds and artisanal practices [2]. Traditional cheeses are produced using specific artisanal know-how and often involve minimal or no prior milk processing; however, they may also be made from thermized or pasteurized milk inoculated with selected starter cultures, which promote the development of a characteristic maturation microbiota [3]. Nevertheless, although pasteurization improves the microbiological safety of milk, the quality of goat’s milk remains critical, as its nutrient-rich composition may support the growth of both spoilage microorganisms, which compromise product quality and shelf life, and pathogenic microorganisms, which pose risks to the safety of pasteurized goat’s milk cheese [4]. Although starter cultures are widely used to control fermentation and enhance acidification, their antimicrobial efficacy is strain-dependent and often insufficient to ensure consistent suppression of pathogenic bacteria under the complex ecological conditions of raw milk cheeses. In these systems, variations in pH dynamics, water activity, and microbial interactions can reduce the predictability of starter-mediated antagonism. This variability highlights a key knowledge gap regarding the need for more robust or multifunctional starter systems capable of providing reliable pathogen control during cheese ripening. Pathogenic microorganisms may enter raw milk either through direct excretion from infected animals—most notably via systemic infections or mastitis—or through indirect contamination during or after milking, originating from fecal residues, the surfaces of the udder and teats, animal skin, milking equipment, or the surrounding environment [5]. These contamination pathways allow pathogens such as Escherichia coli, Listeria monocytogenes, Salmonella spp., and Staphylococcus aureus to be transmitted not only via raw milk but also through derived dairy products [6], particularly in small-scale goat production systems, where limited technological capacity and inadequate hygiene practices may predispose herds to disease and economic losses while simultaneously increasing food safety risks for consumers [7]. Although pasteurization is an effective hurdle technology that reduces microbial load, limits spoilage microorganisms, and prevents foodborne diseases, microbiological risks may still persist if (i) the initial microbial quality of raw milk is poor, (ii) heat treatments are not rigorously applied, (iii) thermostable hazards such as pre-formed S. aureus enterotoxins are present, or (iv) post-pasteurization contamination occurs during handling [8]. Indeed, studies have shown that almost 50% of pasteurized fluid milk exhibits evidence of post-pasteurization contamination by organisms capable of growing at refrigeration temperatures (around 6 °C) [9].
Cheese may become contaminated either from the milk itself or at any stage of production, maturation, or storage through inadequate hygiene, cross-contamination, contaminated equipment, or improper handling by food workers [10]. Ensuring high microbiological quality of raw milk, along with good hygienic and manufacturing practices, is therefore essential for producing safe, high-quality cheese [11]. In this context, the use of selected lactic acid bacteria (LAB) strains as adjunct cultures has gained more attention, since LAB not only improve the nutritional, technological, and sensory attributes of dairy products but also enhance microbiological safety [12]. Their primary role in fermentation lies in acid production, which drives the development of characteristic flavor, aroma, and texture while inhibiting spoilage and pathogenic microorganisms [13]. Their bioprotective effects are associated with nutrient competition, adhesion site exclusion, and the production of antimicrobial compounds—including bacteriocins, organic acids (mainly lactic acid), hydrogen peroxide, diacetyl, and other metabolites—that create unfavorable conditions to undesirable bacteria [14]. Organic acid production and the consequent pH reduction represent the main drivers of biopreservation in fermented foods [13]. The principle of competitive exclusion, whereby beneficial strains dominate ecological niches and outcompete spoilage and pathogenic microorganisms, further contributes to controlling unwanted microbiota in cheese [15]. In the strains selected for this study, the most relevant bioprotective mechanisms are acidification through organic acid production and the consequent pH reduction, which limit the growth of undesirable microorganisms [16]. In the present study, pH changes were monitored during ripening and confirmed a progressive acidification trend across treatments. However, no specific antimicrobial metabolites, including bacteriocins or other inhibitory compounds, were directly characterized in the strains used. LAB-derived metabolites also interact with the cheese matrix through physicochemical mechanisms that influence protein structure and fat distribution. Organic acids reduce pH and modify casein interactions, while peptides, free amino acids, and exopolysaccharides can affect water-holding capacity, texture, and the release of fat-associated aroma compounds during ripening [17,18].
Beyond the use of LAB cultures, kefir grains represent a promising alternative natural fermentation source composed of a complex microbial consortium of LAB, acetic acid bacteria, and yeasts [19]. Kefir has attracted considerable interest from both the food industry and consumers, and was even listed by the Institute of Food Technologists (IFT) among the “Nine Food Trends to Watch for in 2021” [20]. Consumption of kefir can be limited by its traditional liquid form and distinct flavor; therefore the development of alternative formats, including concentrated products and solid dairy matrices such as cheese, may improve consumer acceptability and broaden its consumption potential [21]. However, studies specifically addressing this approach remain limited [21]. In kefir, LAB are primarily responsible for converting lactose into lactic acid, thereby lowering pH and contributing to milk preservation by inhibiting the growth of spoilage and pathogenic microorganisms, whereas lactose-fermenting yeasts produce ethanol and CO2, which influence texture, aroma, and flavor development of the product [22]. The LAB strains used in this study were selected based on previously reported functional and technological properties [23]. However, no in vivo validation was performed in the present work, and any probiotic-related effects are therefore inferred from existing literature rather than experimentally demonstrated. This study was based on the hypothesis that kefir, due to its complex and diverse microbial consortium, may exhibit enhanced microbiological safety performance compared to single-strain or defined LAB cultures, particularly through stronger inhibition of pathogenic and spoilage microorganisms in goat’s milk cheese.
The objectives of the present study were therefore: (i) to evaluate the applicability of previously characterized LAB strains, namely Leuconostoc mesenteroides, Lacticaseibacillus paracasei, and Loigolactobacillus coryniformis, and kefir ferment in pasteurized goat’s milk cheese; (ii) to assess and the evolution of spoilage microorganisms and selected pathogens throughout cheese maturation, as affected by LAB strains and kefir ferment; (iii) to evaluate technological performance, including physicochemical characteristics and sensory quality; and (iv) to assess functional properties based on measurable biochemical and compositional attributes of resulting cheeses, including proteolysis index, acidification, and nutritional composition, in comparison with cheeses from raw and pasteurized goat’s milk produced at pilot scale.
2. Materials and Methods
2.1. Bacteria Strains and Cultures Preparation
The LAB strains used in this study—Leuconostoc mesenteroides, Lacticaseibacillus paracasei, and Loigolactobacillus coryniformis—were previously isolated from artisanal raw goat’s milk cheeses produced in Portugal and evaluated in vitro at both 10 °C and 37 °C for their antimicrobial activity, acidifying ability, and proteolysis index, showing clear antagonism against Listeria monocytogenes, Salmonella Typhimurium, and Staphylococcus aureus [23]. Molecular identification of the LAB strains was performed by Sanger sequencing of the 16S rRNA gene. The obtained sequences were compared against reference sequences from the NCBI rRNA/ITS database using the BLAST tool (BLAST+ version 2.16.0+). Based on sequence similarity, the strains were estimated to belong to the species Leuconostoc mesenteroides (NR_157602.1; 96.1% identity), Lacticaseibacillus paracasei (NR_113337.1; 96.5% identity), and Loigolactobacillus coryniformis (NR_180283.1; 97.0% identity). The cryopreserved strains were thawed, and a loop of each culture strain was separately cultivated in MRS broth at 30 °C for 24 h. Two successive inoculations were then performed by placing 100 μL of the subcultures in 10 mL of MRS broth at 30 °C for 24 h. The following inoculation was carried out by placing 500 μL of the subculture in 200 mL of MRS broth at 30 °C for 18 h, to achieve a concentration of each strain of approximately 7 log CFU/mL, adjusted by measuring absorbance at 600 nm using a spectrophotometer (Peak Instruments Inc., Version 1701, Shanghai, China). The inoculum level was selected based on the study objectives and previously reported methodologies in dairy matrices, as well as on commonly used technological inoculation levels applied in fermented dairy product development. In fermented foods, microbial populations at or above 106–107 CFU/g are generally considered necessary to ensure functional activity and, in the case of probiotic strains, to deliver potential health benefits at the time of consumption. In this context, the selected inoculum level supports rapid establishment and a competitive advantage of the protective cultures, thereby promoting effective suppression of undesirable or pathogenic microorganisms during processing, ripening, and storage [24]. Cultures were centrifuged at 10,640× g for 5 min at 4 °C in an MPW-352R centrifuge (MPW Med. Instruments, Warsaw, Poland) to obtain bacterial pellets. For the Leuconostoc mesenteroides single-strain treatment, the pellet was resuspended in 100 mL of sterile saline solution (0.9% w/v NaCl). For the LAB cocktail, a ratio (0.33:0.33:0.33) of three bacterial pellets (L. mesenteroides, Lb. paracasei, and L. coryniformis) were combined and resuspended in 100 mL of sterile saline solution (0.9% w/v NaCl), as commonly applied in studies using mixed-culture LAB systems [25]. Equal representation of each strain was corroborating by viable counts after mixing. The fresh kefir grains used in this study were obtained from Burumart Commerce (Kefiralia, Gipuzkoa, Spain), and previous work from our research group using the same commercial kefir grains reported the presence of lactic acid bacteria, and yeasts [26]. These kefir grains are composed of Lactobacillus kefiranofaciens, Lactobacillus acidophilus, Lactococcus lactis, Laticaseibacillus paracasei, Lactiplantibacillus plantarum, Kluyveromyces marxianus, Saccharomyces cerevisiae, Kazachstania unispora, and Dekkera anomala. To produce the kefir ferment used for inoculation, the grains were first activated in pasteurized goat’s milk at a weight ratio of 1%, and the mixture was incubated under anaerobic conditions at 30 °C for 20 h. After fermentation, the kefir grains were separated from the fermented milk by gravity filtration under aseptic conditions. The kefir ferment was then transferred to sterile 50 mL Falcon tubes and centrifuged at 10,640× g for 5 min at 4 °C (MPW-352R centrifuge, MPW Med. Instruments, Warsaw, Poland). The resulting pellet was resuspended in 100 mL of pasteurized goat’s milk. All cultures were used immediately in cheesemaking under the specific treatments (i.e., L. mesenteroides, LAB cocktail and kefir).
2.2. Inoculation of Bacterial Strains and Cheese Production
To investigate the effect of LAB and kefir ferment on microbiological, nutritional, and sensory quality of pasteurized goat’s milk cheese, six experimental cheese treatments were prepared, in two different batches, each batch consisting of 30 L of milk. The 30 L batch size was selected to ensure sufficient curd yield for physicochemical, microbiological, textural, and sensory analyses, while maintaining process conditions representative of pilot-scale cheesemaking. This volume allowed the production of approximately 16 cheese units per batch, which were used for sequential sampling and analytical determinations within each batch, thereby reducing within-batch variability and allowing biological replication at the cheese-unit level. To minimize batch-to-batch variability, all treatments followed standardized cheesemaking procedures (temperature, renneting, pressing, salting, and ripening conditions). Each treatment corresponded to an independent batch, which was considered the experimental unit in the statistical analysis. One treatment was produced from raw milk and five were produced from pasteurized milk, as follows: (i) Pilot raw milk—cheese elaborated from raw milk without any starter culture, produced in a pilot plant and used as a benchmark for being the traditional raw goat’s milk cheese consumed in Portugal. (ii) Pilot pasteurized milk—cheese elaborated from pasteurized milk without any culture, produced in the pilot plant. (iii) Control—cheese elaborated from pasteurized milk without any adjunct culture, produced in the laboratory. (iv) Leuconostoc mesenteroides—cheese elaborated from pasteurized milk inoculated with L. mesenteroides, produced in the laboratory. (v) LAB cocktail—cheese elaborated from pasteurized milk inoculated with a cocktail of L. mesenteroides, L. paracasei, and L. coryniformis, produced in the laboratory. and (vi) Kefir—cheese elaborated from pasteurized milk inoculated with kefir ferment, produced in the laboratory. The first two treatments are referred to as “pilot” because they were fully elaborated and matured at a partner dairy factory located in Portugal, to mimic industrial conditions. On the other hand, the other four treatments were produced in the laboratory, in order to ensure strict controlled conditions of time, temperature, and relative humidity, which could facilitate comparison between the added starter cultures. These differences may have influenced microbial dynamics and physicochemical evolution during ripening.
Raw goat’s milk was vat pasteurized at 65 °C for 30 min, to reduce or eliminate native microflora [27], then cooled to 34 ± 1 °C prior to inoculation. Inoculation with the selected cultures was performed immediately after reaching the target temperature. Therefore, while competitive exclusion from residual microbiota cannot be completely excluded, the dominant microbial populations during cheesemaking were primarily driven by the intentionally added starter and adjunct cultures. The respective adjunct cultures were added to achieve a final concentration of approximately 107 CFU/mL [28]. Prior to inoculation, all adjunct cultures were standardized to approximately 107 CFU/mL using OD600 measurements calibrated against plate count verification. OD600 values were converted to viable counts (log CFU/mL) using a previously established calibration curve based on a logarithmic regression model obtained from serial dilution and plate counting. The selected inoculum level was determined based on the study objectives and previously reported methodologies in dairy matrices [29,30]. Escherichia coli and Staphylococcus aureus were not intentionally inoculated in this study but were monitored as naturally occurring microorganisms present in the cheese samples. These microorganisms were included as indicators of hygiene and microbiological safety throughout cheese maturation. Commercial rennet (5 mL/30 L milk) was added to induce coagulation, and after 45–60 min the curd was cut into cubes, drained, and the whey was removed. Cheesemaking typically involves milk coagulation through enzymatic action, forming a gel that is separated into curds and whey [31]. The compacted curd was placed into cylindrical molds (~500 g each), weighed, and pressed for 5 h to remove excess whey. The cheeses were then dry-salted with 2% (w/w) NaCl, a step that enhances both flavor and microbial stability, primarily through a reduction in aw and the induction of osmotic stress [32]. However, at this concentration, NaCl alone is not sufficient to inhibit E. coli, and its antimicrobial effect should be considered as part of a multi-hurdle system in combination with acidification and LAB-driven competitive exclusion during ripening. Finally, the cheeses were ripened at 12 °C and 98% relative humidity in a climate-controlled chamber for 60 days, allowing fermentation and biochemical maturation to occur [33]. The cheesemaking procedure was identical across all treatments and was controlled to allow comparison of the specific effects of LAB and kefir ferment on the microbiological, physicochemical, nutritional, and sensory properties of the cheese.
2.3. Microbiological Analysis Throughout Cheese Maturation
Microbiological analyses were conducted at five time points selected to represent key stages of cheese microbial/ecological evolution: Day 1 (formed curd, early fermentation and acidification), Day 15 (rapid LAB-driven metabolism and early ripening), Day 30 (mid-maturation with active biochemical changes), Day 45 (transition to a more stable and competitive microbial ecosystem), and Day 60 (end of maturation and ecological product stabilization). The analyses included enumeration of mesophilic bacteria, LAB grown on MRS and M17 agar, Escherichia coli, and presumptive Staphylococcus aureus. For each sampling point, 10 g of cheese was aseptically diluted in 90 mL sterile buffered peptone water (BPW) (Liofilchem, Roseto degli Abruzzi, Italy) and homogenized for 90 s in a stomacher (Interscience Bag Mixer 400, Saint Nom la Bretêche, France). Appropriate decimal dilutions were prepared in BPW for microbial enumeration. Total mesophilic bacteria was determined by pour-plating 1 mL aliquots onto Plate Count Agar (Liofilchem, Roseto degli Abruzzi, Italy) and incubated at 37 °C for 48 h [34]. Presumptive LAB were enumerated by pour-plating 1 mL aliquots onto MRS and M17 agar (Liofilchem, Roseto degli Abruzzi, Italy), overlaid with 10 mL of 1.2% agar (Liofilchem, Roseto degli Abruzzi, Italy) and incubated at 30 °C for 48 h. Counts obtained on MRS and M17 were interpreted independently and were not summed, as the aim was to monitor the dynamics of specific LAB groups rather than to estimate total LAB. S. aureus was enumerated from the cheese samples by spread-plating 0.1 mL aliquots onto Baird–Parker Agar supplemented with Egg Yolk Tellurite Emulsion (Liofilchem, Roseto degli Abruzzi, Italy) and incubated at 37 °C for 48 h. Colonies exhibiting the characteristic morphology on the selective medium were counted, namely black colonies with a clear surrounding halo. The quantification limit for presumptive S. aureus was 1.7 log CFU/g. E. coli was similarly enumerated by spread-plating 1 mL aliquots onto MacConkey Agar (Liofilchem, Roseto degli Abruzzi, Italy) and incubated at 37 °C for 24 h, and the confirmatory tests of indole production and Voges–Proskauer were performed in randomly selected colonies after purification. The quantification limit was 0.7 log CFU/g. All analyses were performed using two independent cheese units randomly selected from each batch, which represented biological samples within the experimental unit (batch). Each sample was analyzed in duplicate plating to account for technical variability. Colonies were counted, and results were expressed as log10 of colony-forming units per gram of cheese (log CFU/g).
2.4. Physicochemical Analysis Throughout Cheese Maturation
The physicochemical determinations during cheese maturation included measurements of pH, water activity (aw), titratable acidity and proteolysis index, carried out on Days 1, 30 and 60. Proximate composition (moisture, protein, fat and ash contents) was determined only in the final cheese product (Day 60), as these parameters are primarily used to characterize the end-product and assess its technological and nutritional quality after maturation. pH was determined using a 10 g cheese subsample homogenized for 30 s in 90 mL of deionized water using a stomacher (Interscience Bag Mixer 400, Saint Nom la Bretêche, France), and the pH of the homogenate was measured in duplicate using a FiveGo pH meter F2 coupled with a LE438 IP67 probe (Mettler-Toledo, Greifensee, Switzerland).
To measure aw, the cheese samples were transferred into the cuvette of an Aqualab 4TE water activity meter (4TE Decagon, San Francisco, CA, USA), and the values were recorded after measurement stabilization; aw measurements were performed in duplicate for each cheese sample.
To assess the impact of acid production by LAB, titratable acidity was determined by titration with sodium hydroxide (NaOH) using alcoholic phenolphthalein as indicator. For each sample, 10 g of cheese was homogenized for 30 s in 100 mL of deionized water using the same stomacher. An aliquot of 10 mL of the homogenate was transferred to a beaker, two drops of phenolphthalein were added, and the sample was titrated with 0.1 N NaOH (Dornic solution, equivalent to 1/9 N NaOH) until a slightly pink color persisted for 30 s, indicating the endpoint. The dilution factor was accounted for in the calculation, as the 10 g cheese sample homogenized in 100 mL resulted in a suspension containing 1 g of cheese per 10 mL, used for titration. The titratable acidity (TA), expressed as grams of lactic acid equivalent per kilogram of cheese, was calculated as
where V is the volume (mL) of NaOH used, N is the NaOH normality (0.1 N), g is the cheese mass (g), and 9.008 is the conversion factor to g lactic acid equivalent/kg cheese [35]. Each sample was titrated in duplicate, and the mean value was recorded.
Proteolysis index was quantified using an in-house protocol previously described for dairy systems, which provides an indirect estimate of proteolysis based on the soluble nitrogen fraction [26,36]. First, the sample pH was adjusted to 4.6 with 1 M HCl to precipitate caseins at their isoelectric point and isolate the soluble nitrogen fraction. A 10 mL aliquot was centrifuged at 3000 rpm for 20 min at 4 °C to obtain the whey fraction, which was subsequently filtered (240 mm filter paper diameter). Proteolysis was assessed as follows: (i) 1 mL of whey was diluted in 100 mL of distilled water and the absorbance was measured at 280 nm using a spectrophotometer (Peak Instruments Inc., Version 1701, Shanghai, China), with distilled water as a blank; (ii) the remaining whey was boiled in a water bath for 10 min to promote precipitation of thermolabile residual proteins, centrifuged again under the same conditions, filtered, and a second 1:100 dilution was prepared, whose absorbance at 280 nm was recorded. Proteolysis index was expressed as the difference between absorbance values obtained before and after boiling, calculated as:
Proteolysis index = Filtrate absorbance before boiling − Filtrate absorbance after boiling
This method provides a comparative index of soluble peptide accumulation during cheese maturation rather than a detailed molecular characterization of peptide profiles.
The proximate composition of the cheese samples (moisture, ash, protein, and fat contents) was determined at the end of maturation (Day 60) according to AOAC methods: AOAC 926.08 for moisture, AOAC 935.42 for ash, AOAC 991.20 for protein, and AOAC 933.05 for fat [37,38,39,40]. Protein content was calculated from the total nitrogen using a conversion factor of 6.38 (Kjeldahl N × 6.38), which is the conventional factor to obtain protein content in milk and dairy products [39]. All analyses were performed in triplicate for each cheese sample. Protein, ash, and fat contents were expressed as a dry basis (db).
2.5. Texture Analysis
After 60 days of maturation, texture analysis was performed on the cheese samples using Texturometer equipment (TA. XT Plus) to evaluate the hardness (g) and brittleness (mm). Hardness can be defined as the peak force achieved during the first compression cycle, representing the resistance of the sample to deformation under compressive load [41], whereas brittleness refers to the point at which the sample fractures under compression, often measured as the distance (mm) at which the first break occurs during compression [42]. The distance at break provides a direct measure of structural failure under compression, reflecting the integrity of the protein–fat network within the cheese matrix. Unlike force-based parameters alone, it captures the onset of structural collapses, making it particularly suitable for evaluating changes in matrix cohesion and fragility during ripening. Six cylindrical samples (35–40 mm in diameter and 15–20 mm in height) were obtained using a cookie cutter and were taken from each treatment. The samples were left at room temperature for 10 min prior to testing. The instrument was calibrated to a maximum load of 5000 g and measurements were performed in duplicate using a flat cylinder probe (P/20, 20 mm diameter). Data collection was accomplished using Texture Exponent TPA32 software (version 6.2). Texture analysis provided insights into the structural integrity, firmness, and texture uniformity of the cheese, which are key attributes influencing overall product quality and consumer acceptance [43].
2.6. Sensory Evaluation
To characterize the sensorial profile of the cheeses after 60 days maturation, a sensory evaluation was conducted using an internal panel of 30 participants (researchers from IPB and CIMO) aged 20–45 years, consisting of semi-trained assessors with prior experience in dairy product evaluation. Participation was voluntary, and informed consent was obtained from all assessors before the evaluation. Samples were identified using random three-digit codes and presented in a randomized order. Assessors were blinded to the treatment identity during the evaluation. Water and unsalted crackers were provided between samples for palate cleansing. Approximately 20 g of each of the six cheese samples were portioned onto plastic plates at room temperature (~20 °C) 30 min before the assessment. The sensory attributes assessed were: (i) Compactness, defined as the intensity of the visual attribute of a uniform matrix; (ii) Presence of holes, defined as the intensity of the attribute of the cheese matrix with visible holes; (iii) Aroma, defined as aroma intensity of the sample; (iv) Taste, defined as taste intensity of the sample; (v) Aftertaste, defined as taste intensity remaining in the mouth after eating; (vi) Crumbliness, defined as the intensity of breakableness texture of the sample; (vii) Pastiness, defined as the intensity of a pasty and smooth mouthfeel when eating the sample; (viii) Hardness, defined as the intensity of hardness, as opposed to tenderness, of the sample; (ix) Stickiness, defined as the intensity of adhesiveness or gluiness of the sample to the teeth; (x) Cork-like texture, defined as the intensity of rubbery mouthfeel during mastication, reflecting increased firmness and reduced matrix elasticity in the cheese; and (xi) Overall acceptance, defined as the final measure that encapsulates the general satisfaction towards the cheese sample. Each panelist received an individual score sheet containing separate rows for each sample and attributes, marking their perception on 10 cm unstructured line scales. In the scales provided for all descriptors, the left end (0) corresponded to “low intensity or sensation”, and the right end (10) to “high intensity or sensation”. After evaluation, the distance (cm) from the left edge of the scale to each mark was measured and the values were compiled into a data matrix for subsequent statistical analysis.
2.7. Statistical Analysis
To obtain the most information from the data, four types of statistical analysis were carried out in R (version 4.4.2) [44].
- Repeated-measures analysis of variance (ANOVA) of attributes measured during cheese maturation and in the final products. For each microbiological and physicochemical attribute, a repeated-measures ANOVA was carried out to assess the effect of cheese treatment and maturation time at α = 0.05; when significant, mean comparisons by Tukey’s post hoc test were performed to contrast between treatments, and between days within cheese treatment. For each proximate component and texture analysis descriptors, ANOVA was carried out to assess the effect of cheese treatment and mean comparisons performed by Tukey’s HSD test. In both cases, estimated marginal means were computed. The diagnostic visualizations of the Q-Q plot and residuals versus fitted values did not raise any concerning issue on non-normality or heterocedasticity. In addition, we produced charts plotting the means and standard errors estimated directly from the observations to show the evolution of each attribute during maturation. R packages used were nlme, emmeans, multcomp, and ggplot2.The linear model representing the nested repeated measures structure is:where is the microbiological or physicochemical response variable; is the overall population mean; is the fixed main effect of cheese treatment; is the fixed mean effect of maturation day; is the fixed interaction effect of cheese treatment and maturation day, which represents the “treatment within day” shifting profiles; is the random baseline intercept for cheese k, where ; is the random nested intercept of cheese × day interactions, where , which accounts for the fact that the cheese baseline can fluctuate from one day to the next; and is the residual error term representing the specific treatment observation for a cheese unit on a given maturation day. The covariance assumption used was the compound symmetry for cheese treatment within maturation day.
- Principal component analysis (PCA) of attributes measured in the final products. A rotated bi-dimensional PCA was adjusted on the set of quantitative variables characterizing the final product; namely, moisture, protein db, fat db, ash db, hardness, brittleness, pH, aw, acidity and proteolysis, with the centroids of the cheese treatments projected on the two-component space. Variables were centered and scaled before PCA, and varimax rotation was used. This analysis was carried out to visualize the association of cheese treatments with certain quality attributes; it was implemented using the R packages factoextra and FactoMineR.
- PCA of attributes measured during cheese maturation. Two rotated bi-dimensional PCAs were adjusted on the set of quantitative variables characterizing cheese maturation (i.e., mesophiles counts, S. aureus counts, LAB counts on MRS, LAB counts on M17, E. coli counts, pH, aw, proteolysis, and acidity). In the first PCA, maturation time was added as a quantitative variable, and cheese treatment was considered as the qualitative variable for centroid placement. In the second PCA, cheese treatment was removed and maturation time was added as a qualitative variable for centroid placement. In this way, the first PCA allows the visualization of the overall differences between cheese treatments within the microbiological and physicochemical attribute map; whereas the second PCA allows the visualization of the changes in the same attributes as maturation takes place. Variables were centered and scaled before PCA, and varimax rotation was used. R packages factoextra and FactoMineR were used.
- Mixed-effect models of sensory attributes. For each of the 11 sensory attributes, a linear mixed-effect model was fitted with cheese treatment as a fixed effect and a random intercept for panelists as the clustering variable. Estimated marginal means by cheese treatment were computed for all sensory attributes, and mean comparisons between treatments performed by Tukey’s post hoc test (α = 0.05). In addition, a radar chart was built to facilitate visualization of differences in the sensory quality between cheese treatments. The R packages lmer, emmeans, multcomp and fmsb were used.
Figure 1 summarizes the experimental workflow, from LAB preparation and cheese manufacture to maturation, sampling, and all analyses performed.
Figure 1.
Workflow of materials and methods.
3. Results and Discussion
3.1. Evolution of Microbiological and Physicochemical Attributes in Goat’s Milk Cheese During Maturation
3.1.1. Evolution of Microbiological Attributes in Goat’s Milk Cheese During Maturation
The microbiological quality of pasteurized goat’s milk cheese during maturation showed significant differences among treatments (p < 0.001). No significant differences were observed among the inoculated cheeses and the pilot cheeses (raw and pasteurized) in mesophilic bacteria and LAB (grown on MRS and M17), indicating a broadly similar level of microbial development across these treatments, all of which differed significantly from the control, as shown in Table 1 and illustrated in Figure 2 (top left and right). These results suggest that comparable microbial populations were established during cheese maturation, regardless of LAB inoculation.
Table 1.
Repeated-measures analysis of variance and estimated marginal means (±standard error) for the counts of mesophiles and lactic acid bacteria (LAB) by treatment, and by treatment within maturation day of goat’s milk cheeses.
Figure 2.
Evolution of the concentration of total mesophiles (top left), MRS-grown lactic acid bacteria (top right), Escherichia coli (bottom left) and Staphylococcus aureus (bottom right) in the different types of goat’s milk cheese during maturation.
It is noteworthy that the pilot pasteurized milk and control cheeses—overall and along maturation—did not differ significantly in mesophilic counts (Table 1). The results showed that mesophilic bacteria and LAB, which constitute the dominant cheese microflora [45], remained at high levels throughout maturation, generally exceeding 8 log CFU/g (Figure 2; Table 1), in agreement with previous studies [1,46]. This pattern reflects stronger microbial development in inoculated and pilot cheeses (raw and pasteurized), where added adjunct cultures, indigenous microbiota (in raw milk cheeses), and/or surviving non-starter microorganisms may contribute to the dominant flora. On the other hand, control cheeses consistently exhibited lower counts (around 7 log CFU/g), reflecting the absence of adjunct cultures and reduced microbial activity during maturation [47]. This likely resulted in delayed acidification, reduced metabolic activity, and less efficient nutrient utilization compared to the inoculated treatments. Similar trends have been reported in non-inoculated cheeses. This persistence is expected and technologically desirable in fermented cheeses, as a dominant LAB population contributes to controlled acidification, competitive exclusion of undesirable microorganisms, and proper ripening development. Although high LAB levels may theoretically lead to excessive acidification, the pH evolution observed in the present study remained within the typical range for ripened goat cheeses, and no sensory evidence of over-acidification was detected, indicating balanced metabolic activity. Similarly, Kamarinou et al. [28] reported control cheeses (without starters) with low populations at the end of storage (5.9 ± 0.14 log CFU/g). The positive impact of adjunct culture on microbial growth and metabolic activity during maturation are consistent with previous studies on traditional goat’s milk cheeses enriched with LAB, which emphasize the pivotal role of LAB in modulating cheese microbiota [1,46].
Between Day 1 and Day 15, all treatments exhibited a clear increase in mesophilic and LAB populations, indicating active microbial growth and effective adaptation to the cheese matrix, whereas the control exhibited slower microbial proliferation, probably due its more limited natural microbiota and absence of added LAB. The initial phase likely corresponds to the transition from lag to exponential growth, as LAB adapt to the cheese environment and activate metabolic pathways for lactose utilization. Simultaneously, the curd matrix provides favorable conditions that support microbial proliferation, including relatively permissive pH, high moisture content, residual lactose availability, and high water activity. These factors collectively enhance growth rates and metabolic activity, facilitating the rapid expansion of LAB populations during early ripening. Toward the end of maturation (Day 60), a slight decrease of approximately 0.5 log CFU/g was observed in all treatments, consistent with previous reports describing a similar reduction by the 60th day of maturation [28]. Likewise, in production of Provola dei Nebrodi PDO cheese, mesophilic aerobic bacteria, LAB and lactococci showed a progressive decline during maturation, with a reduction of about 1 log unit measured at the 60th day [47]. This reduction in microbial counts can be ascribed to progressive nutrient depletion, salt addition, reduced aw, and the combined effects of low pH and temperature, which together restrict microbial growth and metabolic activity [48,49]. Even so, cheeses produced with L. mesenteroides, the LAB cocktail and kefir, as well as pilot raw and pilot pasteurized milk cheeses, maintained relatively higher viable populations (8.34 to 9.10 log CFU/g), which highlight the persistence and strong adaptability of metabolically active microbial communities under maturation conditions, in line with Taboada et al. [46] and Briggiler-Marcó et al. [50].
From a microbiological perspective, E. coli is commonly used as a hygiene indicator and post-processing contamination, and levels below 102–103 CFU/g are generally considered consistent with good hygienic practice depending on product classification. Regarding hygiene indicator microorganisms, significant differences (p < 0.05) were observed among treatments (Figure 2, bottom left; Table 2). Kefir and LAB cocktail cheeses did not differ significantly from each other, as indicated by their overall counts (5.21 ± 0.40 and 5.37 ± 0.40 log CFU/g, respectively; Table 2). Nonetheless, E. coli populations underwent a slight increase during the first half maturations (from ~5.0 on Day 1 to 5.21 ± 0.479 in kefir; 5.38 ± 0.479 log CFU/g in LAB cocktail on Day 30), reflecting active growth under initially favorable conditions, including high nutrient availability, moisture/water activity, residual lactose, and protein buffering capacity of the fresh cheese matrix. This initial proliferation highlights a critical risk window during early maturation, where conditions may temporarily support the survival and growth of enterobacteria before inhibitory factors become dominant. As ripening progresses, the combined effects of pH decline, salt diffusion, reduced aw, nutrient depletion, and competitive interactions with LAB create increasingly restrictive conditions, leading to the observed decline in E. coli populations.
Table 2.
Repeated-measures analysis of variance and estimated marginal means (±standard error) for the counts of Escherichia coli, Staphylococcus aureus, and pH by treatment, and by treatment within maturation day of goat’s milk cheeses.
The initially high level of E. coli in cheese at the beginning of maturation likely resulted from cross-contamination during milking, as E. coli, a natural inhabitant of the intestinal microflora of humans and warm-blooded animals, is widely recognized as a key indicator of fecal contamination and hygiene status in dairy production [4,51]. Over time, counts declined markedly, reaching on Day 60: 3.96 ± 0.479 and 4.12 ± 0.479 log CFU/g in kefir and LAB cocktail cheeses, respectively (Figure 2; Table 2). On the other hand, cheeses inoculated with L. mesenteroides showed comparatively higher counts on Day 60 (6.58 ± 0.479 log CFU/g), not different statistically from the pasteurized milk control group at the same time point (6.22 ± 0.479 log CFU/g). This can be partially explained by the higher initial contamination levels observed in this treatment, which influenced the overall microbial dynamics. Nevertheless, a reduction trend was also evident over time. Furthermore, as indicated by the statistical grouping (lowercase letters) in Table 2, L. mesenteroides differed significantly from kefir and LAB cocktail treatments. These findings indicate that the microbiological dynamics during cheese ripening differed among treatments under the conditions evaluated. Therefore, the results should be interpreted considering both the initial microbial loads and the temporal patterns of change during ripening, rather than endpoint comparisons alone. This reduction can be primarily attributed to acidification and the resulting decrease in pH, which create unfavorable conditions for E. coli survival and growth. The potential contribution of additional antimicrobial metabolites produced during fermentation, including organic acids, bioactive peptides, and bacteriocins, may also have contributed to pathogen inhibition [1,14,52]. It is also noteworthy that the pilot raw milk, LAB cocktail, and kefir cheeses did not differ significantly in E. coli counts (Table 2). For S. aureus the observed reductions to approximately 103–104 CFU/g are relevant in a risk-based context, as enterotoxin production is typically associated with populations exceeding ~105 CFU/g under favorable growth conditions. However, enterotoxin production was not evaluated in this study. Therefore, the reductions observed are microbiologically meaningful in terms of reducing the potential safety risks.
Cadavez et al. [4] reported overall incidence rates of E. coli (11.9%) and S. aureus (26.4%) in raw goat’s milk cheeses, in a meta-analysis of microbiological data, highlighting the hygiene deficiencies commonly associated with this food category. Similarly, cheese manufactured from cow, goat, and sheep milk have shown coliform prevalence rates of approximately 27%, 33%, and 18%, respectively, at levels exceeding 10 CFU/g, with raw milk cheese exhibiting a higher coliform prevalence (42%) compared with pasteurized milk cheese (21%) [53]. Although E. coli is primarily considered an indicator organism, certain serotypes such as O157:H7 are recognized pathogens of major public health concern [4]. Preventing fecal material from contaminating the milk is therefore a critical control point for minimizing E. coli prevalence in raw milk since contamination probably occurs mainly during milking and/or manufacturing [51]. The implementation of effective cleaning and pre-milking disinfection procedures, particularly through removal of fecal residues from udders and teats, can substantially reduce the risk of contamination, although complete elimination is rarely achieved [20].
Concerning S. aureus, significant differences (p < 0.05) were observed among treatments (Figure 2, bottom right; Table 2). It was observed that kefir, L. mesenteroides, and LAB cocktail cheeses, overall, did not differ significantly from each other (Table 2). The lowest concentration was observed in kefir cheeses (4.75 ± 0.20 log CFU/g), followed by those produced by L. mesenteroides (5.33 ± 0.20 log CFU/g) and the LAB cocktail (5.43 ± 0.20 log CFU/g), indicating a comparable decline in S. aureus during maturation among the three treatments. The similar reductions observed among kefir- and LAB-treated cheeses may suggest a convergence toward functionally equivalent inhibitory outcomes, despite differences in microbial composition. This behavior can be explained by shared functional mechanisms among LAB communities, including acidification, production of antimicrobial metabolites (e.g., organic acids, bacteriocins), and competitive interactions for nutrients and ecological niches. The reduction in S. aureus counts observed in the kefir- and LAB-treated cheeses can be attributed to the combined effects of increased acidity, decreased pH, and progressive reduction in aw during maturation (Table 2 and Table 3), which together created an environment highly unfavorable for S. aureus survival and proliferation [54]. The final aw values (kefir: 0.9471 ± 0.00245; LAB cocktail: 0.9430 ± 0.00245) represent a substantial decrease from the initial curd conditions (kefir: 0.9919 ± 0.00253; LAB cocktail: 0.9878 ± 0.00253) contributing to limitation of bacterial growth. Although these values remain above the minimum aw required for S. aureus growth (~0.865), they approach ranges where growth rates are reduced, particularly when combined with acidification and salt diffusion [55]. Furthermore, the presence of kefir microbiota and LAB may have contributed to the microbial dynamics observed during ripening, as microbial persistence in ripened cheeses depends largely on the ability to tolerate reduced aw and acidic conditions [48,54].
Table 3.
Repeated-measures analysis of variance and estimated marginal means (± standard error) of water activity (aw), titratable acidity, and proteolysis index by treatment, and by treatment within maturation day of goat’s milk cheeses.
Insufficient acidification by LAB starter cultures is considered one of the main factors enabling S. aureus growth during cheesemaking, reinforcing the importance of rapid acid development for its control [56]. All three treatments showed an initial increase in S. aureus counts up to Day 30 (kefir: from 3.90 ± 0.25 to 4.66 ± 0.241; L. mesenteroides: from 4.48 ± 0.25 to 5.25± 0.241; and LAB cocktail: from 4.59 ± 0.25 to 5.35 ± 0.241 log CFU/g), likely reflecting an initial adaptation phase and growth supported by nutrient availability, relatively permissive pH, and high water activity in the cheese matrix. This was followed by a pronounced decline by Day 60 (kefir: 3.67 ± 0.24, L. mesenteroides: 4.26 ± 0.24, and LAB cocktail: 4.36 ± 0.24 log CFU/g), consistent with the progressive changes occurring during cheese ripening, including decreasing pH and accumulation of microbial metabolites associated with LAB growth (Table 2; Figure 2, bottom right).
The antibacterial effect of kefir produced from a freeze-dried commercial starter culture was demonstrated in vitro against S. aureus (ATCC 29213), and E. coli (ATCC 8739), and compared with ampicillin and gentamycin [57]. Zones of inhibition were similar between kefir and antibiotics; for instance, for E. coli, the inhibition diameter was 19.5 mm, 18.6 mm, 20.2 mm, and 20.8 mm for 24 h fermented kefir, 48 h fermented kefir, ampicillin, and gentamycin, respectively, indicating that kefir’s antimicrobial activity was comparable to both antibiotics and reinforcing its potential as a natural bioprotective agent in dairy systems, with its efficacy being influenced by fermentation time, microbial composition, and the production of antimicrobial compounds [57]. Similarly, other studies have reported antagonistic activity of lactobacilli isolated from kefir grains against E. coli [58]. Silva et al. [59] also observed the inhibition of S. aureus and E. coli by kefir cultured in brown sugar media. Furthermore, Chifiriuc et al. [60] found that milk fermented with kefir grains consistently exhibited antimicrobial activity against both S. aureus and E. coli, confirming kefir’s strong bioprotective and antimicrobial potential. Collectively, these findings indicate that the antimicrobial activity of kefir is primarily associated with the production of organic acids, bacteriocins, CO2, H2O2, ethanol, and diacetyl [22]. In vitro studies on the antibacterial effect of kefir have demonstrated strong antibacterial activity against S. aureus, E. coli, Salmonella spp., and L. monocytogenes, mainly due to acidification and the production of antimicrobial metabolites, including bacteriocins, hydrogen peroxide, and organic acids [57].
The occurrence of S. aureus in milk and artisanal cheeses is primarily linked to inadequate milking and milk handling practices, which represent major sources of contamination in the raw material itself [56,61]. S. aureus is one of the most important causative agents of food poisoning worldwide, being responsible for numerous staphylococcal foodborne outbreaks, and its public health impact is exacerbated by the widespread occurrence of antibiotic resistant strains, which raises concern about its persistence along the food chain [56,62]. This risk is further amplified by frequent environmental presence of S. aureus, which increases the likelihood of contamination during processing and handling, and by the fact that approximately 20% of human population is permanently colonized and act as asymptomatic carriers; so food handlers may serve as an additional contamination source through direct contact or via respiratory secretions [63,64]. The persistence of S. aureus is of particular concern because of its ability to produce staphylococcal enterotoxins (SEs), thermostable toxins that can remain biologically active even after heat treatments and under low pH, thereby posing a potential hazard to consumers [8,65]. If SEs are not completely inactivated by heat, partial reactivation may occur during cooking, storage or incubation, further increasing the risk of foodborne intoxication [66].
SEs are a major cause of foodborne intoxication and are commonly linked to the consumption of foods contaminated with S. aureus, particularly dairy products processed or handled under inadequate hygienic conditions [67]. Symptoms typically present with rapid onset of nausea, vomiting, abdominal cramps, and diarrhea, and the illness is usually self-limiting, resolving within 24–48 h after onset [67]. The ability of S. aureus strains to form biofilm is well documented, and in the dairy industry these biofilms can disseminate throughout the production chain, colonizing raw materials, milk storage tanks, the processing environment, and equipment surfaces, thereby enhancing the risk of cross-contamination and product spoilage [56]. The hygienic quality of milk at herd level should therefore be of primary concern, particularly when raw milk is used for the manufacture of fresh cheese, since foodborne outbreaks linked to artisanal cheeses pose both a public health risk for sanitary authorities and a threat to the brand identity and economic sustainability of artisanal producers [45,68]. Given the pathogenic hazards previously described, there is a clear need to implement more stringent food safety control systems in the dairy goat industry in order to safeguard both public health and product integrity [45].
The circumstances of production and storage of raw milk dairy products largely determine the behavior of the microorganisms potentially present in the raw milk, whether they grow, survive or become inactivated, and can therefore compromise product safety and quality, underscoring the need for natural and effective microbial control strategies during cheesemaking [5]. The metabolic activity of LAB has been reported to reduce the growth potential of pathogenic microorganisms through several mechanisms, including competition for nutrients, acidification of the food matrix [5], and the production of metabolites such as organic acids, CO2, H2O2, acetaldehyde, ethanol, bioactive peptides, exopolysaccharides and bacteriocins [5,22]. Acidification is widely recognized as one of the primary mechanisms of LAB activity, mainly driven by the production of organic acids, particularly lactic acid, which lowers the pH and creates an environment unfavorable to spoilage and pathogenic microorganisms [4,5]. Lactic acid disrupts the cytoplasmic membrane and interferes with the membrane potential of target cells, further enhancing microbial inhibition [69]. pH strongly influences cheese texture evolution by modifying casein–casein, mineral–casein, and casein–water interactions through changes in casein charge and calcium solubility, thereby affecting firmness, elasticity, and meltability. As acidification progresses, buffering capacity determines the extent and rate of pH change, while reduced water activity promotes syneresis and firmer texture development [70,71]. Marked acidification was observed in the present study, with final pH values of 4.94 ± 0.0628 for kefir, 5.31 ± 0.0628 for the LAB cocktail, and 5.76 ± 0.0628 for L. mesenteroides (Table 2). These results reflect strong acidifying capacity of the tested cultures and their contribution to the physicochemical changes occurring during cheese maturation. Intrinsic factors of the food matrix, particularly pH, are well established as a key determinant of the growth and survival of pathogenic and spoilage microorganisms during storage. This is consistent with regulatory frameworks, including those from the EFSA, which recognize pH as a critical control parameter in the safety of ready-to-eat foods. In general, lower pH values limit the growth potential of enteric pathogens and contribute to their progressive inactivation during storage, particularly when combined with other intrinsic hurdles. In agreement with previous studies, coliform-positive cheeses are typically associated with pH values above 5.0, whereas E. coli and other coliforms show reduced survival in feta-style cheeses with pH below 5.0, highlighting pH as a critical inhibitory factor for their persistence and growth [53,72,73]. For instance, staphylococcal enterotoxins have been detected in uncooked pressed cheeses with pH > 6.5 at early maturation (6 h), further highlighting the importance of rapid acidification in controlling toxin production by S. aureus [74]. The incorporation of kefir and selected LAB strains maintained high LAB population throughout maturation, as evidenced by culture-dependent enumeration data, highlighting their persistence during maturation and their technological role in promoting acidification and maturation of pasteurized goat’s milk cheese [1,46]. Foods containing live probiotic microorganisms in adequate amounts are classified as functional foods, defined as products that confer health benefits beyond their basic nutritional value [75].
3.1.2. Evolution of Physicochemical Attributes in Goat’s Milk Cheese During Maturation
Cheese treatment, maturation time, and their interaction significantly affected all the physicochemical variables, e.g., pH (Table 2), aw, titratable acidity, and proteolysis index (Table 3). Both pH and aw (Figure 3, top left and right) followed similar trends, decreasing gradually throughout maturation in all treatments (p < 0.05).
Figure 3.
Evolution of pH (top left), water activity (top right), titrable acidity (bottom left) and proteolysis index (bottom right) in the different types of goat’s milk cheese during maturation.
Active acidity, measured as pH, provides immediate insight into the H+ concentration in the cheese matrix, whereas titratable acidity reflects the total acid content, including both free H+ and H+ bound to buffering agents [76]. These parameters are critical determinants of the cheese’s final quality, influencing microbial stability, texture development and flavor formation during maturation [76].
Proteolysis and peptidolysis by LAB are essential for the production of free amino acids, which are subsequently converted into aroma compounds during cheese maturation [77]. In addition, proteolysis contributes to the generation of peptides from precursor milk proteins through several mechanisms, including enzymatic hydrolysis by digestive enzymes during fermentation and ripening [78]. Many industrial dairy starter cultures are highly proteolytic, and both starter and non-starter bacteria involved in fermented dairy products can contribute to peptide release. In this context, the proteolytic system of LAB is well characterized and recognized as a key driver of both flavor development and the generation of bioactive peptides during dairy fermentation and ripening [78]. Among inoculated cheeses, the degree of acidification (pH) followed the order kefir > LAB cocktail > L. mesenteroides (p < 0.05; Table 2). A rapid pH decline was noted at mid-maturation, particularly in cheeses inoculated with kefir (5.12 ± 0.063), LAB cocktail (5.48 ± 0.063), and L. mesenteroides (5.93 ± 0.063). Such extents of pH decline were greater or at least comparable with the benchmark cheese (Pilot raw milk cheese: 5.50 ± 0.066). By the end of maturation, pH had further decreased to 4.94 ± 0.0628, 5.31 ± 0.00628, and 5.76 ± 0.0628, 5.32 ± 0.0664, respectively, reflecting the strong fermentative metabolism of the kefir and LAB microflora, whose organic acid production does not only lower the pH but also creates an unfavorable environment for pathogenic and spoilage microorganisms [46].
The pH of the control and pilot pasteurized cheeses remained significantly higher (p < 0.05) throughout maturation, due to the absence of an adjunct culture and consequently lower LAB activity [28]. In contrast, the higher LAB concentration in the inoculated cheeses promoted more intense fermentation, converting milk sugars into lactic acid, which increased acidity while concomitantly decreasing pH [50,79]. Similar observations have been reported for white-brined cheeses, where products manufactured with starter cultures exhibited significantly lower pH values (p < 0.05) than those produced without starter culture; in that study, cheeses with starter culture had an initial pH of approximately 5.66 that decreased to 5.16–5.33, whereas cheeses without starter had an initial pH of 6.72 and only declined to 5.41–6.31 after 28 days, highlighting the pronounced acidifying effect of LAB during maturation [80].
As pH and aw declined, titratable acidity and proteolysis index evolved in the opposite direction, showing a progressive increase over the time (p < 0.05; Table 3, Figure 3). A previous study reported a similar trend, with acidity increasing and pH decreasing significantly during storage, and more rapid acidification observed in cheeses containing added probiotic cultures [79]. Regarding overall aw, significant differences (p < 0.05) were observed among treatments (Table 3). At mid-maturation, the highest aw values were observed in the pilot raw milk and pilot pasteurized cheeses (0.9761 ± 0.00258 and 0.9761 ± 0.00245, respectively), which formed one statistical group, whereas kefir (0.9618 ± 0.00245), LAB cocktail (0.9577 ± 0.00245), L. mesenteroides (0.9588 ± 0.00255), and control cheeses (0.9583 ± 0.00245) exhibited lower aw values and formed a second group, with significant differences observed between these two groups. By the end of maturation, aw values had further decreased to 0.9614 ± 0.00259 (pilot raw milk), 0.9562 ± 000245 (pilot pasteurized milk), 0.9471 ± 0.00245 (kefir), 0.9430 ± 0.00245 (LAB cocktail), 0.9441 ± 0.00245 (L. mesenteroides), and 0.9436 ± 0.00245 (control), reflecting progressive dehydration during maturation, a key factor in limiting the growth of undesirable microorganisms [54]. The higher aw values in pilot cheeses compared with the laboratory-produced cheeses can be explained by differences in the maturation conditions: pilot raw and pilot pasteurized cheeses were elaborated and ripened at a dairy factory, where the maturation chamber temperature and relative humidity oscillated more than in those strictly kept at the laboratory conditions.
The lower aw values in the laboratory-produced cheeses, combined with the antagonistic activity of kefir microbiota and LAB, likely contributed to the greater inhibition of pathogenic bacteria, since the ability of microorganisms to persist in ripened cheese depends largely on their capacity to grow and tolerate reduced water activity [48].
Total titratable acidity, expressed as g lactic acid equivalent per kg of cheese, increased over time, with the highest mid-maturation values observed in inoculated cheeses, as expected: kefir (from 0.1336 ± 0.022 to 0.2674 ± 0.0215 g/kg), LAB cocktail (from 0.0996 ± 0.022 to 0.2334 ± 0.0215 g/kg), and L. mesenteroides (from 0.0696 ± 0.022 to 0.2034 ± 0.0215 g/kg), with no significant differences among them. By the end of maturation, titratable acidity further increased in kefir (0.4816 ± 0.0215 g/kg), LAB cocktail (0.4476 ± 0.0215 g/kg), and L. mesenteroides (0.4176 ± 0.0215 g/kg), reflecting ongoing lactose fermentation by LAB and explaining the faster and more pronounced pH decline in these treatments [79]. Similar trends, with lower titratable acidity at the beginning of maturation and higher values at the end, have been reported for other goat’s milk cheeses [81]. According to the same authors, lipolysis and the resulting fatty acid composition also has an effect on the Increase In acidity that occurs after prolonged maturation. It Is noteworthy that pilot raw milk cheese did not differ from L. mesenteroides and the LAB cocktail, probably because the indigenous LAB in raw milk were not inactivated by pasteurization. On the other hand, the two pasteurized milk controls—pilot pasteurized milk and control cheeses—formed a separate group with the lowest titratable acidity, very likely to arise from the inactivation of indigenous LAB by heat and the absence of added cultures.
Proteolysis index, a key indicator of biochemical changes during cheese maturation, differed significantly among treatments (p < 0.05), and increased linearly as maturation took place (Figure 3, bottom right). The proteolysis index in recently pressed cheese (Day 1) was highly variable among treatments, with control cheese presenting the lowest mean (0.099 ± 0.0162), followed by pilot pasteurized milk cheese (0.169 ± 0.0162). Also, in this attribute, pilot raw, L. mesenteroides, and LAB cocktail recently pressed cheeses presented high proteolysis index with no significant differences between them (0.269 ± 0.0191, 0.227 ± 0.0162 and 0.269 ± 0.0162, respectively); whereas kefir cheese yielded the highest initial proteolysis index (0.401 ± 0.0162).
At the mid-maturation, kefir cheeses continued to exhibit the highest proteolytic values (0.566 ± 0.0156), whereas LAB cocktail (0.434 ± 0.0156), L. mesenteroides (0.392 ± 0.0156), and pilot raw milk cheeses (0.403 ± 0.0123) clustered into a second group, showing no significant differences among them. In contrast, the control and pilot pasteurized milk cheeses continue to form separate groups, with a lower proteolysis index among all treatments. A previous study on Provola dei Nebrodi PDO cheese reported a similar trend, where the volatile organic compound profiles of experimental cheeses differed significantly from the control, suggesting that the use of adjunct cultures accelerated flavor development and contributed to a distinctive sensory profile [47]. By the end of maturation, kefir cheeses exhibited the greatest proteolysis (0.719 ± 0.0156), followed by the LAB cocktail (0.587 ± 0.0156), L. mesenteroides (0.545 ± 0.015), and pilot raw milk cheeses (0.586 ± 0.0165). Proteolysis is widely recognized as one of the most important biochemical process in cheese maturation, driving the development of characteristic flavor and texture through microbial proteases activity that releases peptides and amino acids, and adjunct cultures play a crucial role in intensifying and directing these biochemical changes, thereby enhancing both the nutritional and sensory quality in ripened cheeses [82,83,84].
3.1.3. Principal Component Analysis
To better understand the relationships among microbiological and physicochemical parameters influencing the quality of pasteurized goat’s milk cheese, a principal component analysis (PCA) was performed. Supported by Kaiser’s criteria for eigenvalues (>1.0), the PCA solution considering cheese treatment as a qualitative variable accounted for 82.9% of the total variability, whereas the solution considering maturation time as a qualitative variable accounted for 84.8% of the variability (Table 4). In both solutions, the variables’ loadings (i.e., vectors) presented similar trends, and each PC accounted for similar proportions: dimension 1 between 51.5–51.9% and dimension 2, 31.4–33.0% (Figure 4).
Table 4.
Correlation coefficients for the physicochemical and microbiological attributes of goat’s milk cheeses during maturation, as evaluated by two principal component analysis solutions and showing explained variances.
Figure 4.
Goat’s milk cheese treatments and maturation times (1, 15, 30, 45 and 60 days) as positioned on the principal component analysis (PCA) space defined by evolving microbiological and physicochemical attributes. Left graphs denote the PCA solution with maturation time as the qualitative variable, and right graphs show the PCA solution with maturation time as factor. Aw: water activity; Ecoli: Escherichia coli counts; Staphy: Staphylococcus aureus counts; Mesophiles: total mesophiles counts; M17: presumptive lactic acid bacteria counts grown on M17 agar; MRS: presumptive lactic acid bacteria counts grown on MRS agar; Proteolysis: proteolysis index; Acidity: titratable acidity; Time: maturation time.
For the PCA solution based on cheese treatment as a factor, the first and most important principal component (PC1) explained 51.5% of the total variability and was highly and positively correlated with proteolysis (R = 0.917), acidity (R = 0.846), maturation time (R = 0.753), LAB counts on MRS (R = 0.736) and M17 (R = 0.723), and mesophilic counts (R = 0.726), while showing strong negative correlations with pH (R = −0.884), and aw (R = −0.689), and weaker negative correlation with E. coli (R = −0.429) (Figure 4, top left, and Table 4). These correlations indicate that cheeses with higher proteolysis and acidity were associated with more advanced stages of maturation.
On the other hand, the cluster of aw and pH opposite to maturation time is an expected outcome, as these two properties decrease during maturation (Figure 4, top left). The strong negative loadings of pH and aw (Table 4) demonstrate that PC1 can effectively discriminate cheeses with higher biochemical activity (greater acid and protease production) from those with higher moisture content and weaker fermentation, and also reflects a secondary gradient associated with the progressive reduction in hygiene indicator E. coli during maturation (Figure 4, top left). Thus, PC1 represents a biochemical maturation gradient, clearly separating kefir and LAB cocktail cheeses, characterized by intense microbial activity and biochemical changes, from pilot pasteurized and control cheeses, which displayed higher pH and aw values. This pattern suggests that product formulation, particularly the incorporation of adjunct cultures (i.e., kefir, LAB cocktail, and L.mesenteroides) strongly influenced microbial metabolism, as pH and aw are key variables associated with the inhibition of spoilage and pathogenic bacteria [46,54].
If S. aureus and E. coli contaminate the cheese matrix, they may survive throughout processing if the decrease in pH during the initial fermentation stage is insufficient. To limit growth, acidification should be managed to obtain pH values around or below 5.0 for E. coli and 5.8 for S. aureus at the early stage of the maturation process [53,73,74]. This observation helps explain the absence of correlation of S. aureus (R = 0.013) and the weak negative correlation of E. coli (R = −0.429) with PC1, since these pathogens may either increase or decrease during processing, depending on the physicochemical conditions (Table 4; Figure 4, top left).
The second principal component (PC2) explained 31.4% of the total variability and was highly correlated with S. aureus (R = 0.892), moderately correlated with mesophilic counts (R = 0.672), LAB on MRS (R = 0.663), LAB on M17 (R = 0.680), and E. coli (R = 0.654), while weakly associated with aw (R = 0.361) (Table 4). The quality map revealed a clear separation of cheese by treatment: kefir, LAB cocktail, L. mesenteroides, and pilot raw milk cheeses clustered on the positive side of PC1, characterized by higher acidity, proteolysis, and LAB/mesophilic counts, indicating that microbial activity was the main driver of biochemical changes during maturation, whereas pilot pasteurized and control cheeses grouped on the negative side of PC1, associated with higher E. coli counts, pH and aw values, consistent with weaker fermentation and the absence of inoculated LAB (Figure 4, bottom left).
For the PCA solution considering maturation time as a qualitative variable, the PC1 explained 51.9% of the total variability and exhibited a pattern similar to that observed in the previous PCA. PC1 was highly and positively correlated with proteolysis (R = 0.867), acidity (R = 0.755), LAB on MRS (R = 0.832) and M17 (R = 0.822), and mesophilic counts (R = 0.820). On the other hand, it was strongly and negatively correlated with pH (R = −0.898) and aw (R = −0.588), and more weakly with E. coli (R = −0.362) (Table 4; Figure 4, top right). The variable projection (Figure 4, top right) shows acidity, proteolysis and advanced maturation times clustering together (Days 45 and 60), whereas pH, aw, and E. coli plot on the opposite side and were associated with early maturation stages (Days 1 and 15). This quality map allows visualizing the concurrent evolution of acidification and proteolysis, with progressive decreases in pH, aw, and E. coli counts as maturation advanced.
PC2 explained 32.9% of the variability and was highly and positively correlated with E. coli (R = 0.767) and S. aureus (R = 0.870), while only weakly associated with LAB on MRS (R = 0.537) and M17 (R = 0.555), mesophilic counts (R = 0.553), pH (R = 0.208), and aw (R = 0.418). PC2 showed weak negative correlations with acidity (R = −0.585) and proteolysis (R = −0.398), capturing secondary variations related to pathogen and indicator microorganism dynamics across the maturation period (Table 4; Figure 4 top right). The quality map (Figure 4, bottom right) revealed a very clear temporal separation of samples: cheeses at 30, 45 and 60 days clustered on the positive side of PC1, characterized by higher acidity, proteolysis, and LAB/mesophilic counts, whereas samples from days 1 and 15 were grouped on the negative side, associated with higher E. coli counts, pH and aw values, likely reflecting the limited development of fermentation at early maturation stage.
Pilot raw milk cheeses were positioned closer to the inoculated treatments in the quality map (Figure 4, bottom left), reflecting the contribution of natural microbiota to acidification and proteolysis [85]. The wide range of acidification typically observed in artisanal cheese may be related to the heterogeneous bacterial populations naturally present in raw milk, particularly native LAB with proteolytic and lipolytic activities [86]. On the other hand, pilot pasteurized milk and the control cheese (without adjunct cultures) were characterized by higher pH and reduced microbial and enzymatic activity, leading to slower and less intense maturation. Overall, the incorporation of adjunct cultures markedly modulate biochemical transformations such as acidification and proteolysis in pasteurized goat’s milk cheese, enhancing maturation intensity and improving microbiological stability through their metabolic activity and enzymatic contribution to the maturation process [84].
3.2. Proximate Composition and Instrumental Textural Attributes of the Goat’s Milk Cheeses as Final Product
The proximate composition and instrumental textural attributes of the final goat’s milk cheeses are summarized in Table 5. Significant differences (p < 0.05) were observed among treatments, with moisture (25.3–38.2%), protein (32.6–43.0% db), and fat (42.8–53.2% db) showing the greatest variability, a pattern comparable to the wide ranges reported for traditionally produced goat cheeses, where differences in milk composition and manufacturing conditions drive batch-to-batch variation [86]. Indeed, the proximate composition of cheese largely depends on the initial composition of the milk, which is influenced by a multiple factors such as animal breed, stage of lactation, climatic conditions and season, feeding regime, lactation number, individual variability and the health status of the animals [87,88,89,90]. Variations in milk protein and fat content have a significant impact on final cheese composition and yield [90].
Table 5.
Least-square means (±standard error) of the proximate composition and instrumental texture attributes of the final goat’s milk cheeses.
Among milk components, protein exerts the greatest influence on both nutritional value and technological functionality, consisting mainly of caseins (~80%) and, to a lesser extent, whey proteins (~20%) [91]. In artisanal goat cheeses, higher fat content in comparison with other goat cheeses may be related to the fat composition of the milk, while differences in moisture have been attributed to the intensity of whey drainage during cheesemaking [86]. The moisture and ash content obtained for the LAB cocktail cheese were similar to values reported for other goat cheeses, indicating a consistent dehydration pattern and relatively stable mineral fraction [91,92]. Regarding ash content, significant differences (p < 0.05) were observed among treatments, although variability was lower (4.99–9.31% db), in line with values typically reported for traditionally produced goat’s milk cheeses [91].
The instrumental texture analysis revealed significant differences (p < 0.05) in cheese hardness, whereas brittleness values remained statistically similar across treatments (Table 5). Kefir cheese exhibited the lowest hardness (140 ± 13.8 g), followed by the pilot raw milk (214 ± 13.8 g), LAB cocktail (232 ± 13.8 g) and L. mesenteroides (310 ± 13.8 g), while the control and pilot pasteurized milk cheeses displayed the highest hardness values (591 ± 13.8 g and 567 ± 13.8 g, respectively), indicating a firmer texture and no significant differences within this group. The lower hardness observed in kefir and LAB-treated cheeses may be associated with multiple compositional and biochemical changes that occur during ripening. Among the parameters evaluated in this study, differences in acidification patterns and proteolytic index may have contributed to changes in the structural organization of the protein matrix. However, variations in cheese composition, including moisture content and other physicochemical characteristics, may also have influenced texture development. Therefore, the observed differences should be interpreted as the result of combined effects rather than as a direct consequence of proteolysis alone. LAB are known to modulate cheese texture via hydrolysis of the protein matrix, a decrease in water activity through changes to water binding by the new carboxylic acid and amino groups liberated on hydrolysis of peptide bonds, and the synthesis of exopolysaccharides (EPS) [93,94,95]. Proteolysis in maturation cheeses is primarily catalyzed by microbial proteinases and peptidases originating from the coagulant, milk, starter LAB and non-starter LAB, which progressively hydrolyze caseins into peptides and free amino acids, thereby improving texture, and contributing to the desired softness of matured cheeses [95]. Brittleness, which reflects the tendency of cheese to fracture when subjected to force [42], exhibited minor variation among treatments (8.41–10.0 mm), although these differences were not statistically significant, as indicated by the same lowercase letters (Table 5).
Principal component analysis was also applied to evaluate the relationships among proximate composition and instrumental textural parameters of the final goat’s milk cheeses (Figure 5). The first two principal components (PC1 and PC2) explained 71.3% of the total variance, with PC1 accounting for 46.8% and PC2 for 24.5%. PC1 was mainly defined by positive correlation with proteolysis and acidity, fat and brittleness, and negative correlation with pH, hardness and ash content. Thus, the PCA solution suggests that more brittle cheeses tended to have higher levels of fat content, acidity and proteolysis index, whereas on the other end, harder cheeses were those of higher pH or greater ash content. Furthermore, the more tender the cheese, the more brittle it was.
Figure 5.
Differences among the goat’s milk cheeses, as positioned on the principal component analysis space defined by the proximate composition and instrumental textural attributes measured in the final product. Aw: water activity; Proteolysis: proteolysis index; Acidity: titratable acidity; FatDM: fat content in dry matter; ProteinDM: protein content in dry matter; AshDM: ash content in dry matter.
PC2 was characterized by positive correlations with protein, aw, and moisture. Kefir, LAB cocktail, and to a lesser extent L. mesenteroides and pilot raw milk cheese, were associated with higher acidity and proteolysis index, reflecting a more advanced maturation stage and softer texture. Conversely, pilot pasteurized milk and control cheeses plotted on the opposite side, correlating strongly with greater hardness and higher pH, indicative of a less mature cheese matrix with firmer structure. On the opposite side of the plot from the control and pasteurized cheeses were kefir and LAB cocktail cheeses, indicating greater brittleness and lower hardness and thereby confirming their improved texture compared with the L. mesenteroides cheeses. The cheeses elaborated at a pilot scale (pilot raw milk and pilot pasteurized milk) were the ones associated with higher moisture and aw.
Overall, the PCA clearly distinguished kefir and LAB inoculated cheeses from the L. mesenteroides, pilot pasteurized milk, raw milk and control cheeses. The projection of the variables demonstrated that higher acidity and proteolysis were inversely related to hardness and pH, reinforcing that the incorporation of kefir ferment or LAB cultures promotes biochemical changes leading to softer texture and enhanced maturation.
3.3. Sensory Analysis Attributes of the Goat’s Milk Cheeses as Final Product
Sensory evaluation was conducted to assess the influence of the different treatments on the sensory properties of goat’s milk cheese as the finished product. Results are shown in Table 6, and as a means radar plot in Figure 6.
Table 6.
Estimated marginal means (±standard error) of the sensory attributes of the goat’s milk cheeses.
Figure 6.
Sensory analysis profile radar of the goat’s milk cheeses evaluated on a non-structured 10-point scale.
Likely due to the high variability among the panelists’ responses, no significant differences were detected for compactness, aroma, taste, aftertaste, or pastiness. For the presence of holes, the highest scores were obtained for pilot raw and pilot pasteurized milk cheeses (5.82 ±0.407, and 4.38 ± 0.388, respectively), which clustered in the same statistical group. Kefir (3.08 ± 0.400), control (3.27 ± 0.400), L. mesenteroides (3.31 ± 0.400), and the LAB cocktail (3.61 ± 0.400) formed a second group, with significant differences (p < 0.05) between these two groups, although the pilot pasteurized milk cheese did not differ significantly from the latter group. Because both pilot cheeses were manufactured at a dairy factory, the higher presence of holes observed in these treatments may be linked to hygiene conditions, consistent with the higher E. coli counts (7.72 ± 0.401) found in the pilot pasteurized cheese, a recognized hygiene indicator [4], as well as their relatively higher pH (6.51 ± 0.00526) and aw (0.9749 ± 0.00205 for pasteurized and 0.9729 ± 0.00193 for raw), which favor gas expansion within the cheese matrix. In addition to microbiological factors, technological aspects such as lower curd compaction or insufficient pressing during production may have promoted the retention of air or gas. In contrast, the control and adjunct-culture cheeses, produced at laboratory scale, showed minimal hole formation, reflecting tighter curd structure and better controlled fermentation conditions. Early gas defects or blowing in cheese, characterized by the appearance of small, irregular holes or fissures, are commonly caused by coliform bacteria such as E. coli, which ferment lactose to produce CO2 and H2 gases [96].
Crumbliness, defined as the tendency of cheese to break into small particles, was lowest in kefir cheese (3.81 ± 0.395), which formed a statistically distinct group from the other treatments (p < 0.05), the latter exhibiting higher crumbliness. Similarly, in a previous study, experimental cheeses produced with the addition of Lactobacillus acidophilus (EP1) were rated only as “fair” by the sensory panel, whereas all other cheeses were described as “good”; panelists noted that EP1 cheeses were more crumbly, whiter, and more acidic than the other samples, supporting the association between excessive crumbliness, increased acidity, and lower sensory perception of texture quality [97].
Hardness was lowest in kefir and LAB cocktail cheeses (2.89 ± 0.354 and 3.27 ± 0.354, respectively), which grouped together statistically and differed from the other cheeses. However, the pilot pasteurized milk cheese did not differ significantly from kefir and LAB cocktail, suggesting a comparatively softer and smoother texture in these treatments. The results showed that hardness significantly decreased (p < 0.05) during cheese maturation, concurrent with the progression of proteolysis (kefir: 0.719 ± 0.0156; LAB cocktail: 0.587 ± 0.0156; Table 3), in agreement with previous studies reporting that increased proteolysis and compositional changes contribute to the softening of cheese texture during maturation, as observed in Croatian cheese ripened in a lamb skin sack (Sir iz mišine) [98].
In terms of stickiness, or the tendency of cheese to adhere to oral surfaces during chewing, the pilot raw and pasteurized milk cheeses exhibited the highest values (4.89 ± 0.345 and 3.59 ± 0.328, respectively). The pilot pasteurized cheese, however, did not differ significantly from the control, L. mesenteroides, LAB cocktail or kefir cheeses. For cork-like texture, described as a spongy or rubbery mouthfeel, significant differences were observed among treatments. Kefir cheese presented the lowest score (2.89 ± 0.416) followed by LAB cocktail (3.54 ± 0.416), L. mesenteroides (3.77 ± 0.416) and pilot raw milk cheese (4.52 ± 0.423). These treatments clustered together statistically, while the control and the pilot pasteurized milk cheeses were the only treatments statistically different from the kefir cheeses.
Regarding overall acceptance, kefir cheese achieved the highest score (9.15 ± 0.285) and was significantly more accepted than the control (7.48 ± 0.285) and both pilot cheeses (7.88 ± 0.289 and 7.89 ± 0.275 for raw and pasteurized cheese, respectively) (p < 0.05). Although L. mesenteroides (8.44 ± 0.285) and the LAB cocktail (8.39 ± 0.285) showed numerically higher overall acceptance scores than the control and pilot cheeses, these differences were not statistically significant. Likewise, no significant differences were observed between these treatments and kefir cheese (p > 0.05). Overall, the adjunct-culture cheeses demonstrated acceptability comparable to the control and pilot cheeses in statistical terms, while exhibiting numerically higher acceptance scores. Among all treatments, kefir-treated cheese achieved the highest overall acceptance. The lower presence of holes, crumbliness, hardness, stickiness and cork-like texture and the higher overall acceptance observed in kefir cheeses indicate a softer, smoother, and more cohesive texture, likely related to higher proteolysis index and greater acidification during maturation, processes that are directly associated with enhanced flavor and texture development in ripened cheeses. Cheese maturation is a complex set of biochemical events that involves residual lactose, lactate and citrate metabolisms, as well as lipolysis and proteolysis, resulting in characteristic flavor and texture characteristic of the different cheese varieties [99]. The aroma and taste of kefir cheese may also be attributed to the presence of yeasts and diverse LAB species, which contribute to the synthesis of volatile aromatic compounds and a more complex flavor profile [19,47]. Similarly, cheeses produced with L. mesenteroides, and the LAB cocktail displayed favorable flavor profiles compared with the control. A clear differentiation in terms of aromatic profile, texture, and sensorial perception was observed in the experimental cheese (with the Lcb. paracasei 4321) in contrast to the control [28]. Overall, the sensory evaluation confirmed the technological and sensory advantages of kefir and LAB adjunct cultures in goat’s milk cheesemaking. Their incorporation improved the aroma, acidity, and textural profile, leading to greater consumer acceptance. Cheese is widely recognized as a suitable food matrix for probiotic incorporation, and numerous studies report positive impacts of probiotic or adjunct LAB on physicochemical, microbiological, and sensory characteristics during maturation [69,100].
4. Conclusions
The results demonstrated that the incorporation of kefir and selected LAB strains (Leuconostoc mesenteroides, Lacticaseibacillus paracasei, and Loigolactobacillus coryniformis) into pasteurized goat’s milk cheese aligns with current trends in developing innovative fermented dairy products with improved technological performance and sensory acceptability. Starter-inoculated cheeses maintained high LAB counts (8–9 log CFU/g) throughout maturation, indicating the persistence of high LAB populations during ripening. As indicated by pH and acidity measurements, kefir ferment and selected LABs produced more rapid acidification of the maturing cheese matrix than all control cheeses, including the benchmark raw goat’s milk cheese. Such quick acidification may have prompted the decay in the monitored S. aureus and E. coli. Sensory evaluation confirmed their technological benefits, as kefir- and LAB-enriched cheeses achieved higher acceptance scores, characterized by balanced acidity, pleasant aroma, and smooth texture. Overall, the incorporation of kefir or selected LAB strains improved the physicochemical, microbiological and sensory attributes of pasteurized goat’s milk cheese, highlighting their potential as natural multifunctional adjunct cultures for the production of high-quality artisanal cheeses, and responding to growing consumer demand for minimally processed and preservative-free products, which further supports the development of functional cheeses [13,100].
Author Contributions
Conceptualization, U.G.-B. and V.C.; methodology, Y.L., V.C., and U.G.-B.; software, U.G.-B.; validation, V.C. and U.G.-B.; formal analysis, Y.L. and U.G.-B.; investigation, Y.L., V.C., and U.G.-B.; resources, V.C. and U.G.-B.; data curation, Y.L. and U.G.-B.; writing—original draft preparation, Y.L. and U.G.-B.; writing—review and editing, Y.L., A.M.d.A., V.C., and U.G.-B.; visualization, Y.L., A.M.d.A., V.C., and U.G.-B.; supervision, V.C., A.M.d.A. and U.G.-B.; project administration, V.C. and U.G.-B.; funding acquisition, Y.L., V.C., and U.G.-B. All authors have read and agreed to the published version of the manuscript.
Funding
This work was supported by national funds through FCT/MCTES (PIDDAC): CIMO UID/00690/2025 (10.54499/UID/00690/2025) and UID/PRR/00690/2025 (10.54499/UID/PRR/00690/2025); SusTEC, LA/P/0007/2020 (https://doi.org/10.54499/LA/P/0007/2020) and by the PAS-AGRO-PAS project (The Making of Fragile Agro-ecosystems Productive, Adaptive and Sustainable: Multifunctional Agro-pastoralism; PRIMA/0014/2022). Y.L. acknowledges the financial support provided by FCT through the Ph.D. grant PRT/BD/152089/2021 (https://doi.org/10.54499/PRT/BD/152089/2021). A. M. de Almeida acknowledges funding by national funds through FCT—Fundação para a Ciência e a Tecnologia, I.P. through project UID/04129/2025 of LEAF—Linking Landscape, Environment, Agriculture and Food, and LA/P/0092/2020 of Associate Laboratory TERRA.
Institutional Review Board Statement
Not applicable.
Informed Consent Statement
Not applicable.
Data Availability Statement
Authors can share raw data under reasonable request, provided proper credits are given.
Acknowledgments
Y. Loforte acknowledges the financial support provided by FCT through the Ph.D. grant PRT/BD/152089/2021. https://doi.org/10.54499/PRT/BD/152089/2021.
Conflicts of Interest
The authors declare no conflicts of interest.
References
- Kajak-Siemaszko, K.; Zielińska, D.; Łepecka, A.; Jaworska, D.; Okoń, A.; Neffe-Skocińska, K.; Trząskowska, M.; Sionek, B.; Szymański, P.; Dolatowski, Z.J.; et al. Effect of Lactic Acid Bacteria on Nutritional and Sensory Quality of Goat Organic Acid-Rennet Cheeses. Appl. Sci. 2022, 12, 8855. [Google Scholar] [CrossRef] [Scilit]
- Muelas, R.; Martí de Olives, A.; Romero, G.; Díaz, J.R.; Sayas-Barberá, M.E.; Sendra, E. Evaluation of Individual Lactic Acid Bacteria for the Fermentation of Goat Milk: Quality Parameters. LWT 2018, 98, 506–514. [Google Scholar] [CrossRef] [Scilit]
- Montel, M.-C.; Buchin, S.; Mallet, A.; Delbes-Paus, C.; Vuitton, D.A.; Desmasures, N.; Berthier, F. Traditional Cheeses: Rich and Diverse Microbiota with Associated Benefits. Int. J. Food Microbiol. 2014, 177, 136–154. [Google Scholar] [CrossRef] [Scilit] [PubMed]
- Cadavez, V.; Rodrigues, V.; Gonzales-Barron, U. Microbiological Safety of Goat Milk and Cheese: Evidences from a Meta-Analysis. In Sustainable Goat Production in Adverse Environments; Springer International Publishing: Cham, Switzerland, 2017; pp. 379–390. [Google Scholar]
- Verraes, C.; Vlaemynck, G.; Van Weyenberg, S.; De Zutter, L.; Daube, G.; Sindic, M.; Uyttendaele, M.; Herman, L. A Review of the Microbiological Hazards of Dairy Products Made from Raw Milk. Int. Dairy J. 2015, 50, 32–44. [Google Scholar] [CrossRef] [Scilit]
- Pyz-Łukasik, R.; Knysz, P.; Gondek, M. Hygiene Quality and Consumer Safety of Traditional Short- and Long-Ripened Cheeses from Poland. J. Food Qual. 2018, 2018, 8732412. [Google Scholar] [CrossRef] [Scilit]
- Aragão, B.B.; Trajano, S.C.; Silva, J.G.; Silva, B.P.; Oliveira, R.P.; Junior, J.W.P.; Peixoto, R.M.; Mota, R.A. Short Communication: High Frequency of β-Lactam-Resistant Staphylococcus aureus in Artisanal Coalho Cheese Made from Goat Milk Produced in Northeastern Brazil. J. Dairy Sci. 2019, 102, 6923–6927. [Google Scholar] [CrossRef] [Scilit] [PubMed]
- Necidová, L.; Bursová, Š.; Haruštiaková, D.; Bogdanovičová, K.; Lačanin, I. Effect of Heat Treatment on Activity of Staphylococcal Enterotoxins of Type A, B, and C in Milk. J. Dairy Sci. 2019, 102, 3924–3932. [Google Scholar] [CrossRef] [Scilit] [PubMed]
- Martin, N.H.; Boor, K.J.; Wiedmann, M. Symposium Review: Effect of Post-Pasteurization Contamination on Fluid Milk Quality. J. Dairy Sci. 2018, 101, 861–870. [Google Scholar] [CrossRef] [Scilit] [PubMed]
- Gould, L.H.; Mungai, E.; Barton Behravesh, C. Outbreaks Attributed to Cheese: Differences Between Outbreaks Caused by Unpasteurized and Pasteurized Dairy Products, United States, 1998–2011. Foodborne Pathog. Dis. 2014, 11, 545–551. [Google Scholar] [CrossRef] [Scilit] [PubMed]
- Lourenco, A.; Fraga-Corral, M.; De Colli, L.; Moloney, M.; Danaher, M.; Jordan, K. Determination of the Presence of Pathogens and Anthelmintic Drugs in Raw Milk and Raw Milk Cheeses from Small Scale Producers in Ireland. LWT 2020, 130, 109347. [Google Scholar] [CrossRef] [Scilit]
- Mantzourani, I.; Terpou, A.; Alexopoulos, A.; Chondrou, P.; Galanis, A.; Bekatorou, A.; Bezirtzoglou, E.; Koutinas, A.A.; Plessas, S. Application of A Novel Potential Probiotic Lactobacillus paracasei Strain Isolated from Kefir Grains in the Production of Feta-Type Cheese. Microorganisms 2018, 6, 121. [Google Scholar] [CrossRef] [Scilit] [PubMed]
- Castellano, P.; Pérez Ibarreche, M.; Blanco Massani, M.; Fontana, C.; Vignolo, G.M. Strategies for Pathogen Biocontrol Using Lactic Acid Bacteria and Their Metabolites: A Focus on Meat Ecosystems and Industrial Environments. Microorganisms 2017, 5, 38. [Google Scholar] [CrossRef] [Scilit] [PubMed]
- Vázquez-Velázquez, R.; Salvador-Figueroa, M.; Adriano-Anaya, L.; DeGyves–Córdova, G.; Vázquez-Ovando, A. Use of Starter Culture of Native Lactic Acid Bacteria for Producing an Artisanal Mexican Cheese Safe and Sensory Acceptable. CyTA J. Food 2018, 16, 460–468. [Google Scholar] [CrossRef] [Scilit]
- Siedler, S.; Rau, M.H.; Bidstrup, S.; Vento, J.M.; Aunsbjerg, S.D.; Bosma, E.F.; McNair, L.M.; Beisel, C.L.; Neves, A.R. Competitive Exclusion Is a Major Bioprotective Mechanism of Lactobacilli against Fungal Spoilage in Fermented Milk Products. Appl. Environ. Microbiol. 2020, 86, e02312-19. [Google Scholar] [CrossRef] [Scilit] [PubMed]
- Loforte, Y.; Zanzan, M.; Cadavez, V.; Gonzales-Barron, U. Dynamic Modelling of Listeria monocytogenes Growth in a Milk Model Medium as Affected by pH and Selected Lactic Acid Bacteria Strains. Foods 2025, 14, 3999. [Google Scholar] [CrossRef] [Scilit] [PubMed]
- Feeney, E.L.; Lamichhane, P.; Sheehan, J.J. The Cheese Matrix: Understanding the Impact of Cheese Structure on Aspects of Cardiovascular Health—A Food Science and a Human Nutrition Perspective. Int. J. Dairy Technol. 2021, 74, 656–670. [Google Scholar] [CrossRef] [Scilit]
- Ziarno, M.; Bryś, J.; Kowalska, E.; Cichońska, P. Effect of Metabolic Activity of Lactic Acid Bacteria and Propionibacteria on Cheese Protein Digestibility and Fatty Acid Profile. Sci. Rep. 2023, 13, 15363. [Google Scholar] [CrossRef] [Scilit] [PubMed]
- Kurniawan; Milanda, T.; Kusuma, S.A.F. Kefir as a Functional Probiotic: Microbial Composition and Health Effects. Front. Food Sci. Technol. 2026, 5, 1725280. [Google Scholar] [CrossRef] [Scilit]
- 9 Food Trends to Watch for in 2021. Available online: https://www.ift.org/news-and-publications/blog/2021/2021-food-tech-predictions (accessed on 16 January 2026).
- Çavuş, H.; Emirmustafaoğlu, A. Use of Kefir in Cheese Ball Production: Physicochemical, Textural, Rheological, and Sensory Properties. Food Sci. Nutr. 2025, 13, e70183. [Google Scholar] [CrossRef] [Scilit] [PubMed]
- de Oliveira Leite, A.M.; Miguel, M.A.L.; Peixoto, R.S.; Rosado, A.S.; Silva, J.T.; Paschoalin, V.M.F. Microbiological, Technological and Therapeutic Properties of Kefir: A Natural Probiotic Beverage. Braz. J. Microbiol. 2013, 44, 341–349. [Google Scholar] [CrossRef] [Scilit] [PubMed]
- Silva, B.N.; Fernandes, N.; Carvalho, L.; Faria, A.S.; Teixeira, J.A.; Rodrigues, C.; Gonzales-Barron, U.; Cadavez, V. Lactic Acid Bacteria from Artisanal Raw Goat Milk Cheeses: Technological Properties and Antimicrobial Potential. Ital. J. Food Saf. 2023, 12, 11559. [Google Scholar] [CrossRef] [Scilit] [PubMed]
- Ananou, S.; Garriga, M.; Hugas, M.; Maqueda, M.; Martínez-Bueno, M.; Gálvez, A.; Valdivia, E. Control of Listeria monocytogenes in Model Sausages by Enterocin AS-48. Int. J. Food Microbiol. 2005, 103, 179–190. [Google Scholar] [CrossRef] [Scilit] [PubMed]
- Barcenilla, C.; Puente, A.; Cobo-Díaz, J.F.; González-Raurich, M.; López, M.; Prieto, M.; Álvarez-Ordóñez, A. Evaluation of the Performance of a Three-Strains Lactic Acid Bacteria Cocktail for the Control of Listeria monocytogenes on Marinated Lean Pork. LWT 2024, 200, 116166. [Google Scholar] [CrossRef] [Scilit]
- Ayed, M.; Yakoubi, S.; Cadavez, V.; Gonzales-Barron, U. Technological, Microbiological and Sensory Quality Attributes of Goat’s Milk Kefir: Comparison between Plain and Flavored Types. J. Food Nutr. Diet Sci. 2025, 3, 53–70. [Google Scholar] [CrossRef] [Scilit]
- Schvartzman, M.S.; Belessi, X.; Butler, F.; Skandamis, P.; Jordan, K. Comparison of Growth Limits of Listeria monocytogenes in Milk, Broth and Cheese: Comparison of Growth Limits of L. monocytogenes. J. Appl. Microbiol. 2010, 109, 1790–1799. [Google Scholar] [CrossRef] [Scilit] [PubMed]
- Kamarinou, C.S.; Papadopoulou, O.S.; Doulgeraki, A.I.; Tassou, C.C.; Galanis, A.; Chorianopoulos, N.G.; Argyri, A.A. Application of Multi-Functional Lactic Acid Bacteria Strains in a Pilot Scale Feta Cheese Production. Front. Microbiol. 2023, 14, 1254598. [Google Scholar] [CrossRef] [Scilit] [PubMed]
- Saraoui, T.; Leroi, F.; Chevalier, F.; Cappelier, J.-M.; Passerini, D.; Pilet, M.-F. Bioprotective Effect of Lactococcus piscium CNCM I-4031 Against Listeria Monocytogenes Growth and Virulence. Front. Microbiol. 2018, 9, 1564. [Google Scholar] [CrossRef] [Scilit] [PubMed]
- Borges, D.O.; Matsuo, M.M.; Bogsan, C.S.B.; da Silva, T.F.; Casarotti, S.N.; Penna, A.L.B. Leuconostoc mesenteroides Subsp. Mesenteroides SJRP55 Reduces Listeria Monocytogenes Growth and Impacts on Fatty Acids Profile and Conjugated Linoleic Acid Content in Fermented Cream. LWT 2019, 107, 264–271. [Google Scholar] [CrossRef] [Scilit]
- CXS 283-1978; General Standard for Cheese. Codex Alimentarius Commission: Rome, Italy, 1978.
- M’hamed, A.C.; Ncib, K.; Merghni, A.; Migaou, M.; Lazreg, H.; Snoussi, M.; Noumi, E.; Mansour, M.B.; Maaroufi, R.M. Characterization of Probiotic Properties of Lacticaseibacillus paracasei L2 Isolated from a Traditional Fermented Food “Lben.”. Life 2022, 13, 21. [Google Scholar] [CrossRef] [Scilit] [PubMed]
- Verdier-Metz, I.; Coulon, J.-B.; Pradel, P. Relationship between Milk Fat and Protein Contentsand Cheese Yield. Anim. Res. 2001, 50, 365–371. [Google Scholar] [CrossRef] [Scilit] [PubMed]
- Pramularsih, I.; Kyere, E.O.; Md Zain, S.N.; Flint, S. Testing for Total Bacteria in Dairy Powder—Comparison of Test Incubation Temperatures (a Case Study). Int. Dairy J. 2022, 134, 105452. [Google Scholar] [CrossRef] [Scilit]
- American Dairy Products Institute. ADPI Analytical Method: Determination of Titratable Acidity; American Dairy Products Institute: Elmhurst, IL, USA, 2023. [Google Scholar]
- Sakaridis, I.; Lewis, M. Detecting a Rapid Method for Measuring the Proteolytic Activity of Raw and UHT Milk. SDRP J. Food Sci. Technol. 2016, 1, 1–10. [Google Scholar]
- AOAC International. Official Methods of Analysis of AOAC International: AOAC Official Method 926.08—Moisture in Cheese, 21st ed.; AOAC International: Gaithersburg, MD, USA, 2019. [Google Scholar]
- AOAC International. Official Methods of Analysis of AOAC International: AOAC Official Method 935.42—Ash of Cheese (Gravimetric Method), 21st ed.; AOAC International: Gaithersburg, MD, USA, 2019. [Google Scholar]
- AOAC International. Official Methods of Analysis of AOAC International: AOAC Official Method 991.20—Nitrogen (Total) in Milk (Kjeldahl Method), 21st ed.; AOAC International: Gaithersburg, MD, USA, 2019. [Google Scholar]
- AOAC International. Official Methods of Analysis of AOAC International: AOAC Official Method 933.05—Fat in Cheese, 21st ed.; AOAC International: Gaithersburg, MD, USA, 2019. [Google Scholar]
- Jonkers, N.; van Dommelen, J.A.W.; Geers, M.G.D. Intrinsic Mechanical Properties of Food in Relation to Texture Parameters. Mech. Time-Depend. Mater. 2022, 26, 323–346. [Google Scholar] [CrossRef] [Scilit]
- Tunick, M.H. Cheese Rheology and Texture. In Handbook of Cheese Chemistry; Royal Society of Chemistry: London, UK, 2023. [Google Scholar] [CrossRef] [Scilit]
- Zheng, Y.; Liu, Z.; Mo, B. Texture Profile Analysis of Sliced Cheese in Relation to Chemical Composition and Storage Temperature. J. Chem. 2016, 2016, 8690380. [Google Scholar] [CrossRef] [Scilit]
- R: The R Project for Statistical Computing. Available online: https://www.r-project.org/ (accessed on 1 October 2025).
- Dalzini, E.; Cosciani-Cunico, E.; Sfameni, C.; Monastero, P.; Daminelli, P.; Losio, M.N.; Varisco, G. Microbiological and Physico-Chemical Changes During Manufacture of an Italian Goat Cheese Made from Raw Milk. Ital. J. Food Saf. 2014, 3, 4586. [Google Scholar] [CrossRef] [Scilit] [PubMed]
- Taboada, N.; Medina, R.; Núñez, M.; Alzogaray, L. Biochemical and Microbiological Changes throughout the Ripening of Argentinean Fresh Goat’s Milk Cheeses Made with Native Cultures. J. Microbiol. Biotechnol. Food Sci. 2017, 6, 1174–1180. [Google Scholar] [CrossRef] [Scilit]
- Randazzo, C.L.; Liotta, L.; Angelis, M.D.; Celano, G.; Russo, N.; Hoorde, K.V.; Chiofalo, V.; Pino, A.; Caggia, C. Adjunct Culture of Non-Starter Lactic Acid Bacteria for the Production of Provola Dei Nebrodi PDO Cheese: In Vitro Screening and Pilot-Scale Cheese-Making. Microorganisms 2021, 9, 179. [Google Scholar] [CrossRef] [Scilit] [PubMed]
- Gatti, M.; Bottari, B.; Lazzi, C.; Neviani, E.; Mucchetti, G. Invited Review: Microbial Evolution in Raw-Milk, Long-Ripened Cheeses Produced Using Undefined Natural Whey Starters. J. Dairy Sci. 2014, 97, 573–591. [Google Scholar] [CrossRef] [Scilit] [PubMed]
- Blaya, J.; Barzideh, Z.; LaPointe, G. Symposium Review: Interaction of Starter Cultures and Nonstarter Lactic Acid Bacteria in the Cheese Environment1. J. Dairy Sci. 2018, 101, 3611–3629. [Google Scholar] [CrossRef] [Scilit] [PubMed]
- Briggiler-Marcó, M.; Capra, M.L.; Quiberoni, A.; Vinderola, G.; Reinheimer, J.A.; Hynes, E. Nonstarter Lactobacillus Strains as Adjunct Cultures for Cheese Making: In Vitro Characterization and Performance in Two Model Cheeses. J. Dairy Sci. 2007, 90, 4532–4542. [Google Scholar] [CrossRef] [Scilit] [PubMed]
- Gonzales-Barron, U.; Gonçalves-Tenório, A.; Rodrigues, V.; Cadavez, V. Foodborne Pathogens in Raw Milk and Cheese of Sheep and Goat Origin: A Meta-Analysis Approach. Curr. Opin. Food Sci. 2017, 18, 7–13. [Google Scholar] [CrossRef] [Scilit]
- Kim, D.-H.; Jeong, D.; Kim, H.; Kang, I.-B.; Chon, J.-W.; Song, K.-Y.; Seo, K.-H. Antimicrobial Activity of Kefir against Various Food Pathogens and Spoilage Bacteria. Korean J. Food Sci. Anim. Resour. 2016, 36, 787–790. [Google Scholar] [CrossRef] [Scilit] [PubMed]
- Trmčić, A.; Chauhan, K.; Kent, D.J.; Ralyea, R.D.; Martin, N.H.; Boor, K.J.; Wiedmann, M. Coliform Detection in Cheese Is Associated with Specific Cheese Characteristics, but No Association Was Found with Pathogen Detection. J. Dairy Sci. 2016, 99, 6105–6120. [Google Scholar] [CrossRef] [Scilit] [PubMed]
- Valero, A.; Pérez-Rodríguez, F.; Carrasco, E.; Fuentes-Alventosa, J.M.; García-Gimeno, R.M.; Zurera, G. Modelling the Growth Boundaries of Staphylococcus aureus: Effect of Temperature, pH and Water Activity. Int. J. Food Microbiol. 2009, 133, 186–194. [Google Scholar] [CrossRef] [Scilit] [PubMed]
- Medveďová, A.; Valík, Ľ.; Studeničová, A. The Effect of Temperature and Water Activity on the Growth of Staphylococcus aureus. Czech J. Food Sci. 2009, 27, SII28–SII35. [Google Scholar] [CrossRef] [Scilit]
- Gajewska, J.; Chajęcka-Wierzchowska, W.; Zadernowska, A. Occurrence and Characteristics of Staphylococcus aureus Strains along the Production Chain of Raw Milk Cheeses in Poland. Molecules 2022, 27, 6569. [Google Scholar] [CrossRef] [Scilit] [PubMed]
- Ulusoy, B.; Çolak, H.; Hampikyan, H.; Erkan, M.E. An in Vitro Study on the Antibacterial Effect of Kefir against Some Food-Borne Pathogens. Türk Mikrobiyoloji Cemiy. Derg. 2007, 37, 103–107. [Google Scholar]
- Santos, A.; San Mauro, M.; Sanchez, A.; Torres, J.M.; Marquina, D. The Antimicrobial Properties of Different Strains of Lactobacillus Spp. Isolated from Kefir. Syst. Appl. Microbiol. 2003, 26, 434–437. [Google Scholar] [CrossRef] [Scilit] [PubMed]
- Silva, K.R.; Rodrigues, S.A.; Filho, L.X.; Lima, A.S. Antimicrobial Activity of Broth Fermented with Kefir Grains. Appl. Biochem. Biotechnol. 2009, 152, 316–325. [Google Scholar] [CrossRef] [Scilit] [PubMed]
- Chifiriuc, M.C.; Cioaca, A.B.; Lazar, V. In Vitro Assay of the Antimicrobial Activity of Kephir against Bacterial and Fungal Strains. Anaerobe 2011, 17, 433–435. [Google Scholar] [CrossRef] [Scilit] [PubMed]
- Rola, J.G.; Czubkowska, A.; Korpysa-Dzirba, W.; Osek, J. Occurrence of Staphylococcus aureus on Farms with Small Scale Production of Raw Milk Cheeses in Poland. Toxins 2016, 8, 62. [Google Scholar] [CrossRef] [Scilit] [PubMed]
- Şanlıbaba, P. Prevalence, Antibiotic Resistance, and Enterotoxin Production of Staphylococcus aureus Isolated from Retail Raw Beef, Sheep, and Lamb Meat in Turkey. Int. J. Food Microbiol. 2022, 361, 109461. [Google Scholar] [CrossRef] [Scilit] [PubMed]
- Sakr, A.; Brégeon, F.; Mège, J.-L.; Rolain, J.-M.; Blin, O. Staphylococcus Aureus Nasal Colonization: An Update on Mechanisms, Epidemiology, Risk Factors, and Subsequent Infections. Front. Microbiol. 2018, 9, 2419. [Google Scholar] [CrossRef] [Scilit] [PubMed]
- Laux, C.; Peschel, A.; Krismer, B. Staphylococcus Aureus Colonization of the Human Nose and Interaction with Other Microbiome Members. Microbiol. Spectr. 2019, 7, 10-1128. [Google Scholar] [CrossRef] [Scilit] [PubMed]
- Hennekinne, J.-A.; De Buyser, M.-L.; Dragacci, S. Staphylococcus aureus and Its Food Poisoning Toxins: Characterization and Outbreak Investigation. FEMS Microbiol. Rev. 2012, 36, 815–836. [Google Scholar] [CrossRef] [Scilit] [PubMed]
- Tatini, S.R. Thermal Stability of Enterotoxins in Food. J. Food Prot. 1976, 39, 432–438. [Google Scholar] [CrossRef] [Scilit]
- Argudín, M.Á.; Mendoza, M.C.; Rodicio, M.R. Food Poisoning and Staphylococcus aureus Enterotoxins. Toxins 2010, 2, 1751–1773. [Google Scholar] [CrossRef] [Scilit] [PubMed]
- Bonilla-Luque, O.M.; Possas, A.; Cabo, M.L.; Rodríguez-López, P.; Valero, A. Tracking Microbial Quality, Safety and Environmental Contamination Sources in Artisanal Goat Cheesemaking Factories. Food Microbiol. 2023, 114, 104301. [Google Scholar] [CrossRef] [Scilit] [PubMed]
- Singh, V.P. Recent Approaches in Food Bio-Preservation—A Review. Open Vet. J. 2018, 8, 104–111. [Google Scholar] [CrossRef] [Scilit] [PubMed]
- Lamichhane, P.; Kelly, A.L.; Sheehan, J.J. Symposium Review: Structure-Function Relationships in Cheese. J. Dairy Sci. 2018, 101, 2692–2709. [Google Scholar] [CrossRef] [Scilit] [PubMed]
- Upreti, P.; Bühlmann, P.; Metzger, L.E. Influence of Calcium and Phosphorus, Lactose, and Salt-to-Moisture Ratio on Cheddar Cheese Quality: pH Buffering Properties of Cheese. J. Dairy Sci. 2006, 89, 938–950. [Google Scholar] [CrossRef] [Scilit] [PubMed]
- Koutsoumanis, K.; Allende, A.; Alvarez-Ordóñez, A.; Bolton, D.; Bover-Cid, S.; Chemaly, M.; Davies, R.; De Cesare, A.; Herman, L.; Nauta, M.; et al. Guidance on Date Marking and Related Food Information: Part 1 (Date Marking). EFSA J. 2020, 18, e06306. [Google Scholar] [CrossRef] [Scilit] [PubMed]
- Manolopoulou, E.; Sarantinopoulos, P.; Zoidou, E.; Aktypis, A.; Moschopoulou, E.; Kandarakis, I.G.; Anifantakis, E.M. Evolution of Microbial Populations during Traditional Feta Cheese Manufacture and Ripening. Int. J. Food Microbiol. 2003, 82, 153–161. [Google Scholar] [CrossRef] [Scilit] [PubMed]
- Delbes, C.; Alomar, J.; Chougui, N.; Martin, J.-F.; Montel, M.-C. Staphylococcus aureus Growth and Enterotoxin Production during the Manufacture of Uncooked, Semihard Cheese from Cows’ Raw Milk. J. Food Prot. 2006, 69, 2161–2167. [Google Scholar] [CrossRef] [Scilit] [PubMed]
- Pavli, F.G.; Argyri, A.A.; Papadopoulou, O.S. Probiotic Potential of Lactic Acid Bacteria from Traditional Fermented Dairy and Meat Products: Assessment by In Vitro Tests and Molecular Characterization. J. Probiotics Health 2016, 4, 1000157. [Google Scholar] [CrossRef]
- Makarijoski, B.; Najdovski, B. Monitoring of active and titratable acidity in white brined cheese during ripenning period. J. Agric. Plant Sci. 2024, 22, 39–43. [Google Scholar] [CrossRef] [Scilit]
- Yvon, M. Key Enzymes for Flavour Formation by Lactic Acid Bacteria. Aust. J. Dairy Technol. 2006, 61, 88–96. [Google Scholar]
- Korhonen, H.; Pihlanto, A. Bioactive Peptides: Production and Functionality. Int. Dairy J. 2006, 16, 945–960. [Google Scholar] [CrossRef] [Scilit]
- Mushtaq, M.; Gani, A.; Masoodi, F.A.; Ahmad, M. Himalayan Cheese (Kalari/Kradi)—Effect of Different Probiotic Strains on Oxidative Stability, Microbiological, Sensory and Nutraceutical Properties during Storage. LWT Food Sci. Technol. 2016, 67, 74–81. [Google Scholar] [CrossRef] [Scilit]
- Al-Nabulsi, A.A.; Osaili, T.M.; AbuNaser, R.A.; Olaimat, A.N.; Ayyash, M.; Al-Holy, M.A.; Kadora, K.M.; Holley, R.A. Factors Affecting the Viability of Staphylococcus aureus and Production of Enterotoxin during Processing and Storage of White-Brined Cheese. J. Dairy Sci. 2020, 103, 6869–6881. [Google Scholar] [CrossRef] [Scilit] [PubMed]
- Çetin, B.; Usal, M.; Aloğlu, H.Ş.; Busch, A.; Dertli, E.; Abdulmawjood, A. Characterization and Technological Functions of Different Lactic Acid Bacteria from Traditionally Produced Kırklareli White Brined Cheese during the Ripening Period. Folia Microbiol. 2024, 69, 1069–1081. [Google Scholar] [CrossRef] [Scilit] [PubMed]
- de Azambuja, N.C.; Moreno, I.; Gallina, D.A.; Spadoti, L.M.; Motta, E.M.P.; Pacheco, M.T.B.; de Queiroz, A.L.M.; Antunes, A.E.C. Effect of Adjunct Culture Lactobacillus helveticus (B02) on the Composition, Proteolysis, Free Amino Acids Release and Sensory Characteristics of Prato Cheese. Food Nutr. Sci. 2017, 8, 512–525. [Google Scholar] [CrossRef]
- Dimitrellou, D.; Kandylis, P.; Mallouchos, A.; Komaitis, M.; Koutinas, A.A.; Kourkoutas, Y. Effect of Freeze–Dried Kefir Culture on Proteolysis in Feta-Type and Whey-Cheeses. Food Chem. 2010, 119, 795–800. [Google Scholar] [CrossRef] [Scilit]
- Garbowska, M.; Berthold-Pluta, A.; Stasiak-Różańska, L.; Pluta, A. The Impact of the Adjunct Heat-Treated Starter Culture and Lb. Helveticus LH-B01 on the Proteolysis and ACE Inhibitory Activity in Dutch-Type Cheese Model during Ripening. Animals 2021, 11, 2699. [Google Scholar] [CrossRef] [Scilit] [PubMed]
- Coelho, M.C.; Malcata, F.X.; Silva, C.C.G. Lactic Acid Bacteria in Raw-Milk Cheeses: From Starter Cultures to Probiotic Functions. Foods 2022, 11, 2276. [Google Scholar] [CrossRef] [Scilit] [PubMed]
- Say, D. Physicochemical Composition, Nitrogen Fraction and Volatile Profiles of Goat Cheese Made with Artisanal Liquid Coagulant. J. Food Sci. Technol. 2022, 59, 2469–2478. [Google Scholar] [CrossRef] [Scilit] [PubMed]
- Kuczyńska, B.; Nałęcz-tarwacka, T.; Puppel, K.; Gołębiewski, M.; Grodzki, H.; Slósarz, J. The content of bioactive components in milk depending on cow feeding model in certified ecological farms. J. Res. Appl. Agric. Eng. 2011, 56, 7–13. [Google Scholar]
- Soyeurt, H.; Dardenne, P.; Gillon, A.; Croquet, C.; Vanderick, S.; Mayeres, P.; Bertozzi, C.; Gengler, N. Variation in Fatty Acid Contents of Milk and Milk Fat Within and Across Breeds. J. Dairy Sci. 2006, 89, 4858–4865. [Google Scholar] [CrossRef] [Scilit] [PubMed]
- Haug, A.; Høstmark, A.T.; Harstad, O.M. Bovine Milk in Human Nutrition—A Review. Lipids Health Dis. 2007, 6, 25. [Google Scholar] [CrossRef] [Scilit] [PubMed]
- Paszczyk, B.; Polak-Śliwińska, M.; Zielak-Steciwko, A.E. Chemical Composition, Fatty Acid Profile, and Lipid Quality Indices in Commercial Ripening of Cow Cheeses from Different Seasons. Animals 2022, 12, 198. [Google Scholar] [CrossRef] [Scilit] [PubMed]
- Filipczak-Fiutak, M.; Pluta-Kubica, A.; Domagała, J.; Duda, I.; Migdał, W. Nutritional Value and Organoleptic Assessment of Traditionally Smoked Cheeses Made from Goat, Sheep and Cow’s Milk. PLoS ONE 2021, 16, e0254431. [Google Scholar] [CrossRef] [Scilit] [PubMed]
- Pino, A.; Prados, F.; Galán, E.; McSweeney, P.L.H.; Fernández-Salguero, J. Proteolysis during the Ripening of Goats’ Milk Cheese Made with Plant Coagulant or Calf Rennet. Food Res. Int. 2009, 42, 324–330. [Google Scholar] [CrossRef] [Scilit]
- Smid, E.J.; Kleerebezem, M. Production of Aroma Compounds in Lactic Fermentations. Annu. Rev. Food Sci. Technol. 2014, 5, 313–326. [Google Scholar] [CrossRef] [Scilit] [PubMed]
- Jurášková, D.; Ribeiro, S.C.; Silva, C.C.G. Exopolysaccharides Produced by Lactic Acid Bacteria: From Biosynthesis to Health-Promoting Properties. Foods 2022, 11, 156. [Google Scholar] [CrossRef] [Scilit] [PubMed]
- Proteolysis in Cheese During Ripening—ScienceDirect. Available online: https://www.sciencedirect.com/science/chapter/bookseries/abs/pii/S1874558X04800769 (accessed on 15 January 2026).
- Tabla, R.; Gómez, A.; Rebollo, J.E.; Molina, F.; Roa, I. Effectiveness of a Bacteriophage Cocktail in Reducing Cheese Early Blowing Caused by Escherichia coli. LWT 2022, 153, 112430. [Google Scholar] [CrossRef] [Scilit]
- Bergamini, C.V.; Hynes, E.R.; Quiberoni, A.; Suárez, V.B.; Zalazar, C.A. Probiotic Bacteria as Adjunct Starters: Influence of the Addition Methodology on Their Survival in a Semi-Hard Argentinean Cheese. Food Res. Int. 2005, 38, 597–604. [Google Scholar] [CrossRef] [Scilit]
- Tudor Kalit, M.; Petrović, D.; Kalit, S.; Rako, Z.; Rako, A. Effect of Composition and Proteolysis on Textural Characteristics of Croatian Cheese Ripen in a Lamb Skin Sack (Sir Iz Mišine). Mljekarstvo 2019, 69, 21–29. [Google Scholar] [CrossRef] [Scilit]
- Moreira, R.V.; Costa, M.P.; Frasao, B.S.; Sobral, V.S.; Cabral, C.C.; Rodrigues, B.L.; Mano, S.B.; Conte-Junior, C.A. Effect of Ripening Time on Bacteriological and Physicochemical Goat Milk Cheese Characteristics. Food Sci. Biotechnol. 2019, 29, 459–467. [Google Scholar] [CrossRef] [Scilit] [PubMed]
- Terpou, A.; Gialleli, A.-I.; Bosnea, L.; Kanellaki, M.; Koutinas, A.A.; Castro, G.R. Novel Cheese Production by Incorporation of Sea Buckthorn Berries (Hippophae rhamnoides L.) Supported Probiotic Cells. LWT Food Sci. Technol. 2017, 79, 616–624. [Google Scholar] [CrossRef] [Scilit]
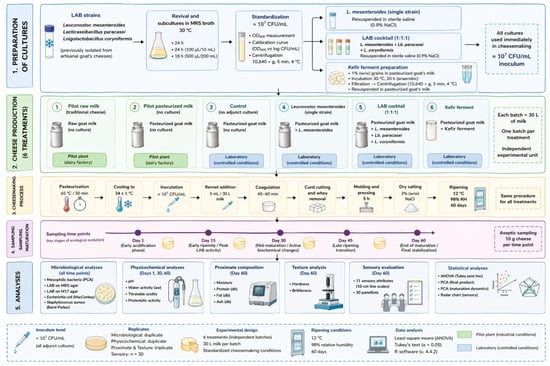
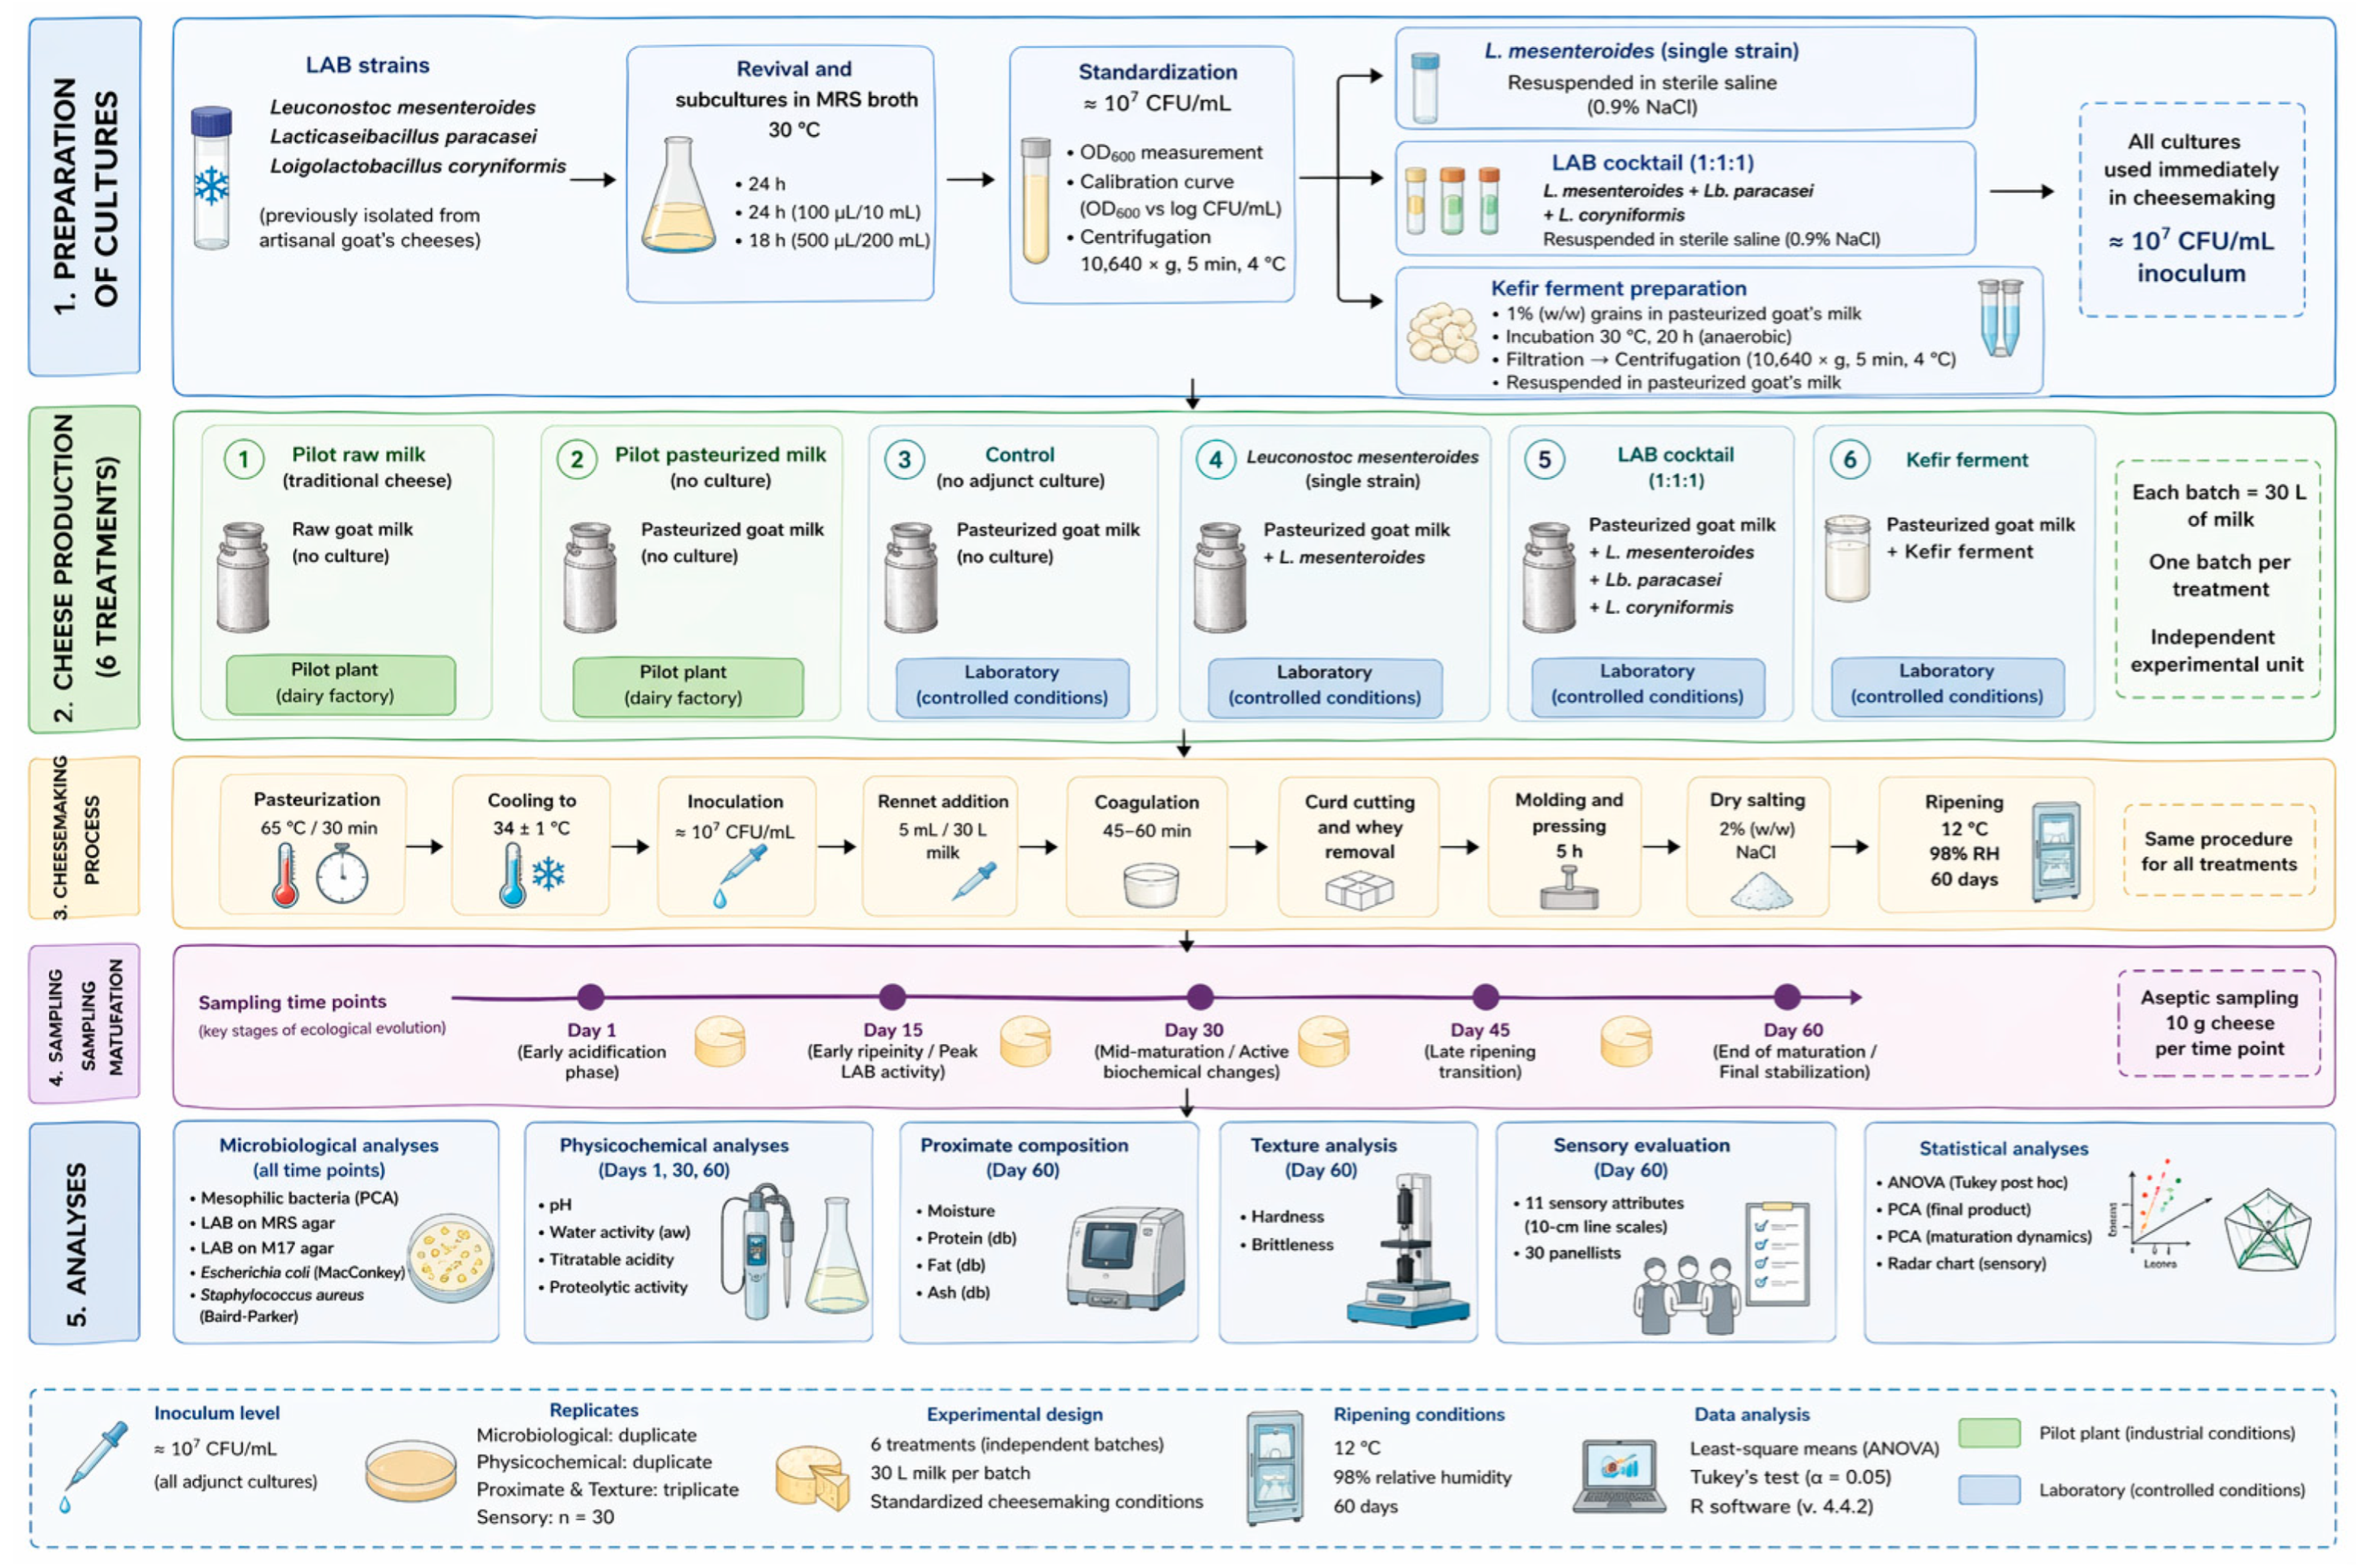
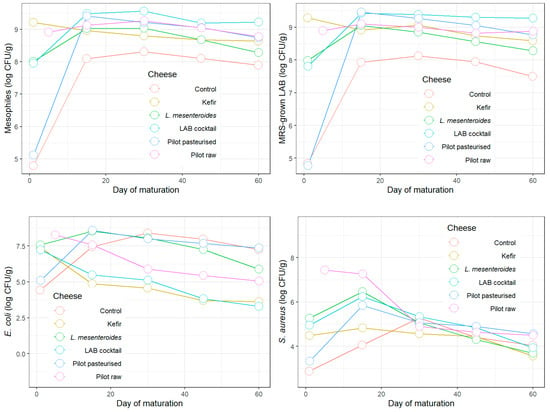
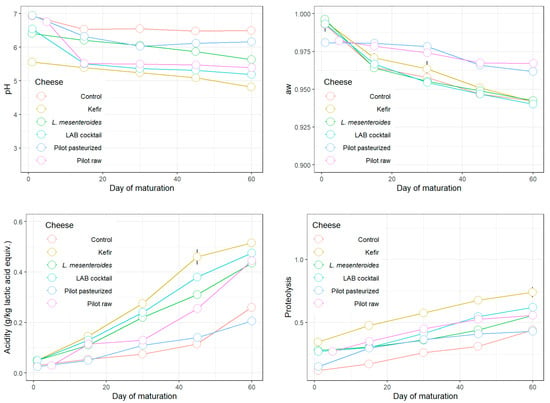
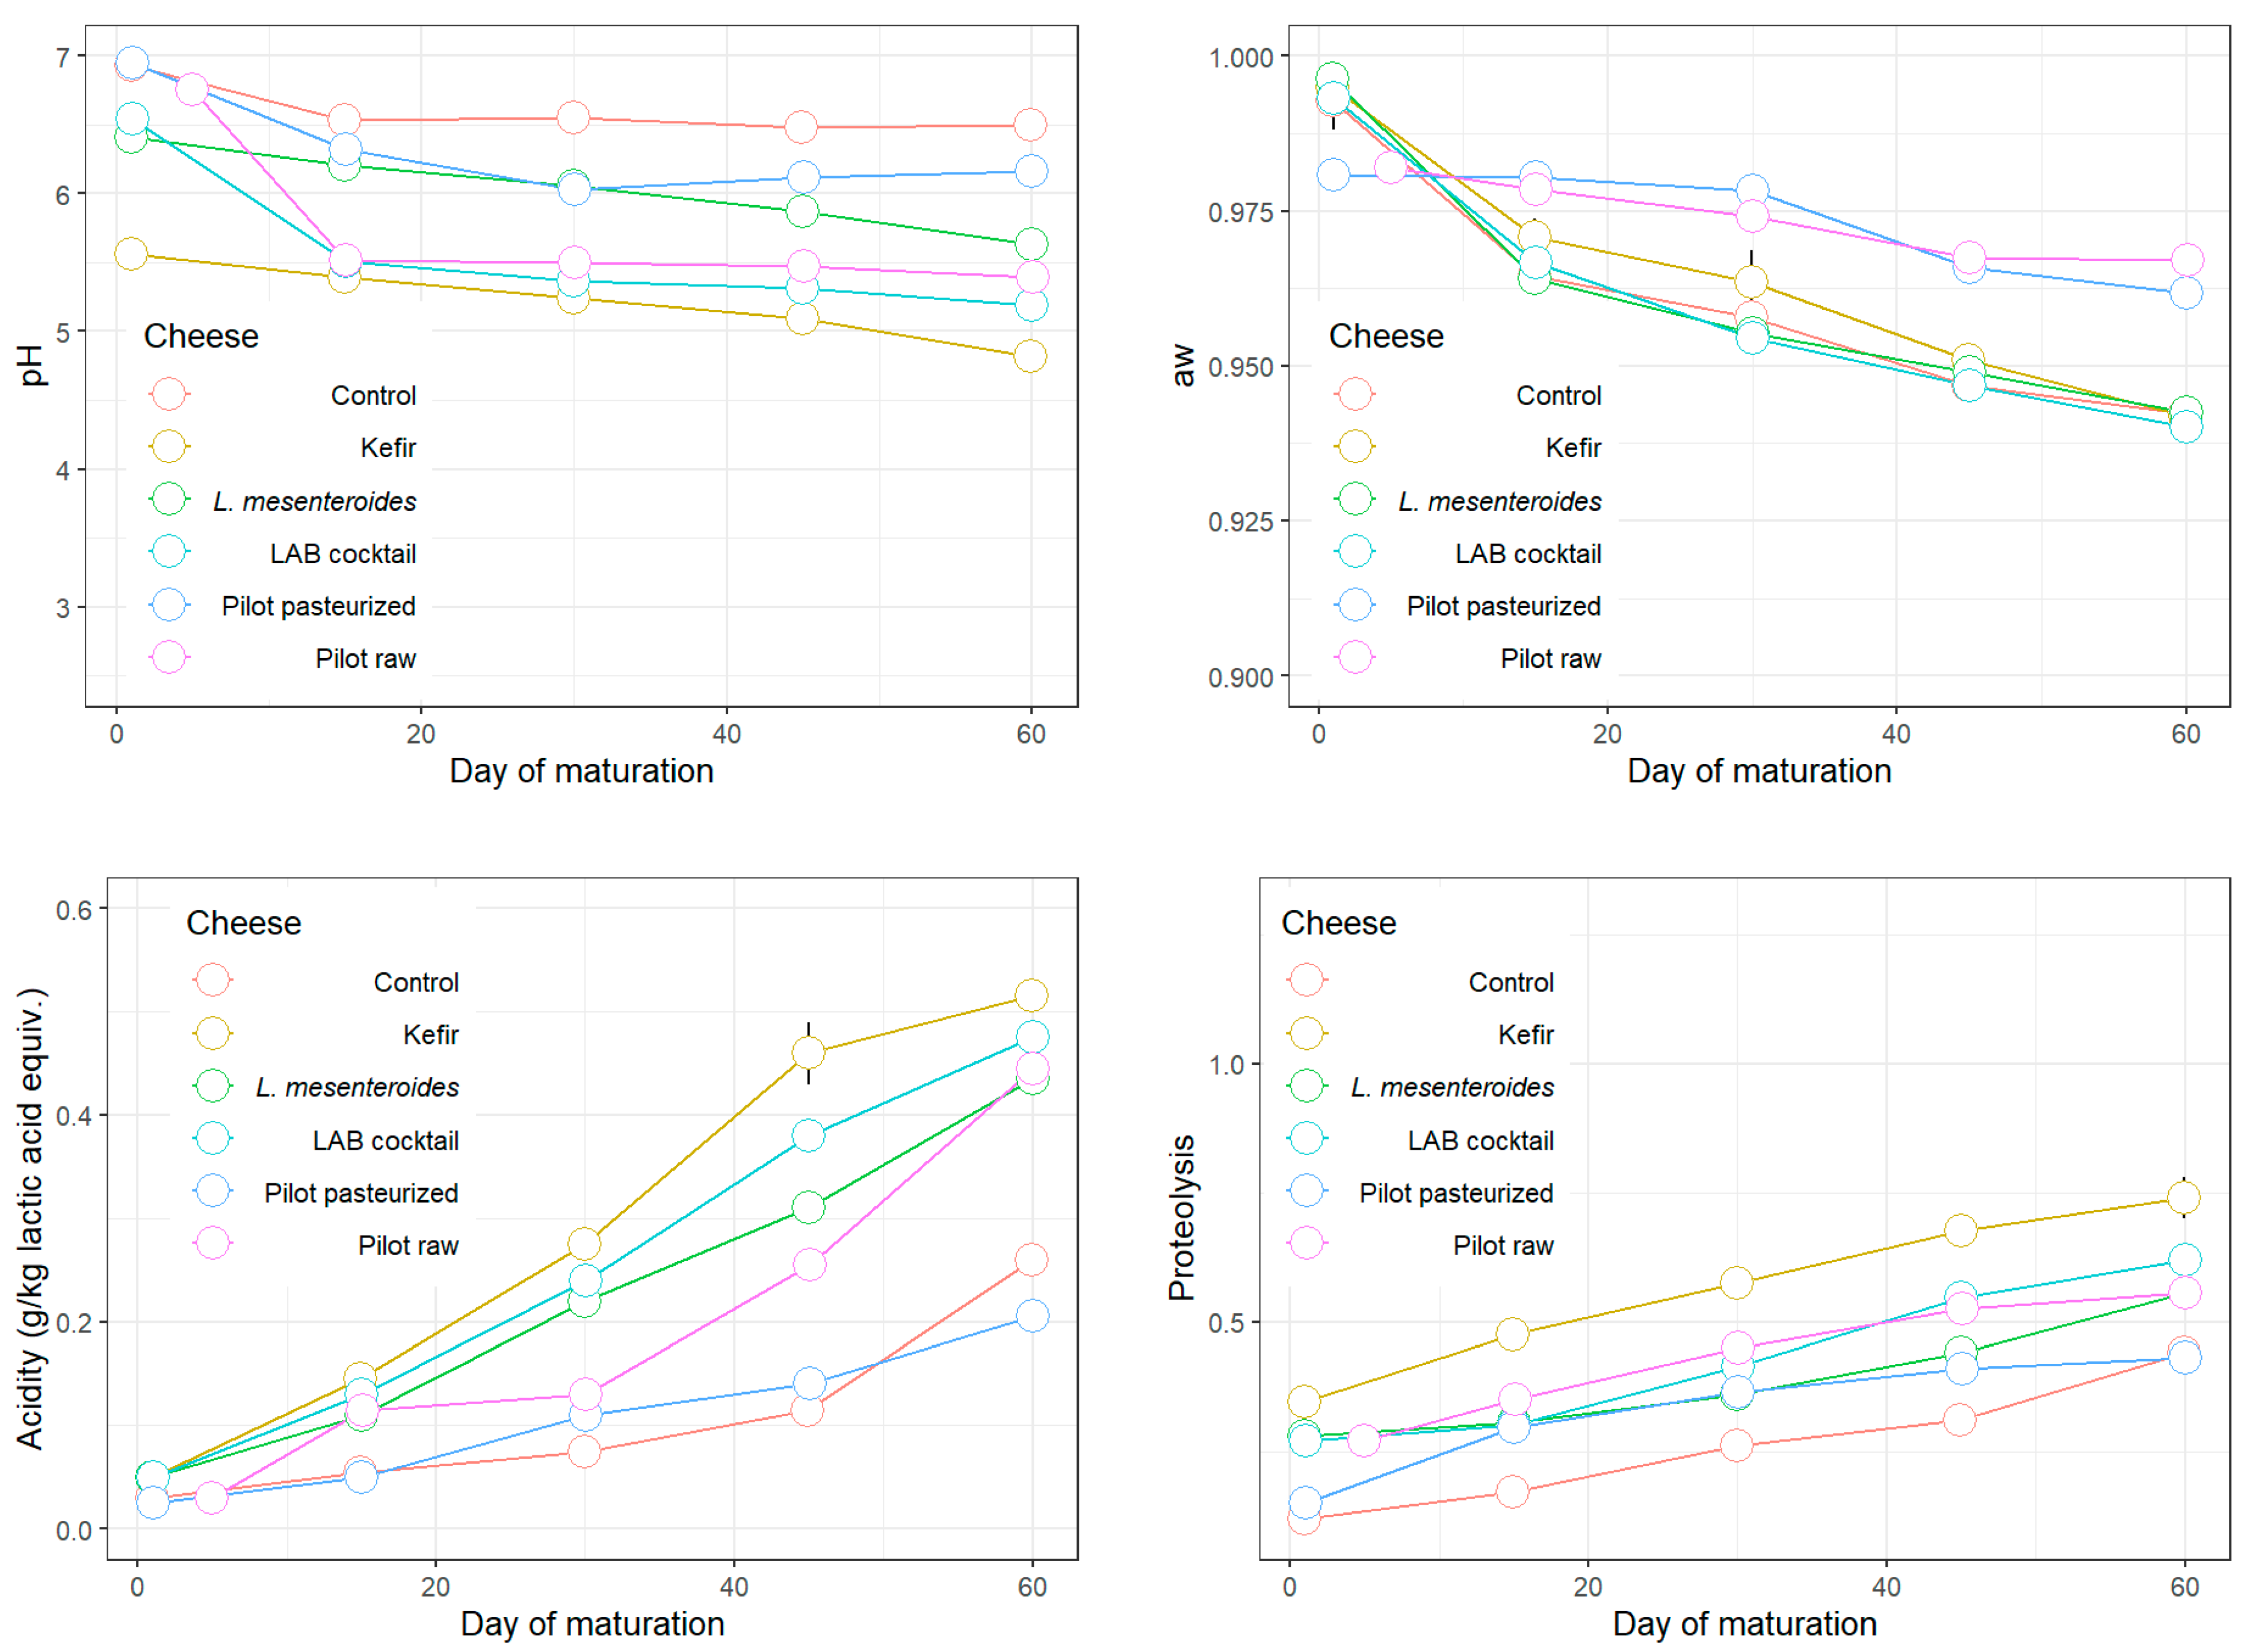
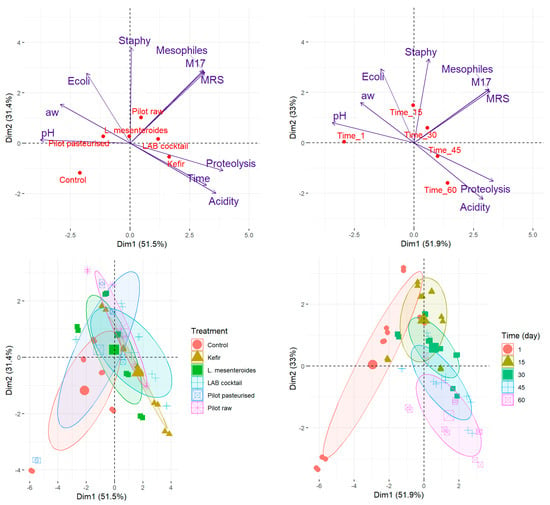
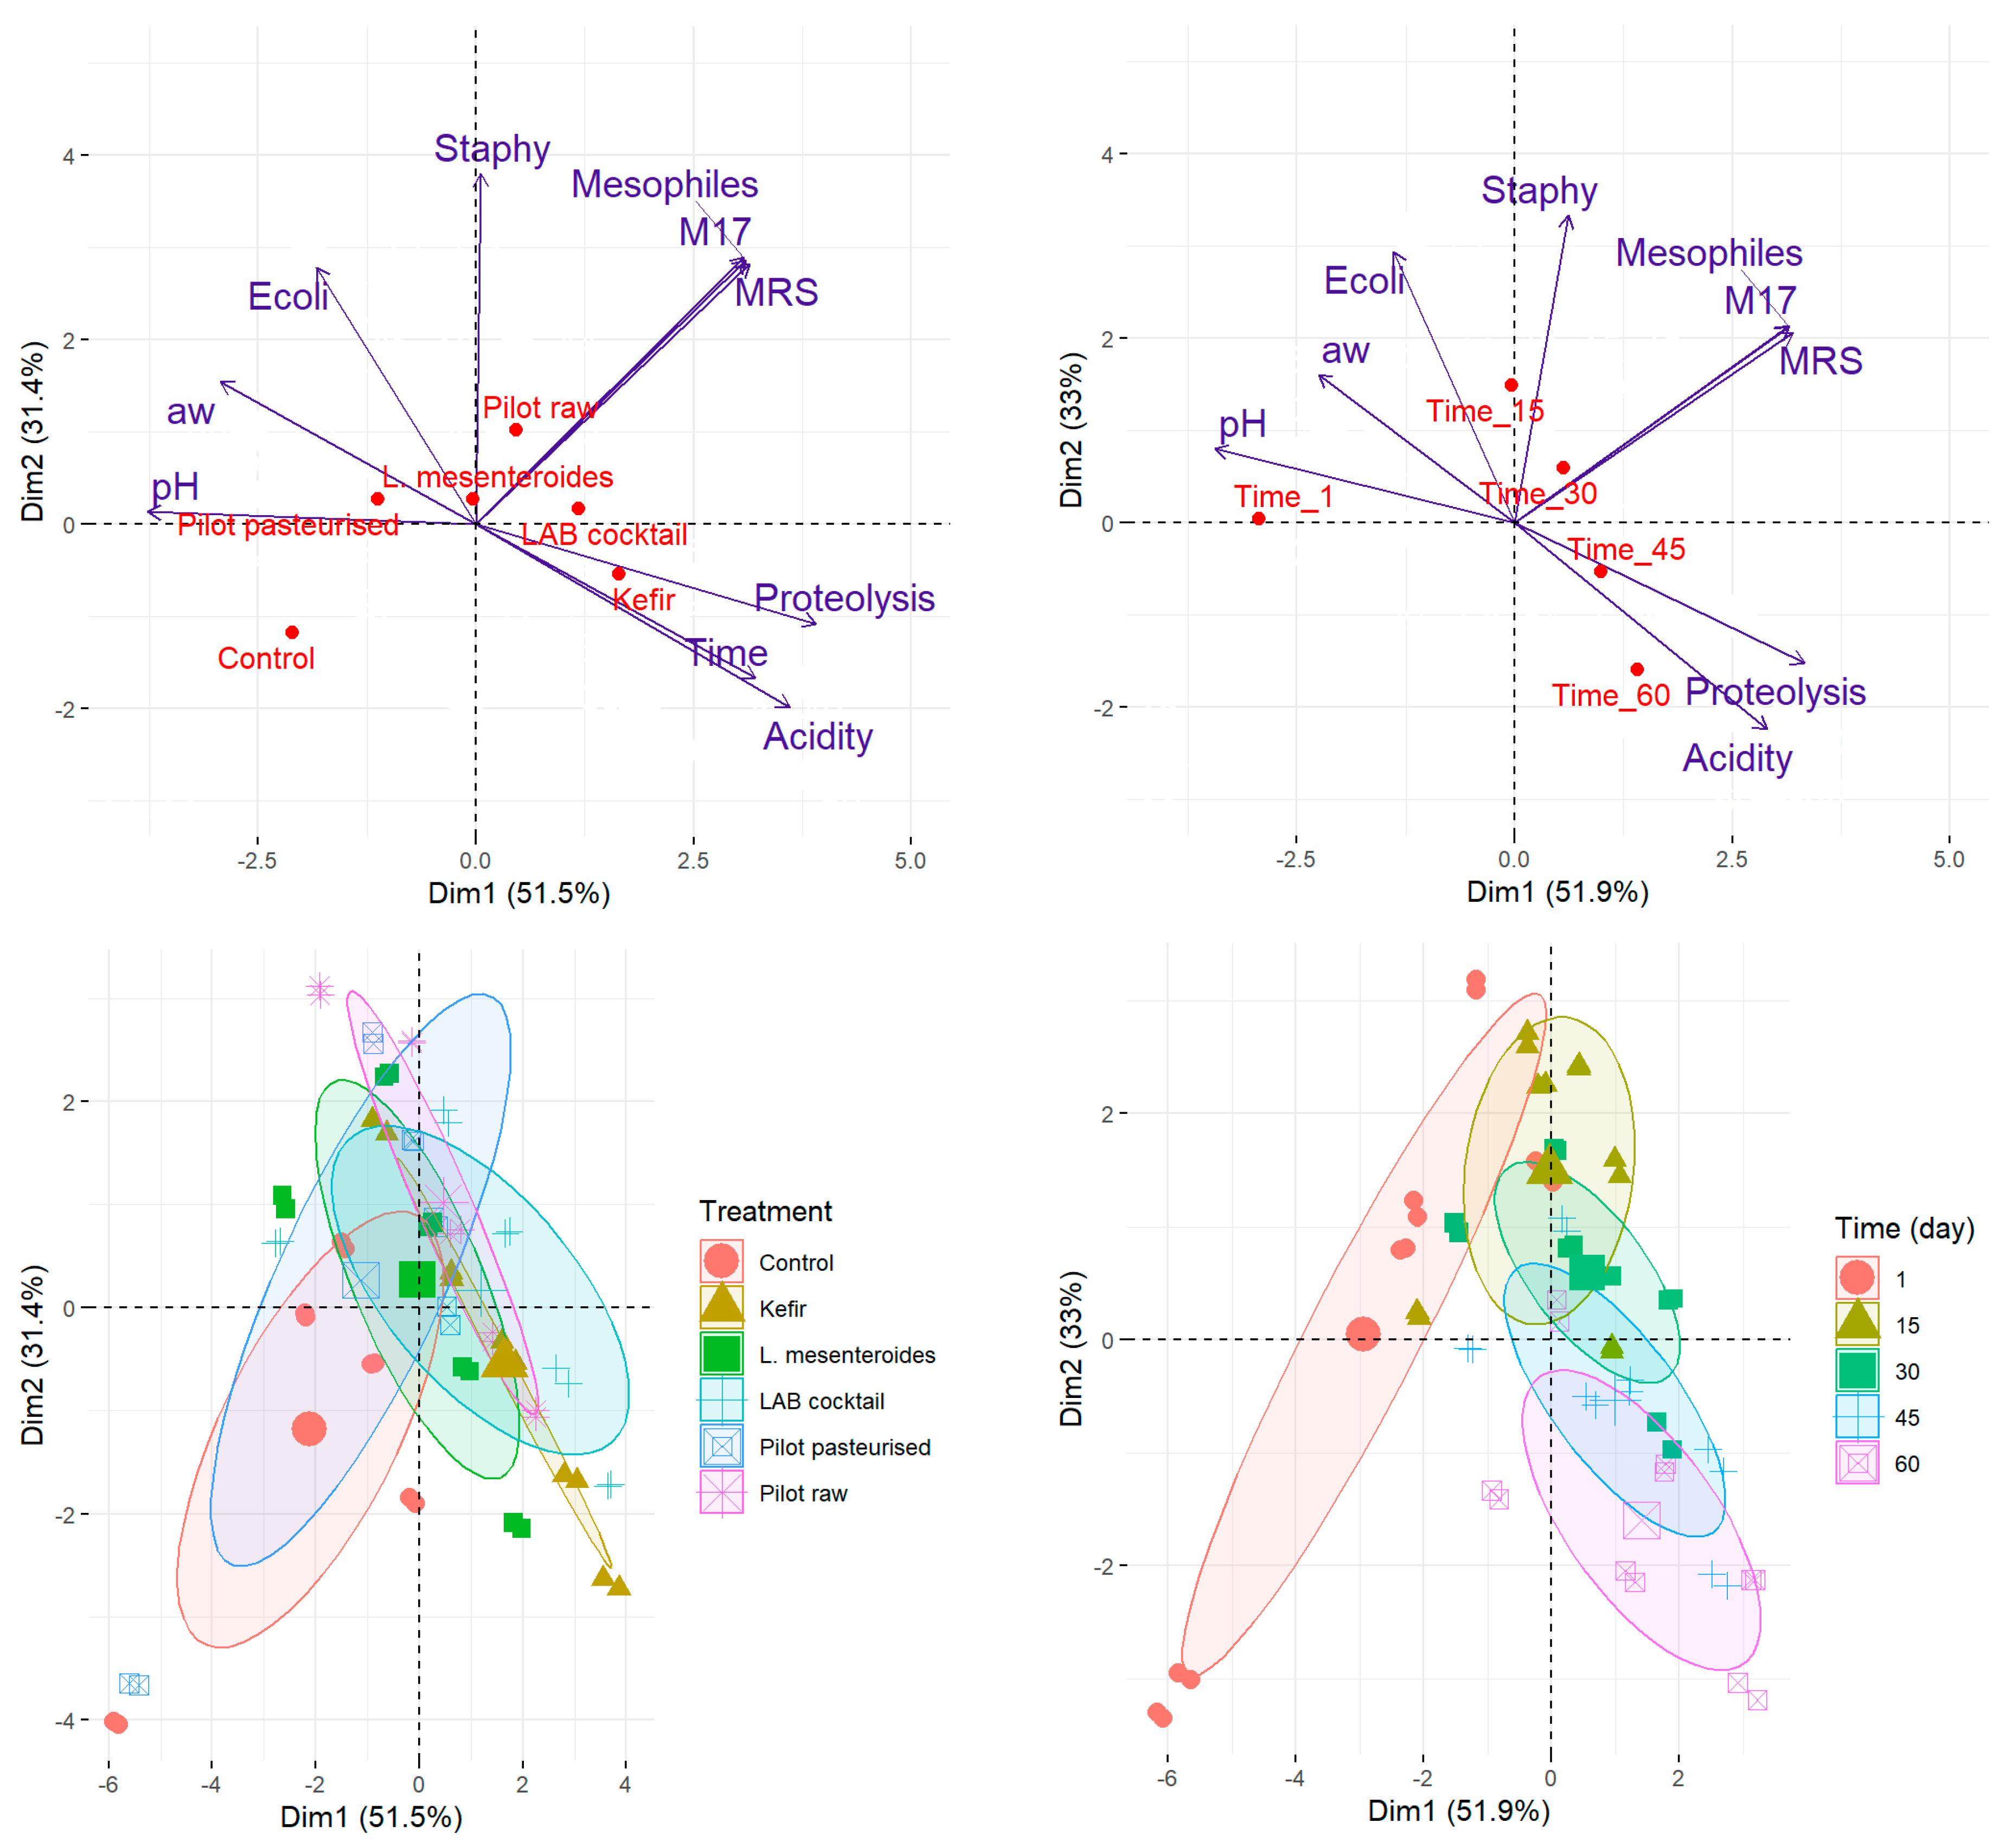
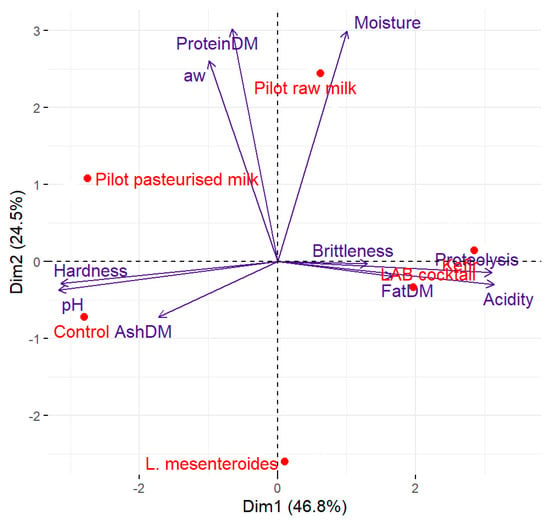
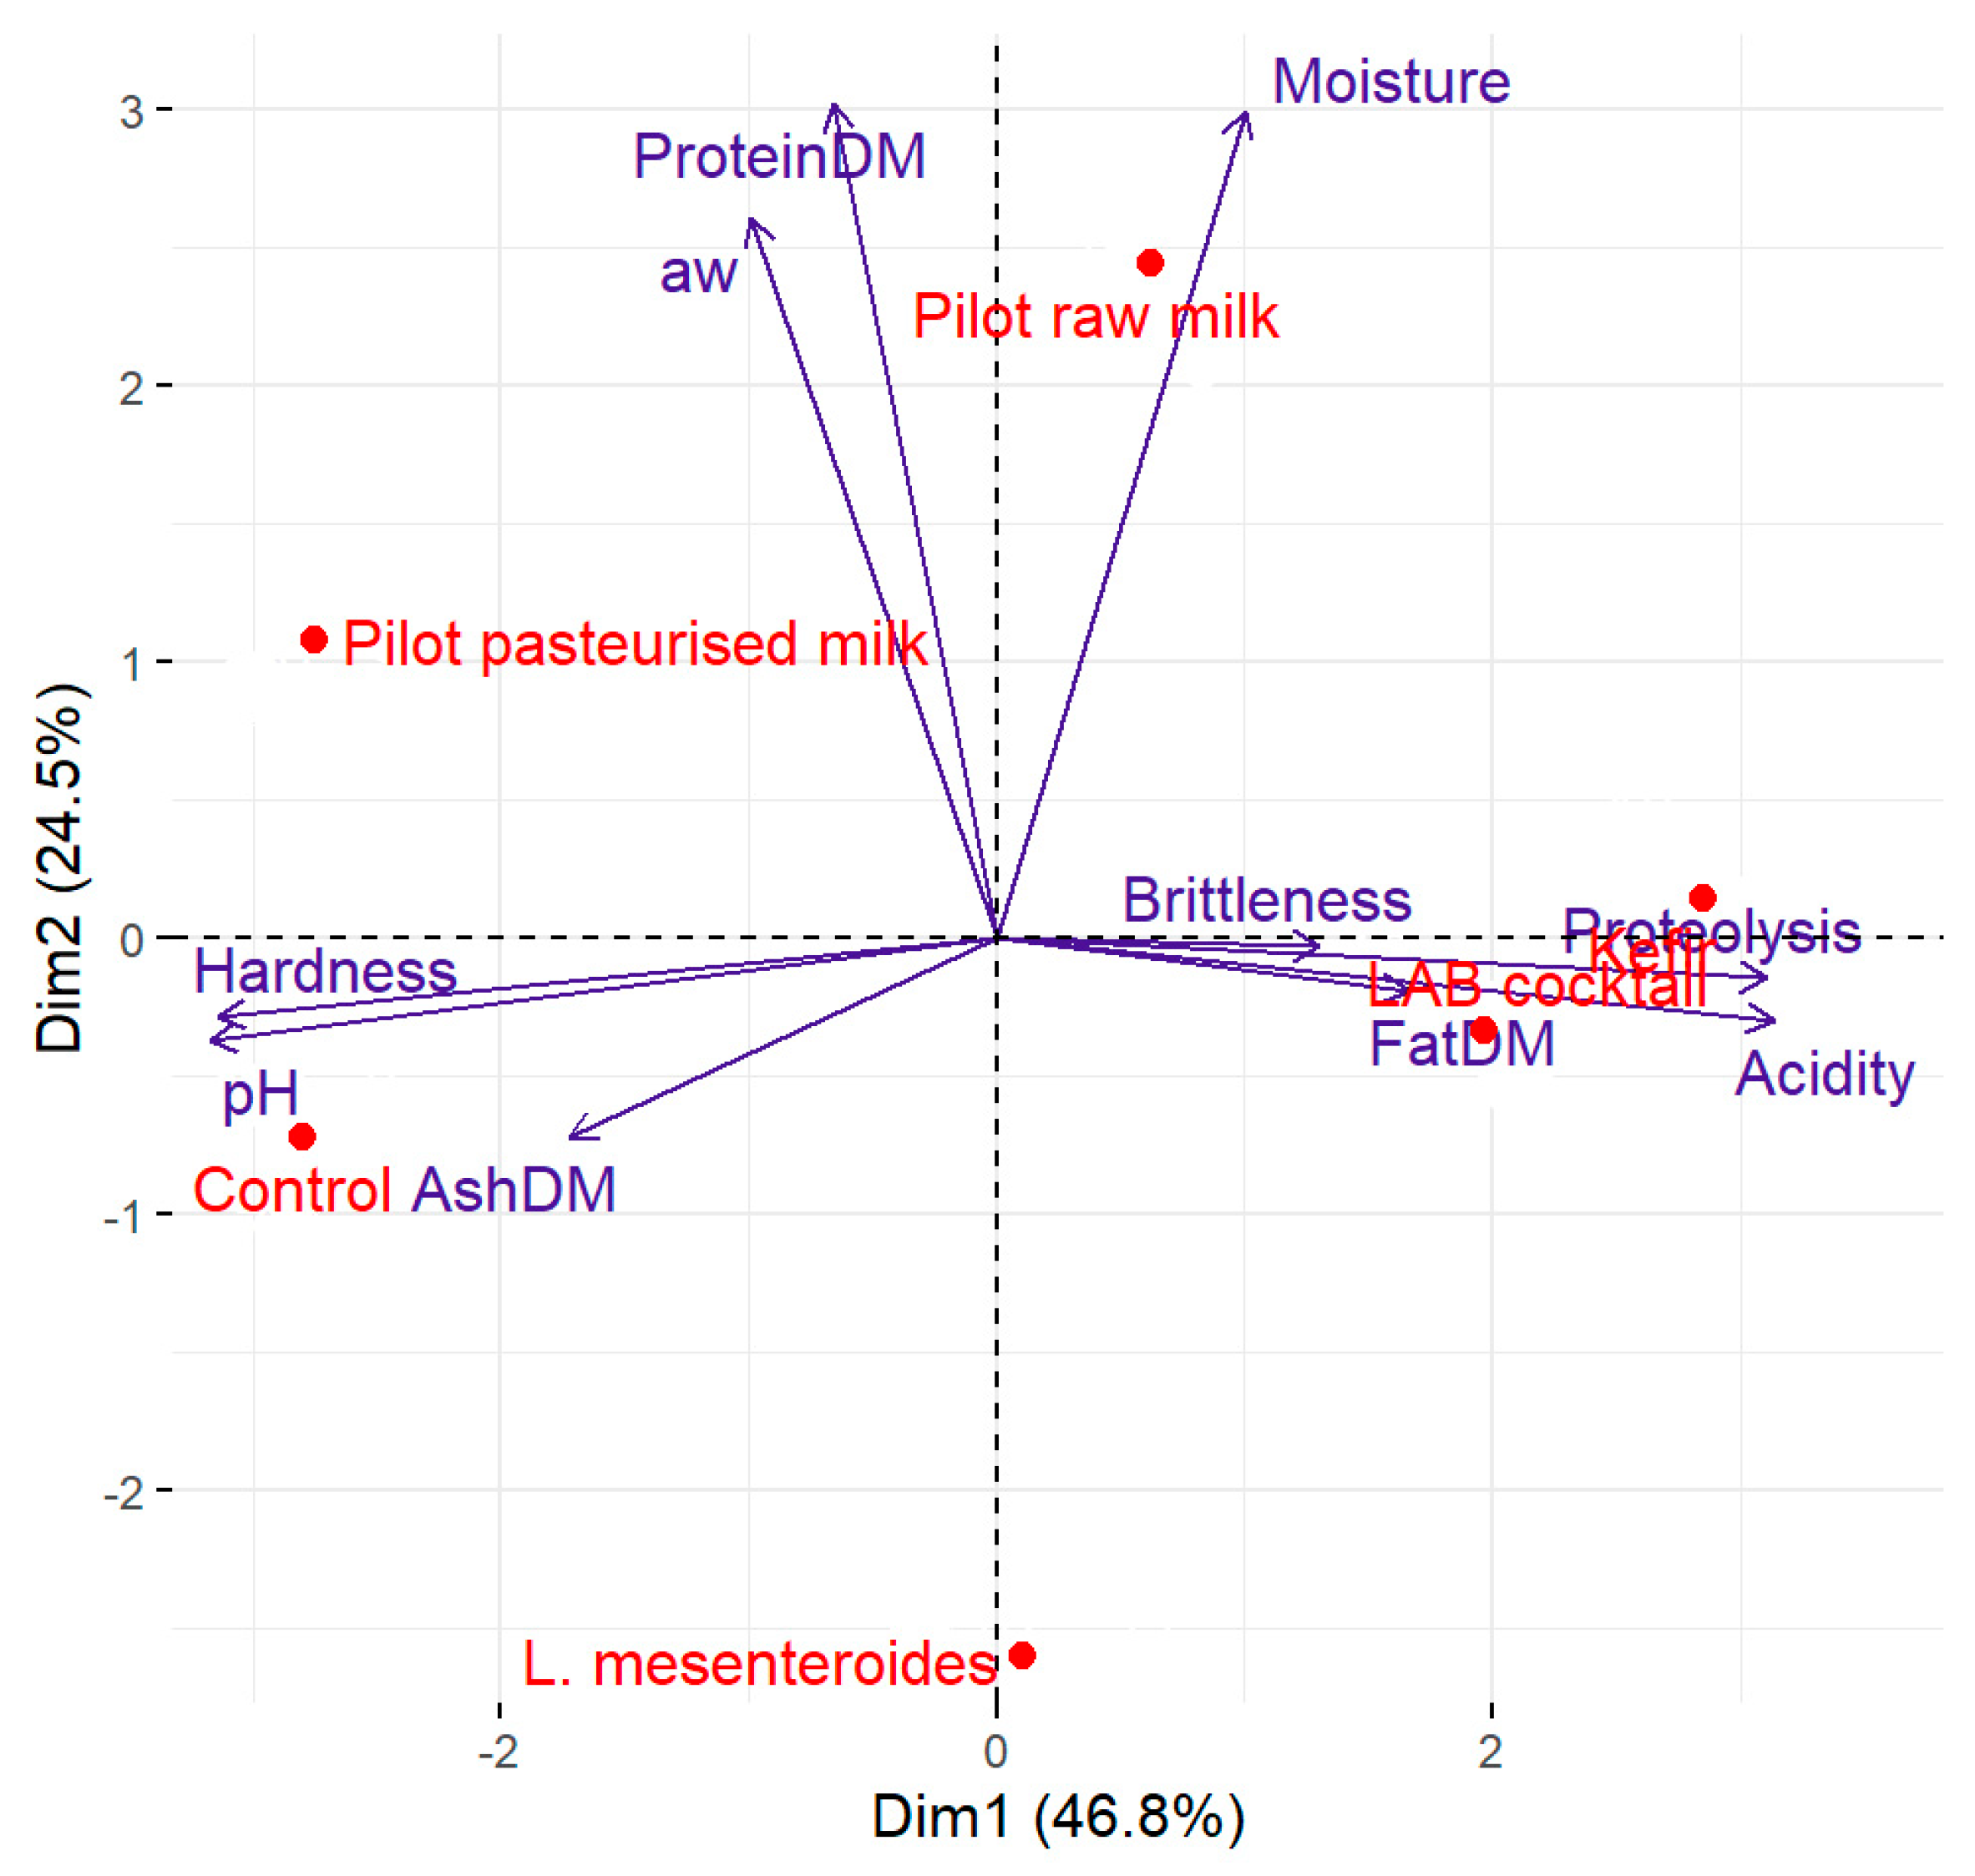
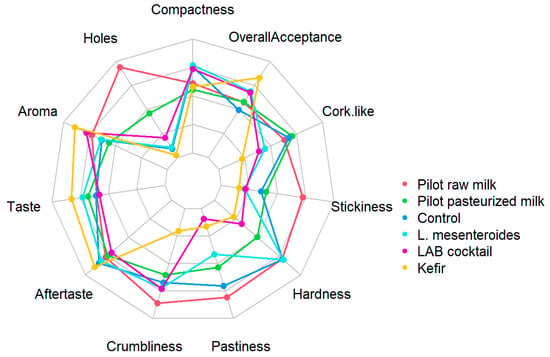
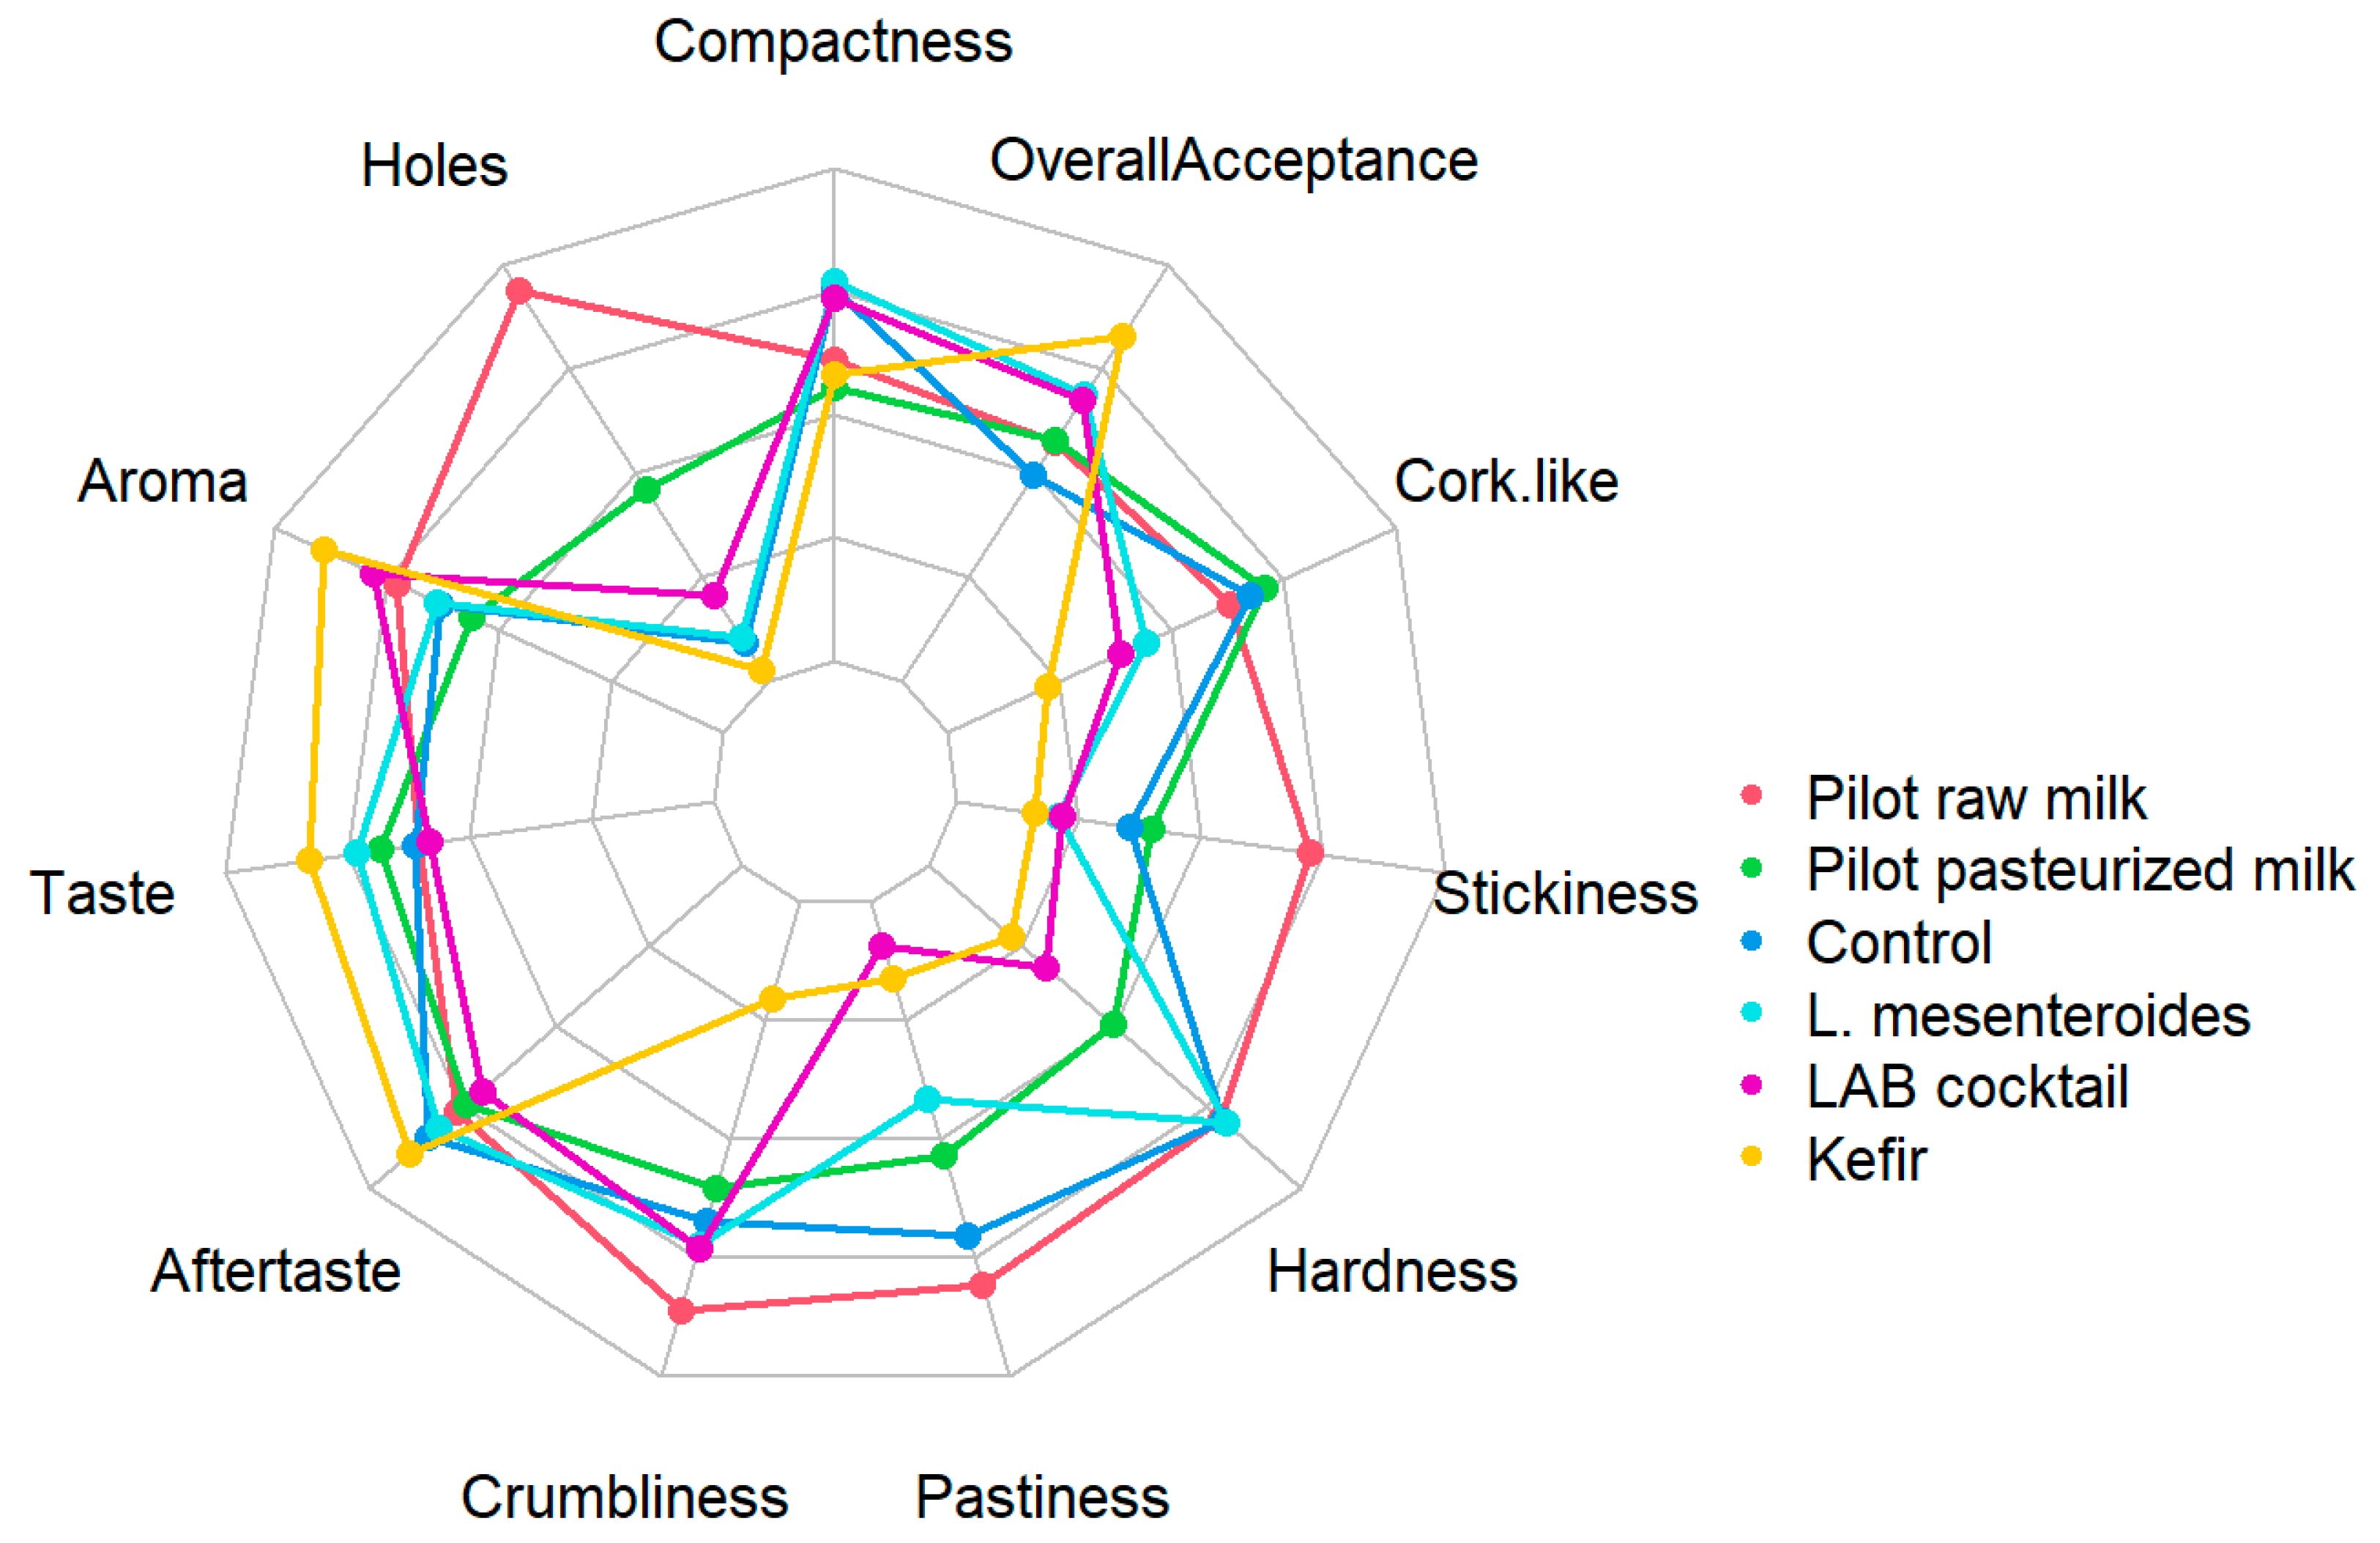

Disclaimer/Publisher’s Note: The statements, opinions and data contained in all publications are solely those of the individual author(s) and contributor(s) and not of MDPI and/or the editor(s). MDPI and/or the editor(s) disclaim responsibility for any injury to people or property resulting from any ideas, methods, instructions or products referred to in the content. |
© 2026 by the authors. Licensee MDPI, Basel, Switzerland. This article is an open access article distributed under the terms and conditions of the Creative Commons Attribution (CC BY) license.