Article

Culture-Independent Quantification of Legionella pneumophila in Evaporative Cooling Systems Using Immunomagnetic Separation Coupled with Flow Cytometry

by
Philipp Streich
1,
Johannes Redwitz
2,
Sandra Walser-Reichenbach
2,
Caroline E. W. Herr
2,3,
Martin Elsner
1 and
Michael Seidel
1,*
1
Chair of Analytical Chemistry and Water Chemistry, TUM School of Natural Sciences, Technical Universtity of Munich, Lichtenbergstraße 4, 85748 Garching, Germany
2
Department of Occupational and Environmental Health, Epidemiology, Bavarian Health and Food Safety Authority, Pfarrstraße 3, 80538 Munich, Germany
3
Institute and Clinic for Occupational, Social and Environmental Medicine, University Hospital, LMU Munich, Pettenkoferstraße 8a, 80336 Munich, Germany
*
Author to whom correspondence should be addressed.
Appl. Microbiol. 2024, 4(1), 284-296; https://doi.org/10.3390/applmicrobiol4010019
Submission received: 18 December 2023 / Revised: 22 January 2024 / Accepted: 24 January 2024 / Published: 27 January 2024

Abstract

:
Legionella pneumophila are pathogenic bacteria that repeatedly occur in high concentrations in the process water of evaporative cooling systems (ECS). When released into the environment, the resulting bioaerosols can cause outbreaks with fatal consequences. The official, internationally accepted detection method for Legionella spp. in water samples is based on cultivation. However, cultivation is time-consuming and may underestimate the total count of viable L. pneumophila in ECS. Therefore, culture-independent methods are receiving attention for rapid monitoring. Cartridge-based immunomagnetic separation (IMS) coupled with flow cytometry (FCM) is an innovative, antibody-based method for the culture-independent quantification of L. pneumophila, using a panel of antibodies against serogroup (Sg) 1–15. We characterized the IMS-FCM method as a quantitative rapid test by general analytical procedures. Viable cryopreserved L. pneumophila standards were used in calibration experiments for the method. We achieved detection limits for Sg 1, Sg 4, and Sg 6 of 100, 105 and 88 viable cells per 100 mL, respectively. Furthermore, we demonstrated the practical applicability of IMS-FCM with real ECS samples and compared the performance against cultivation. Cultivation showed here no positive results, but IMS-FCM evidenced L. pneumophila in a range of 0–80,000 viable cells per 100 mL. This work demonstrates that IMS-FCM is a suitable, culture-independent, quantitative method for rapidly monitoring L. pneumophila.

1. Introduction

Legionella spp. are waterborne pathogens that can naturally be found in soil and ubiquitously in water. They consist of more than 50 species and at least 79 serogroups (Sg) [1]. The inhalation of aerosols containing Legionella spp., can lead to the infection of pulmonary cells and severe pneumonia, also called Legionnaire’s disease, with a fatality rate of 10 to 15% [2,3]. Evaporative cooling systems (ECS) have been paramount as prime sources of outbreaks because they can emit Legionella-containing bioaerosols, which may be transported over several kilometers [4]. Since 2017, the 42nd Federal Immission Control Act (42. BImSchV) has made regular screening obligatory in Germany, defining an action value of Legionella spp. as 10,000 colony-forming units (CFU) per 100 mL in ECS, and outlines cultivation as the only accepted detection method. In general, cultivation is an internationally established and applied confirmation method for quantifying Legionella spp. in water samples [5]. However, this detection method comes with significant disadvantages: most notably, the long assay time of up to 10 days, but also the underestimation of Legionella spp. counts, low reproducibility, and a significant false negative rate [6]. Accompanying flora can overgrow the colonies of interest such that quantification becomes more difficult or impossible. Due to environmental stress factors such as starving conditions, competition with other bacteria or chemical disinfection, Legionella cells can enter the viable but non-culturable (VBNC) state, making them inaccessible with culture-dependent methods, which is another major drawback [7,8,9,10]. Under certain conditions, the VBNC of Legionella can regain virulence and infectiousness [11]. In future, the combination of culture-independent with selective detection will be more promising, and so those methods are receiving increased interest. They have the advantage of directly detecting viable Legionella spp. and the pathogen L. pneumophila within several hours via specific membrane molecules, gene sequences, or cell membrane-associated components [12,13,14]. All methods require a filtration step to concentrate bacteria before measuring, and can be classified into molecular biological and antibody-based assays.
Flow cytometry (FCM) is an optical detection method for counting bacteria and other cells in different liquid matrices [15,16]. For the quantification of bacteria in water, the basic approach is as follows: suspended bacteria are aligned and separated by hydrodynamic focusing and passed individually through a laser beam, whose light is scattered and absorbed by fluorophores used to stain the bacteria of interest [17]. Therefore, DNA intercalating dyes like SYBR Green or SYTO9 are used to penetrate the cell membranes and stain the cells, which can emit green fluorescence [18]. Regardless of the cell’s viability, the green fluorescent dye stains all bacteria inside the sample. The red fluorescent dye propidium iodide (PI) can only penetrate cells with damaged membranes. Hence, when combining green and red fluorescence dyes, dead cells are more strongly detected in the red fluorescence channel of the FCM [19], such that viable cells without PI staining can be distinguished from membrane-damaged cells. With the simultaneous use of green and red fluorescence dyes, the concentration of viable bacteria inside water samples can be determined. FCM is commonly used to investigate ground, tap, mineral, and drinking water, and can also be applied for the frequent screening of disinfection efficiencies [20,21]. In terms of real ECS samples, the FCM performance is limited by suspended or dissolved substances and particles, which poses challenges and problems to optical detection and light absorption [16]. The cells of interest, like L. pneumophila, need to be extracted efficiently from the matrix and accompanying flora to increase sensitivity and selectivity. Iron oxide nanostructures offer possible technological utilization, particularly in biomedical and environmental applications, based on their excellent super-magnetic behavior [22]. Therefore, immunomagnetic separation (IMS) is a promising solution that can easily be combined with different detection methods [23]. IMS uses the interaction of cell surface antigens and antibodies attached to magnetic beads, and cells can be extracted by placing the bead cell suspension into a magnetic field [24]. The combination of IMS and FCM was used in earlier studies to quantify L. pneumophila Sg 1 in tap water [25,26] and bioaerosols [27]. Based on these results, the analytical system rqmicro.COUNT has been further developed so that IMS and FCM can be implemented automatically and simultaneously in one device (Figure 1) using a specific panel of antibodies against L. pneumophila Sg 1–15 for the selective detection of viable cells. A further significant advantage of other commercial FCM approaches is the use of microfluidic cartridges, meaning that (i) the extensive maintenance and regular washing of the fluidic system becomes unnecessary, and (ii) cross-contaminations and unwanted carry-over from previous measurements are avoided
Here, we evaluated the entire IMS-FCM method, including membrane filtration, in for applicability in the quantitative screening of real ECS. Cryopreserved bacteria standards with defined viable cell concentrations were used to characterize the analytical suitability and performance. We determined the statistically sound parameters, including limit of detection (LoD), limit of quantification (LoQ), precision, resilience, and specificity, and further evaluated the performance in real-world situations. We applied the IMS-FCM method successfully to monitor L. pneumophila Sg 1–15 concentrations in ECS, and the results have been compared to those of traditional cultivation. Via this scientific study, we want to promote acceptance and demonstrate that culture-independent methods, based on the ability to detect viable L. pneumophila, can meet the criteria of quantitative rapid tests. In general, providers of ECS have the option to implement various measures to reduce L. pneumophila concentrations, such as biocide addition, sloughing, or freshwater infusion. In contrast to cultivation, laboratories with special expertise can additionally establish culture-independent methods for rapid quantification, allowing them to provide rapid information about the L. pneumophila concentration levels, control the efficiency of disinfection measures, ensure hygienic control, and record microbiological growth progresses. This enables the providers to respond promptly to changes, and facilitates a reduction in the operational duration.

2. Materials and Methods

2.1. Chemicals and Materials

Unless stated otherwise, all standard chemicals and reagents were purchased from Sigma Aldrich (Taufkirchen, Germany). Ultrapure water was generated using the Milli-Q direct ultrapure water system with a 0.22 µm membrane filter Millipak express 40 set up, provided by Merck (Darmstadt, Germany). Evian water was purchased in 1.5 L plastic bottles from the local supermarket. rqmicro (Schlieren, Switzerland) provided the L.p. Sg 1–15 detect kit containing two different kinds of polycarbonate filters with a pore size of 5.0 µm and 0.22 µm, Buffer 1, Buffer 2, a panel of antibody-linked magnetic particles against Sg 1–15, the Sg 1–15 staining dye, and cartridges. Furthermore, the TCC kit staining dye, black TCC cartridges, and staining antibody solutions for L. pneumophila Sg 1, Sg 4 and Sg 6 were also obtained from rqmicro. GVPC + Ab, BCYE and BCYE without L-cysteine agar plates were purchased from Xebios Diagnostics GmbH (Düsseldorf, Germany). The microbial performance of the agar plates met the requirements of ISO 11133 [28]. To avoid contamination, all buffers and media were sterile-filtered using the reusable bottle-top NalgeneTM system from ThermoFisher Scientific (Waltham, MA, USA). Then, 10× PBS buffer was prepared by dissolving 244 g K2HPO4 (≥99.5%), 27.7 g KH2PO4 (≥99.5%) and 170 g NaCl (≥99.5%) in 2.0 L ultrapure water. Lower concentrations of the buffer were accomplished by diluting. A cryopreservation buffer was made by stirring 10 g bovine serum albumin (96%) and 60 g dextran 40 from Carl Roth (Karlsruhe, Germany) in 0.5 L 2× PBS buffer, and the cryopreservation buffer was stored at 4 °C. Liquid BYE growth medium was prepared by adding 5.0 g bacto-yeast extract from ThermoFisher Scientific (Waltham, MA, USA) and one vial of 9.0 mL Legionella BCY growth supplement form VWR Chemicals (Radnor, PA, USA) in 0.5 L ultrapure water, and the medium was stored in 50 mL aliquots at 4 °C until needed. Furthermore, the Sg 1, Sg 4 and Sg 6 cryopreserved L. pneumophila standards were obtained from rqmicro and subjected to the following preparation protocol.

2.2. Preparation of Conditioned Cryopreserved Legionella Standards

In this study, we employed the protocol of rqmicro to produce cryopreserved bacteria standards. L. pneumophila strains, belonging to Sg 1 (DSM7516), Sg 4 (DSM7514), and Sg 6 (DSM25182), were grown on GVPC + Ab agar plates, which were incubated for 4 d at a temperature of 37 °C. Afterwards, 5.0 mL of the liquid BYE growth medium was inoculated with three colonies from one GVPC + Ab plate and incubated with shaking at 37 °C for 18 h. Quality control was performed to obtain the total cell count (TCC), total Legionella count (TLC) and viable Legionella count (ILC). A series of 10-fold dilutions was prepared in sterile 1× PBS buffer. For the TCC measurement, 200 µL of a 10−4 dilution was added into 1800 µL 1× PBS and 20 µL TCC staining dye. The TLC measurement was performed using 200 µL of a 10−4 dilution and 1800 µL Buffer 1, and depending on the Sg, 20 µL of the corresponding L. pneumophila Sg 1, 4 or 6 staining antibody solutions was used. For the ILC measurement, the same procedure was repeated using Buffer 2 instead of Buffer 1. All tubes were incubated for one hour in the dark. Samples were added into the black TCC cartridge and inserted into the rqmicro.COUNT device to perform the measurements. The quality control was considered successful if the purity P (≥90%) and viability A (≥60%) exceeded their limits, as determined by Equations (1) and (2),
P = N T L C N T C C   ,
A = N I L C N T L C   ,
where N represents the number of events of the corresponding TLC, TCC and ILC measurements. Based on the determined ILC in the liquid culture, L. pneumophila cells were added into 250 mL of sterile Evian water at a concentration of 1 million ILC/mL. The spiked Evian water was shaken for 48 h at 25 °C. This procedure is called conditioning and was done to expose the Legionella cells to conditions encountered in the real world. After conditioning, the quality control was repeated as previously described with a 10−1 dilution. After passing this phase, the conditioned Legionella cells were diluted 1:1 in 1100 µL aliquots using cryopreserved buffer. The tubes were frozen at −20 °C for 20 h and transferred to −80 °C the following day. Before use, the necessary number of cryopreserved bacteria standards were thawed at 37 °C for 15 min and pooled.

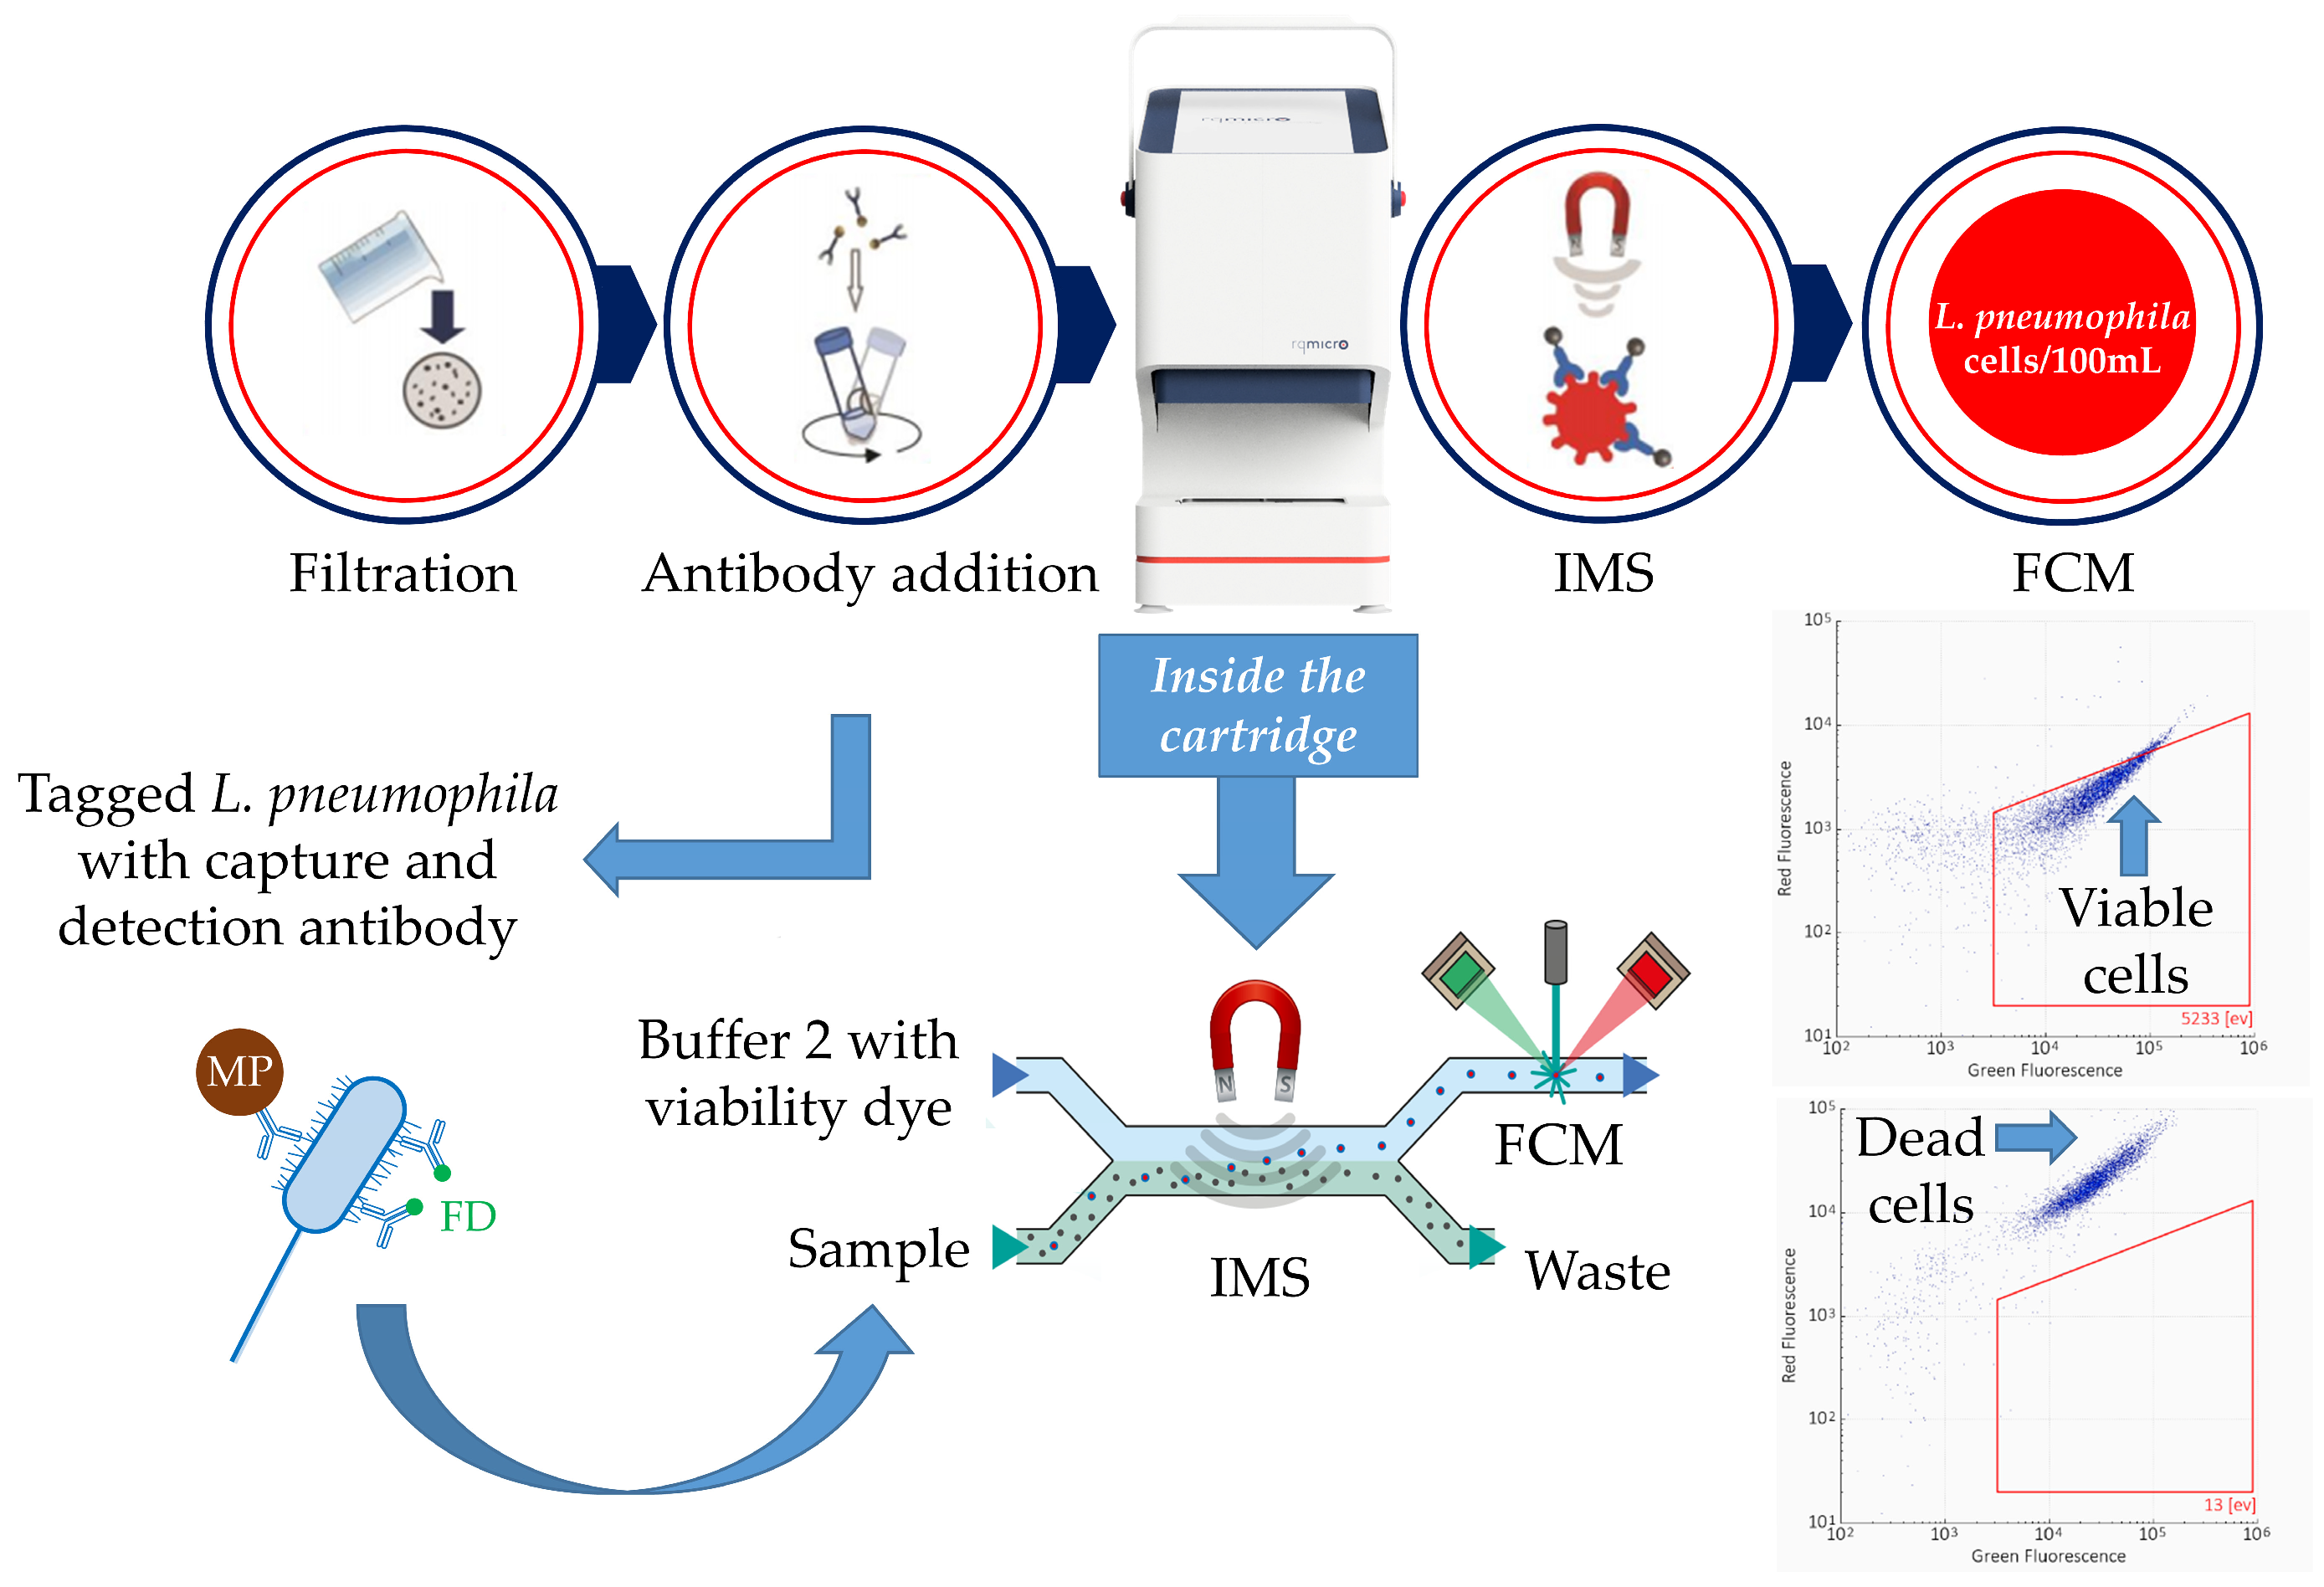
2.3. Culture-Independent Quantification by the IMS-FCM Method

The cryopreserved bacteria standards were used in spiking experiments for the characterization of the IMS-FCM method using the rqmicro.COUNT device and the L.p. Sg 1–15 detect kit obtained from rqmicro (Schlieren, Switzerland). This procedure combines membrane filtration for removing microparticles and the simultaneous enrichment of bacteria. As spiking matrices, Evian water and artificial process water (PW) were used. Artificial PW was made by adding 10 mL pre-diluted Coragard OS 587 from AquaConcept (Gräfelfing, Germany) into 1.0 L Evian water to simulate the chemical water properties of ECS water. Biocides were intentionally avoided so as to not influence the L. pneumophila concentrations of viable cells. A 100 mL matrix was spiked with thawed cryopreserved bacteria standards to achieve concentrations of 102, 5 × 10², 103, 5 × 10³, 104, 5 × 10⁴, and 105 ILC/100 mL for L. pneumophila Sg 1, Sg 4 and Sg 6, individually. For each concentration step, three spiked 100 mL samples were concentrated using the Merck (Darmstadt, Germany) filtration unit with pre-filtration adapters from rqmicro (Schlieren, Switzerland) and a vacuum pump. All metal parts were flushed with 70% ethanol and cleaned with ultrapure water. The filtration unit was assembled (Figure S1) using a fine grid and a 0.22 µm pore size filter. Then, a pre-filtration adapter was attached to the gross grid, and a pre-filter with 5.0 µm pore size was put in place. Afterwards, the sample cup was placed on top and filled with 100 mL of sample. After filtration, the pre-filtration adapter, including the pre-filter, was removed, and the 0.22 µm filter was transferred into a sample tube filled with 1.0 mL Buffer 1. The tube was vortexed for 60 s to wash off the bacteria from the filter, and 200 µL was transferred into a 2 mL screw cap tube. The L. pneumophila cells of interest needed to be specifically tagged using a panel of monoclonal antibodies against L. pneumophila Sg 1–15. The antibodies were conjugated to magnetic particles (capture antibody) for the IMS or to green fluorescence dye (detection antibody) for the FCM measurement [13,26]. Hereto, 10 µL of staining dye and 10 µL of immunomagnetic particles from the L.p. Sg 1–15 detect kit were added to the 200 µL sample and placed in an overhead shaker for 60 min at room temperature. Then, 800 µL Buffer 1 was added to the samples before being transferred into sample wells of the cartridge. The buffer wells were loaded with 2.0 mL Buffer 2, and the measurement was started on the rqmicro.COUNT. During IMS, the L. pneumophila cells bound to the magnetic particles were attracted by a magnetic field inside the cartridge channel. The sample was washed with Buffer 2 to remove the accompanying non-target flora and unbound staining antibodies. The magnet was removed from the channel, which released the magnetic particles into the Buffer 2 flowing towards the capillary for FCM measurement. The data output from the rqmicro.COUNT device comprised fluorescence plots enumerating events appearing in a defined gate, optimized to quantify viable L. pneumophila Sg 1–15. Furthermore, the device automatically calculated the sample’s concentration c of intact cells per 100 mL according to Equation (3), which considers the factor of sample dilution, the factor of the measured sample’s volume and the number of events N that appeared inside the gate. Using one cartridge, it was possible to run four samples simultaneously.
c = 5.0 × N × 1.11

2.4. Process Water Analysis of Real ECS Samples

In total, 26 real-world ECS samples from different engineered systems were collected, with 20 samples originating from AquaConcept (Gräfelfing, Germany) sourced form anonymous ECS providers. The other six samples were collected on-campus at the Technical University of Munich in Garching. All samples were obtained in the upcoming days. For culture-independent analysis, two 100 mL measurements of the real sample were analyzed using the IMS-FCM method, as was described previously. In comparison, cultivation was performed simultaneously according to ISO 11731 [5] and the suggestions of the German Federal Environment Agency.

3. Results

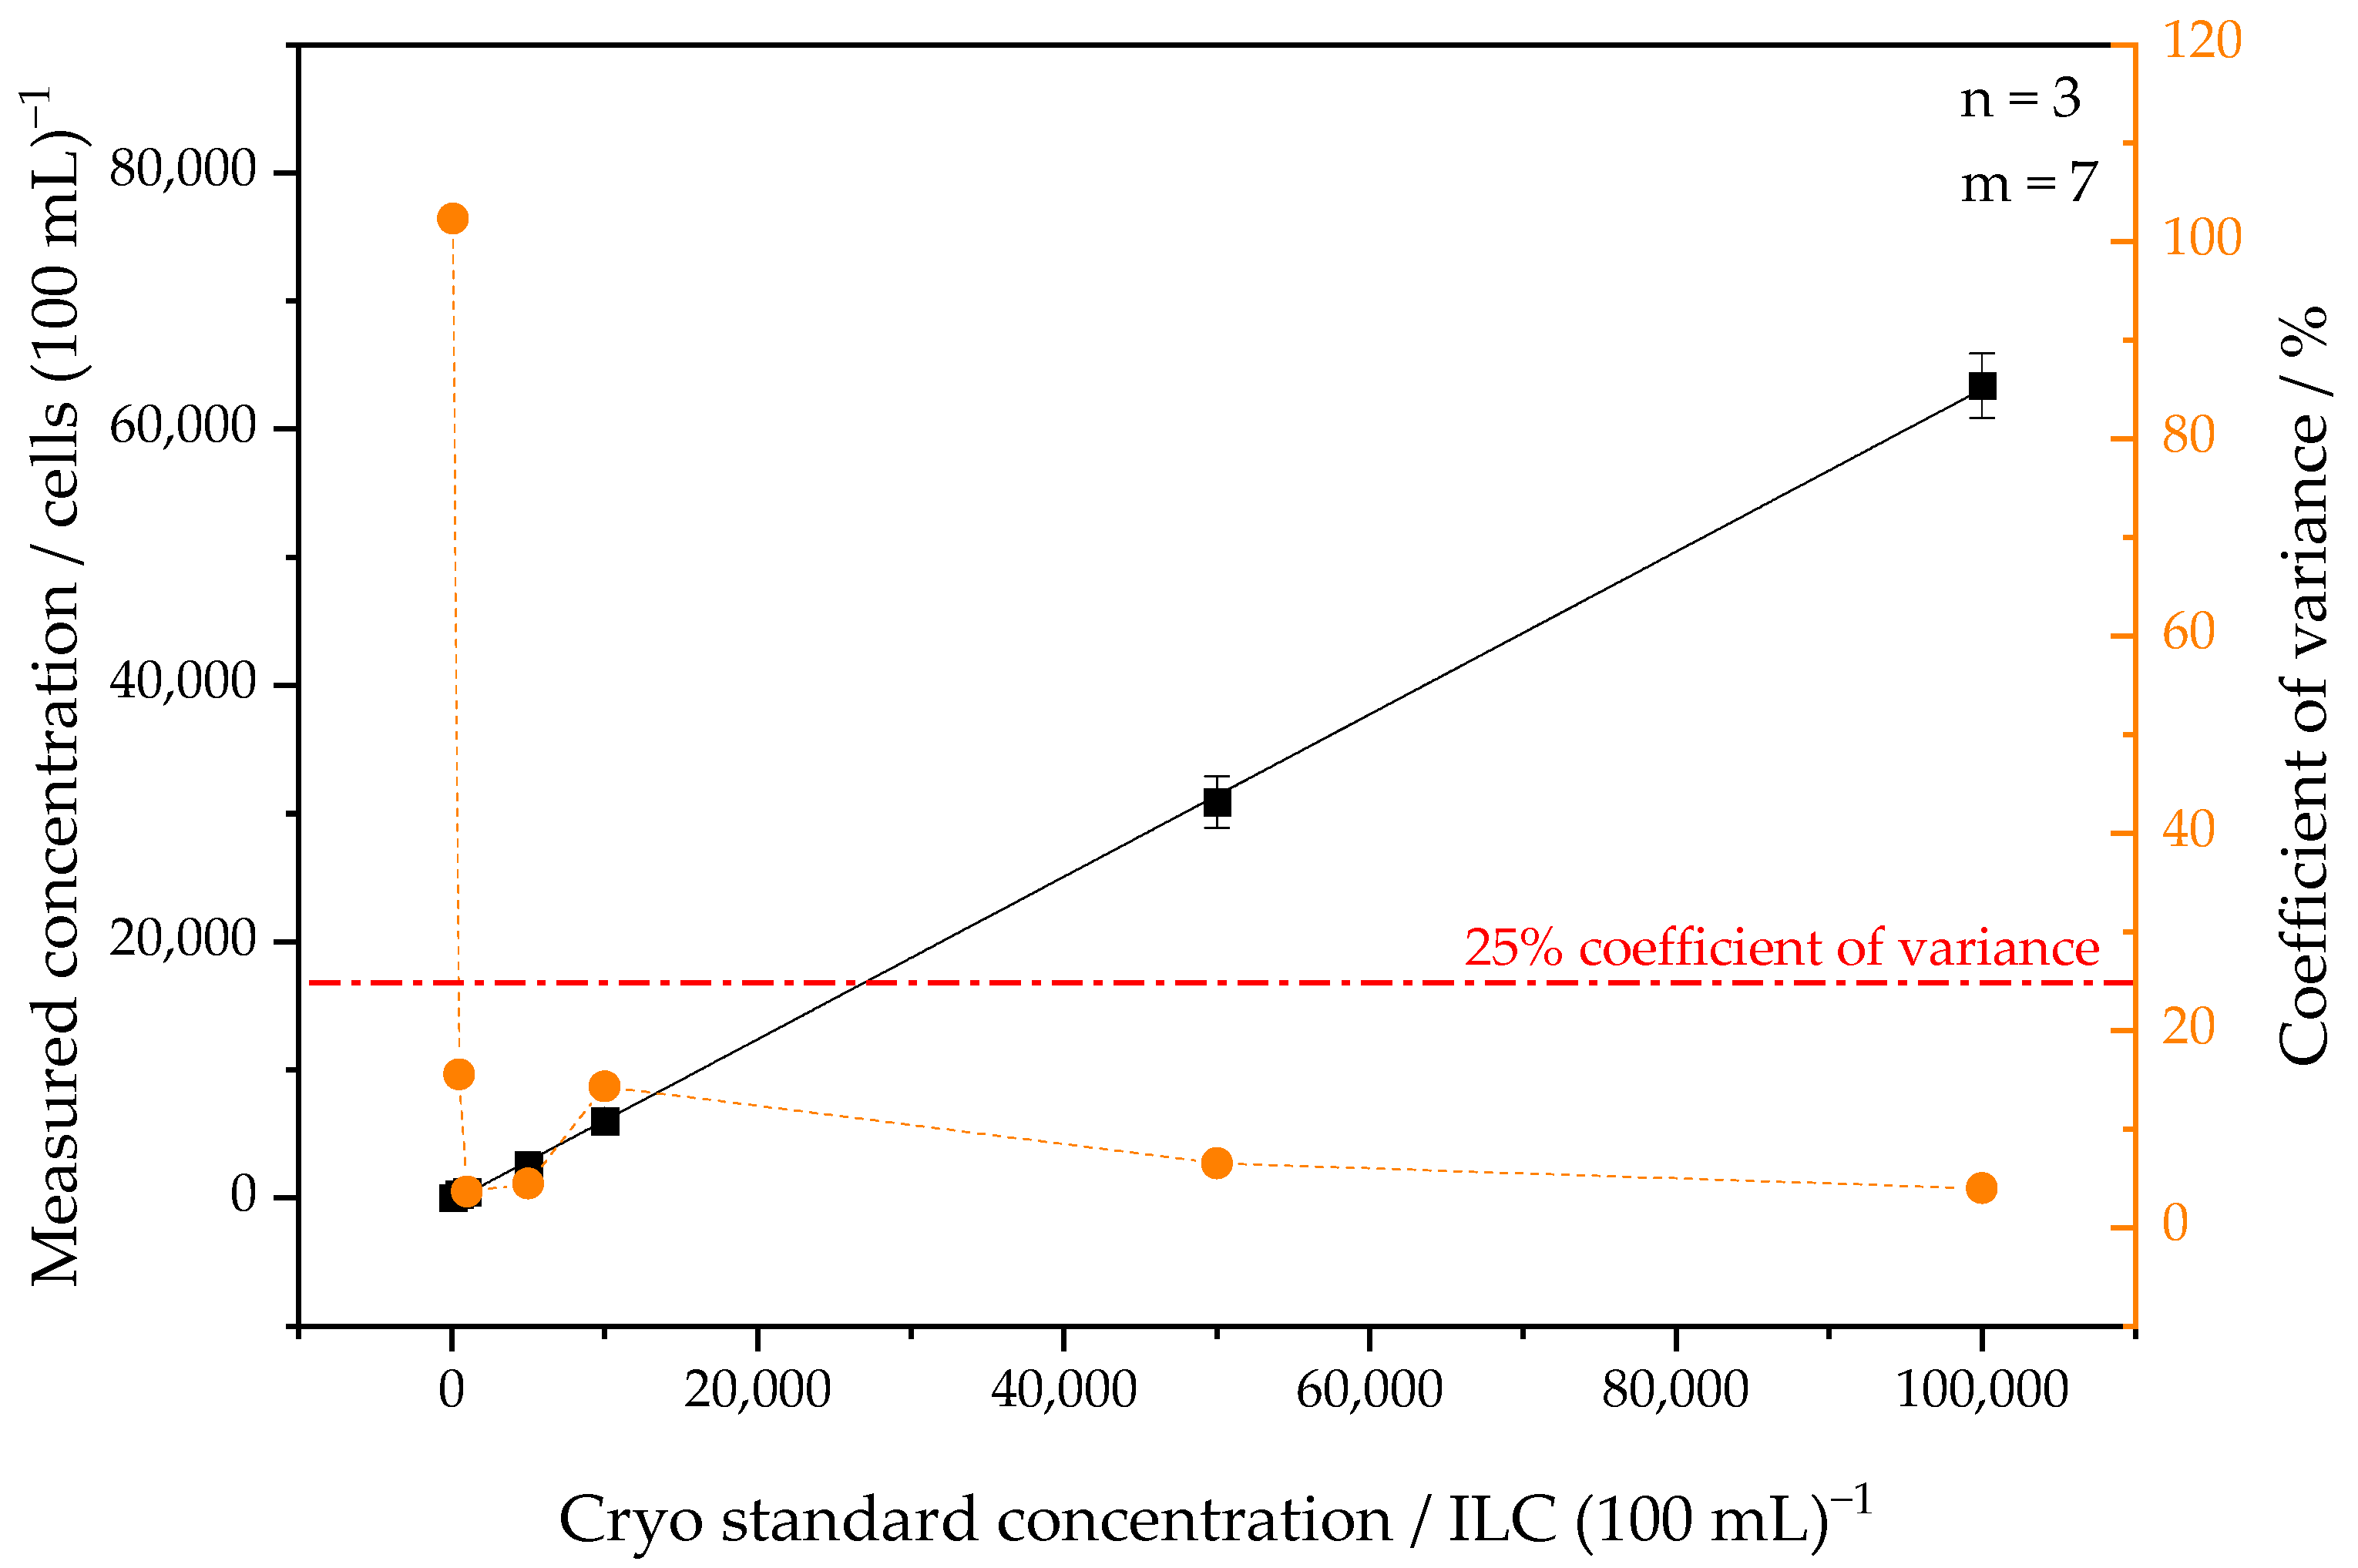
3.1. Determining the Stability and Applicability of Cryopreserved Legionella Standards

Legionnaires’ disease comprises 84% L. pneumophila Sg 1, while other isolates like Sg 4 and Sg 6 are also important pathogens [29]. These medically relevant serogroups were chosen to produce three batches of L. pneumophila cryopreserved standards with concentrations of 9.6 × 10⁵ TLC/mL and 6.4 × 10⁵ ILC/mL for Sg 1, 13.5 × 10⁵ TLC/mL and 12.1 × 10⁵ ILC/mL for Sg 4, and 10.7 × 10⁵ TLC/mL and 8.5 × 10⁵ ILC/mL for Sg 6, respectively. To confirm long-term storage stability at −80 °C, the Sg 1 batches were tested via FCM. A minor change of 0 ± 1.5% for TLC and 7.7 ± 1.2% for ILC was shown after eight months of storage. The thawing of the cryopreserved bacteria standards probably led to a change in the ILC, rather than the storage. A risk is posed during thawing related to the presence of residual water crystals that could cause damage to bacteria by penetrating the outer membrane [30]. Cryopreserved bacteria standards have a sufficient stability and are feasible for use in different applications. After thawing, they can be used for dilution series, spiking experiments, and cultivation because of their defined concentrations of viable cells. As one exemplary application, we here show the use of these cryopreserved Legionella standards for the characterization of the IMS-FCM method in different matrices.

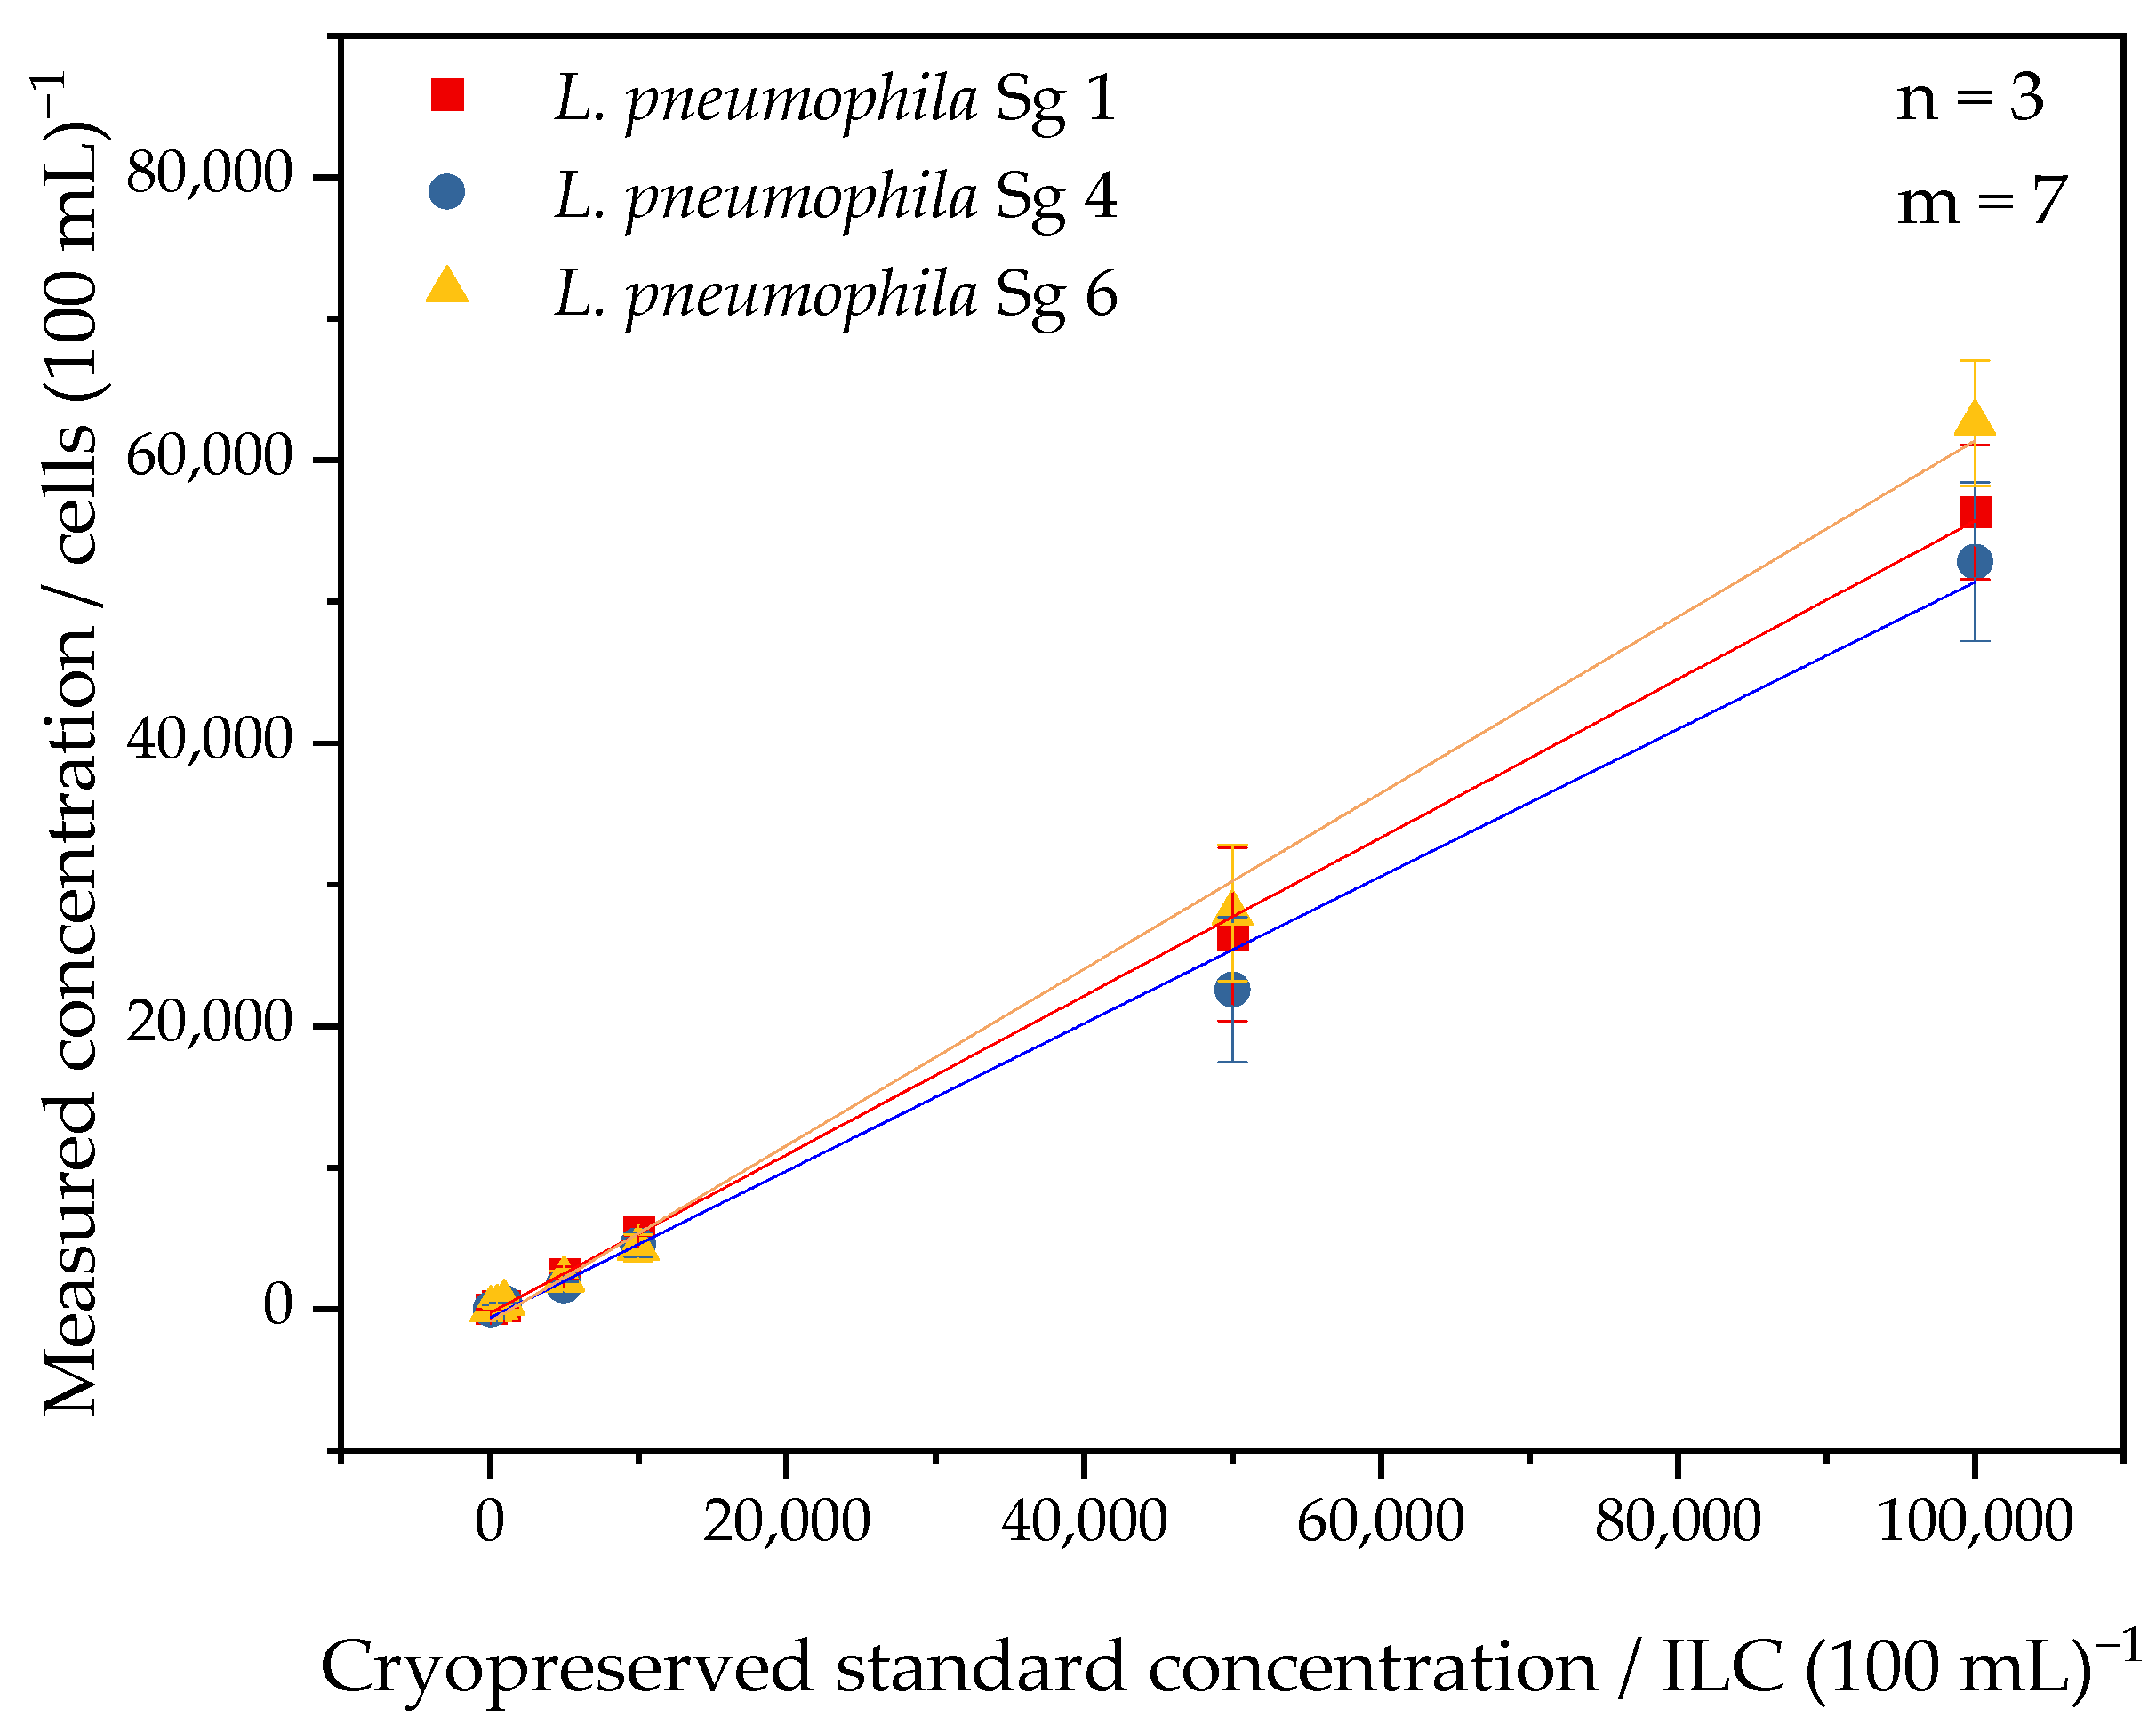
3.2. Characterization of the IMS-FCM Method Using Cryopreserved Legionella Standards

To provide a comprehensive understanding of the system, the IMS-FCM method was tested using a standard matrix under controlled and simplified conditions. Therefore, Evian water was chosen to mimic basic natural, chemical, and microbiological compositions [21]. We started using L. pneumophila Sg 1 cryopreserved Legionella standards to prepare a series of dilutions in 100 mL Evian water per sample to produce a calibration curve and characterize the entire IMS-FCM protocol. Figure 2 shows the resulting correlation of the spiked and detected L. pneumophila Sg 1 concentrations, respectively. Furthermore, to determine the LoD and LoQ, as defined using Equations (4) and (5), 18 blank measurements were performed.
L o D = 3 × σ m
L o Q = 10 × σ m
σ represents the standard deviation of all blank measurements, and m is the regression slope of the calibration curve. The LoD is the lowest concentration at which positive and negative signals can be distinguished. The LoQ defines a further minimal concentration at which quantitative data can be generated. Finally, an excellent linear regression of R2 = 0.9998, an LoD = 86.5 ILC/100 mL and an LoQ = 288.2 ILC/100 mL were achieved. To describe the precision of the method, the coefficient of variance was calculated by dividing the standard deviation of each concentration step by its mean value. In Figure 2, the coefficient of variance is shown on the secondary y-axis. Notably, in the range of 500–100,000 ILC/100 mL, a coefficient of variance consistently beneath 25% was calculated.
Each event detected inside the defined gate of the FCM measurement corresponds to a single viable L. pneumophila cell. If no cell loss occurred during the entire IMS-FCM procedure, the regression slope would equal one. Due to this assumption, the average recovery across the spiked cryopreserved Legionella standard range was defined as the slope of the regression curve. Thereby, an average recovery of 63.4% for L. pneumophila Sg 1 in Evian water was determined. This recovery reflects the percentage of spiked L. pneumophila cells detected. The entire method comrpises, in order, the thawing of the cryopreserved standards, membrane filtration, the washing off of bacteria from the filter, and the determination of the efficiency of antibody staining via antibody antigen interaction, IMS, and FCM detection. During all these steps, L. pneumophila cells can be lost or further damaged. According to the literature, the most significant cell loss occurs during the filtration and washing steps, at 32.6%, while a total cell recovery of 52.1% was determined with microscopic observation and FCM counting [26].
The results show that IMS-FCM allows the culture-independent, accurate, rapid, and quantitative screening of L. pneumophila Sg 1 in Evian water. However, water from ECS is a much more complex and challenging matrix in comparison to bottled drinking water. In reality, each sample of process water differs from the other, thus IMS-FCM needs to exhibit a certain level of resilience to the variability of ECS waters and their physical and chemical compositions. For this reason, we advanced the experiment using defined artificial PW without biocides to characterize the capacity of the IMS-FCM method to remain unaffected by matrix variations. Measurements of the spiked dilution series were repeated using artificial PW. Regarding the changes in the impact of the matrix on IMS-FCM’s performance, the percentage of repeatability of every single measurement was compared with that measured in the prior experiment using Evian water (Table 1). Across the concentration range of 103–105 ILC/100 mL, randomized technical errors can be excluded, because of a constant repeatability range of 84–92% being determined. This demonstrates the good resilience of the IMS-FCM method to chemical variations in artificial PW.
The L.p. Sg 1–15 detect kit and the included antibody panel have been specially designed to detect the entire group, and each Sg was tested by rqmicro individually. The detections of L. pneumophila Sg 4 and Sg 6 showed slight differences in comparison to detections of Sg 1. Because of this, we also included spiking experiments of L. pneumophila Sg 4 and Sg 6 present in artificial PW. All recorded calibration curves pertaining to the artificial PW are shown in Figure 3, and the results have been evaluated as was done previously for L. pneumophila Sg 1. The data show an excellent linear regression for all three calibrations, demonstrating consistent detection across the multiple L. pneumophila Sg, and the calibration results are summarized in Table 2. The data also show that, for Sg 1, the repeatability remained stable around 90%, whereas the repeatability of Sg 4 and Sg 6 ranged 76–117% (Table 3). This observation confirms the stable affinity of the antibody for Sg 1, while for Sg 4 and Sg 6, acceptable variations were seen.

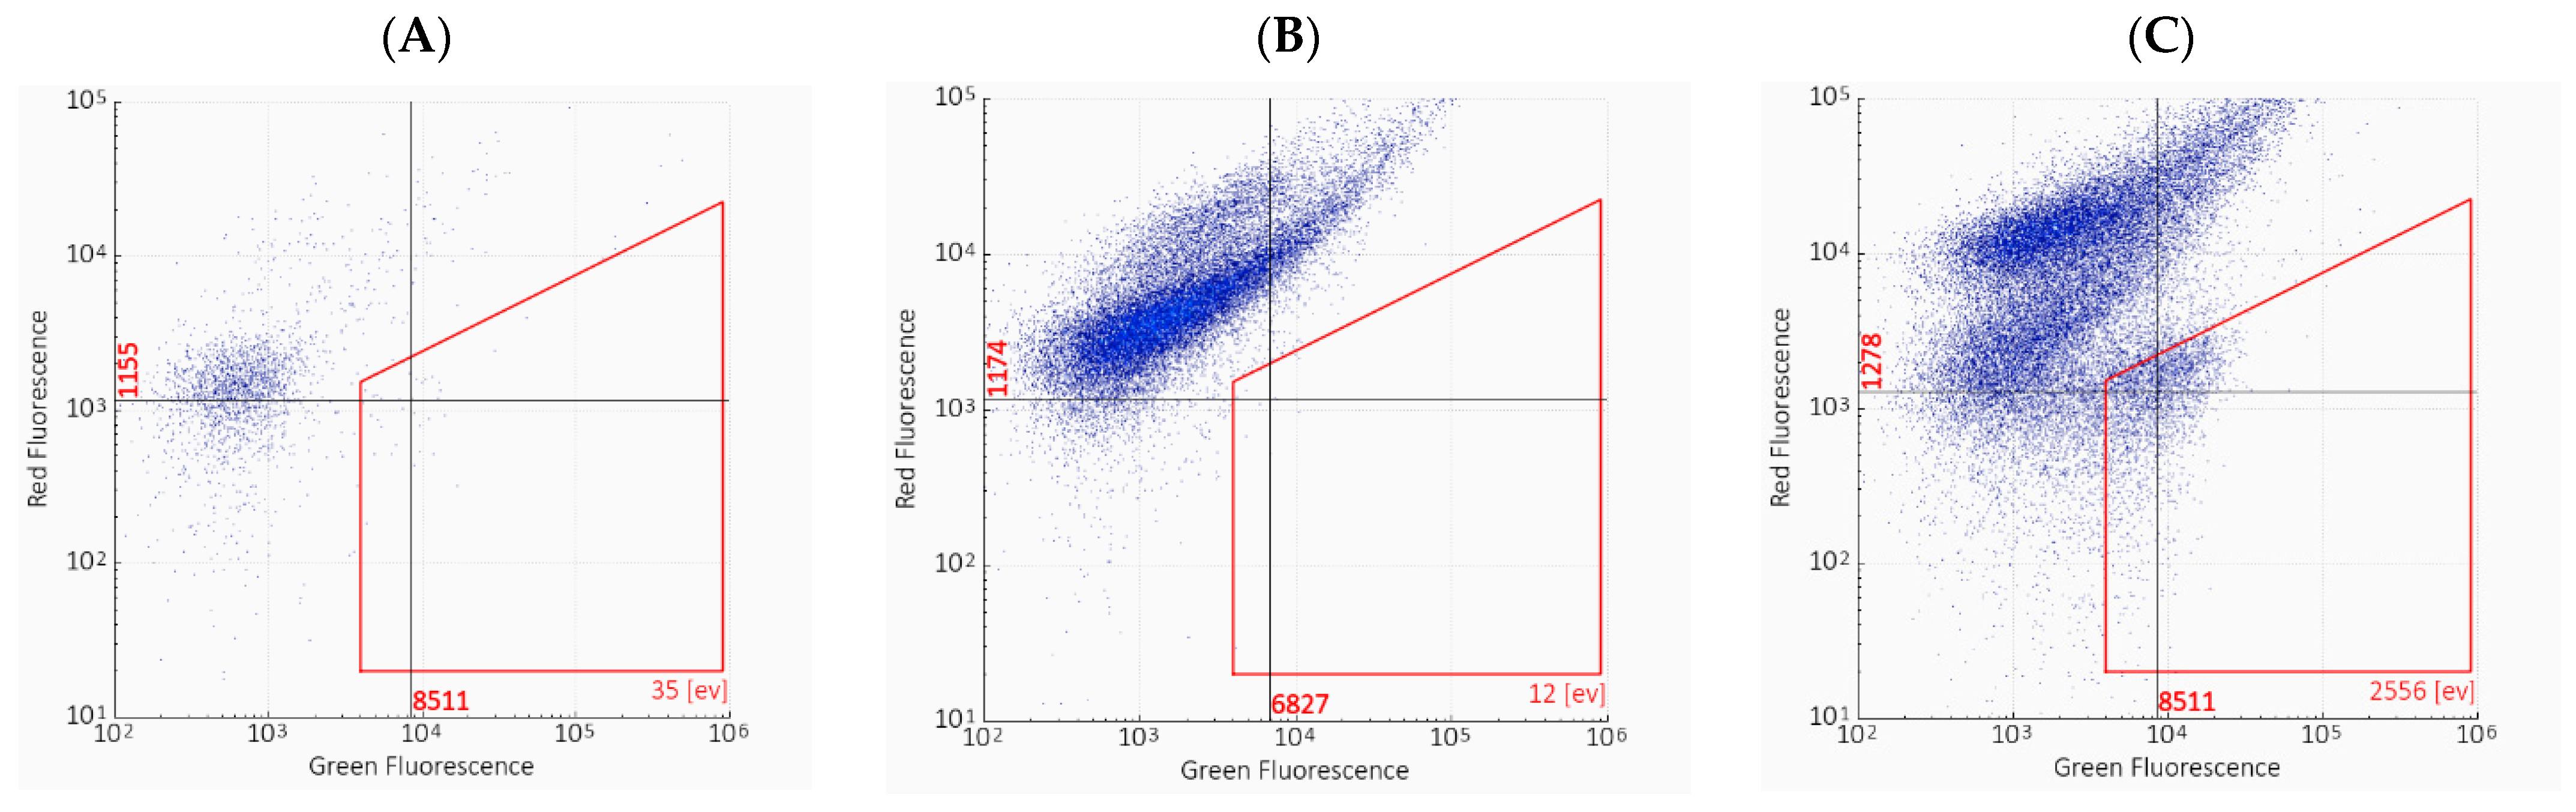
3.3. Utilization of the IMS-FCM Method for the Analysis of Real Process Water

Real samples were taken from different ECSs. Data regarding sampling time, sampling temperature (18–32 °C), biocide type (mostly isothiazolinone), and the quantity of addition were known (Table S1). According to the suggestions of the German Federal Environment Agency, oxidizing biocides need to be inactivated before analyzing process water using culturing. On the other hand, for non-oxidizing types such as isothiazolinone types, fast analysis without biocide inactivation is mandatory [31]. Because of shipping delays of up to two days, the cultural investigation could not be performed within 24 h after sampling. The culturing method was performed in parallel, but could not successfully evidence the presence of Legionella spp. or L. pneumophila. Either the plates showed no colony growth or were covered by accompanying flora, or suspicious colonies were cultivatable on BCYE agar without cysteine (Figure S2). Since cysteine is an essential amino acid for Legionella, these bacteria cannot grow on special BCYE agar plates lacking cysteine. The presence of bacterial colonies therefore indicates that the suspicious colonies were neither Legionella spp. nor L. pneumophila. Legionella cells can still persist in VBNC after disinfection [7,32], and thus will not grow on standard media. However, viable cells with cellular integrity [9] can still be detected using culture-independent methods. In addition to the cultivation method, we performed IMS-FCM on every ECS sample to show the performance of the entire culture-independent method. In contrast to cultivation, 54% of all ECS samples exceeded 10,000 cells/100 mL when analyzed with IMS-FCM; 19% showed L. pneumophila concentrations above 1000 cells/100 mL, and the remaining 27% of the ECS samples gave lower values. Two samples showed no events using IMS-FCM. Therefore, those ECS samples could either be free of L. pneumophila Sg 1–15 or were contaminated with a different Sg or Legionella spp. Compared to culturing, IMS-FCM can be used to assess and estimate different L. pneumophila Sg 1–15 concentrations. This allows for the further classification of ECS water. Furthermore, Figure 4A–C illustrates the individual compositions of the accompanying flora, inferred from the microbiological background signals, and these could lead to interference during the IMS-FCM measurements. Additionally, the different process water matrices featuring other chemical, physical, and microbiological properties resulted in different FCM plots. Nevertheless, Figure 4B,C demonstrate stronger background signals and a higher concentration of accompanying flora compared to Figure 4A. Despite the possible interferences, produced by the accompanying flora, these antibodies could specifically and selectively detect L. pneumophila Sg 1–15 cells exceeding 10,000 cells/100 mL. Some events were positioned close to the gate, and belonged to either the Legionella population or accompanying flora. As such, the gate position has been optimized by positioning it not too close to the instrument’s background, thus avoiding false positive signals, but ensuring it is still able to detect low L. pneumophila contaminations.

4. Discussion

In this work, we observed the applicability of the culture-independent IMS-FCM method as a quantitative rapid test for viable L. pneumophila in ECS. Our aim was to characterize the entire analytical method (including membrane filtration of 100 mL samples, IMS and FMC) via performing calibration experiments to determine the concentration results of viable L. pneumophila. These calibration standards are necessary. Therefore, cryopreserved L. pneumophila standards have here been established the first time. The conditioning of the cryopreserved Legionella standards is therefore crucial to adapt the bacteria to the oligotrophic conditions to which they are exposed in the real-world environment. Due to nutrient scarcity and other environmental stressors, naturally occurring Legionella can differ morphologically and physiologically from laboratory strains grown on agar medium, as was once shown for E. coli 0157 [33]. Furthermore, cells with stored nutrients can induce short-term growth under starvation conditions [34]. Therefore, L. pneumophila cells were taken from nutrition-enriched media kept at 37 °C and placed into sterile Evian water at 25 °C for 48 h, and deprived of nutrients, before being added to the cryopreserved buffer for storage. The enrichment of L. pneumophila cells in liquid BYE medium and conditioning in Evian water are used to produce cryopreserved standards. Legionella showed resistance to exposure to high temperature, osmotic shock, freezing, or starvation, and thus can be stored in water briefly [35,36]. We have shown that cryopreserved Legionella standards are stable for over 8 months of storage at −80 °C and are suitable for use in culture-independent determination methods, which can distinguish between dead and viable Legionella, along with the detection of VBNC.
Furthermore, water from ECS is a complex matrix, which poses challenges and problems. In addition to the L. pneumophila standards, we also tried to mimic process water under standardized conditions with the absence of biocides. Using cryopreserved Legionella standards and our artificial PW, we established a reproducible experimental setup, mimicking the real-world environment as closely as possible. This protocol was used to evaluate the applicability of the entire culture-independent IMS-FCM method, including bacterial enrichment via membrane filtration with subsequent washing from the filters, antibody incubation, and IMS and FCM measurements. The corresponding data show that IMS-FCM can generate quantitative information within a calibration range of 102–105 ILC/100 mL. According to the calibration curves, the parameters of recovery, LoD, LoQ, precision, resilience and specificity were determined. Furthermore, membrane filtration improved the sample concentration, increasing the efficiency in detecting low L. pneumophila concentrations with LoDs of 100.0 ILC/100 mL for Sg 1, 105.3 ILC/100 mL for Sg 4 and 88.0 ILC/100 mL for Sg 6, respectively. On this basis, the IMS-FCM method can be defined as a quantitative rapid test for detecting and distinguishing, with high certainty, viable L. pneumophila Sg 1–15 concentrations including VBNC in ECS waters.
For the analysis of real ECS samples, the acquisition of general calibration curves is not required. The sample can be directly analyzed, and quantitative data on L. pneumophila Sg 1–15 concentrations can be generated automatically by calculating the events detected in viable cells/100 mL. The investigation of real samples is essential to proving efficiency and reliability under real-world conditions. Furthermore, magnetic beads can agglomerate due to magnetic dipole–dipole attraction, potentially resulting in agglomeration and clogging the cartridge channels [22]. During the spiking and calibration experiments, this phenomenon was not observed; however, during the investigation of the real samples, it occurred twice. We successfully repeated the analysis, and it has been recommended to inspect the cartridge after the measurement to avoid such errors. We found that IMS-FCM was a more reliable and rapid method of L. pneumophila detection compared to laboratory cultivation. It increased the frequency of monitoring and shortened the time of response to elevated levels of L. pneumophila. We demonstrated, similarly to other culture-independent methods [37], that viable Legionella were present in water samples even if the cells could not be detected through cultivation. A plausible reason is the VBNC state, which is triggered due to nutrition starvation, disinfection, and the presence of certain microbial species [38]. Thus, establishing a general correlation between Legionella concentrations measured with culture-independent methods versus CFU obtained with the cultivation method will be nearly impossible. For this reason, the performances of antibody-based and molecular biological culture-independent methods can be compared using cryopreserved Legionella standards as reference standards in ongoing projects, research, or studies.

5. Conclusions

We demonstrated that IMS-FCM can be used as a culture-independent, accurate, rapid, and quantitative method for monitoring viable L. pneumophila in ECS. Thereby, IMS and FCM measurements were performed simultaneously, and automatically generated information about the L. pneumophila Sg 1–15 concentrations. The entire method can be performed within two hours, and distinguish between viable and dead cells. The corresponding capture and detection antibody panels were designed to quantify the entire Sg 1–15 group. The study has shown that the IMS-FCM method meets the criteria to be used as a quantitative rapid test for L. pneumophila Sg 1–15 in ECS. This applicability was proven by determining the recovery, LoD, LoQ, precision, resilience and specificity.
In the future, cultivation will presumably be set as the quantitative conformation method for the legally valid hygienic inspection of ECS. Due to the health risks associated with Legionella exposure, culture-independent methods are receiving increasing interest. The IMS-FCM method can be used for different purposes, such as outbreak management, risk assessment, or internal controls. Providers can especially control the efficiency of disinfection measures such as biocide addition, and localize the source of the L. pneumophila contamination. Furthermore, IMS-FCM can exhibit flexibility in specific detection via developing different anti- or nanobodies against different bacteria. Thus, this method could be applied for detecting the presence of other pathogens, such as Pseudomonas aeruginosa, Escherichia coli and Enterococcus faecalis, in all kinds of fresh water and engineered water systems.

Supplementary Materials

The following supporting information can be downloaded at: https://www.mdpi.com/article/10.3390/applmicrobiol4010019/s1, Figure S1: Schematic set-up of the membrane filtration. 1) Drawing up the grid and placing the filter with 0.22 µm pore size on top. 2) Putting the pre-filtration adapter unit on top with its corresponding grid. 3) Placing the filter with 5.0 µm pore size. 4) Attaching the sample cup and adding the sample. 5) After the filtration is completed, the pre-filtration unit is removed and the bacteria can be washed from the membrane filter. Figure S2: Results of the cultivation of real samples. Cultivation of real samples after acidic and heat treatment (left) and stroked suspicious colonies on BCYE agar without cysteine (right). Table S1: Summary of the collected and generated data about all ECS samples.

Author Contributions

P.S., J.R., S.W.-R. and M.S. conceived the experiments. P.S. conducted the laboratory work with assistance. Furthermore, P.S. and J.R. organized the preservation of the real ECS samples and P.S. performed the analysis of all real samples. P.S. analyzed all results and wrote the manuscript with input from the co-authors. M.S., M.E., C.E.W.H. and S.W.-R. supervised the project and were responsible for funding, acquisition, and resources. During the preparation of this work, P.S. used the generative AI writing platform Grammarly to improve spelling and grammar checking. The authors reviewed and edited the content as needed, and take full responsibility for the content of the publication. All authors have read and agreed to the published version of the manuscript.

Funding

This work was supported by the German Federal Ministry for Economics and Climate Action (funding number: 03TN0002).

Institutional Review Board Statement

Not applicable.

Informed Consent Statement

Not applicable.

Data Availability Statement

The raw data supporting the conclusions of this article will be made available by the authors on request.

Acknowledgments

The TUM especially wants to thank Hans-Anton Keserue and Björn Biedermann from rqmicro for deploying the rqmicro.COUNT and supporting this project. Furthermore, the TUM would like to thank Madeleine Parish and Bart Raes for assisting with the laboratory work. For providing real samples for the project, we would like to thank Bianca Spindler from AquaConcept.

Conflicts of Interest

All authors declare no competing interest.

References

  1. Fields, B.S.; Benson, R.F.; Besser, R.E. Legionella and Legionnaires’ Disease: 25 Years of Investigation. Clin. Microbiol. Rev. 2002, 15, 506–526. [Google Scholar] [CrossRef]
  2. Gao, L.-Y.; Stone, B.J.; Brieland, J.K.; Kwaik, Y.A. Different Fates of Legionella pneumophila pmi and mil Mutants within Macrophages and Alveolar Epithelial Cells. Microb. Pathog. 1998, 25, 291–306. [Google Scholar] [CrossRef] [PubMed]
  3. Atlas, R.M. Legionella: From Environmental Habitats to Disease Pathology, Detection and Control. Environ. Microbiol. 1999, 1, 283–293. [Google Scholar] [CrossRef] [PubMed]
  4. Walser, S.M.; Gerstner, D.G.; Brenner, B.; Höller, C.; Liebl, B.; Herr, C.E.W. Assessing the Environmental Health Relevance of Cooling Towers—A Systematic Review of Legionellosis Outbreaks. Int. J. Hyg. Environ. Health 2014, 217, 145–154. [Google Scholar] [CrossRef] [PubMed]
  5. DIN EN ISO 11731:2017; Water Quality—Enumeration of Legionella. International Organization for Standardization: Geneva, Switzerland, 2017.
  6. Lucas, C.E.; Taylor, T.H.; Fields, B.S. Accuracy and Precision of Legionella Isolation by US Laboratories in the ELITE Program Pilot Study. Water Res. 2011, 45, 4428–4436. [Google Scholar] [CrossRef]
  7. García, M.T.; Jones, S.; Pelaz, C.; Millar, R.D.; Abu Kwaik, Y. Acanthamoeba polyphaga Resuscitates Viable Non-culturable Legionella pneumophila after Disinfection. Environ. Microbiol. 2007, 9, 1267–1277. [Google Scholar] [CrossRef] [PubMed]
  8. Allegra, S.; Berger, F.; Berthelot, P.; Grattard, F.; Pozzetto, B.; Riffard, S. Use of Flow Cytometry to Monitor Legionella Viability. Appl. Environ. Microbiol. 2008, 74, 7813–7816. [Google Scholar] [CrossRef] [PubMed]
  9. Oliver, J.D. Recent Findings on the Viable but Nonculturable State in Pathogenic Bacteria. FEMS Microbiol. Rev. 2010, 34, 415–425. [Google Scholar] [CrossRef]
  10. Cervero-Aragó, S.; Rodríguez-Martínez, S.; Puertas-Bennasar, A.; Araujo, R.M. Effect of Common Drinking Water Disinfectants, Chlorine and Heat, on Free Legionella and Amoebae-Associated Legionella. PLoS ONE 2015, 10, 1–18. [Google Scholar] [CrossRef]
  11. Ducret, A.; Chabalier, M.; Dukan, S. Characterization and Resuscitation of ‘Non-Culturable’ Cells of Legionella pneumophila. BMC Microbiol. 2014, 14, 1–10. [Google Scholar] [CrossRef]
  12. Lee, J.V.; Lai, S.; Exner, M.; Lenz, J.; Gaia, V.; Casati, S.; Hartemann, P.; Lück, C.; Pangon, B.; Ricci, M.L.; et al. An International Trial of Quantitative PCR for Monitoring Legionella in Artificial Water Systems: qPCR for Monitoring Legionella. J. Appl. Microbiol. 2011, 110, 1032–1044. [Google Scholar] [CrossRef]
  13. Keserue, H.; Baumgartner, A.; Felleisen, R.; Egli, T. Rapid Detection of Total and Viable Legionella pneumophila in Tap Water by Immunomagnetic Separation, Double Fluorescent Staining and Flow Cytometry. Microbial. Biotechnol. 2012, 5, 753–763. [Google Scholar] [CrossRef]
  14. Nocker, A.; Schulte-Illingheim, L.; Frösler, J.; Welp, L.; Sperber, O.; Hugo, A. Microbiological Examination of Water and Aerosols from Four Industrial Evaporative Cooling Systems in Regard to Risk of Legionella Emissions and Methodological Suggestions for Surveillance. Int. J. Hyg. Environ. Health 2020, 229, 113591. [Google Scholar] [CrossRef]
  15. Basiji, D.A.; Ortyn, W.E.; Liang, L.; Venkatachalam, V.; Morrissey, P. Cellular Image Analysis and Imaging by Flow Cytometry. Clin. Lab. Med. 2007, 27, 653–670. [Google Scholar] [CrossRef]
  16. Gruden, C.; Skerlos, S.; Adriaens, P. Flow Cytometry for Microbial Sensing in Environmental Sustainability Applications: Current Status and Future Prospects. FEMS Microbiol. Ecol. 2004, 49, 37–49. [Google Scholar] [CrossRef] [PubMed]
  17. Rajapaksha, P.; Elbourne, A.; Gangadoo, S.; Brown, R.; Cozzolino, D.; Chapman, J. A Review of Methods for the Detection of Pathogenic Microorganisms. Anal. The 2019, 144, 396–411. [Google Scholar] [CrossRef]
  18. Ihadjadene, Y.; Walther, T.; Krujatz, F. Optimized Protocol for Microalgae DNA Staining with SYTO9/SYBR Green I, Based on Flow Cytometry and RSM Methodology: Experimental Design, Impacts and Validation. Methods Protoc. 2022, 5, 76. [Google Scholar] [CrossRef]
  19. Boulos, L.; Prevost, M.; Barbeau, B.; Coallier, J.; Desjardins, R. LIVE/DEAD BacLight: Application of a New Rapid Staining Method for Direct Enumeration of Viable and Total Bacteria in Drinking Water. J. Microbiol. Methods 1999, 37, 77–86. [Google Scholar] [CrossRef]
  20. Schleich, C.; Chan, S.; Pullerits, K.; Besmer, M.D.; Paul, C.J.; Rådström, P.; Keucken, A. Mapping Dynamics of Bacterial Communities in a Full-Scale Drinking Water Distribution System Using Flow Cytometry. Water 2019, 11, 2137. [Google Scholar] [CrossRef]
  21. Gillespie, S.; Lipphaus, P.; Green, J.; Parsons, S.; Weir, P.; Juskowiak, K.; Jefferson, B.; Jarvis, P.; Nocker, A. Assessing Microbiological Water Quality in Drinking Water Distribution Systems with Disinfectant Residual Using Flow Cytometry. Water Res. 2014, 65, 224–234. [Google Scholar] [CrossRef] [PubMed]
  22. Imran, M.; Affandi, A.M.; Alam, M.M.; Khan, A.; Khan, A.I. Advanced Biomedical Applications of Iron Oxide Nanostructures Based Ferrofluids. Nanotechnol. 2021, 32, 422001. [Google Scholar] [CrossRef]
  23. Yáñez, M.A.; Carrasco-Serrano, C.; Barberá, V.M.V. Catalán Quantitative Detection of Legionella pneumophila in Water Samples by Immunomagnetic Purification and Real-Time PCR Amplification of the dotA Gene. Appl. Environ. Microbiol. 2005, 71, 3433–3441. [Google Scholar] [CrossRef]
  24. Ortí-Lucas, R.M.; Luciano, E. New Immunomagnetic Separation Method to Analyze Risk Factors for Legionella Colonization in Health Care Centres. J. Expo. Sci. Environ. Epidemiol. 2022, 32, 744–750. [Google Scholar] [CrossRef]
  25. Keserue, H.-A.; Cornillie, N.; Ehlert, A.-K.; Mills, D.C.; Morger, D.; Piffaretti, A.; Schaffhauser, D.F.; Schwyzer, I.I. Validation of the Legionella pneumophila SG1 DETECT Kit for Quantification of Legionella pneumophila Serogroup 1 Bacteria in Potable Waters, Process Waters, and Surface Waters: AOAC Performance Tested Method 052002. J. AOAC Int. 2021, 104, 776–789. [Google Scholar] [CrossRef] [PubMed]
  26. Füchslin, H.P.; Kötzsch, S.; Keserue, H.; Egli, T. Rapid and Quantitative Detection of Legionella pneumophila Applying Immunomagnetic Separation and Flow Cytometry. Cytometry A 2010, 77A, 264–274. [Google Scholar] [CrossRef] [PubMed]
  27. Heining, L.; Welp, L.; Hugo, A.; Elsner, M.; Seidel, M. Immunomagnetic Separation Coupled with Flow Cytometry for the Analysis of Legionella pneumophila in Aerosols. Anal. Bioanal. Chem. 2023, 415, 5139–5149. [Google Scholar] [CrossRef]
  28. DIN EN ISO 11133:2020; Microbiology of Food, Animal Feed and Water—Preparation, Production, Storage and Performance Testing of Culture Media. International Organization for Standardization: Geneva, Switzerland, 2020.
  29. Yu, V.L.; Plouffe, J.F.; Pastoris, M.C.; Stout, J.E.; Schousboe, M.; Widmer, A.; Summersgill, J.; File, T.; Heath, C.M.; Paterson, D.L.; et al. Distribution of Legionella Species and Serogroups Isolated by Culture in Patients with Sporadic Community-Acquired Legionellosis: An International Collaborative Survey. J. Infect. Dis. 2002, 186, 127–128. [Google Scholar] [CrossRef] [PubMed]
  30. Giulio, B.D.; Orlando, P.; Barba, G.; Coppola, R.; Rosa, M.D.; Sada, A.; Prisco, P.P.D.; Nazzaro, F. Use of Alginate and Cryo-Protective Sugars to Improve the Viability of Lactic Acid Bacteria after Freezing and Freeze-Drying. World. J. Microbiol. Biotechnol. 2005, 21, 739–746. [Google Scholar] [CrossRef]
  31. Kim, B.R.; Anderson, J.E.; Mueller, S.A.; Gaines, W.A.; Kendall, A.M. Literature Review—Efficacy of Various Disinfectants against Legionella in Water Systems. Water Res. 2002, 36, 4433–4444. [Google Scholar] [CrossRef]
  32. Alleron, L.; Merlet, N.; Lacombe, C.; Frère, J. Long-Term Survival of Legionella pneumophila in the Viable But Nonculturable State After Monochloramine Treatment. Curr. Microbiol. 2008, 57, 497–502. [Google Scholar] [CrossRef]
  33. Hahm, B.-K.; Bhunia, A.K. Effect of Environmental Stresses on Antibody-Based Detection of Escherichia coli O157:H7, Salmonella enterica Serotype Enteritidis and Listeria monocytogenes. J. Appl. Microbiol. 2006, 100, 1017–1027. [Google Scholar] [CrossRef] [PubMed]
  34. James, B.W.; Mauchline, W.S.; Dennis, P.J.; Keevil, C.W. A Study of Iron Acquisition Mechanisms of Legionella pneumophila Grown in Chemostat Culture. Curr. Microbiol. 1997, 34, 238–243. [Google Scholar] [CrossRef] [PubMed]
  35. Garduño, R.A.; Garduño, E.; Hiltz, M.; Hoffman, P.S. Intracellular Growth of Legionella pneumophila Gives Rise to a Differentiated Form Dissimilar to Stationary-Phase Forms. Infect. Immun. 2002, 70, 6273–6283. [Google Scholar] [CrossRef] [PubMed]
  36. Liao, C.-H.; Shollenberger, L.M. Survivability and Long-Term Preservation of Bacteria in Water and in Phosphate-Buffered Saline. Lett. Appl. Microbiol. 2003, 37, 45–50. [Google Scholar] [CrossRef]
  37. Ahmed, S.; Liwak-Muir, U.; Walker, D.; Zoldowski, A.; Mears, A.; Golovan, S.; Mohr, S.; Lem, P.; Harder, C. Validation and In-Field Testing of a New on-Site qPCR System for Quantification of Legionella pneumophila According to ISO/TS 12869:2012 in HVAC Cooling Towers. J. Water Health 2019, 17, 237–253. [Google Scholar] [CrossRef]
  38. Guerrieri, E.; Bondi, M.; Sabia, C.; De Niederhäusern, S.; Borella, P.; Messi, P. Effect of Bacterial Interference on Biofilm Development by Legionella pneumophila. Curr. Microbiol. 2008, 57, 532–536. [Google Scholar] [CrossRef]
Figure 1. Schematic workflow and the combination of IMS-FCM inside the fluidic cartridge. After membrane filtration, magnetic particles (MP) conjugated to the capture antibody and fluorescence dye (FD) conjugated to the detection antibody are added to the sample. After tagging the bacteria, the sample is transferred into the cartridge and the rqmicro.COUNT performs the IMS and FCM measurement in a fully automated manner. The output data are fluorescence plots, showing event populations inside the gate, which are enumerated to viable L. pneumophila Sg 1–15 cells/100 mL.
Applmicrobiol 04 00019 g001
Figure 2. Calibration curve and coefficient of variance of L. pneumophila Sg 1 spiked in Evian water. The calibration curve was plotted for seven concentrations (m = 7) in triplicates (n = 3). The spiked cryopreserved Legionella standard concentrations (ILC/100 mL) in the 100 mL samples are shown against the output of the concentration of cells/100 mL given by the IMS-FCM method. The coefficient of variance of each 100 mL sample is further plotted on this scale.
Applmicrobiol 04 00019 g002
Figure 3. Calibration curves of L. pneumophila Sg 1, Sg 4, and Sg 6 in artificial PW. All calibration curves were plotted for seven concentrations (m = 7) in triplicate (n = 3). The spiked cryopreserved Legionella standard concentrations (ILC/100 mL) in the 100 mL samples are shown against the concentration of cells/100 mL output by the IMS-FCM method.
Applmicrobiol 04 00019 g003
Figure 4. Representative FCM plots of three ECS samples with different background populations and viable L. pneumophila Sg 1–15 concentrations. The red gate is defined. Every event inside the gate corresponds to viable L. pneumophila cells and every event outside belongs to the background containing dead Legionella cells and accompanying flora. In panel (A), low background and Legionella populations are visible. In contrast, both plots (B,C) show high background but differ in their L. pneumophila Sg 1–15 concentrations.
Applmicrobiol 04 00019 g004
Table 1. Repeatability of L. pneumophila Sg 1 based on the comparison of the spiking experiments in Evian and artificial PW.
Sample Concentration (ILC/100 mL)Repeatability (%)
102466.5 ± 7.2
5 × 102166.3 ± 15.9
10386.7 ± 19.4
5 × 10389.0 ± 15.0
10491.6 ± 4.6
5 × 10484.5 ± 19.3
10589.3 ± 7.5
Repeatability is shown as mean ± standard deviation; each analysis was carried out in triplicate.
Table 2. Summary of the data of L. pneumophila Sg 1, Sg 4, and Sg 6 calibration in artificial PW.
ParametersL. pneumophila Sg 1L. pneumophila Sg 4L. pneumophila Sg 6
Recovery56%52%62%
LoD (ILC/100 mL)100.0105.388.0
LoQ (ILC/100 mL)333.4351.1293.4
Linear RegressionR2 = 0.9993R2 = 0.9953R2 = 0.9972
The LoD and LoQ were determined using 18 blank measurements.
Table 3. Repeatability of the L. pneumophila Sg 1, Sg 4, and Sg 6 measurements in artificial PW.
Sample Concentration (ILC/100 mL)Repeatability (%)
L. pneumophila Sg 1L. pneumophila Sg 4L. pneumophila Sg 6
10386.7 ± 19.4117.0 ± 9.8115.0 ± 27.9
10491.6 ± 4.676.3 ± 12.980.7 ± 15.1
10589.3 ± 7.583.8 ± 8.899.2 ± 7.0
Repeatability is shown as mean ± standard deviation; each analysis was carried out in triplicate.
Disclaimer/Publisher’s Note: The statements, opinions and data contained in all publications are solely those of the individual author(s) and contributor(s) and not of MDPI and/or the editor(s). MDPI and/or the editor(s) disclaim responsibility for any injury to people or property resulting from any ideas, methods, instructions or products referred to in the content.

