Article

Toward Effects of Hydrophobicity on Biosurfactant Production by Bacillus subtilis Isolates from Crude-Oil-Exposed Environments

1
Department of Biotechnology, Faculty of Biological Sciences, Alzahra University, Tehran 1993893973, Iran
2
Department of Bioprocess Engineering (150k), Institute of Food Science and Biotechnology (150), University of Hohenheim, Fruwirthstr. 12, 70599 Stuttgart, Germany
3
Core Facility Hohenheim, Mass Spectrometry Unit, University of Hohenheim, Ottilie-Zeller-Weg 2, 70599 Stuttgart, Germany
4
Core Facility Hohenheim (640), Data Management & Bioinformatics, University of Hohenheim, Emil-Wolff-Str. 12, 70599 Stuttgart, Germany
5
Core Facility Hohenheim (640), Analytical Chemistry Unit, University of Hohenheim, Emil-Wolff-Str. 12, 70599 Stuttgart, Germany
6
Department of Molecular Genetics, University of Groningen, Nijenborgh 7, 9747 AG Groningen, The Netherlands
*
Authors to whom correspondence should be addressed.
Appl. Microbiol. 2024, 4(1), 215-236; https://doi.org/10.3390/applmicrobiol4010015
Submission received: 23 December 2023 / Revised: 15 January 2024 / Accepted: 16 January 2024 / Published: 18 January 2024

Abstract

:
Background: Due to their structural features, biosurfactants reveal promising physicochemical properties, making them interesting for various applications in different fields, such as the food, cosmetics, agriculture, and bioremediation sectors. In particular, the bioproduction of surfactin, one of the most potent microbially synthesized biosurfactant molecules, is of great interest. However, since the wild-type productivities are comparably low, stimulatory environmental conditions have to be identified for improved bioproduction This study aims to find a correlation between the hydrophobicity and production of the biosurfactant surfactin by B. subtilis isolates from crude-oil-contaminated soil and water. Methods: The surfactin production yield was characterized in adapted batch cultivations using high-performance thin-layer liquid chromatography (HPTLC). Defined hydrophobic environmental conditions were achieved by supplementation with hexadecane or polystyrene beads, and the effects on biosurfactant production were measured. Adaptations at the protein level were analyzed using mass spectrometry measurements. Results: The correlation between hydrophobicity and surfactin production was characterized using Bacillus subtilis strains ZH1 and P7 isolated from crude-oil-contaminated soil and water. Since these isolates show the biodegradation of crude oil and hexadecane as hydrophobic substrates, respectively, a first-time approach, using polystyrene beads, was applied to provide a hydrophobic environment. Interestingly, contrary to popular opinion, reduced biosurfactant production was determined. Using mass spectrometric approaches, the physiological effects of co-cultivation and the cellular response at the protein level were investigated, resulting in altered quantities of stress proteins and proteins involved in the carbon metabolism counter to polystyrene beads. Conclusions: Contrary to common opinion, increasing hydrophobicity does not have a stimulating effect, and even reduces the effect on the bioproduction of surfactin as the main biosurfactant using selected B. subtilis strains.

1. Introduction

Biosurfactants are surface active agents widely produced by microorganisms [1,2]. Due to their low environmental toxicity and already-described biodegradability, biosurfactants are a promising alternative to chemical surfactants [3,4]. They reveal unique structural features that are important for their potential application in many industrial sectors, such as household detergents [5], emulsifiers and foam stabilizers in food products such as bread, emollients in cosmetics including skin cream, and biodegradable and green surfactant components of biological origin (plants and microorganisms) [6]. In addition, their antimicrobial properties make them interesting for applications as fungicides in agriculture [7,8], antibacterial and antivirus agents in pharmaceuticals [9,10,11], and for the bioremediation of oil-contaminated environments [12]. They have a high foaming capacity; high selectivity; specific activity in acute environmental conditions involving temperature, pH, and salinity; and the ability to be synthesized from renewable sources [13,14]. Biosurfactants are often involved in specific biological activities including cell–cell interactions, such as bacterial quorum sensing, biofilm formation, cell differentiation, and gliding movement [15,16,17].
Due to their amphipathic structural properties, biosurfactants have the ability to accumulate between fluid phases with different polarities and hydrogen bonding, such as air/water and oil/water interfaces. These properties help them to reduce surface and interfacial tension and form microemulsions that dissolve hydrocarbons in water or water in hydrocarbons [15,18]. Consequently, biosurfactants are described as being able to improve the solubility of hydrophobic pollutants. They are often used as additives to stimulate bioremediation and remove petroleum substances from soil and water contaminated with crude oil and its derivatives by increasing their bioavailability for degrading microorganisms [19,20]. In the case of surfactin, a reduction in the surface tension of water from 72.5 mN/m to 27.2 mN/m was detected, while chemical-based surfactants only reduced the surface tension to 32.7 mN/m [21,22].
In addition to bioremediation, it is known that biosurfactants are also used in the field of crude oil recovery in a process called microbial-enhanced oil recovery (MEOR), the third stage of crude oil recovery. The removal/mobilization of oil sludge from storage tanks, the microbial demulsification of petroleum emulsions, and the reduction in the viscosity of heavy oil by facilitating the recovery of transmission and piping waste are other applications related to the oil industry [2,23,24].
Although various applications are reasonable for biosurfactants, a bottleneck is the overall microbial productivity. Accordingly, strategies in both strain and bioprocess engineering are used to improve the production yields of production strains constructed for the highest possible bioproduction. One strategy for improved biosurfactant production is the use of inducers. Hydrophobic inducers serve as additional carbon sources and also trigger biosurfactant production, resulting in the greater solubilization of hydrophobic carbon sources [25,26,27]. For instance, olive oil was used as an effective inducer for the production of biosurfactants [27,28,29]. Using a combination of carbohydrates and long-chain fatty acids as an inducer, rhamnolipid production was improved [30,31]. In the case of surfactin, Olivera Schmidt et al. [26] showed that palmitic acid led to the highest performance among several hydrophobic inducers.
However, several studies have only described the stimulation of biosurfactant production by complex hydrophobic carbon sources. In this way, metabolic effects on microbial physiology could not be excluded. The work of this study will help to gain more insights into the differentiation between the use of additional hydrophobic carbon sources and non-metabolically utilized inducers. Therefore, hydrophobic-substrate-degrading Bacillus subtilis isolates from crude-oil-exposed environments were characterized by their production of biosurfactants, including surfactin and fengycin, under different hydrophobic environments using hexadecane as an additional carbon source and polystyrene beads as external hydrophobic inducer particles. In this way, this study provides more understanding of the linkage between biosurfactant bioproduction and the stimulatory effects of hydrophobic environments. To gain more profound insights into the cellular response to effects caused by co-cultivation with polystyrene beads as hydrophobic inducer particles, the intracellular proteomic adaptation was analyzed by mass spectrometric measurements. In this way, this work provides a deeper understanding of the effects of hydrophobicity on biosurfactant production by Bacillus subtilis.

2. Materials and Methods

2.1. Chemicals and Materials

All chemicals were acquired from Carl Roth GmbH & Co. KG (Karlsruhe, Germany) and Merck, Darmstadt, Germany, if not otherwise mentioned.

2.2. Screening of Crude Oil Degrading and Biosurfactant-Producing Bacterial Isolates

Several crude-oil-contaminated soil and wastewater samples were collected from around the Gachsaran crude oil fields in southwest Iran (30.3660° N, 50.7936° E). The isolation of bacterial strains was performed as described in Hashemi et al. [32]. To identify the capabilities of the crude oil degradation, 1 mL of isolates cultured in nutrient broth with McFarland Standard 0.5 was inoculated into 50 mL of a mineral salt medium using 250 mL baffled shake flasks. Afterwards, 1% (v/v) of the crude oil (obtained from the Gachsaran oil field, Iran) was added to each flask as the sole carbon and energy source. The modified mineral salt medium contained 0.5 g/L KH2PO4; 1 g/L NH4Cl; 0.2 g/L MgSO4 · 7H2O; 0.01 g/L FeSO4 · 7H2O; 0.01 g/L CaCl2 · 2H2O; and 1mL of trace element solution containing the following: 0.5 g/L Na2EDTA; 3 g/L MnSO4 · H2O; 0.1 g/L CaCl2 · 2H2O; 1 g/L NaCl; 0.1 g/L ZnSO4 · 7H2O; 0.1 g/L FeSO4 · 7H2O; 0.01 g/L CuSO4 · 5H2O; 0.01 g/L AlK(SO4)2 · 12H2O; 0.01 g/L boric acid; 0.005 g/L Na2SeO4; and 0.003 g/L NiCl2 · 6H2O [33,34]. All flasks were incubated at 35 °C and 150 rpm for one week using an aerated shaking system (BR 300L, TAITEC Corporation, Nishikata, Japan). Each flask was examined daily so that the two-phase state of the medium and crude oil layer disappeared and the crude oil layer homogenized (or dispersed) with the medium. To observe the emulsion, a drop of the medium was observed under a light microscope (Zeiss, Oberkochen, Germany). Cultivations were carried out at least in biological duplicates. To identify biosurfactant-producing isolates, cell-free fermentation broth (centrifugation at 5000 rpm and 4 °C for 10 min) was used for several preliminary screening methods (Supplementary Material S1) [35,36]. All screening tests were performed in triplicates.

2.3. Measurement of Surface Tension

A volume of 1 mL of a pre-culture using McFarland Standard 0.5 was inoculated into 50 mL of the mineral salt medium with 10 g/L sucrose in a 250 mL baffled shake flask and was incubated at 37 °C and 150 rpm. After reaching the exponential growth phase, cell-free supernatant (centrifugation at 9000 rpm for 15 min) was applied to preliminary screening approaches such as oil spreading assay and drop collapse assay, and the surface tension of the cell-free supernatant was measured using a tensiometer with the pendant drop method (Jikan CAG-20, Jikan, Ljubljana, Slovenia).

2.4. 16S rRNA Sequence Analysis

Bacterial DNA was extracted using the modified SET (sucrose, EDTA, Tris-HCl) buffer method [37]. The quality and concentration of DNA were determined using agarose gel electrophoresis and a Nanodrop Spectrophotometer (Thermo Scientific, Waltham, MA, USA). For the PCR approach, Q5® High-Fidelity DNA polymerase (New England Biolabs GmbH, Frankfurt, Germany) and primers 5′-GAGTTTGATCCTGGCTCAG-3′ and 5′-GGTTACCTTGTTACGACT-3′ (Eurofins Genomics, Ebersberg, Germany) were used with a PEQSTAR Thermal Cycler (VWR International GmbH, Darmstadt, Germany). The purification was performed with a QIA quick PCR kit (QIAGEN AB, Kista, Stockholm, Sweden). Sequencing was conducted as described in the GATC Service manual of Eurofins Genomics Sequencing GmbH (Konstanz, Germany). Sequence alignment was performed with reference sequences from the National Center for Biotechnology Information (NCBI) (Bethesda MD) GenBank using the Basic Local Alignment Search Tool (BLAST) algorithm. The FASTA format of sequences was uploaded to the NCBI database to record the strains. Fresh cultures of the strains were deposited in the DSMZ (German Collection of Microorganisms and Cell Cultures GmbH, Braunschweig, Germany).

2.5. Quantitative Lipopeptide Analysis

A 2 mL cell-free supernatant was mixed with 1 mL butanol (95% v/v) for 1 min, followed by 5 min centrifugation at 3000 rpm for phase separation. The extraction was repeated 3 times, and the collected phases were evaporated at 60 °C and 10 mbar for 2 h and 20 min (RVC2-25 Cdplus, Martin Christ Gefriertrocknungsanlagen GmbH, Osterode am Harz, Germany). The remaining residues were dissolved in 2 mL of methanol [8] and quantified by high-performance thin-layer chromatography (HPTLC) measurements [38]. The extracted lipopeptides were analyzed by HPTLC (CAMAG, Muttenz, Switzerland) using standards of surfactin, iturin A (Sigma–Aldrich, Seelze, Germany), and fengycin (Lesquin, France) as previously described [38]. An HPTLC plate (silica gel 60) was developed with 2 mobile phases comprised of chloroform/methanol/water at 65/25/4 (v/v/v) and butanol/ethanol/0.1% acetic acid at 1/4/1 (v/v/v).

2.6. Quantification of Glucose Consumption during Cultivation

Glucose concentrations were measured by HPTLC. In brief, 100 μL of the cell-free supernatant was diluted at 1:80 in distilled water. The plate (Silica gel 60 F254) was developed with acetonitrile/H2O (85:15) (v/v), and derivatization was performed using DPA reagent (1.2 g of diphenylamine and 1.2 g of aniline dissolved in 100 mL of methanol and 10 mL of 85% phosphoric acid) followed by incubation at 120 °C for 15 min on a TLC plate heater (CAMAG plate heater, CAMAG Chemie-Erzeugnisse & Adsorptionstechnik AG & Co. GmbH, Berlin, Germany) [39].

2.7. Cultivation Conditions for Lipopeptide Production

For the first pre-culture, LB medium containing 5 g/L tryptone, 10 g/L NaCl, and 10 g/L yeast extract was used. In the second pre-culture and main cultures, the bacterial strains were cultivated in a modified mineral salt medium (MSM) containing (mol/L) 4.0 × 10⁻⁶ Na2EDTA · 2H2O; 7.0 × 10⁻⁶ CaCl2; 4.0 × 10⁻⁶ FeSO4 · 7H2O; 1.0 × 10⁻⁶ MnSO4 · H2O; 0.03 KH2PO4; 0.04 Na2HPO4 · 2H2O; 0.05 (NH4)2SO4; 8.0 × 10⁻⁴ MgSO4 · 7 H2O; and 8 (and 40) g/L glucose (pH 7, filtered sterilized) [40]. Initially, 15 μL of a glycerol stock was inoculated in 15 mL of LB medium in 100 mL baffled shake flasks and incubated overnight at 37 °C and 120 rpm in a shaker incubator (Innova 44®R, Eppendorf AG, Hamburg, Germany). Exponentially growing cells with McFarland Standard 0.5 (10%) were used to inoculate 80 mL of MSM in 500 mL baffled flask as the second pre-culture and incubated at the same conditions. After 10 to 14 h, exponentially growing cells were inoculated into the main cultures with an initial OD600 of 0.1 in 50 mL of MSM in 500 mL baffled shake flasks. For defined hydrocarbon degradation, 1% (v/v) hexadecane (Sigma-Aldrich, St. Louis, MO, USA) was added to 1000 mL shake flasks containing 100 mL of MSM after inoculation, mixed well, and incubated at 37 °C and 120 rpm. For further hydrophobicity approaches, a diluted suspension (1:2.5) of polystyrene beads (LB30, Sigma-Aldrich Chemie GmbH, St. Louis, MO, USA) in different amounts of 1, 5, and 10% (v/v) was added to the MSM before inoculation, mixed well, and incubated at 37 °C and 120 rpm. Sampling was performed in intervals of 3 h to determine the OD600 using a spectrophotometer (Biochrom WPA CO8000, Biochrom Ltf., Cambridge, UK), LPs concentration, and glucose using HPTLC measurement. All cultivations were carried out in biological duplicates. For the proteome studies of the hydrophobicity approaches, samples (5 mL) were taken at the late exponential growth phase compared to control cultivations without polystyrene beads. The cell pellet obtained by centrifugation was subjected to mass spectrometric analyses. These cultivations were carried out in biological triplicates.

2.8. Liquid Chromatography-Electrospray Ionization Tandem Mass Spectrometry (LC-ESI-MS/MS)

Lipopeptides analyzed by HPTLC were also subjected to LC-ESI-MS/MS analysis. The LC-ESI-MS/MS analysis of lipopeptides was performed on a 1290 UHPLC system (Agilent, Waldbronn, Germany) coupled to a Q-Exactive Plus Orbitrap mass spectrometer equipped with a heated electrospray ionization (HESI) source (Thermo Fisher Scientific, Bremen, Germany). Lipopeptide separation was achieved using an ACQUITY CSH C18 column (1.7 μm, 2.1 μm × 150 mm, Waters, Eschborn, Germany). The column temperature was maintained at 40 °C. 10 µL of each sample was injected. Mobile phase A was 0.2% formic acid in water, and mobile phase B was 0.2% formic acid in acetonitrile. A constant flow rate of 0.3 mL/min was used, and the gradient elution was performed as follows: 40–70% B from 0 to 12 min, 70–95% B from 12 to 20 min, isocratic at 95% B from 20 to 24 min, the system was returned to initial conditions from 95% B to 40% B from 24 to 26 min. The HESI source was operated in positive ion mode, with both a spray voltage of 4.20 kV and an ion transfer capillary temperature of 360 °C. The sweep gas and auxiliary pressure rates were set to 60 and 20, respectively. The S-Lens RF level was 50%, and the auxiliary gas heater temperature was 150 °C. The Q-Exactive Plus mass spectrometer was calibrated externally in positive ion mode using the manufacturers calibration solutions (Pierce/Thermo Fisher Scientific, Waltham, MA, USA). Mass spectra were acquired within the mass range of 500 to 1600 m/z at a resolution of 70,000 FWHM using an Automatic Gain Control (AGC) target of 1.0 × 10⁶ of and 100 ms maximum ion injection time. Data-dependent MS/MS spectra in a mass range of 50 to 1600 m/z were generated for the five most abundant precursor ions with a resolution of 17,500 FWHM using an AGC target of 3.0 × 10⁶, 100 ms maximum ion injection time, and a stepped collision energy of 15, 30, and 45. Xcalibur™ software version 4.3.73.11 (Thermo Fisher Scientific, San Jose, CA, USA) was used for data acquisition and data analysis. Assignments of individual lipopeptides were based on the precise m/z value of the precursor ion, manual inspection of corresponding MS/MS spectra, and comparison with MS/MS spectra from available standard lipopeptide mixtures of surfactin, fengycin, and iturin (Sigma-Aldrich, Darmstadt, Germany) and the literature [41,42,43,44].

2.9. Extraction of Hexadecane and Calculation of Biodegradation Efficiency

In order to analyze the biodegradation efficiency of hydrocarbons with long carbon chains, the strains were inoculated in 10 mL of MSM containing 8 g/L glucose and 1% (v/v) hexadecane in 100 mL baffled shake flasks (as described in the subsection on shake flask cultivation conditions) and cultivated for 5 days. The remaining n-alkanes were extracted from 10 mL cultures with 10 mL of n-hexane before and after incubation. The suspensions were shaken at 180 rpm for 30 min and were left overnight to be separated into two different phases. The upper phase was taken and reached the final volume of 10 mL with n-hexane. A quantitative measurement of the remaining hexadecane was performed by gas chromatography-mass spectrometry (GC-MS/MS). An abiotic culture was studied as a negative control [45,46]. Cultivations were carried out in biological duplicates.
The conditions for GC-MS/MS were as follows: Agilent 7890B; Autosampler: Agilent 7693A; MS: Agilent 7000D mass spectrometer triple-quadrupole; gas chromatograph: column: Agilent HP-5MS UI, 30 m × 250 µm × 0.25 µm; oven: 80 °C (1 min)–15 °C/min–280 °C (5 min); injector: 250 °C; injection volume: 1 µL; pulsed split, split ratio: 100: 1; transfer line: 270 °C; flow: 1 mL/min; carrier gas: helium; mass spectrometer source: EI, 270 °C, 70 eV; quadrupole: 150 °C; MS1-Scan: m/z 35–350; and software: MassHunter Workstation (Agilent, version 10, 2019). The area (m/z 71) obtained from gas chromatography related to after the incubation period was divided by the area before incubation to calculate biodegradation efficiency.

2.10. Calculation of Yield and Productivity

The yield of product per biomass (YP/X) and specific productivity (qP/X) were determined using the following Equations (1) and (2) to study the ability of each strain to produce lipopeptides [47]. In detail, Pmax represents the maximum product concentration (g/L) reached in the cultivation process, while XPmax is the biomass achieved at the time point of maximum product formation. Accordingly, the specific productivity qP/X describes the productivity of biomass of the whole process (Δt), taking the maximum CDW (cell dry weight) and product concentration in consideration.
Y P / X = P X | P = P m a x
q P / X   o v e r a l l = P m a x X P m a x · Δ t

2.11. Sample Preparation for Mass Spectrometric Proteome Determination

Cell pellets were lysed in 4% (w/v) SDS and 100 mM Tris-HCl (pH 8.5) for 5 min at 95 °C. Lysates were cleared by centrifugation at 20,000 rpm, and protein concentrations of the supernatants were adjusted to 1 µg/µL with 4% (w/v) SDS and 100 mM Tris-HCl (pH 8.5). Lysates were reduced and alkylated in 10 mM tris(2-carboxyethyl)phosphine and 40 mM chloroacetamide for 20 min at 60 °C in the dark. Subsequently, 20 µL of the cleared lysate was used for protein extraction by Single-Pot Solid-Phase-enhanced Sample Preparation (SP3; 1:1 Mixture of SpeedBeads™ magnetic carboxylate modified particles 50mg/mL; Cytiva; CAT No: 45152105050250 and 65152105050250) [48]. Proteins were bound to the magnetic beads by adding ethanol to a final concentration of 80%. Bead-bound proteins were washed twice with 80% ethanol in 50 mM Tris-HCl (pH 8.5) and digested on the beads using 0.2% sodium deoxycholate and 50 mM ammonium bicarbonate in a protease-to-protein ratio of 1:100 trypsin (Roche) and 1:200 LysC (Walko), respectively (20 h, 37 °C, 800 rpm). Formic acid (FA) and acetonitrile (ACN) were added to the samples to a final concentration of 0.5% and 96%, respectively. Samples were washed on a magnetic rack three times with 98% ACN and 0.05% FA. Peptides were eluted from the beads in water and lyophilized. Peptides were solubilized in 0.1% trifluoroacetic acid (TFA) prior to LC-MS/MS analysis.

2.12. LC-MS/MS Analysis

NanoLC-ESI-MS/MS experiments were performed on an Ultimate 3000 nano-RSLC (Thermo Fisher Scientific) coupled to an Exploris 480 mass spectrometer (Thermo Fisher Scientific) using a Nanospray-Flex ion source (Thermo Fisher Scientific). Peptides were concentrated and desalted on a µPAC trapping column (Thermo Fisher Scientific) and separated on a 50 cm μPAC C18 microchip nano-LC column (Thermo Fisher Scientific) operated at a constant temperature of 40 °C. Peptides were separated using a gradient with the following profile: 2–8% solvent B for 3 min, 8–20% solvent B for 27 min, 20–35% solvent B for 8 min, 35–95% solvent B for 3 min, isocratic 96% solvent B for 4 min, 96–2% for 5 min, and isocratic 2% solvent B for 10 min. The solvents used were 0.1% FA (solvent A) and 0.1% FA in ACN/H2O (80/20, v/v, solvent B). Flow gradients from 700 nL/min to 300 nl/min within the first 3 min and from 300 nL/min to 700 nl/min between 45 min and 50 min in the gradient were applied. MS spectra (m/z = 300–1500) were detected in the Orbitrap at a resolution of 60,000 (m/z = 200). The maximum injection time (MIT) for the MS spectra was set to 50 ms, and the automatic gain control (AGC) value was set to 3 × 10⁶. The internal calibration of the Orbitrap analyzer was performed using lock-mass ions from ambient air as described in Olsen et al. [49]. The MS was operating in data-dependent mode, selecting the top 20 highest abundant peptide precursor signals for fragmentation (HCD, normalized collision energy of 30). For MS/MS analysis, only undetermined charge states and charge states from 2 to 5 were considered. The monoisotopic precursor selection was set to peptides, and the minimum intensity threshold was set to 1 × 10⁵. MS/MS scans were performed in the Orbitrap with a resolution of 150,000, while isolation width was set to 1.6 Da. The AGC target was set to 7.5 × 10⁴, the max injection time was set to 40 ms, and the first mass was set to 120 m/z. Dynamic exclusion was set to 60 s with a tolerance of 10 ppm.

2.13. MS Data Analysis and Protein Quantification

The samples were analyzed using MaxQuant [50] version 2.0.1.0. Protein identification in MaxQuant was performed using the integrated database search [51]. MS/MS spectra were searched against the Bacillus subtilis (strain 168) protein sequence database downloaded from UniProt [52]. Mass tolerances of 4.5 ppm (parts per million) for MS spectra and 20 ppm for MS/MS spectra were used. Trypsin was specified as an enzyme, and two missed cleavages were allowed. The carbamidomethylation of cysteine was set as a fixed modification, and protein N-terminal acetylation and methionine oxidation were allowed as variable modifications. The “match between runs” feature of MaxQuant was enabled with a match time window of 0.7 min and an alignment time window of 20 min. The peptide false discovery rate (FDR) and protein FDR thresholds were set to 0.01. Protein quantification in MaxQuant was performed by label-free quantification (LFQ) with the LFQ min. ratio count set to one. Two-sample Welch’s t-tests were performed using Perseus version 1.6.14.0 [53]. Matches to contaminants (e.g., keratins and trypsin) and reverse databases identified by MaxQuant were excluded from further analysis. First, normalized LFQ values were log2-transformed. Data sets were filtered for at least 3 valid values in at least one group of replicates. The remaining missing values were imputed in R (https://www.r-project.org, version 3.6.2, accessed on 16 June 2020) using the QRILC (Quantile Regression Imputation of Left-Censored data) function in the imputeLCMD package with a tune sigma value of one. Significant changes in protein abundance were analyzed by Welch’s t-test (two-sided, S0 = 0.5) and corrected for multiple hypothesis testing using permutation-based FDR statistics (FDR = 0.01, 250 permutations). The mass spectrometry proteomics data will be deposited into the ProteomeXchange Consortium via PRIDE [54].

3. Results

3.1. Characterization of the Crude-Oil-Degrading and Biosurfactant-Producing Strains Isolated from Crude-Oil-Exposed Environments

Out of the 29 isolates obtained from various soil and wastewater samples contaminated with crude oil, one particular isolate named P7, derived from wastewater samples, demonstrated positive outcomes across all screening methods (Supplementary Materials S1 and S2). The isolate P7 was characterized as a Gram-positive, spore-forming strain capable of crude oil degradation as the sole carbon and energy source. Based on 16S rRNA analysis, strain P7 with gene bank accession number of ON652357 could be specified as Bacillus subtilis. Together with another strain isolated from soil contaminated with crude oil, previously introduced as B. subtilis ZH1 [32] with the gene bank accession number ON678054, both strains showed similar positive screening results in initial cultivations using mineral salt medium containing 1% (v/v) crude oil as the sole carbon and energy source. Accordingly, crude oil hydrophobic droplets were dispersed into the medium due to the bioproduction of bioactive substances produced by strains P7 and ZH1 which stabilized the emulsion. The direct measurement of the surface tension confirmed that the culture supernatant of both B. subtilis ZH1 and P7 was able to decrease surface tension by 26.5 and 27 mN/m, respectively. The DSMZ (German Collection of Microorganisms and Cell Cultures GmbH) IDs for Bacillus subtilis P7 and ZH1 are 11744 and 11741, respectively.

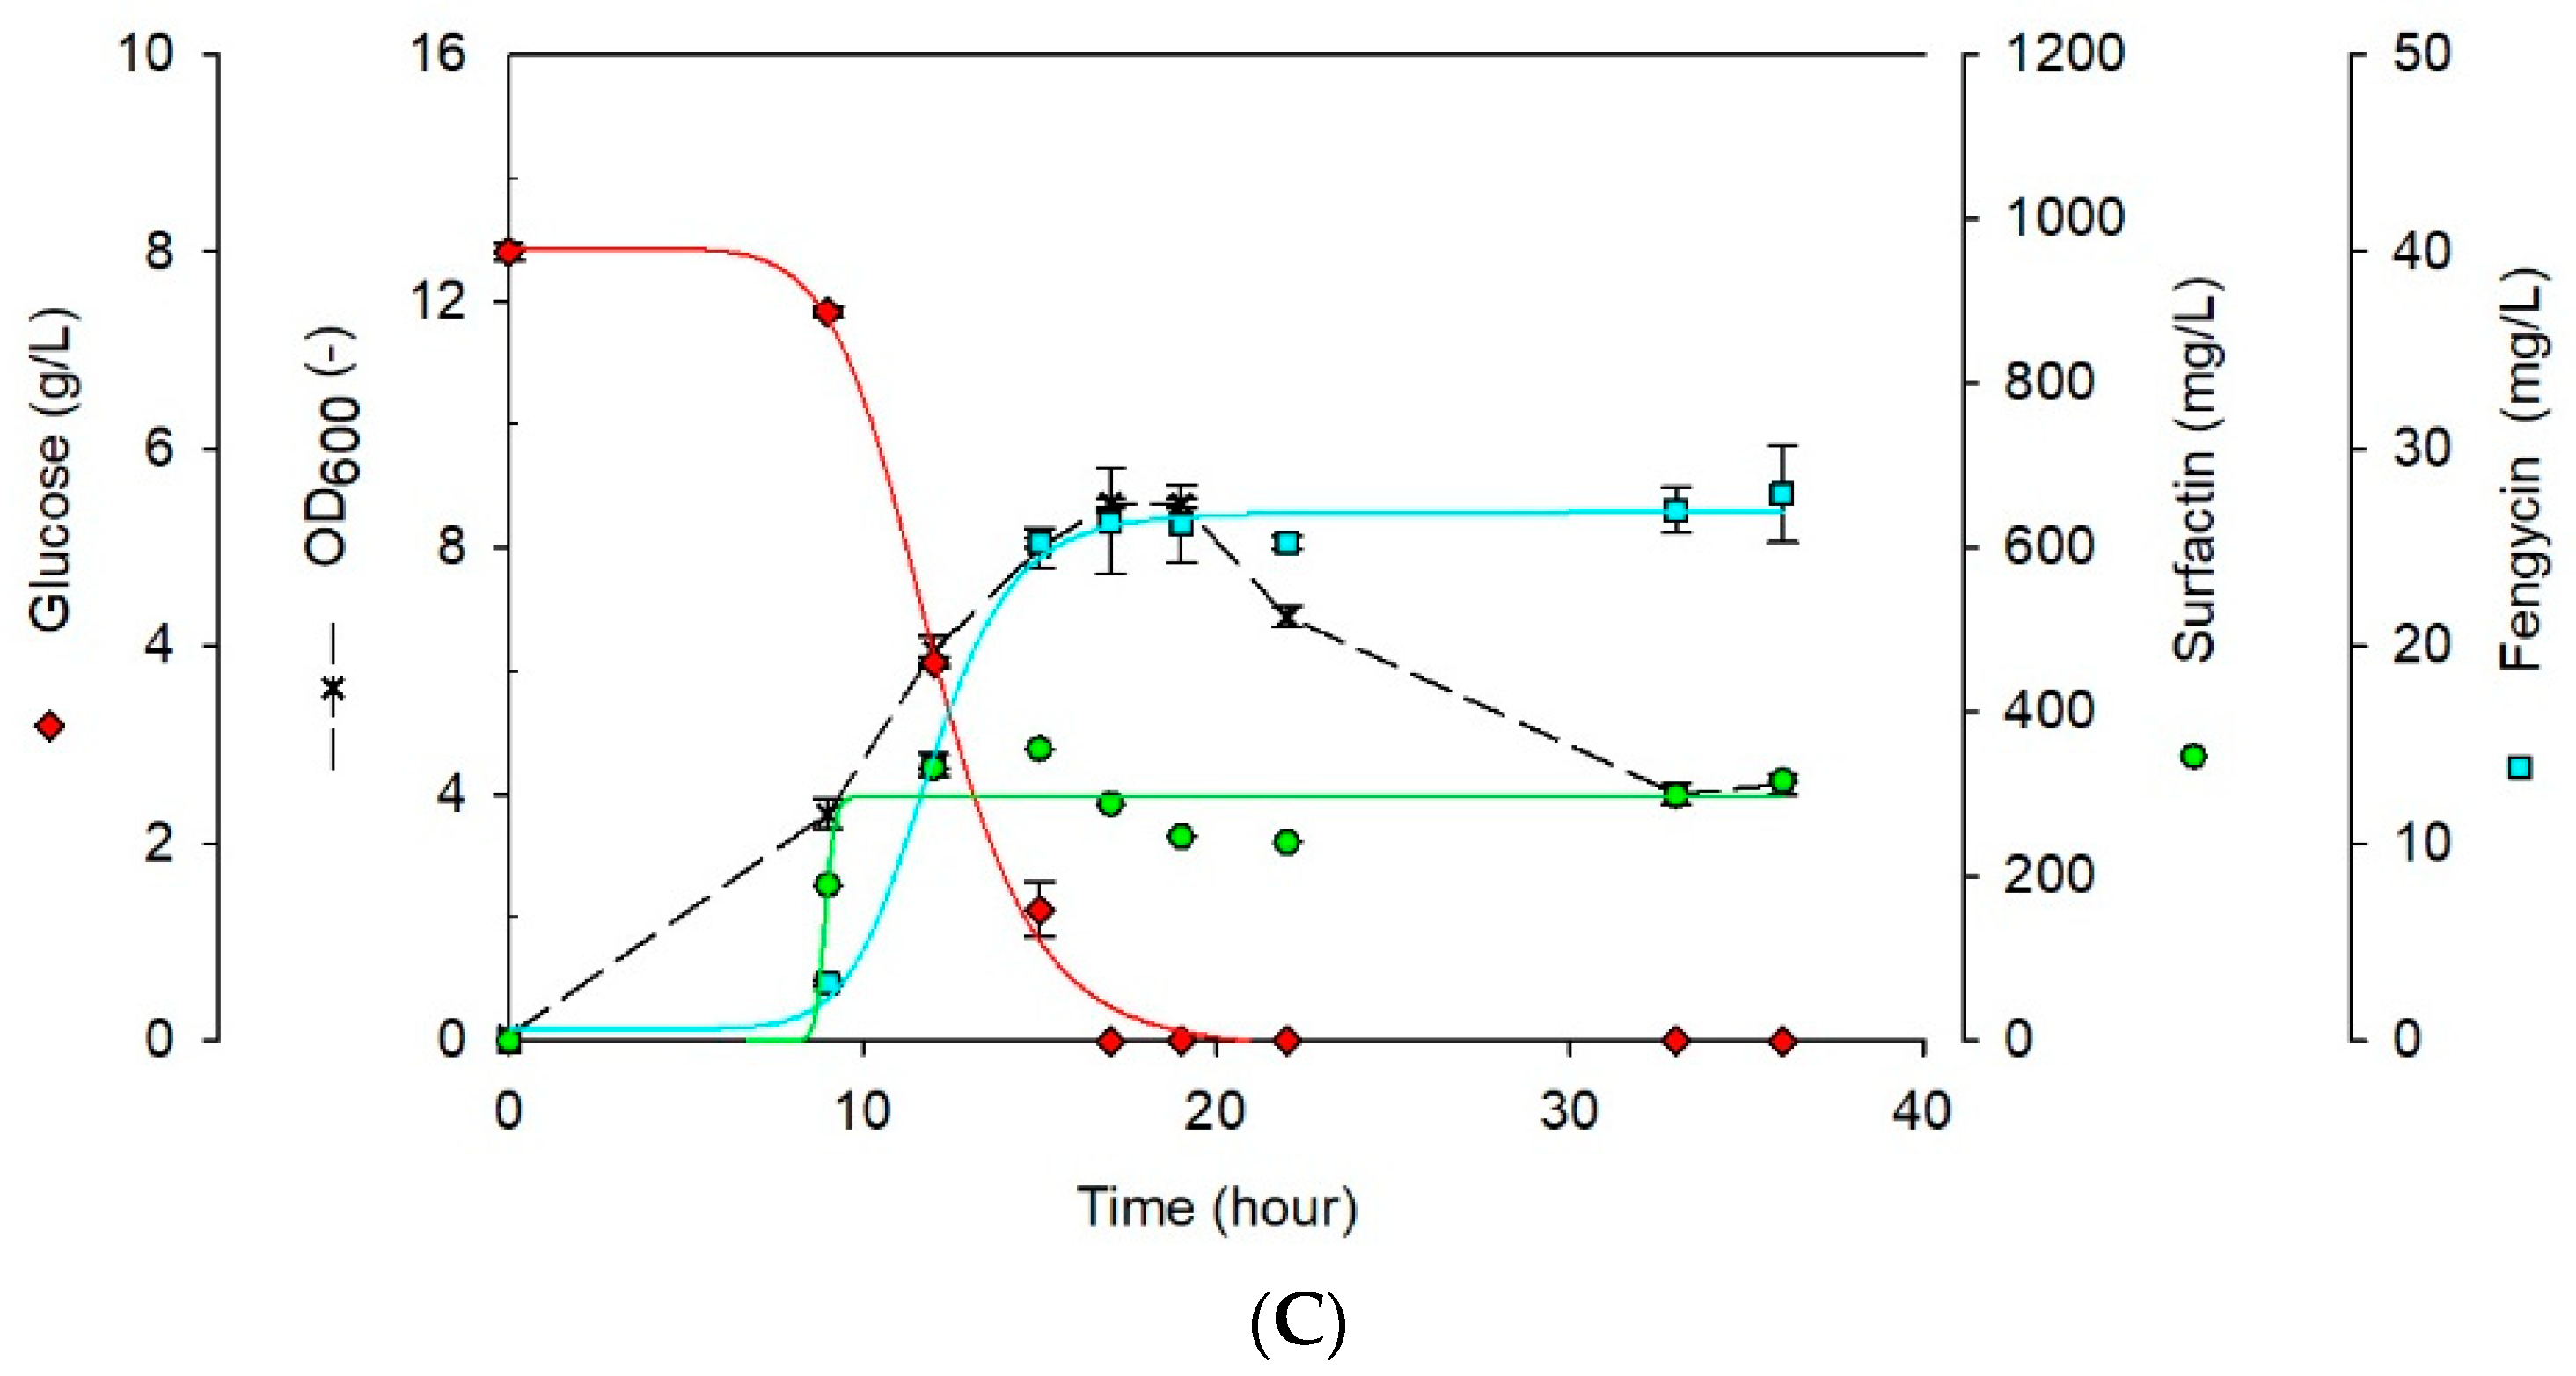
3.2. Lipopeptide Production by B. subtilis Strains ZH1 and P7

The B. subtilis strains ZH1 and P7 were cultivated in defined mineral salt medium to allow for the quantitative measurement of lipopeptide bioproduction. In addition, B. subtilis DSM10T was used as a control wild-type strain, which was previously characterized as a surfactin-producing strain [55,56]. Using quantitative HPTLC measurement and mass spectrometric determination, the lipopeptides surfactin and fengycin were detected for both strains, ZH1 and P7, using corresponding lipopeptide standards as previously described [8], while no representative of the iturin family could be identified. To discern more information about the lipopeptide production capabilities of the isolated B. subtilis strains ZH1 and P7, their bioproduction was compared to that of the wild-type control strain B. subtilis DSM10T. In more detail, B. subtilis ZH1, P7, and DSM10T produced a maximum of 1.052, 0.817, and 0.355 g/L surfactin, respectively, during the exponential growth phase (15 h) and 15.72, 10.553 and 27.71 mg/L fengycin, respectively, with 8 g/L glucose as the sole carbon source (Figure 1).

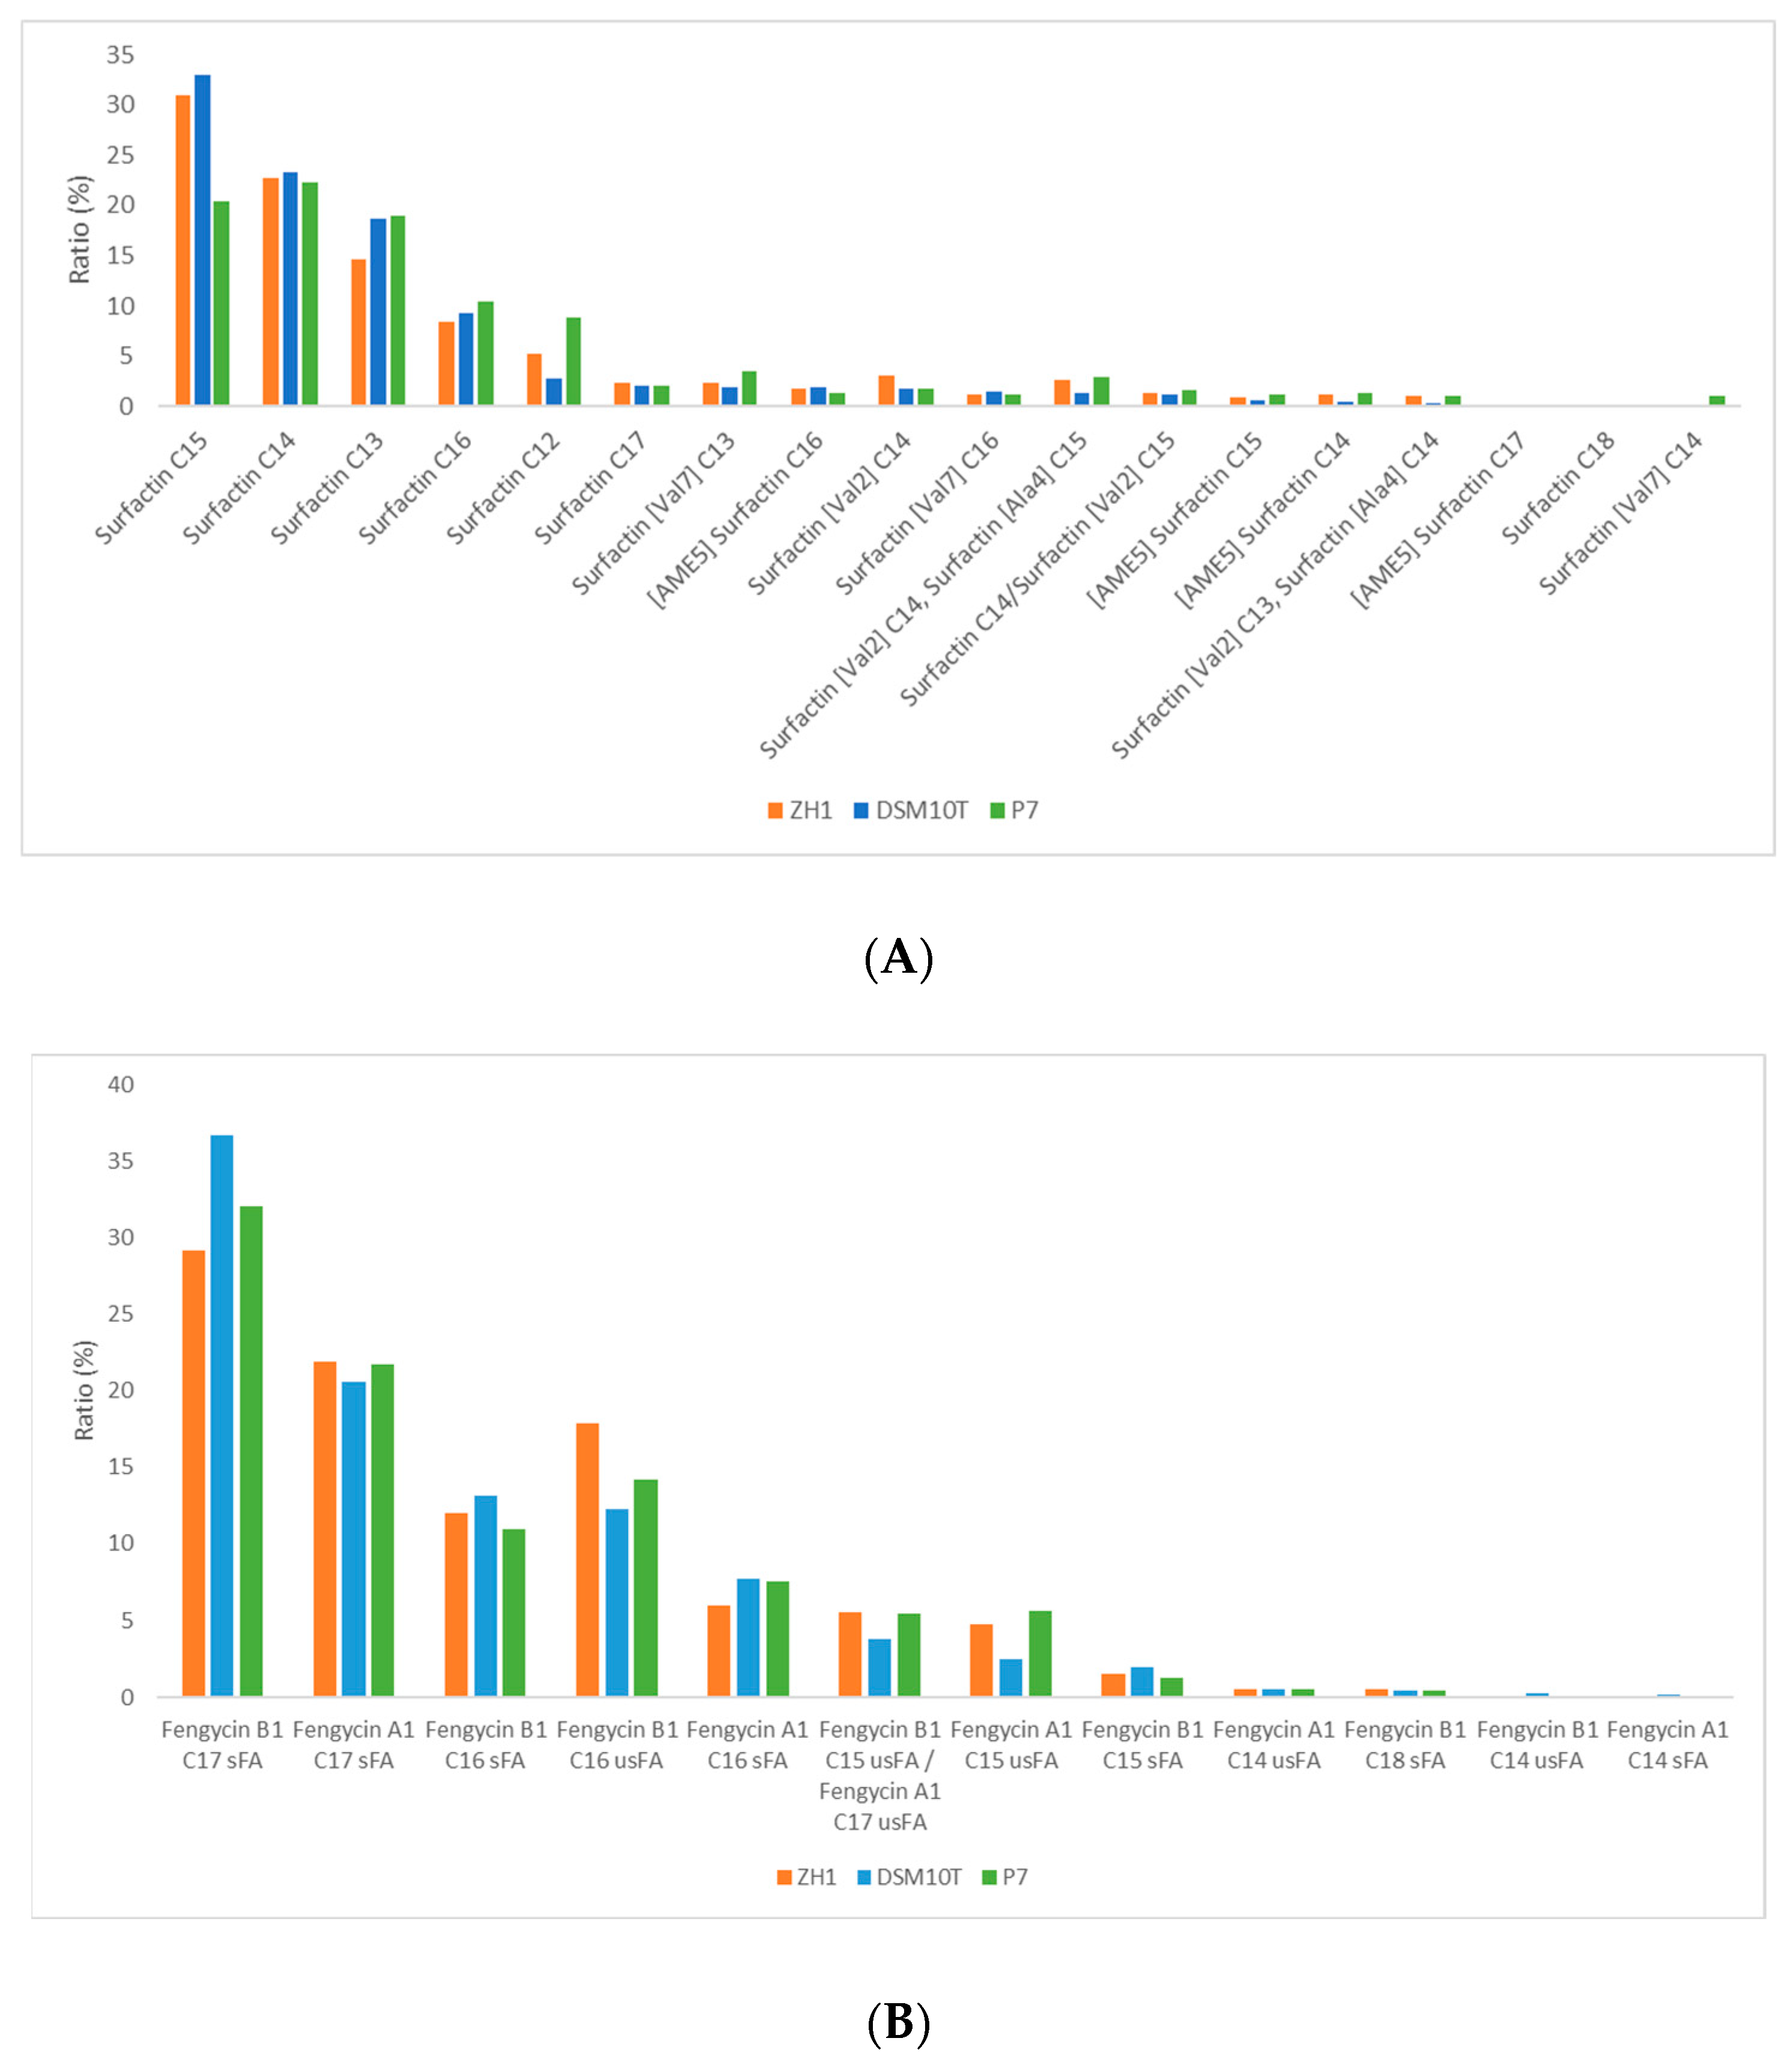
3.3. Comparative Mass Spectrometric Analyses of Lipopeptide Variants Produced by B. subtilis Isolates ZH1 and P7

To analyze the production of surfactin and fengycin variants in the cultivation process in more detail, lipopeptide samples obtained from cultivations of B. subtilis strains ZH1 and P7, and the control strain DSM10T were taken after 15 h of cultivation and analyzed by liquid chromatography-electrospray mass spectrometry (LC-ESI-MS/MS). The relative abundance of lipopeptide variants was calculated using their corresponding peak areas. Overall, the three strains showed similar chromatographic profiles (Supplementary Material S3), including surfactin and fengycin lipopeptides, while bacillomycin D/iturin lipopeptides were absent.
Surfactin variants with a C12–C18 fatty acid chain were detected at the retention times from 9 to 17 min, as well as corresponding m/z values from m/z = 994.64 to 1064.72. Surfactin variants with amino acid substitutions like [Val2] or [Val7] were quantified separately if they could be identified unambiguously by MS2 spectra. Surfactin C15 was the most abundant version in DSM10T and ZH1 (33.03% and 31.01%), while surfactin C14 was the most abundant version in P7 (22.27%). The percentage proportion of the individual surfactin variants in the three strains is shown in Figure 2.
Fengycin lipopeptides were detected at retention times from 3 to 12 min, with corresponding m/z values from m/z = 1408.88 to 1537.87. Slight variations were observed in the distributions of some fengycin variants, as well as variations in saturated and unsaturated fatty acid chains within the fengycin lipopeptides (the ratio of unsaturated to saturated fatty acid was 18.77: 81.22%; 25.9: 74.09%; and 28.77: 71.22% in DSM10T, P7, and ZH1). Nevertheless, no striking differences comparing the different strains could be detected. In more detail, fengycin B1 C17 with an saturated fatty acid chain exhibited the highest abundance in DSM10T (36.70%), P7 (32.09%), and ZH1 (29.21%). Conversely, fengycin B1 C16, with an unsaturated fatty acid chain was the least abundant in DSM10T (12.25%), P7 (14.19%), and ZH1 (17.86%) (Figure 2).

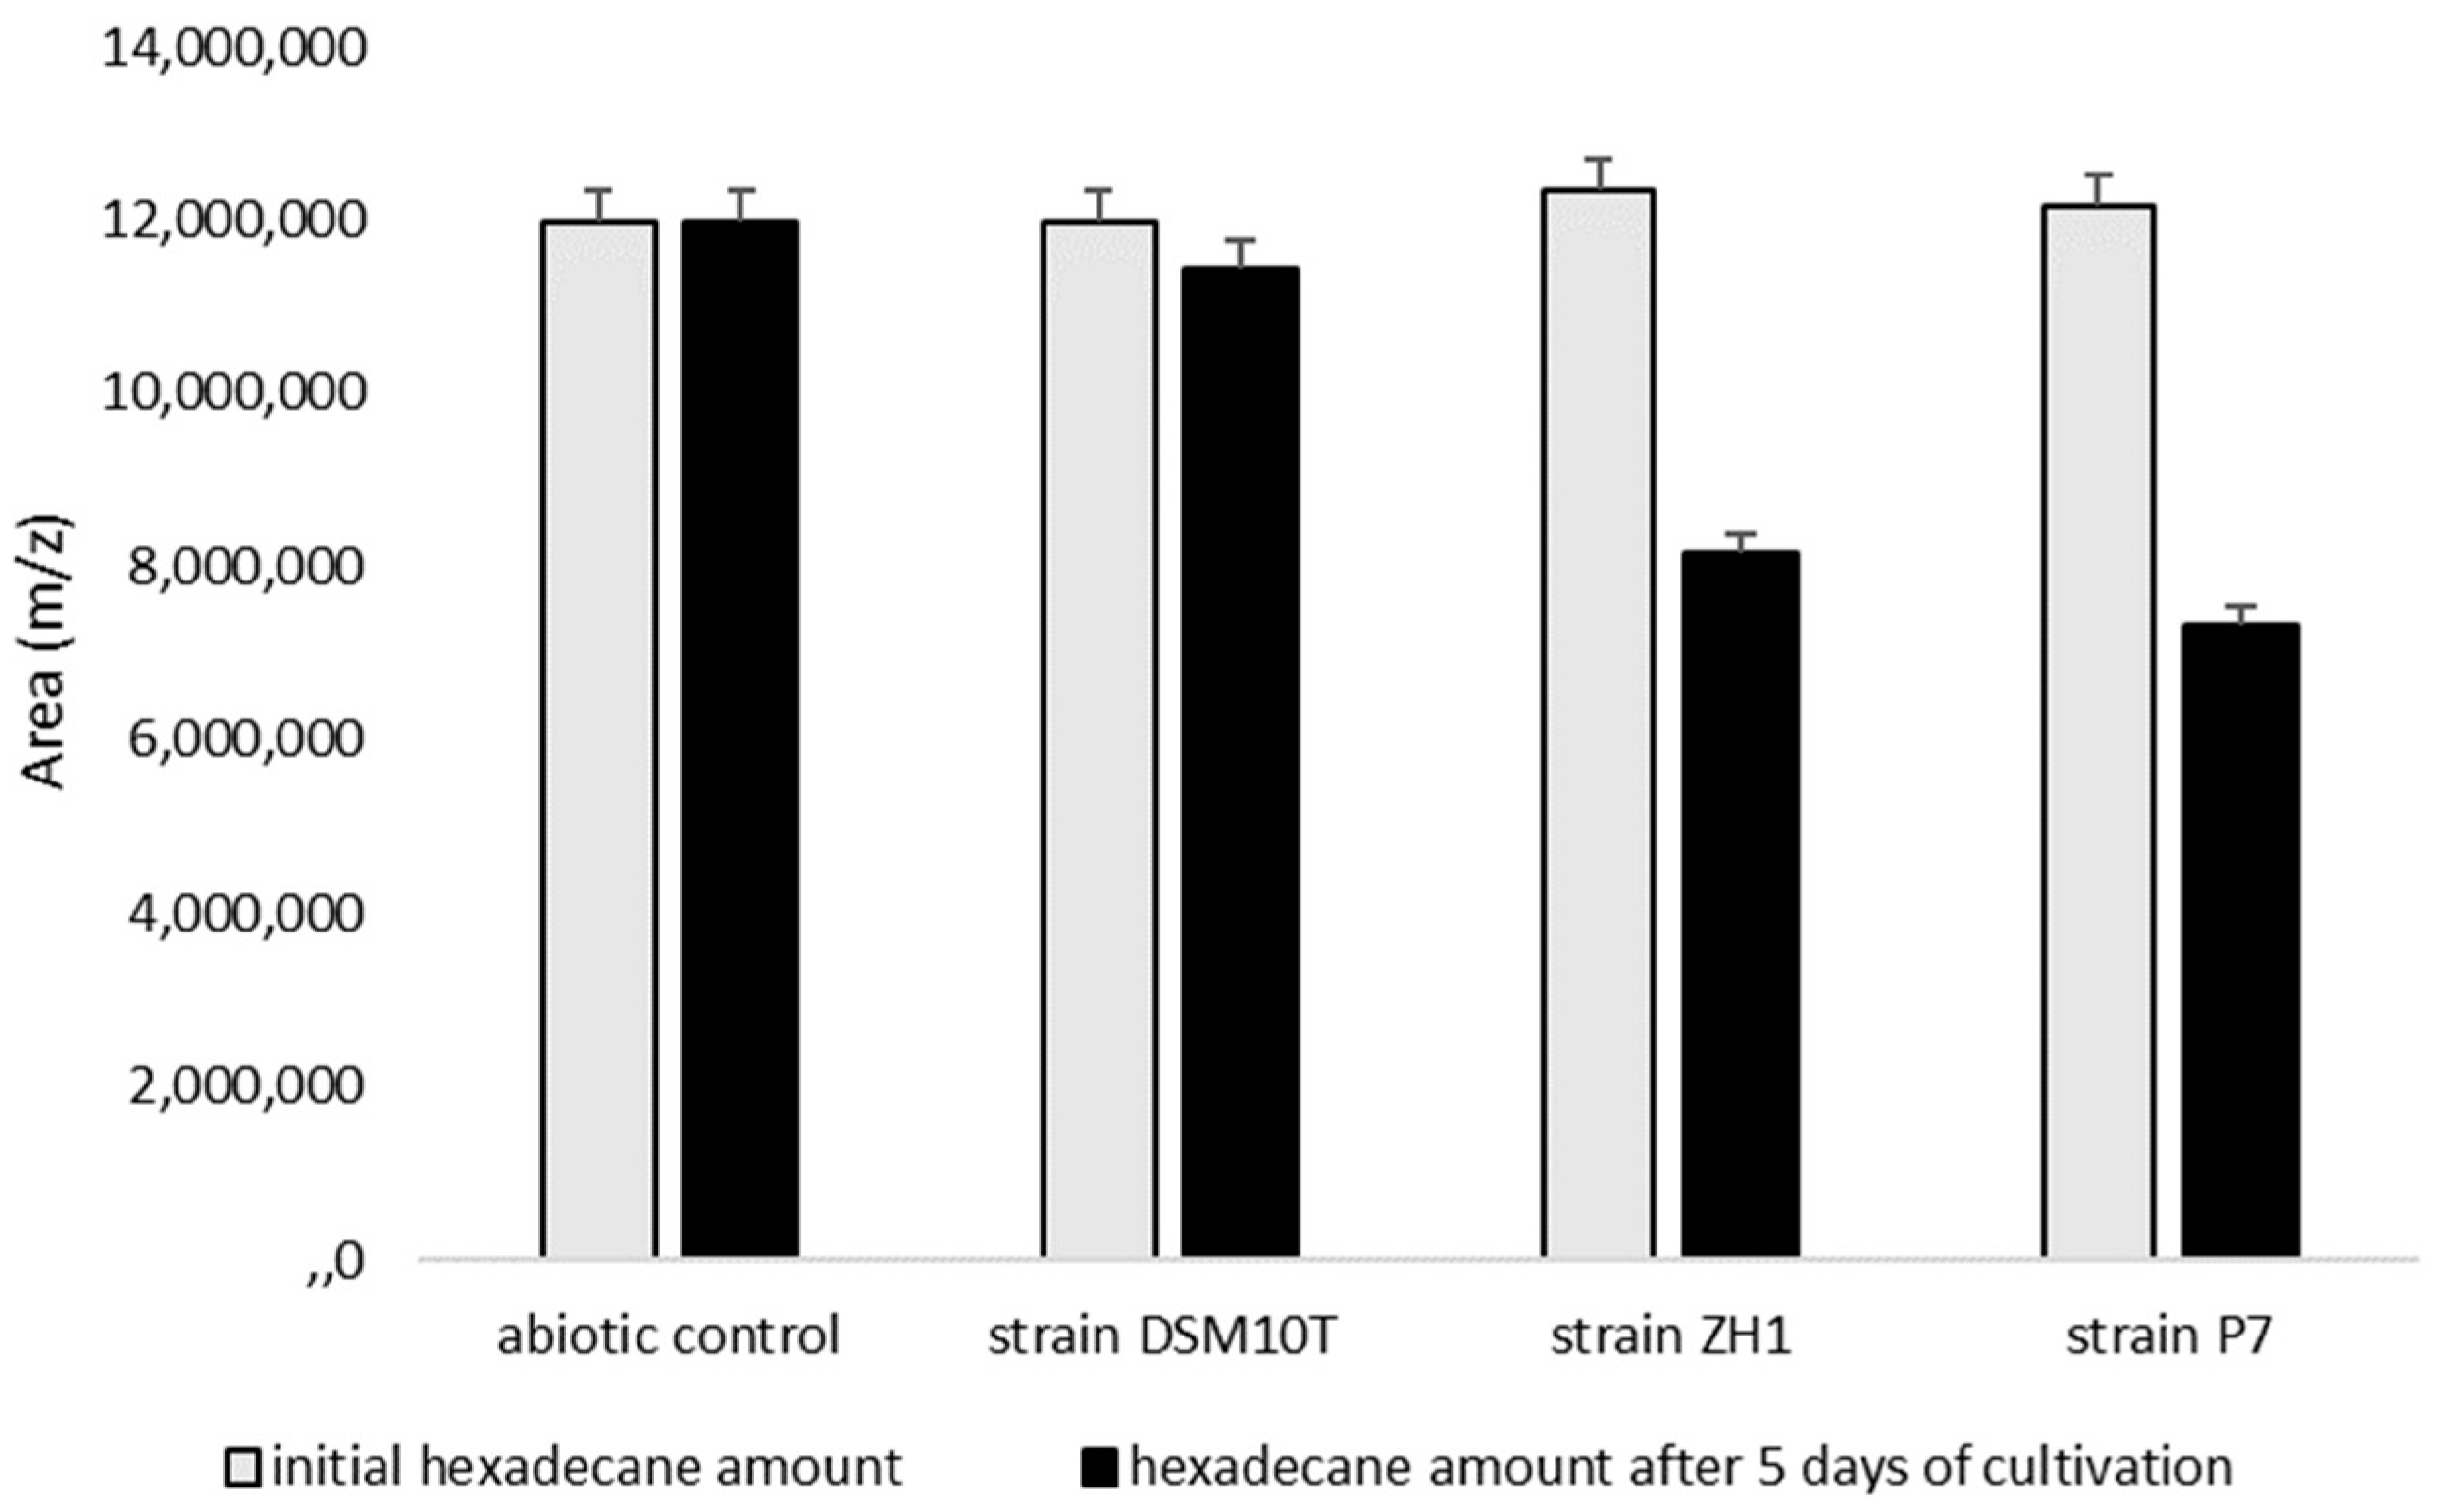
3.4. Degradation of Hexadecane as a Hydrophobic Substrate by B. subtilis Strains ZH1 and P7

Since B. subtilis strains ZH1 and P7 were isolated from crude-oil-exposed environments, the capability of degrading hydrophobic substrates is reasonable. To verify this assumption, cultivation in defined mineral salt medium using glucose (8 g/L) as a carbon source was combined with the supplementation of hexadecane (1% v/v) as a defined hydrocarbon.
In more detail, a higher biomass formation could be detected for the strains ZH1 (+26%) and P7 (+33%) in cultivations with hexadecane supplementation, showing a diauxic growth behavior after about 15 h of cultivation in comparison to the control cultivations without hexadecane (Supplementary Material S4). In contrast, no additional biomass formation could be detected for the control strain DSM10T (Table 1). Accordingly, the improved biomass formation of the strains ZH1 and P7 might be due to the strain-specific degradation of hexadecane and its corresponding use as an alternative carbon and energy source after glucose depletion. To verify this hypothesis, hexadecane was extracted by n-hexane before and after 5 days of incubation and analyzed by gas chromatography. The determined hydrocarbon content showed that both B. subtilis strains ZH1 and P7 were able to degrade parts of the initial 1% (v/v) hexadecane after 5 days of incubation, while no decrease in hexadecane could be detected after cultivation with the B. subtilis control strain DSM10T (Figure 3). Specifically, the chromatographic analysis showed several detectable peaks after cultivation with strains ZH1 and P7, while only a single peak was detectable in the abiotic control cultivation, indicating the presence of degradation products (Supplementary Material S5). The corresponding hexadecane degradation efficiencies were calculated to be 34.03, 39.89, and 4.53% for the B. subtilis strains ZH1 and P7, and the control strain DSM10T. Interestingly, with respect to the lipopeptide bioproduction, a decrease in surfactin productivity of 33% and 44% was detected for ZH1 and P7, respectively, compared to the control cultivations, while the DSM10T control strain showed comparable surfactin production (Table 1).
Interestingly, in contrast to surfactin, an improved fengycin productivity was determined with 60%, 5%, and 12% higher specific productivity in the hexadecane-supplemented approach compared to the control cultivation (Table 1). The contrary effects of hexadecane supplementation on surfactin and fengycin bioproduction confirm the different molecular regulatory control mechanisms involved in the expression of the surfactin- and fengycin-forming non-ribosomal peptide synthetases in B. subtilis [8,56].

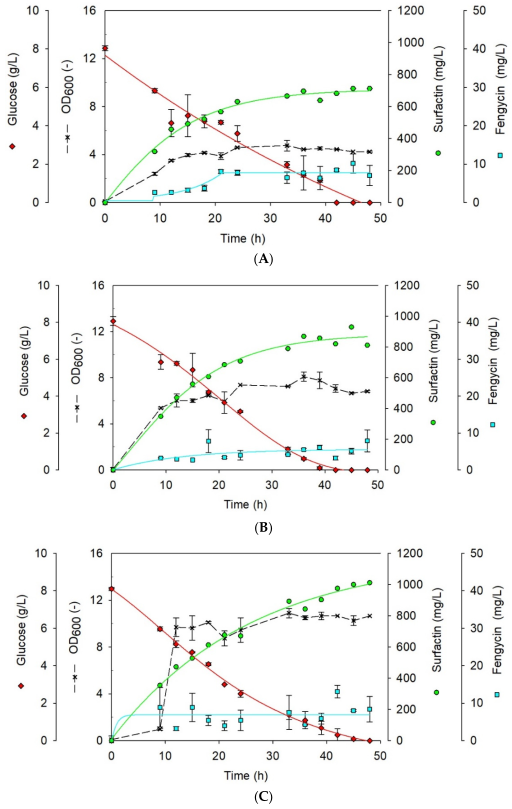
3.5. Effect of Hydrophobic Environment on Surfactin Production

Since the supplementation of hexadecane as a hydrophobic carbon source influenced the lipopeptide production, another external factor for increasing the hydrophobicity in the cultivation medium was introduced. Therefore, polystyrene beads (size, 3 μm diameter) were added at 1, 5, and 10% (v/v) to the cultivation medium. The strain ZH1 was used to study the effects on microbial lipopeptide bioproduction, as this strain showed high surfactin productivity in previous cultivation approaches.
In detail, the more polystyrene beads used, the higher the biomass formation observed (Figure 4). With respect to the surfactin production, the strain ZH1 produced 712.67 mg/L (53.12 mg/L associated with 1% polystyrene bead and 659.55 mg/L present in the cultivation broth) after 45 h of cultivation, while the control process resulted in a maximum of 1052.23 mg/L surfactin after 15 h of cultivation. Although higher total quantities of surfactin were detected when higher bead amounts were used, the specific productivity was reduced due to the additionally improved cell growth (Table 2). Overall, the surfactin concentrations detected in all polystyrene-bead-supplemented cultivations (1, 5, and 10% (v/v)) were still less compared to the control cultivation without the addition of polystyrene beads.
Similarly, the fengycin concentrations detected in all polystyrene-bead-supplemented cultivations were less compared to the control without polystyrene beads. In detail, an overall maximum of 13.11 mg/L fengycin was detected in 10% polystyrene-bead-supplemented cultivations after 42 h (Table 2).

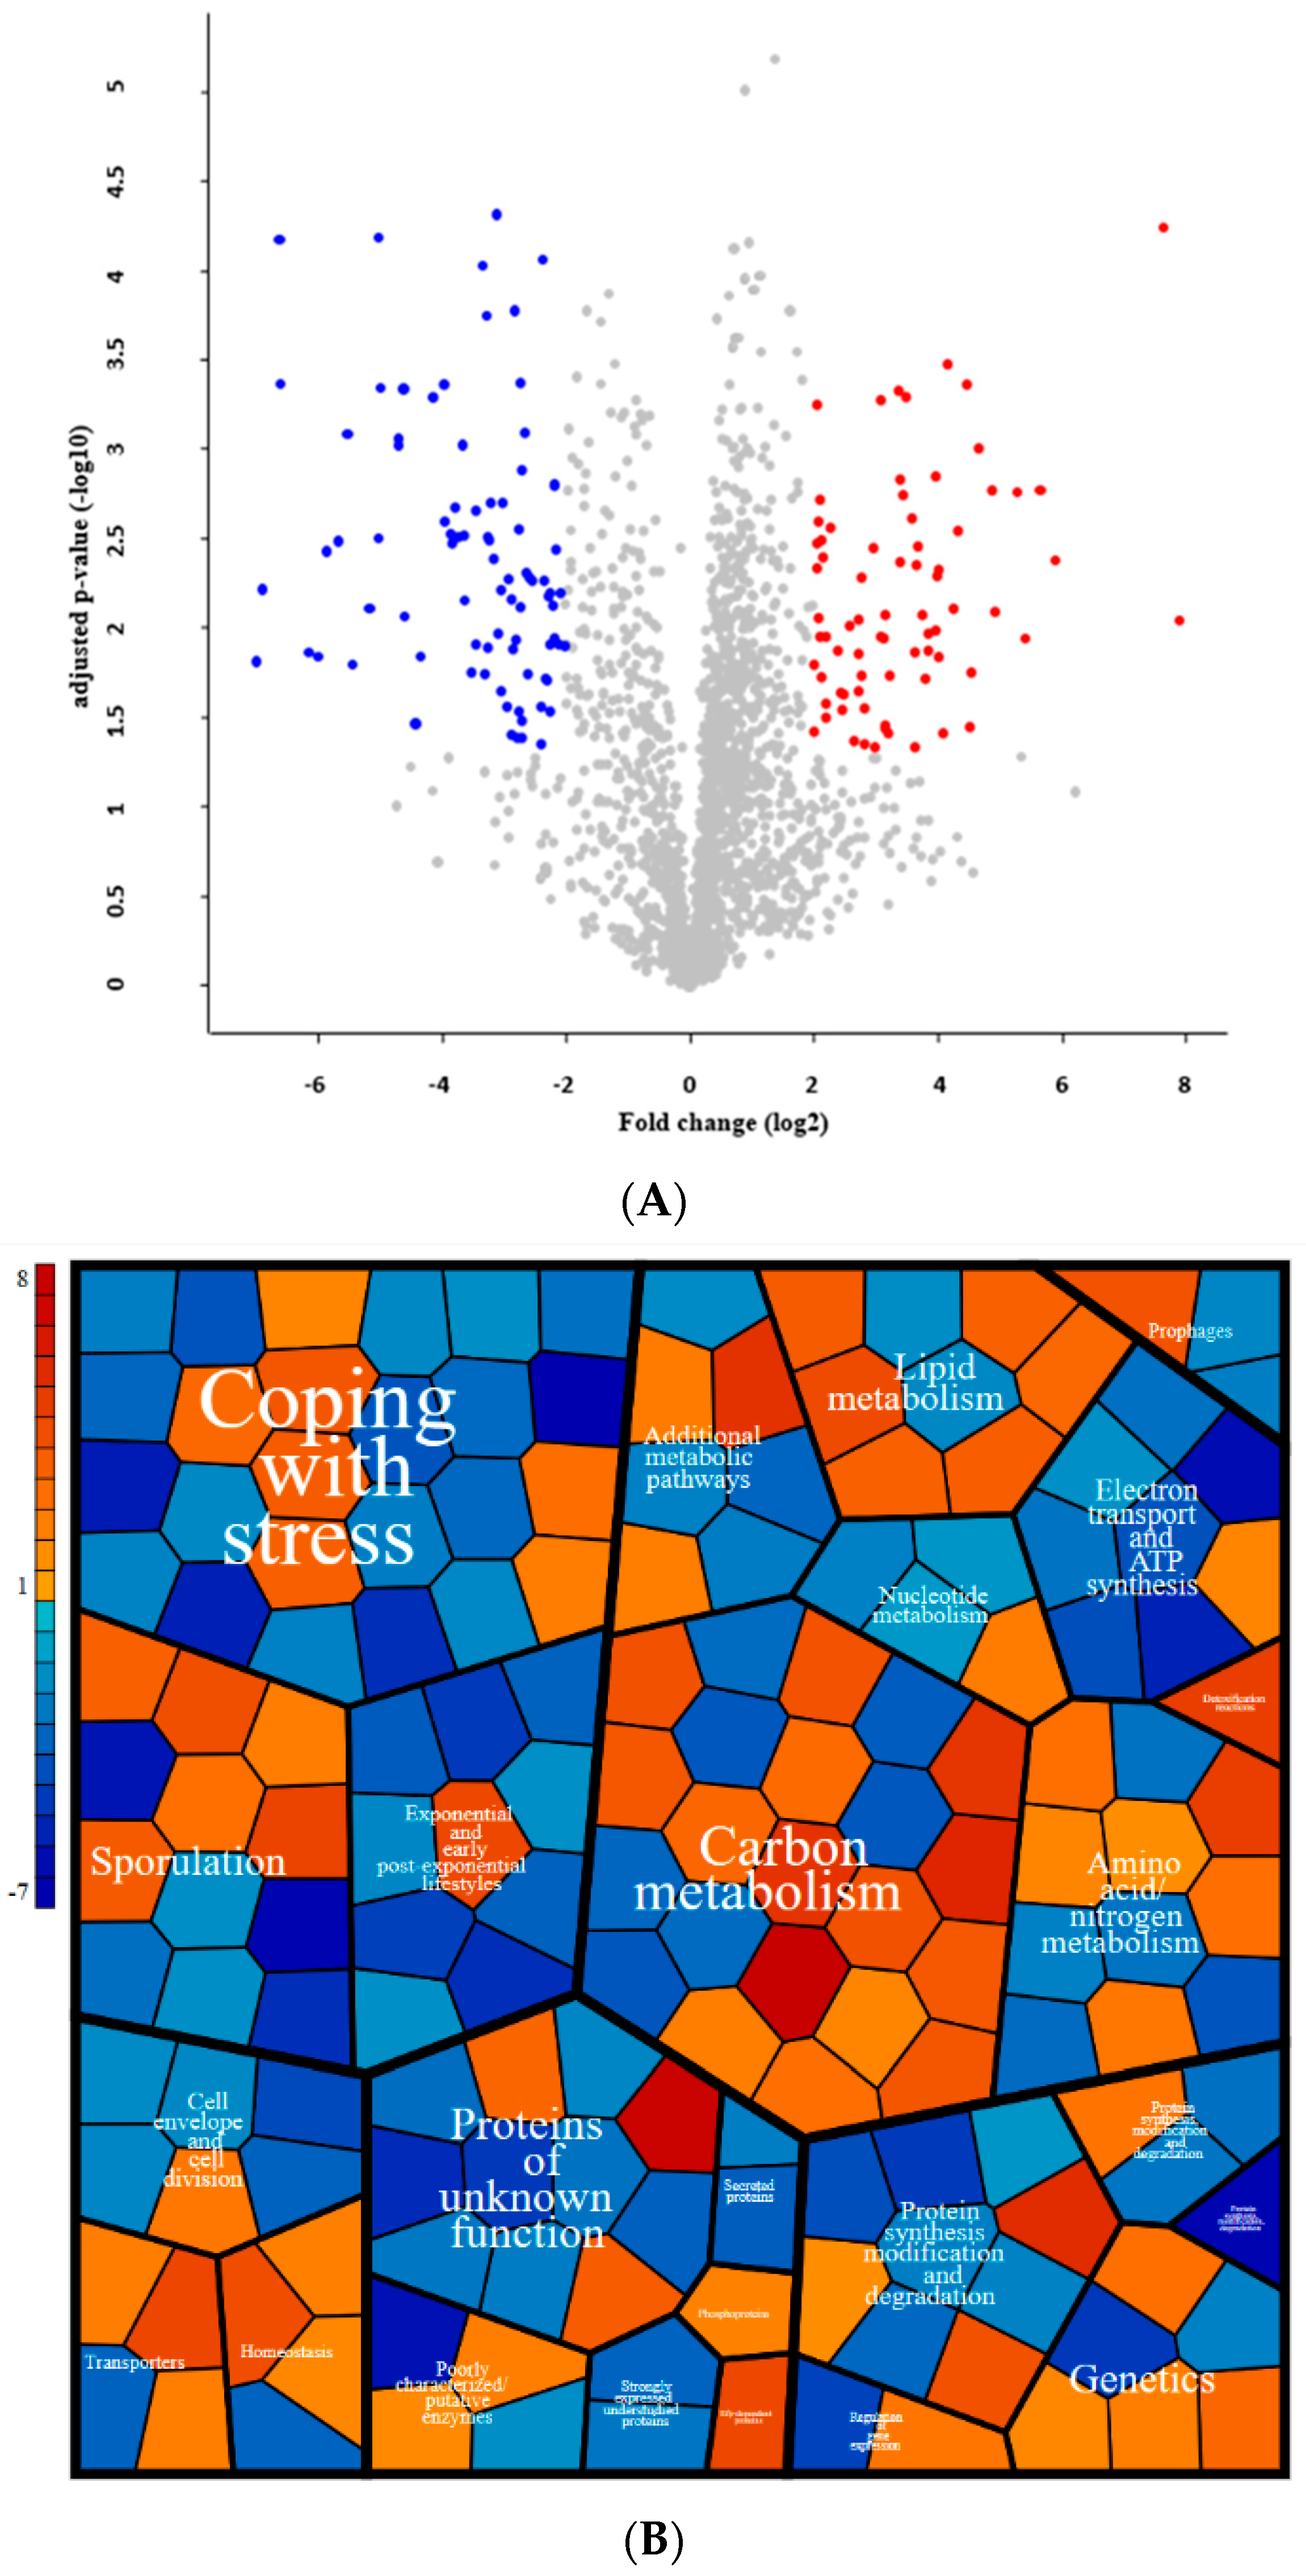
3.6. Proteomic Adaptation to Polystyrene-Bead-Mediated Hydrophobic Environment

To provide a more comprehensive understanding of cellular adaptation to hydrophobic environments stimulated by polystyrene beads, mass spectrometric-based proteome analyses were employed. To obtain vision of the cell’s adaptation to hydrophobicity, the B. subtilis strain ZH1 was used as the target organism. Samples were taken at the late exponential phase (time period of the highest surfactin production) using the mineral salt medium with 8 g/L glucose and 1% (v/v) polystyrene beads since higher surfactin-specific productivity was observed compared to 5 and 10% bead supplementation.
Finally, 138 proteins were found with significantly altered abundances, of which 64 proteins showing higher and 74 proteins showing reduced abundances were measured in the presence of the polystyrene beads (Figure 5A). An additional classification of the identified proteins (each protein identified with a significantly altered abundance was associated with one classification) was summarized in a Treemap created by using the Java-Portlet “Voronoi-Treemap-Portlet” provided by the Quantitative Biology Center in Tübingen (Raffeiner, M. et al., available online: https://github.com/qbicsoftware/voronoi-treemap-portlet (accessed on 12 December 2023). Information on protein functions and classifications were taken from the Subtiwiki database (Figure 5B) [57].
In more detail, several proteins associated with cell envelope, exponential lifestyle and electron transfer/ATP synthesis were determined with a reduced abundance in the polystyrene-bead-supplemented culture samples, confirming the observation of the delayed and overall reduced cell growth of B. subtilis ZH1 strain in mineral salt medium supplemented with 1% polystyrene beads. Furthermore, proteins for Bacillus mobility were found with reduced dominance compared to the control cultivation, suggesting a decreased cell mobilization, which might be the result of cell bead interactions. Interestingly, these permanent interactions seem to have a positive effect on the stress physiology of the cells regarding oxidative stress response (SigB-Spx regulon) as various proteins were identified based on the significantly reduced abundance described during cellular stress management against oxidative stress. This also indicates the induction of general stress during the control cultivation using the already established chemically defined mineral salt medium. On the other hand, the stimulation of the LiaRS and CssRS two-component systems show the cell-wall-associated stress induction probably stimulated by contact between cells and polystyrene beads. Another aspect identified in the proteomic analyses is the reduced effect of CcpA-dependent catabolite repression, resulting in improved protein abundance for fatty acid degradation (β-oxidation) and the stimulation of alternative carbon source utilization within the Bacillus phosphotransferase system.
For an overview of the most affected proteins identified in the mass spectrometric proteome analyses between the polystyrene-bead-supplemented cultivation and control approach, Table 3 summarizes the 20 proteins with the strongest positive or negative change in their abundance.

4. Discussion

Since hydrocarbon-contaminated environments are promising for the isolation of biosurfactant-producing microorganisms [36], samples from crude-oil-contaminated wastewater and soil were taken from the Gachsaran oil fields located in southwest Iran. During screening for crude-oil-degrading and biosurfactant-producing microorganisms, the strains ZH1 and P7 were isolated. These strains were able to emulsify crude oil during cultivation using mineral salt medium and crude oil as the sole carbon and energy source. Here, hydrophobic crude oil droplets were dispersed, indicating the bioproduction of surface active substances by the strains ZH1 and P7. Similar observations were made by Ismail et al. [58] for different crude-oil-degrading bacteria, while Calvo et al. [59] showed the stabilized emulsion of crude oil in water in a Bacillus pumilus culture. These observations make biosurfactant-producing microorganisms, such as ZH1 and P7, attractive for the remediation of soil and water contaminated with crude oil and its derivatives as shown by Gentili et al. [60] and Bachmann et al. [61] using hydrocarbon-degrading bacteria in the bioremediation of contaminated sites.
In further 16S rRNA sequencing, the strains ZH1 and P7 were determined as Bacillus subtilis. In other studies, Bacillus subtilis A1 from a crude oil reservoir (India), Bacillus subtilis CN2 from creosote-contaminated soil (South Africa), the Bacillus subtilis strain DM2 from crude oil-contaminated soil (China), and Bacillus subtilis MJ01 isolated from crude oil-contaminated soil (Iran) showed the decomposition of hydrocarbons [62,63,64,65].
Since the production of biosurfactants was already described for Bacillus subtilis, the isolated strains ZH1 and P7 were used for the analysis of lipopeptide bioproduction. In subsequent HPTLC measurements, the production of surfactin and fengycin could be confirmed with the highest surfactin titer of 1.05 and 0.81 g/L for ZH1 and P7. In comparison, the well-established surfactin-producing B. subtilis wild-type strain DSM10T produced between 0.7 and 1.1 g/L surfactin under different conditions [40,66].
Since the B. subtilis strains were isolated from crude-oil-contaminated environments, their capability in the degradation of hydrocarbons was investigated. Therefore, hexadecane as a component of petroleum was used. The capacity for hexadecane degradation is a characteristic of representatives of many classes of bacteria, both aerobic and anaerobic [67,68]. Although strains ZH1 and P7 were not able to degrade 1–5% hexadecane as the only carbon and energy source in the cultivation medium, a combinatory cultivation process of glucose (8 g/L) and 1% (v/v) of hexadecane allowed for the biomass formation of the strains. After glucose depletion, enhanced biomass was observed for strains ZH1 and P7 with a diauxic growth behavior by consuming parts of the supplemented hexadecane, although the control wild-type strain DSM10T was not able to degrade any hexadecane after 5 days of incubation (Figure 3). Interestingly, although a higher biomass was reached for the isolated strains ZH1 and P7, less surfactin was produced, resulting in decreased specific surfactin productivities. In similar studies, such as the study by Cooper et al. [69], the addition of hexadecane increased the biomass, and it inhibited the production of surfactin by Bacillus subtilis, and the study by Kim et al. [70] showed that in the case of Bacillus subtilis, C9 hexadecane inhibited lipopeptide production when either was applied as the sole carbon source or in combination with glucose. Surprisingly, in contrast to surfactin production, an improved bioproduction of fengycin was detected in cultivations with hexadecane. This observation indicates that the intracellular molecular regulatory adaptation processes have different outcomes for lipopeptide production, confirming the previously described studies showing contrary production adaptations for surfactin and fengycin in B. subtilis [55].
Since both the yield and specific productivity of surfactin were higher for B. subtilis strain ZH1 in comparison to strain P7, the effect of hydrophobicity on the production of surfactin as the main biosurfactant was studied using strain ZH1. For this, polystyrene beads were used for the provision of a higher area of hydrophobicity around the cells cultivated in a mineral salt medium. Comparably to the hexadecane supplementation approach, a lower amount of surfactin was produced compared to the control cultivation. This observation is contrary to popular opinion, as it was previously reported that the productivity of biosurfactants could be significantly enhanced by supplementing the culture medium with hydrophilic and/or hydrophobic inducers, such as vegetable oils [26]. Furthermore, it was observed that the specific surfactin production was further reduced by a higher addition of polystyrene beads (Table 2). Interestingly, other studies described that palmitic acid as a hydrophobic inducer led to the highest yield of surfactin by Bacillus subtilis ATCC 6633 [26], while olive oil was applied as an effective inducer to increase biosurfactant production [27,29] and animal fat was successfully utilized for improving biosurfactant production [71]. Although stimulatory effects on biosurfactant production are described in these previous studies, the addition of oils and fatty acids might affect the metabolic pathways of the respective production strains without having an immediate effect on the basis of hydrophobicity. Accordingly, the supplementation of polystyrene beads excludes those unfavorable side effects and makes the outcome more reliable.
To address the intracellular proteome adaptation during the cultivation of B. subtilis ZH1 with polystyrene beads compared to the control process, mass spectrometric measurements were performed. In this way, several proteins with significantly altered abundance could be detected (Figure 5). Interestingly, several proteins regulated by the alternative sigma factor SigB and involved in the redox stress response were identified with a reduced abundance compared to the control cultivation, indicating the stimulation of a basal stress level due to the use of the mineral salt medium, which seems to be compensated by the addition of polystyrene beads. Conversely, this suggests that improved surfactin production is associated with a certain intracellular basal stress level, which would confirm the results of other studies [72]. On the other hand, the induction of the LiaRS and CssRS two-component systems could be detected, indicating that surface stress induced cellular stress adaptations, which might be the result of interactions between cells and beads.
Furthermore, proteins associated with flagella-mediated mobility were found with reduced abundance, suggesting that the supplementation of polystyrene beads in an improved interaction might stimulate biofilm formation over time, which could have stimulatory effects on surfactin production after a longer cultivation time . Since surfactin production is especially associated with biofilm formation, large amounts of surfaces for cell attachment could be a promising tool for future bioprocess adaptation [73].
In addition, alterations in the proteome suggest the deregulation of CcpA-dependent catabolite repression, which affects different proteins involved in alternative carbon source utilization and fatty acid degradation. However, whether the molecular restructuring of CcpA-mediated catabolite repression has a direct influence on surfactin production needs to be demonstrated in subsequent studies, taking into account the construction of corresponding mutant strains.
In future studies, combinatorial approaches using both substrates and non-metabolizable particles with different hydrophobicity and different microbes producing biosurfactants need to be used to clarify a potentially fundamental mechanism for explaining the overall effects of hydrophobicity on the production of biosurfactants and other bioactive metabolites and their isoform adaptation.
In addition to the development of stimulating conditions for the highest possible production of biosurfactants, the identification of powerful wild-type strains is an important part of the research, which has led to several screening approaches for potent production strains and their physiological characterization, including OMICS approaches [74,75,76]. In particular, the B. subtilis strain ZH1 showed in this study demonstrated the great potential of wild-type strains for the production of biosurfactants as representatives of bioactive metabolites. Nevertheless, more ecological sites are available for the identification of novel strains with promising gene clusters encoding for bioactive metabolites, such as the rhizosphere, which makes them interesting for application as biopesticides [77,78].

5. Conclusions

This study investigated the correlation between hydrophobicity and biosurfactant production in B. subtilis strains ZH1 and P7, isolated from hydrophobic environments. Under hydrophobic conditions, the strains produced less surfactin in response to hexadecane but more fengycin. The reduction in surfactin levels was contrary to popular opinion which suggests that hydrophobic inducers could significantly stimulate biosurfactant productivity. Additionally, the model strain ZH1 showed reduced surfactin and fengycin production in a hydrophobic environment stimulated by polystyrene beads. Analyzing bead effects on the proteome revealed multiple outcomes, with noticeable changes in proteins associated with cell-bead interactions including cell envelope, mobility, oxidative stress response, cell wall stress, β-oxidation, and carbon source utilization. The addition of beads reduced the basal stress level induced in the mineral salt medium, which could lead to lower surfactin and fengycin productivity compared to the control culture. The activation of LiaRS and CssRS two-component systems indicated cellular adaptation to surface stress. By applying polystyrene beads, which eliminated hydrophobic inducer side effects, we could show that hydrophobicity alone shows no stimulatory effect on surfactin and fengycin production.

Supplementary Materials

The following supporting information can be downloaded at: https://www.mdpi.com/article/10.3390/applmicrobiol4010015/s1, Table S1: Results of screening tests for crude oil-degrading and biosurfactant-producing isolates.; Table S2: Characteristics of the isolates; Table S3:Distribution of surfactin and fengycin variants produced by B. subtilis isolates P7, ZH1 and wild-type control strain DSM10T; Figure S1: LC-ESI-MS analyses with corresponding total ion chromatograms (TIC) of the lipopeptides produced by Bacillus subtilis strains ZH1 (a), P7 (b), and DSM10T (c); Figure S2: Effect of 1% (v/v) hexadecane supplementation on lipopeptide production and growth behavior. Using chemically defined mineral salt medium with 8 g/L glucose, effects of additional supplementation of hexadecane as a defined hydrocarbon substrate was analyzed using the B. subtilis strains P7 (a), ZH1 (b), and the wild-type control strain DSM10T (c); Figure S3: The chromatogram of the abiotic control (blue) compared to one of the strains (ZH1, P7, green) shows the decomposition of hexadecane in the cultivation broth sample. There is only one peak at 8.75 min (hexadecane, blue) and several peaks at 4–19 min (other hydrocarbons, green) which are decomposition products. References [35,79,80,81] is cited in supplementary material.

Author Contributions

Conceptualization, R.H., J.F., and L.L.; methodology, S.Z.H., M.V., P.H., J.P., E.P., and H.H.; software, S.Z.H., P.H., E.P., and H.H.; validation, all authors; formal analysis, S.Z.H., M.V., P.H., R.H., and L.L; investigation, S.Z.H., M.V., and L.L.; resources, R.H.; data curation, S.Z.H., M.V., P.H., J.P., and H.H.; writing—original draft preparation, S.Z.H., M.V., P.H., R.H., and L.L.; writing—review and editing, S.Z.H., R.H., and L.L; visualization, S.Z.H.; supervision, M.V., J.F., R.H., and L.L.; project administration, S.Z.H., J.F., M.V., R.H., and L.L.; funding acquisition, R.H. All authors have read and agreed to the published version of the manuscript.

Funding

Financially supported by fellowship No. OBJS-2022-010 from the Bayer Foundation, Germany and grant No. 981201 of the Biotechnology Development Council of the Islamic Republic of Iran.

Data Availability Statement

All raw data and biological material are saved in the Institute of Food Science and Biotechnology, Department of Bioprocess Engineering (150k), University of Hohenheim, Fruwirthstraße 12, Stuttgart 70599, Germany. In needed, please contact the corresponding authors for any detailed questions.

Acknowledgments

The authors thank Eike Grunwaldt for excellent technical support.

Conflicts of Interest

The authors declare no conflicts of interest.

References

  1. Al-Araji, L.; Noor, R.; Raja, Z.; Rahman, A.; Basri, M.; Salleh, A.B. Minireview Microbial Surfactant. Asia Pac. J. Mol. Biol. Biotechnol. 2007, 15, 99–105. [Google Scholar]
  2. Geetha, S.J.; Banat, I.M.; Joshi, S.J. Biosurfactants: Production and potential applications in microbial enhanced oil recovery (MEOR). Biocatal. Agric. Biotechnol. 2018, 14, 23–32. [Google Scholar] [CrossRef]
  3. Sarubbo, L.A.; Silva, M.D.G.C.; Durval, I.J.B.; Bezerra, K.G.O.; Ribeiro, B.G.; Silva, I.A.; Twigg, M.S.; Banat, I.M. Biosurfactants: Production, properties, applications, trends, and general perspectives. Biochem. Eng. J. 2022, 181, 108377. [Google Scholar] [CrossRef]
  4. Varjani, S.J.; Upasani, V.N. Critical review on biosurfactant analysis, purification and characterization using rhamnolipid as a model biosurfactant. Bioresour. Technol. 2017, 232, 389–397. [Google Scholar] [CrossRef]
  5. Henkel, M.; Müller, M.M.; Kügler, J.H.; Lovaglio, R.B.; Contiero, J.; Syldatk, C.; Hausmann, R. Rhamnolipids as biosurfactants from renewable resources: Concepts for next-generation rhamnolipid production. Process. Biochem. 2012, 47, 1207–1219. [Google Scholar] [CrossRef]
  6. Farias, C.B.B.; Almeida, F.C.; Silva, I.A.; Souza, T.C.; Meira, H.M.; Soares da Silva, R.D.C.F.; Luna, J.M.; Santos, V.A.; Converti, A.; Banat, I.M.; et al. Production of green surfactants: Market prospects. Electron. J. Biotechnol. 2021, 51, 28–39. [Google Scholar] [CrossRef]
  7. Tunsagool, P.; Leelasuphakul, W.; Jaresitthikunchai, J.; Phaonakrop, N.; Roytrakul, S.; Jutidamrongphan, W. Targeted transcriptional and proteomic studies explicate specific roles of Bacillus subtilis iturin A, fengycin, and surfactin on elicitation of defensive systems in mandarin fruit during stress. PLoS ONE 2019, 14, e0217202. [Google Scholar] [CrossRef]
  8. Vahidinasab, M.; Lilge, L.; Reinfurt, A.; Pfannstiel, J.; Henkel, M.; Morabbi Heravi, K.; Hausmann, R. Construction and description of a constitutive plipastatin mono-producing Bacillus subtilis. Microb. Cell. Fact. 2020, 19, 205. [Google Scholar] [CrossRef]
  9. Lilge, L.; Ersig, N.; Hubel, P.; Aschern, M.; Pillai, E.; Klausmann, P.; Pfannstiel, J.; Henkel, M.; Morabbi Heravi, K.; Hausmann, R. Surfactin Shows Relatively Low Antimicrobial Activity against Bacillus subtilis and Other Bacterial Model Organisms in the Absence of Synergistic Metabolites. Microorganisms 2022, 10, 779. [Google Scholar] [CrossRef]
  10. Vollenbroich, D.; Vater, J.; Maria Kamp, R.; Pauli, G. Mechanism of Inactivation of Enveloped Viruses by the Biosurfactant Surfactin from Bacillus subtilis. Biologicals 1997, 25, 289–297. [Google Scholar] [CrossRef]
  11. Haddaji, N.; Ncib, K.; Bahia, W.; Ghorbel, M.; Leban, N.; Bouali, N.; Bechambi, O.; Mzoughi, R.; Mahdhi, A. Control of Multidrug-Resistant Pathogenic Staphylococci Associated with Vaginal Infection Using Biosurfactants Derived from Potential Probiotic Bacillus Strain. Fermentation 2022, 8, 19. [Google Scholar] [CrossRef]
  12. Teixeira Souza, K.S.; Gudiña, E.J.; Schwan, R.F.; Rodrigues, L.R.; Dias, D.R.; Teixeira, J.A. Improvement of biosurfactant production by Wickerhamomyces anomalus CCMA 0358 and its potential application in bioremediation. J. Hazard. Mater 2018, 346, 152–158. [Google Scholar] [CrossRef]
  13. Dubey, K.V.; Charde, P.N.; Meshram, S.U.; Shendre, L.P.; Dubey, V.S.; Juwarkar, A.A. Surface-active potential of biosurfactants produced in curd whey by Pseudomonas aeruginosa strain-PP2 and Kocuria turfanesis strain-J at extreme environmental conditions. Bioresour. Technol. 2012, 126, 368–374. [Google Scholar] [CrossRef] [PubMed]
  14. Nitschke, M.; Costa, S.G.V.A.O. Biosurfactants in food industry. Trends. Food. Sci. Technol. 2007, 18, 252–259. [Google Scholar] [CrossRef]
  15. Drakontis, C.E.; Amin, S. Biosurfactants: Formulations, properties, and applications. Curr. Opin. Colloid Interface Sci. 2020, 48, 77–90. [Google Scholar] [CrossRef]
  16. Makkar, R.S.; Cameotra, S.S.; Banat, I.M. Advances in utilization of renewable substrates for biosurfactant production. AMB Express 2011, 1, 5. Available online: http://www.amb-express.com/content/1/1/5 (accessed on 23 December 2023). [CrossRef]
  17. Treinen, C.; Magosch, O.; Hoffmann, M.; Klausmann, P.; Würtz, B.; Pfannstiel, J.; Morabbi Heravi, K.; Lilge, L.; Hausmann, R.; Henkel, M. Modeling the time cource of ComX: Towards molecular process control for Bacillus wild-type cultivations. AMB Express 2021, 11, 144. [Google Scholar] [CrossRef]
  18. Fenibo, E.O.; Douglas, S.I.; Stanley, H.O. A Review on Microbial Surfactants: Production, Classifications, Properties and Characterization. J. Adv. Microbiol. 2019, 18, 1–22. [Google Scholar] [CrossRef]
  19. Lin, X.; Zhou, H.; Zeng, F.; Jiang, L.; Atakpa, E.O.; Chen, G.; Zhang, C.; Xie, Q. A biosurfactant-producing yeast Rhodotorula sp.CC01 utilizing landfill leachate as nitrogen source and its broad degradation spectra of petroleum hydrocarbons. World. J. Microbiol. Biotechnol. 2022, 38, 68. [Google Scholar] [CrossRef]
  20. Souza, E.C.; Vessoni-Penna, T.C.; De Souza Oliveira, R.P. Biosurfactant-enhanced hydrocarbon bioremediation: An overview. Int. Biodeterior. Biodegradation 2014, 89, 88–94. [Google Scholar] [CrossRef]
  21. Lai, C.C.; Huang, Y.C.; Wie, Y.H.; Chang, J.S. Biosurfactant-enhanced removal of total petroleum hydrocarbons from contaminated soil. J. Hazard. Mater. 2009, 167, 609–614. [Google Scholar] [CrossRef]
  22. Soberón-Chávez, G. Biosurfactants: Research and Development. Available online: https://www.elsevier.com/books-and-journals/book-series/books-series- (accessed on 23 December 2023).
  23. Singh, A.; Van Hamme, J.D.; Ward, O.P. Surfactants in microbiology and biotechnology: Part 2. Application aspects. Biotechnol. Adv. 2007, 25, 99–121. [Google Scholar] [CrossRef] [PubMed]
  24. Althalb, H.A.; Elmusrati, I.M.; Banat, I.M. Correction: Althalb et al. A Novel Approach to Enhance Crude Oil Recovery Ratio Using Selected Bacterial Species. Appl. Sci. 2021, 11, 10492. [Google Scholar] [CrossRef]
  25. de Oliveira Schmidt, V.K.; de Souza Carvalho, J.; de Oliveira, D.; de Andrade, C.J. Biosurfactant inducers for enhanced production of surfactin and rhamnolipids: An overview. World. J. Microbiol. Biotechnol. 2021, 37, 21. [Google Scholar] [CrossRef]
  26. de Oliveira Schmidt, V.K.; Moraes, P.A.D.; Cesca, K.; Pereira, L.P.S.; de Andrade, L.M.; Mendes, M.A.; de Oliverira, D.; de Andrade, C.J. Enhanced production of surfactin using cassava wastewater and hydrophobic inducers: A prospection on new homologues. World. J. Microbiol. Biotechnol. 2023, 39, 82. [Google Scholar] [CrossRef]
  27. Meneses, D.P.; Gudiña, E.J.; Fernandes, F.; Gonçalves, L.R.B.; Rodrigues, L.R.; Rodrigues, S. The yeast-like fungus Aureobasidium thailandense LB01 produces a new biosurfactant using olive oil mill wastewater as an inducer. Microbiol. Res. 2017, 204, 40–47. [Google Scholar] [CrossRef] [PubMed]
  28. Nurfarahin, A.H.; Mohamed, M.S.; Phang, L.Y. Culture medium development for microbial-derived surfactants production—An overview. Molecules 2018, 23, 1049. [Google Scholar] [CrossRef]
  29. Salam, J.A.; Das, N. Induced Biosurfactant Production and Degradation of Lindane by Soil Basidiomycetes Yeast, Rhodotorula sp. VITJzN03. Res. J.Pharm. Biol. Chem. Sci. 2013, 4, 664–670. [Google Scholar]
  30. Gudiña, E.J.; Rodrigues, A.I.; de Freitas, V.; Azevedo, Z.; Teixeira, J.A.; Rodrigues, L.R. Valorization of agro-industrial wastes towards the production of rhamnolipids. Biores. Technol. 2016, 212, 144–150. [Google Scholar] [CrossRef]
  31. Zhang, L.; Pemberton, J.E.; Maier, R.M. Effect of fatty acid substrate chain length on Pseudomonas aeruginosa ATCC 9027 monorhamnolipid yield and congener distribution. Process Biochem 2014, 49, 989–995. [Google Scholar] [CrossRef]
  32. Hashemi, S.Z.; Fooladi, J.; Ebrahimipour, G.; Khodayari, S. Isolation and identification of crude oil degrading and biosurfactant producing bacteria from the oil-contaminated soils of Gachsaran. Appl. Food Biotechnol. 2016, 3, 83–89. [Google Scholar] [CrossRef]
  33. Amani, H.; Mehrnia, M.R.; Sarrafzadeh, M.H.; Haghighi, M.; Soudi, M.R. Scale up and application of biosurfactant from bacillus subtilis in enhanced oil recovery. Appl. Biochem. Biotechnol. 2010, 162, 510–523. [Google Scholar] [CrossRef] [PubMed]
  34. Najmi, Z.; Ebrahimipour, G.; Franzetti, A. Investigation of Physicho-chemical Properties and Characterization of Produced Biosurfactant by Selected Indigenous Oil-degrading Bacterium. Iran. J. Public. Health 2018, 47, 1151–1159. [Google Scholar] [PubMed]
  35. Satpute, S.K.; Banpurkar, A.G.; Dhakephalkar, P.K.; Banat, I.M.; Chopade, B.A. Methods for investigating biosurfactants and bioemulsifiers: A review. Crit. Rev. Biotechnol. 2010, 30, 127–144. [Google Scholar] [CrossRef] [PubMed]
  36. Walter, V.; Syldatk, C.; Hausmann, R. Screening concepts for the isolation of biosurfactant producing microorganisms. Adv. Exp. Med. Biol. 2010, 672, 1–13. Available online: http://www.ncbi.nlm.nih.gov/pubmed/20545270 (accessed on 23 December 2023). [PubMed]
  37. Babazadeh, F.; Gharavi, S.; Soudi, M.R.; Zarrabi, M.; Talebpour, Z. Potential for Polyethylene Terephthalate (PET) Degradation Revealed by Metabarcoding and Bacterial Isolates from Soil Around a Bitumen Source in Southwestern Iran. J. Polym. Environ. 2023, 31, 1279–1291. [Google Scholar] [CrossRef]
  38. Geissler, M.; Oellig, C.; Moss, K.; Schwack, W.; Henkel, M.; Hausmann, R. High-performance thin-layer chromatography (HPTLC) for the simultaneous quantification of the cyclic lipopeptides Surfactin, Iturin A and Fengycin in culture samples of Bacillus species. J. Chromatogr. B 2017, 1044–1045, 214–224. [Google Scholar] [CrossRef]
  39. Geissler, M.; Heravi, K.M.; Henkel, M.; Hausmann, R. Lipopeptide Biosurfactants From Bacillus Species. In Biobased Surfactants: Synthesis, Properties, and Applications; Elsevier: Amsterdam, The Netherlands, 2019; pp. 205–240. [Google Scholar] [CrossRef]
  40. Willenbacher, J.; Zwick, M.; Mohr, T.; Schmid, F.; Syldatk, C.; Hausmann, R. Evaluation of different Bacillus strains in respect of their ability to produce Surfactin in a model fermentation process with integrated foam fractionation. Appl. Microbiol. Biotechnol. 2014, 98, 9623–9632. [Google Scholar] [CrossRef]
  41. Bóka, B.; Manczinger, L.; Kecskeméti, A.; Chandrasekaran, M.; Kadaikunnan, S.; Alharbi, N.S.; Vágvölgyi, C.; Szekeres, A. Ion trap mass spectrometry of surfactins produced by Bacillus subtilis SZMC6179J reveals novel fragmentation features of cyclic lipopeptides. Rapid Commun. Mass Spectrom. 2016, 30, 1581–1590. [Google Scholar] [CrossRef]
  42. Kecskeméti, A.; Bartal, A.; Bóka, B.; Kredics, L.; Manczinger, L.; Shine, K.; Alharby, N.S.; Khaled, J.M.; Varga, M.; Vágvölgyi, C.; et al. High-frequency occurrence of surfactin monomethyl isoforms in the ferment broth of a bacillus subtilis strain revealed by ion trap mass spectrometry. Molecules 2018, 23, 2224. [Google Scholar] [CrossRef]
  43. Lin, L.Z.; Zheng, Q.W.; Wei, T.; Zhang, Z.Q.; Zhao, C.F.; Zhong, H.; Xu, Q.Y.; Lin, J.F.; Guo, L.O. Isolation and Characterization of Fengycins Produced by Bacillus amyloliquefaciens JFL21 and Its Broad-Spectrum Antimicrobial Potential Against Multidrug-Resistant Foodborne Pathogens. Front. Microbiol. 2020, 11, 579621. [Google Scholar] [CrossRef]
  44. Pathak, K.V.; Keharia, H.; Gupta, K.; Thakur, S.S.; Balaram, P. Lipopeptides from the banyan endophyte, Bacillus subtilis K1: Mass spectrometric characterization of a library of fengycins. J. Am. Soc. Mass Spectrom. 2012, 23, 1716–1728. [Google Scholar] [CrossRef] [PubMed]
  45. Rughöft, S.; Jehmlich, N.; Gutierrez, T.; Kleindienst, S. Comparative proteomics of Marinobacter sp. Tt1 reveals corexit impacts on hydrocarbon metabolism, chemotactic motility, and biofilm formation. Microorganisms 2021, 9, 3. [Google Scholar] [CrossRef]
  46. Wang, X.B.; Chi, C.Q.; Nie, Y.; Tang, Y.Q.; Tan, Y.; Wu, G.; Wu, X.L. Degradation of petroleum hydrocarbons (C6-C40) and crude oil by a novel Dietzia strain. Biores. Technol. 2011, 102, 7755–7761. [Google Scholar] [CrossRef] [PubMed]
  47. Klausmann, P.; Hennemann, K.; Hoffmann, M.; Treinen, C.; Aschern, M.; Lilge, L.; Morabbi Heravi, K.; Hausmann, R. Bacillus subtilis High Cell Density Fermentation Using a Sporulation-Deficient Strain for the Production of Surfactin. Appl. Microbiol. Biotechnol. 2021, 105, 4141–4151. [Google Scholar] [CrossRef] [PubMed]
  48. Hughes, C.S.; Foehr, S.; Garfield, D.A.; Furlong, E.E.; Steinmetz, L.M.; Krijgsveld, J. Ultrasensitive proteome analysis using paramagnetic bead technology. Mol. Syst. Biol. 2014, 10, 757. [Google Scholar] [CrossRef]
  49. Olsen, J.V.; de Godoy, L.M.F.; Li, G.; Macek, B.; Mortensen, P.; Pesch, R.; Makarov, A.; Lange, O.; Horning, S.; Mann, M. Parts per million mass accuracy on an orbitrap mass spectrometer via lock mass injection into a C-trap. Mol. Cell. Proteom. 2005, 4, 2010–2021. [Google Scholar] [CrossRef]
  50. Cox, J.; Mann, M. MaxQuant enables high peptide identification rates, individualized p.p.b.-range mass accuracies and proteome-wide protein quantification. Nat. Biotechnol. 2008, 26, 1367–1372. [Google Scholar] [CrossRef]
  51. Cox, J.; Neuhauser, N.; Michalski, A.; Scheltema, R.A.; Olsen, J.V.; Mann, M. Andromeda: A peptide search engine integrated into the MaxQuant environment. J. Proteome Res. 2011, 10, 1794–1805. [Google Scholar] [CrossRef]
  52. Bateman, A. UniProt: A worldwide hub of protein knowledge. Nucleic Acids Res. 2019, 47, D506–D515. [Google Scholar] [CrossRef]
  53. Tyanova, S.; Temu, T.; Sinitcyn, P.; Carlson, A.; Hein, M.Y.; Geiger, T.; Mann, M.; Cox, J. Perseus platform for proteomics data The Perseus computational platform for comprehensive analysis of (prote)omics data. Nat. Methods 2016, 13, 731–740. [Google Scholar] [CrossRef]
  54. Deutsch, E.W.; Csordas, A.; Sun, Z.; Jarnuczak, A.; Perez-Riverol, Y.; Ternent, T.; Campbell, D.S.; Bernal-Llinares, M.; Okuda, S.; Kawano, S.; et al. The ProteomeXchange consortium in 2017: Supporting the cultural change in proteomics public data deposition. Nucleic Acids Res. 2017, 45, D1100–D1106. [Google Scholar] [CrossRef]
  55. Lilge, L.; Hertel, R.; Morabbi Heravi, K.; Henkel, M.; Commichau, F.M.; Hausmann, R. Draft Genome Sequence of the Type Strain Bacillus subtilis subsp. subtilis DSM10. Microbiol. Resourc. Announc. 2021, 10, e00158-21. [Google Scholar] [CrossRef]
  56. Lilge, L.; Vahidinasab, M.; Adiek, I.; Becker, P.; Kuppusamy Nesamani, C.; Treinen, C.; Hoffmann, M.; Morabbi Heravi, K.; Henkel, M.; Hausmann, R. Expression of degQ gene and its effect on lipopeptide production as well as formation of secretory proteases in Bacillus subtilis strains. MicrobiologyOpen 2021, 10, e1241. [Google Scholar] [CrossRef]
  57. Zhu, B.; Stülke, J. SubtiWiki in 2018: From genes and proteins to functional network annotation of the model organism Bacillus subtilis. Nucleic Acids Res. 2018, 46, D743–D748. [Google Scholar] [CrossRef] [PubMed]
  58. Ismail, W.; Al-Rowaihi, I.S.; Al-Humam, A.A.; Hamza, R.Y.; El Nayal, A.M.; Bououdina, M. Characterization of a lipopeptide biosurfactant produced by a crude-oil-emulsifying Bacillus sp. I-15. Int. Biodeterior. Biodegradation 2013, 84, 168–178. [Google Scholar] [CrossRef]
  59. Calvo, C.; Toledo, F.L.; González-López, J. Surfactant activity of a naphthalene degrading Bacillus pumilus strain isolated from oil sludge. J. Biotech. 2004, 109, 255–262. [Google Scholar] [CrossRef]
  60. Gentili, A.R.; Cubitto, M.A.; Ferrero, M.; Rodriguéz, M.S. Bioremediation of crude oil polluted seawater by a hydrocarbon-degrading bacterial strain immobilized on chitin and chitosan flakes. Int. Biodeterior. Biodegradation 2006, 57, 222–228. [Google Scholar] [CrossRef]
  61. Bachmann, D.; Pal, U.; Bockwoldt, J.A.; Schaffert, L.; Roentgen, R.; Büchs, J.; Kalinowski, J.; Blank, L.M.; Tiso, T. C-, N-, S-, and P-Substrate Spectra in and the Impact of Abiotic Factors on Assessing the Biotechnological Potential of Paracoccus pantotrophus. Appl. Microbiol. 2023, 3, 175–198. [Google Scholar] [CrossRef]
  62. Bezza, F.A.; Chirwa, E.M.N. Production and applications of lipopeptide biosurfactant for bioremediation and oil recovery by Bacillus subtilis CN2. Biochem. Eng. J. 2015, 101, 168–178. [Google Scholar] [CrossRef]
  63. Li, S.W.; Liu, M.Y.; Yang, R.Q. Comparative Genome Characterization of a Petroleum-Degrading Bacillus subtilis Strain DM2. Int. J. Genomics 2019, 2019, 7410823. [Google Scholar] [CrossRef] [PubMed]
  64. Parthipan, P.; Preetham, E.; Machuca, L.L.; Rahman, P.K.S.M.; Murugan, K.; Rajasekar, A. Biosurfactant and degradative enzymes mediated crude oil degradation by bacterium Bacillus subtilis A1. Front. Microbiol. 2017, 8, 193. [Google Scholar] [CrossRef]
  65. Rahimi, T.; Niazi, A.; Deihimi, T.; Taghavi, S.M.; Ayatollahi, S.; Ebrahimie, E. Genome annotation and comparative genomic analysis of Bacillus subtilis MJ01, a new bio-degradation strain isolated from oil-contaminated soil. Funct. Integr. Genomics 2018, 18, 533–543. [Google Scholar] [CrossRef] [PubMed]
  66. Willenbacher, J.; Yeremchuk, W.; Mohr, T.; Syldatk, C.; Hausmann, R. Enhancement of Surfactin yield by improving the medium composition and fermentation process. AMB Express 2015, 5, 145. [Google Scholar] [CrossRef]
  67. Cameotra, S.S.; Singh, P. Synthesis of rhamnolipid biosurfactant and mode of hexadecane uptake by Pseudomonas species. Microb. Cell Factories 2009, 8, 16. [Google Scholar] [CrossRef] [PubMed]
  68. Solyanikova, I.P.; Golovleva, L.A. Hexadecane and Hexadecane-Degrading Bacteria: Mechanisms of Interaction. Microbiology 2019, 88, 15–26. [Google Scholar] [CrossRef]
  69. Cooper, D.G.; Macdonald, C.R.; Duff, S.J.B.; Kosaric, N. Enhanced production of surfactin from Bacillus subtilis by continuous product removal and metal cation additions. Appl. Environ. Microbiol. 1981, 42, 408–412. [Google Scholar] [CrossRef]
  70. Kim, H.-S.; Yoon, B.-D.; Lee, C.-H.; Suh, H.-H.; Oh, H.-M.; Katsuragi, T.; Tani, Y. Production and Properties of a Lipopeptide Biosurfactant from Bacillus subtilis C9. J. Ferment. Bioeng. 1997, 84, 41–46. [Google Scholar] [CrossRef]
  71. Deshpande, M.; Daniels, L. Evaluation of sophorolipid biosurfactant production by Candida bombicola using animal fat. Bioresour. Technol. 1995, 54, 143–150. [Google Scholar] [CrossRef]
  72. Bartolini, M.; Cogliati, S.; Vileta, D.; Bauman, C.; Ramirez, W.; Grau, R. Stress-Responsive Alternative Sigma Factor SigB Plays a Positive Role in the Antifungal Proficiency of Bacillus subtilis. Appl. Environ. Microbiol. 2019, 85, e00178-19. [Google Scholar] [CrossRef]
  73. Brück, H.L.; Delvigne, F.; Dhulster, P.; Jacques, P.; Coutte, F. Molecular strategies for adapting Bacillus subtilis 168 biosurfactant production to biofilm cultivation mode. Bioresour. Technol. 2019, 293, 122090. [Google Scholar] [CrossRef]
  74. Akintayo, S.O.; Treinen, C.; Vahidinasab, M.; Pfannstiel, J.; Bertsche, U.; Fadahunsi, I.; Oellig, C.; Granvogl, M.; Henkel, M.; Lilge, L.; et al. Exploaration of surfactin production by newly isolated Bacillus and Lysinibacillus strains from food-related sources. Lett. Appl. Microbiol. 2022, 75, 378–387. [Google Scholar] [CrossRef] [PubMed]
  75. Akintayo, S.O.; Hosseini, B.; Vahidinasab, M.; Messmer, M.; Pfannstiel, J.; Bertsche, U.; Hubel, P.; Henkel, M.; Hausmann, R.; Voegele, R.T.; et al. Characterization ofantifungal properties of lipopeptide-producing Bacillus velezensis strains and their proteome-based response to the phytopathogens, Diaporthe spp. Front. Bioeng. Biotechnol. 2023, 11, 1228386. [Google Scholar] [CrossRef]
  76. Akintayo, S.O.; Neumann, B.; Fischer, M.; Henkel, M.; Lilge, L.; Hausmann, R. Lysinibacillus irui sp. nov., isolated from Iru, fermented African locust beans. Int. J. Syst. Evol. Microbiol. 2023, 73, 006167. [Google Scholar] [CrossRef]
  77. Jabiri, S.; Legrifi, I.; Benhammou, M.; Laasli, S.-E.; Mokrini, F.; Bendriss Amraoui, M.; Lahlali, R. Screening of Rhizobacterial Isolates from Apple Rhizosphere for Their Biocontrol and Plant Growth Promotion Activity. Appl. Microbiol. 2023, 3, 948–967. [Google Scholar] [CrossRef]
  78. Takishita, Y.; Souleimanov, A.; Bourguet, C.; Ohlund, L.B.; Arnold, A.A.; Sleno, L.; Smith, D.L. Pseudomonas entomophila 23S Produces a Novel Antagonistic Compound against Clavibacter michiganensis subsp. michiganensis, a Pathogen of Tomato Bacterial Canker. Appl. Microbiol. 2021, 1, 60–73. [Google Scholar] [CrossRef]
  79. Bodoura, A.A.; Miller-Maier, R.M. Application of a modified drop-collapse technique for surfactant quantitation and screening of biosurfactant-producing mi-croorganisms. J. Microbiol. Methods 1998, 32, 273–280. [Google Scholar] [CrossRef]
  80. Tugrul, T.; Cansunar, E. Detecting surfactant-producing microorganisms by the drop-collapse test. World J. Microbiol. Biotechnol. 2005, 21, 851–853. [Google Scholar] [CrossRef]
  81. Siegmund, I.; Wagner, F. New method for detecting rhamnolipids excreted by Pseudomonas species during growth on mineral agar. Biotechnol. Tech. 1991, 5, 265–268. [Google Scholar] [CrossRef]
Figure 1. Lipopeptide production in B. subtilis isolates ZH1 and P7. The Bacillus subtilis strains ZH1 (A), P7 (B), and DSM10T (C) were cultivated in mineral salt medium with 8 g/L glucose. Optical density (OD600) (black crosses), glucose concentration (red diamonds), and amounts of fengycin (blue squares) as well as surfactin (green dots) were measured. The cultivations were performed in biological duplicates.
Applmicrobiol 04 00015 g001aApplmicrobiol 04 00015 g001b
Figure 2. Distribution of surfactin and fengycin variants. The bar plots illustrate the ratios of surfactin (A) and fengycin variants (B) produced by B. subtilis strains DSM10T, P7, and ZH1 in batch shake flask cultivations using mineral salt medium with 8 g/L glucose. In cases of no chromatographic separation of surfactin variants with the same m/z values, both variants were listed. Surfactin Cx: main variants summarized, including Leu/Ile substitutions at different positions. [Val2]: Valin position 2; [Val7]: Valin position 7; [Ala4]: Alanine position 4; [AME5]: Aspartate position 5, aspartic acid 4-methyl ester. Fengycin variants: sFA, saturated fatty acid; usFA, unsaturated fatty acid.
Applmicrobiol 04 00015 g002
Figure 3. Hexadecane degradation by crude-oil-degrading B. subtilis strains ZH1 and P7. Gas chromatography results show the peak area (m/z 71) of the extracted total hydrocarbon content before and after incubation period of 5 days in shake flask cultivation using the B. subtilis strains ZH1, P7, and DSM10T, and an abiotic control. Cultivations were carried out in biological duplicates.
Applmicrobiol 04 00015 g003
Figure 4. Effects of polystyrene bead supplementation on lipopeptide production. Shake flask cultivations of B. subtilis strain ZH1 in defined mineral salt medium with 8 g/L glucose supplemented with 1% (A), 5% (B), and 10% (v/v) polystyrene beads (C). Optical density (OD600) (black crosses), glucose amount (red diamonds), and surfactin (green dots) as well as fengycin concentration (blue squares) were determined. All cultivations were performed in biological duplicates.
Applmicrobiol 04 00015 g004
Figure 5. Changes in protein abundances due to the polystyrene-bead-mediated hydrophobic environment. (A) Differences between protein abundances in cultivations using chemically defined mineral salt medium supplemented with 1% (v/v) polystyrene beads compared to the control cultivation process without beads. Non-significant proteins (marked in grey) (p-value ≤ 1.4) are below the p-value range, while significantly reduced proteins (log2-fold change ≤ −2) are highlighted in blue, and induced proteins (log2-fold change ≥ 2) are shown in red. (B) Classification of proteins with significantly altered abundances due to cultivation with 1% (v/v) polystyrene-bead-mediated hydrophobicity according to information from the Subtiwiki database. The range of red and blue colors are proteins that increased and decreased in abundance based on log2-fold change, while the size of each subunit is based on the occurrence of each protein in the dataset. The original protein list including the identification of proteins for different categories was filtered out manually.
Applmicrobiol 04 00015 g005
Table 1. Effect of hexadecane supplementation (1% v/v) on cell growth and lipopeptide production in shake flask cultivation using the defined mineral salt medium with 8 g/L glucose.
ControlHexadecane Supplementation
SurfactinStrainsZH1P7DSM10TZH1P7DSM10T
Max. concentration (g/L)1.05 ± 0.020.81 ± 0.130.36 ± 0.000.89 ± 0.020.68 ± 0.010.33 ± 0.01
time [h]151515151712
Biomass (CDW) (g)1.95 ± 0.032.19 ± 0.332.4 ± 0.012.46 ± 0.182.91 ± 0.152.44 ± 0.15
Specific productivity (g/gh)0.0360.0250.0100.0240.0140.011
FengycinMax. concentration (mg/L)15.73 ± 1.2610.55 ± 1.427.72 ± 2.4521.65 ± 1.4311.41 ± 1.5630 ± 1.62
time (h)192236151736
Biomass (CDW) (g)2.27 ± 0.132.19 ± 0.181.25 ± 0.052.46 ± 0.182.91 ± 0.151.2 ± 0.07
Specific productivity (mg/gh)0.3650.2190.6170.5870.2310.694
Table 2. Effect of polystyrene bead supplementation on surfactin and fengycin production.
SurfactinFengycin
Polystyrene Beads (%)Max. Concentration (g/L)Biomass (CDW) (g)Time (h)Specific Productivity
(g/gh)
Max. Concentration
(mg/L)
Biomass
(CDW) (g)
Time (h)Specific
Productivity
(mg/gh)
10.71 ± 0.001.27 ± 0.00450.012510.18 ± 2.451.27 ± 0.00450.1781
50.93 ± 0.002.27 ± 0.08450.00917.90 ± 2.972.05 ± 0.08480.0802
101.01 ± 0.003.89 ± 0.00480.005413.11 ± 1.693.20 ± 0.00420.0975
Control1.05 ± 0.021.95 ± 0.03150.360015.72 ± 1.262.25 ± 0.45190.3677
Table 3. Significantly changed proteins in abundance due to the supplementation of polystyrene beads. The 20 most positively and negatively influenced proteins are listed.
Gene NameLog2-fold ChangeRegulonsFunctionsCategories
Positively affected proteins
mdxE7.91MdxRMaltodextrin utilizationUptake of carbon sources,
utilization of starch/maltodextrin
yqjP7.66-Similar to metallohydrolaseProteins of unknown function
acoB5.92CcpA, SigL, AcoR, FnrAcetoin utilizationUtilization of acetoin
tilS5.67SigM, SigF, HprT, TilStRNA modification, control of ftsH expressiontRNA modification and maturation
ribE5.44FMN-boxRiboflavin biosynthesisBiosynthesis/acquisition of riboflavin/FAD
mtlA5.36MtlRMannitol uptake and phosphorylation, control of MtlR activitySugar-specific PTS proteins,
utilization of mannitol
glvA5.28CcpA, GlvRMaltose utilizationUtilization of maltose
yflK4.93-Similar to hydroxylaminopurine resistance proteinDetoxification reactions
kbl4.89-Threonine utilizationUtilization of threonine/glycine
cotJA4.68SpoIIID, SigEPolypeptide composition of the spore coatSpore coat proteins
yjkB4.54-Similar to amino acid ABC transporter-
yabR4.51SigE, SigM, SigW, SigD, SigXUnknown-
yhjG4.48-Similar to monooxygenase-
lcfA4.34CcpA, FadRFatty acid degradationUtilization of fatty acids
mntC4.27MntRManganese uptakeTrace metal homeostasis
rghR4.16RghRRegulation of sporulation initiationSporulation, phosphorelay
bbmA4.09MdxRStarch and maltodextrin utilizationUtilization of starch/maltodextrin
malP4.03CcpA, GlvRMaltose uptake and phosphorylationSugar-specific PTS proteins,
utilization of maltose
ispA4.01CodYProtein degradationUtilization of proteins
ykvR4.00LexAUnknown-
Negatively affected proteins
lipA−7.00-Lipoyl synthaseSynthesis of lipoic acid
gsiB−6.87SigB, SigIResponse to water deficitsGeneral stress protein
spoVM−6.61SpoIIID, SigEInitiation of spore coat assemblySpore coat proteins
yqeI−6.59-Similar to RNA-binding protein, putatively involved in ribosome assemblyTranslation
ydbP−6.14-Similar to thioredoxin-
yuxO−6.01-Similar to thioesterase-
spoIIAA−5.85SigF, Spo0A, AbrB, SigG, SinR, SigHControl of SigF activitySporulation proteins
cspD−5.67-RNA chaperoneTranscription elongation/termination
RNA chaperones
yurT (glxB)−5.53-Detoxification of methylglyoxalResistance against oxidative and electrophile stress
ytpP−5.44SpxCleavage of CoA moieties from modified proteinsProtein modification
yhfF−5.15-Unknown-
ykuS−5.00-Unknown-
nin−5.00ComKGenetic transformation, DNA uptakeGenetic competence
trxA−5.00CtsR, SigB, SpxProtection of proteins against oxidative damageResistance against oxidative and electrophile stress
yraH−4.68-Unknown-
yhaN (sbcE)−4.67LexADNA double-strand break repair and competenceDNA repair/recombination
flgL−4.61SigD, ComK, DegU, ScoCMotility and chemotaxisFlagellar proteins,
swarming
yolI (bdbA)−4.59AbrB, YvrHb, Rok, DnaA, AbhOxidative folding of proteinsChaperones/protein folding
fliH−4.42CodY, SigD, DegU, Spo0A, SwrAMovement and chemotaxisFlagellar proteins,
swarming
crh−4.33CcpAControl of carbon fluxControl of transcription factor
Disclaimer/Publisher’s Note: The statements, opinions and data contained in all publications are solely those of the individual author(s) and contributor(s) and not of MDPI and/or the editor(s). MDPI and/or the editor(s) disclaim responsibility for any injury to people or property resulting from any ideas, methods, instructions or products referred to in the content.

