Article

Sugar-Induced Cell Death in the Yeast S. cerevisiae Is Accompanied by the Release of Octanoic Acid, Which Does Not Originate from the Fatty Acid Synthesis Type II Mitochondrial System

1
Skryabin Institute of Biochemistry and Physiology of Microorganisms, Federal Research Center “Pushchino Scientific Center for Biological Research of the Russian Academy of Sciences”, Pushchino 142290, Russia
2
Institute for Biological Instrumentation, Federal Research Center “Pushchino Scientific Center for Biological Research of the Russian Academy of Sciences”, Pushchino 142290, Russia
*
Author to whom correspondence should be addressed.
Appl. Microbiol. 2023, 3(3), 722-734; https://doi.org/10.3390/applmicrobiol3030050
Submission received: 20 June 2023 / Revised: 7 July 2023 / Accepted: 10 July 2023 / Published: 12 July 2023

Abstract

:
Incubation of the yeast S. cerevisiae with glucose, in the absence of other nutrients, leads to Sugar-Induced Cell Death (SICD), accompanied by the accumulation of Reactive Oxygen Species (ROS). Yeast acidifies the environment during glucose metabolism not only as a result of the activity of the H+-ATPase of the plasma membrane but also due to the release of carboxylic acids. Acetic acid is known to induce apoptosis in growing yeast. We analyzed the composition of the incubation medium and found octanoic acid (OA) but no other carboxylic acids. Its concentration (0.675 µM) was significantly lower than the one at which OA had a toxic effect on the cell. However, the theoretically calculated concentration of OA inside the cell (about 200 μM) was found to be high enough to lead to cell necrosis. To test the hypothesis that OA might cause SICD, we used a ΔACP1 strain incapable of synthesizing OA in the yeast mitochondrial Fatty Acid Synthesis type II system (FAS-II). The deletion of the ACP1 gene did not affect the OA content in the medium. But, on the other hand, OA is a precursor of lipoic acid, which has antioxidant properties. However, strains with deleted genes for lipoic acid biosynthesis from OA (ΔPPT2, ΔLIP2, ΔLIP5, and ΔSGV3) showed no change in ROS and SICD levels. Thus, lipoic acid synthesized in FAS-II does not protect cells from ROS accumulated during SICD. We conclude that OA synthesized in the mitochondrial FAS-II system and its derivative lipoic acid are not involved in SICD in yeast S. cerevisiae.

1. Introduction

The discovery of apoptosis in yeast caused a significant increase in scientific interest in the phenomenon of cell death in lower eukaryotes [1]. In 1991, it was found that stationary cells of the yeast Saccharomyces cerevisiae die when incubated with glucose in the absence of other nutrients necessary for growth. Cell death had the nature of apoptosis and was called Sugar-Induced Cell Death—SICD [2] and was caused by an excess of ROS [3]. A deep study of SICD showed that it does not depend on ACP pathways [2] and includes the step of glucose or fructose phosphorylation [4]. The latter fact suggests that abnormalities in glucose catabolism are the cause of SICD. SICD of apoptotic nature has been described in several yeast strains, occurring at a wide range of temperatures and in the presence of various sugars [2,5]. Later, Lee and coworkers found that stationary S. cerevisiae cells, when incubated with glucose alone, consume 21 times more oxygen than exponentially growing cells growing in a rich environment [6], which explains the excess accumulation of ROS. It is hypothesized that the Crabtree effect includes competition between the mitochondrial respiratory chain and glycolytic enzymes for ADP and inorganic phosphate. The suppression of SICD in stationary yeast culture by exogenous phosphate and succinate, according to the authors, confirms this assumption. SICD can occur not only in aerobic culture but also under strictly anaerobic conditions. This was observed in bottom-fermenting yeast Saccharomyces pastorianus [7]. This study showed that ROS generated in the respiratory chain is not the only cause of SICD. We later showed that incubation of the exponentially growing yeast S. cerevisiae with glucose in the absence of other components necessary for growth also leads to SICD, which was of the nature of primary necrosis. Unlike stationary cells, SICD in exponentially growing yeast occurred much faster (minutes vs. days in cells in the stationary phase) as a result of ruptures in the nuclear, mitochondrial, and plasma membranes and affected only cells in the S-phase of the cell cycle [8]. The latter fact is the fundamental difference between SICD in exponentially growing cells and cells in the stationary phase. This fact also suggests the presence of SICD regulatory mechanisms associated with the yeast cell life cycle. Thus, we can talk about the manifestation of such a phenomenon as controlled primary necrosis [9]. A notable feature of SICD in growing culture was its sensitivity to extracellular pH and membrane potential. SICD was completely prevented when yeast was incubated with glucose in a medium with pH 7.0 (dissipation ΔpH) or in the presence of 150 mM KCl (dissipation ΔΨ) [10]. These facts cast doubt on the thesis that primary necrosis occurs only as a result of extreme external physical or chemical impact on the cell. In fact, SICD occurred under conditions where there were no extreme external impacts on the cell. Instead, an imbalance in the availability of all nutrients needed for growth led to SICD in the form of primary necrosis. Notably, the mitochondrial respiratory chain in exponentially growing yeast is not involved in the development of SICD. This was shown both in the case of petite mutants obtained by treating yeast cells with ethidium bromide and in the ΔAFO1 strain, which lacks a large mitochondrial ribosomal subunit [10].
When developing a SICD in an unbuffered environment, it is important to consider the following fact. During glycolysis, acidification of the medium occurs not only as a result of the release of protons by the H+-ATPase of the plasma membrane during ATP hydrolysis. The release of carboxylic acids also makes a significant contribution to the decrease in the pH of the medium [11,12]. Among these acids, of particular interest is acetic acid, which leads to apoptosis in exponentially growing yeast cell [13,14,15]. Incubation of S. cerevisiae cells with 20–80 mM acetic acid led to permeabilization of the mitochondrial membrane with the release of cytochrome C into the cytosol, accumulation of ROS, a decrease in oxygen consumption, and a drop in the mitochondrial membrane potential [14]. Thus, the destruction of mitochondria [14] induced by acetic acid is the initial stage characteristic of apoptosis. Therefore, determining the presence and concentration of acetic acid in the glucose incubation medium was the original goal of this study.
Octanoic acid (OA) is a highly toxic compound and is produced by yeasts during alcoholic fermentation under hypoxic conditions as by-products of lipid synthesis [16,17,18]. OA synthesis in the cytosol occurs in the large multidomain FAS-I complex as an intermediate step in the synthesis of Long Chain Fatty Acids. The amount of OA released into the incubation medium directly correlates with its intracellular content [17] and can reach concentrations as high as 0.11 mM upon incubation in a rich medium [16]. According to other data, 0.3 mM exogenous OA leads to a 25% decrease in the growth rate [19]. Exogenous OA inhibits yeast growth even more effectively in the presence of ethanol and in more acidic environments [16], and this presents a major problem for winemakers as it stops fermentation before all the sugar has been fermented to alcohol. The addition of so-called “Yeast Ghosts”—dried yeast—to the must is one of the most widespread ways to detoxify OA in grape must. Their protective effect against OA is based on the ability of the yeast cell wall to absorb OA [20]. However, the cell wall is not able to completely protect the cell from OA penetration through passive diffusion due to its high lipophilicity. In an intracellular environment with pH near to neutral, OA dissociates and causes acidification of the intracellular space and accumulation of a toxic anion [21]. H+-ATPase of the plasma membrane, the main regulator of intracellular pH, is activated to restore pH in the cytosol [22]. The lipophilicity of OA also accounts for its other cell-damaging property. OA causes membrane leakage but not a change in membrane fluidity or hydrophobicity [23,24]. As a result of damage to the integrity of the plasma membrane, the operation of transmembrane transport systems can be disrupted [25]. However, this severe disruption of membrane integrity can be mitigated by changing the lipid composition of the membrane. For example, incubation of yeast with OA and simultaneously with oleic acid resulted in yeast resistance to the toxic effects of OA and reduced membrane leakage [26]. The same effect was observed in the genetically modified yeast S. cerevisiae BY4741 with an increased synthesis of oleic acid [26]. The main defense mechanism of the yeast cell against the toxic effects of exogenous OA is the extrusion of OA from the cytosol [21,27] and the trapping of OA on the cell wall [20]. At the same time, OA, like other fatty acids, is of great interest for the production of biofuels. Biofuels represent a viable alternative to fossil fuels and much efforts are currently being made to increase the yield of free OA through genetically engineered modification of the cytosolic FAS-I complex [26,28,29,30].
OA is also synthesized in mitochondria in the FAS-II system, which is completely independent of the cytosolic FAS-I system. FAS-II is present in both prokaryotes and eukaryotic mitochondria and is highly conserved [31,32,33,34]. In the mitochondrial FAS-II system, OA is synthesized as a precursor of lipoic acid, a sulfur-containing cofactor of several important multienzyme complexes [35,36,37,38]. OA synthesis in mitochondria is controlled by the ACP1 gene [35]. The subsequent synthesis of lipoic acid from OA is controlled by several genes: PPT2, LIP2, LIP5, GCV3 [38]. In the yeast S. cerevisiae, lipoic acid is attached as a cofactor to the E2p subunit of pyruvate dehydrogenase, the E2o subunit of α-ketoglutarate dehydrogenase, and to the H protein of the glycine cleavage enzyme [39]. In addition to its contribution to various enzyme complexes, lipoic acid can also protect the cell from oxidative stress, since it can be found in both reduced and oxidized forms [40]. The latter is of particular interest in relation to the excessive generation of ROS in SICD.
In light of the above facts, it was important to establish the relationship between carboxylic acids in the incubation medium and the development of SICD. In this study, we aimed to: (a) establish the presence and concentration of acetic acid (and/or other carboxylic acids) in the medium during the incubation of yeast with glucose and (b) estimate the role of OA derived from the FAS-II mitochondrial complex in the development of SICD.

2. Materials and Methods

2.1. Culture Growth

The S. cerevisiae strain BY4741 (MATa his3Δ1 leu2Δ0 lys2Δ0 ura3Δ0), BY4742 (MATα his3Δ1 leu2Δ0 lys2Δ0 ura3Δ0), and BY4742-derived null mutant strains (ΔACP1, ΔPPT2, ΔLIP2, ΔLIP5, ΔGCV3) were obtained from the Euroscarf collection. The culture grew on the standard YPD medium (Applichem, Darmstadt, Germany) for 15–17 h (mid exponential phase) and was twice washed with distilled water. Yeast cells were pelleted and suspended (1 g/10 mL w/w, 1.45 × 10⁸ cells/mL) in MilliQ water.

2.2. 1,2,3,-Dihydrorhodamine (DHR) Staining

To estimate number of cells with elevated intracellular ROS level, we used DHR (Sigma-Aldrich, St. Louis, MO, USA). 5 µL of 0.5 mg/mL DHR in DMSO were added to 250 µL cell suspension in water. The samples were incubated in a ThermoMixer (Eppendorf, Hamburg, Germany) for 1 h at 30°. The cells were pelleted at 13,000× g for 1 min, and the supernatant was discarded. The cells were washed once with 0.5 mL of water, and the cell pellet was suspended in 250 µL water. Another 250 µL of cell suspension in water without addition of DHR was subjected to all above steps to obtain cells for propidium iodide (PI) staining (see below).

2.3. SICD Assay and Flow Cytometry

SICD assay for DHR-stained and unstained cells was done in parallel series of tubes. 250 µL of cells obtained as described above was distributed in 50 µL into four tubes. This was the standard test kit for the SICD. Nothing was added to the first tube—this was the control. The second tube served as the main sample for checking the SICD. In the third tube, water was replaced with buffer (50 mM HEPES, pH 7.0) to test the effects of neutral pH on the SICD. 2.5 µL of 3 M KCl was added to the 4th tube to check the value of the membrane potential on SICD. Then, to induce SICD, 2.5 µL of 2 M glucose solution was added to all tubes (final [C] = 100 mM), except for the 1st one. The samples were incubated in a ThermoMixer (Eppendorf, Hamburg, Germany) at 30 °C for 1 h. To proceed to flow cytometry to the samples with DHR stained cells 1 mL of water was added. PI staining was used to determine the percentage of dead cells. To the samples with not DHR-stained cells, 150 µL of 4 µg/mL PI (Sigma-Aldrich, St. Louis, MO, USA) was added, and after brief (1–2 min) incubation at RT, 0.8 mL of water was added. All samples were kept on ice. A total of 100,000 cells were counted at each experimental point using NovoCyte Flow cytometer (Agilent, Santa Clara, CA, USA). DHR-stained cells were detected using 488 nm for excitation and 530/30 nm for emission. PI-stained cells were detected using 488 nm for excitation and 572/28 nm for emission. All assays were repeated three times, and the mean results are presented.

2.4. Preparation of FAME for Gas Chromatography

Cells were prepared as described in the culture growth section. To 10 mL of the cell suspension in water (1 g/10 mL, 1.45 × 10⁹ cells total), 0.5 mL of 2 M glucose was added. The cells were incubated for 1 h at 30 °C in a water bath with occasional shaking. Cells were pelleted at 5000× g for 7 min. Toluene (0.4 mL) was added to the supernatant and vortexed for 2–3 min. After phase separation (3500× g, 5 min), the toluene fraction was used for methyl esterification according to [41]. Briefly, 0.4 mL toluene, mixed with 3 mL methanol and 0.6 mL 8.0% (w/v) HCl solution (diluted in methanol), was vortexed and incubated at 45 °C for 20 h to form fatty acid methyl esters (FAME). FAMEs were extracted from the mixture by the addition of 2 mL H2O and 2 mL hexane. After vortexing and phase separation, the organic phase was utilized for GC-MS analysis.

2.5. Mass Spectrometry and Gas Chromatography

The mass spectra of the compounds were recorded on an LCQ Advantage MAX quadrupole mass spectrometer (Thermo Finnigan, San Jose, CA, USA) using a single-channel syringe pump for direct injection of the sample into an atmospheric pressure chemical ionization (APCI) chamber. The collection and processing of mass spectrometric data was carried out using the Xcalibur software. More complete information on the structure of metabolites was obtained from the analysis of MS/MS spectra at a collision energy of 20–40% in positive ions.
The fatty acid composition was analyzed using a gas chromatograph–mass spectrometer 7890B + 5977B (Agilent, Santa Clara, CA, USA). FAME in hexane were separated on a 5% phenyl-methyl silicone capillary column HP-5MS (0.25 mm × 30 m) using a temperature gradient from 45 to 300 °C at 40 °C/min. Fatty acids and other lipid components were ionized by electron impact and analyzed in the scan mode. The compounds were identified using the NIST17 mass spectrometer library. Fatty acid content was determined as the percentage of the total ion current peak area.

3. Results and Discussion

SICD in the exponentially growing yeast S. cerevisiae has the nature of primary necrosis, affects only cells in the S-phase, and is suppressed by dissipation of ΔpH or membrane potential [8,10]. But the specific molecular mechanism behind the development of SICD is still unclear. It is known that yeast cells acidify the medium during glucose metabolism not only due to the activity of PM H+-ATPase but also as a result of the release of carboxylic acids [11,12] and possibly acetic acid. We decided to test the possibility of induction of necrosis by acetic acid in exponentially growing cells, since it is known to induce apoptosis in exponentially growing yeast cells [42]. First, it was necessary to find out whether acetic acid appears at all in the medium during incubation with glucose. Mass spectrometric analysis of the medium after incubation of strain BY4741 with glucose showed that there were no peaks in molecular weights corresponding to acetic acid or Krebs cycle acids. However, mass spectrometry showed the presence of a compound with a molecular weight of 144 daltons in the medium. At the same time, this compound was not detected in the medium after cell incubation with glucose at pH 7 or in the presence of 150 mM KCl, i.e., when SICD was suppressed [10]. Thus, a compound with a mass of 144 daltons is released into the medium from cells with a damaged membrane and not as a result of the functioning of the putative transporters. After analyzing the metabolic pathways associated with glycolysis, the only suitable candidate was OA, a precursor of lipoic acid, which, in turn, is involved in many biosynthetic pathways as a cofactor. Later, when we acquired the technical capabilities, this assumption was confirmed using the GC-MS method (Supplementary Figure S1). The concentration of OA in the medium was 0.7 ± 0.07 μM. This is significantly lower than those concentrations that inhibit the growth rate of yeast cells [16,19], 0.11 and 0.3 mM, respectively. It should be noted here that these high concentrations of OA were found either in rich media or in synthetic media. But, in the above cases, the cells were able to grow in this medium, in contrast to our incubation medium consisting of 100 mM aqueous glucose solution. Nevertheless, we decided to test the possibility that OA in the medium (even at such a low concentration) could induce cell death because it is a toxic compound. For this, after a standard SICD induction procedure (1 h incubation of cells with glucose), the cells were pelleted and the supernatant was added to fresh cells (±100 mM glucose). To verify SICD, cells were incubated in parallel in 50 mM HEPES buffer pH 7.0 (±100 mM glucose) in which SICD was completely inhibited. The results are presented in Figure 1.
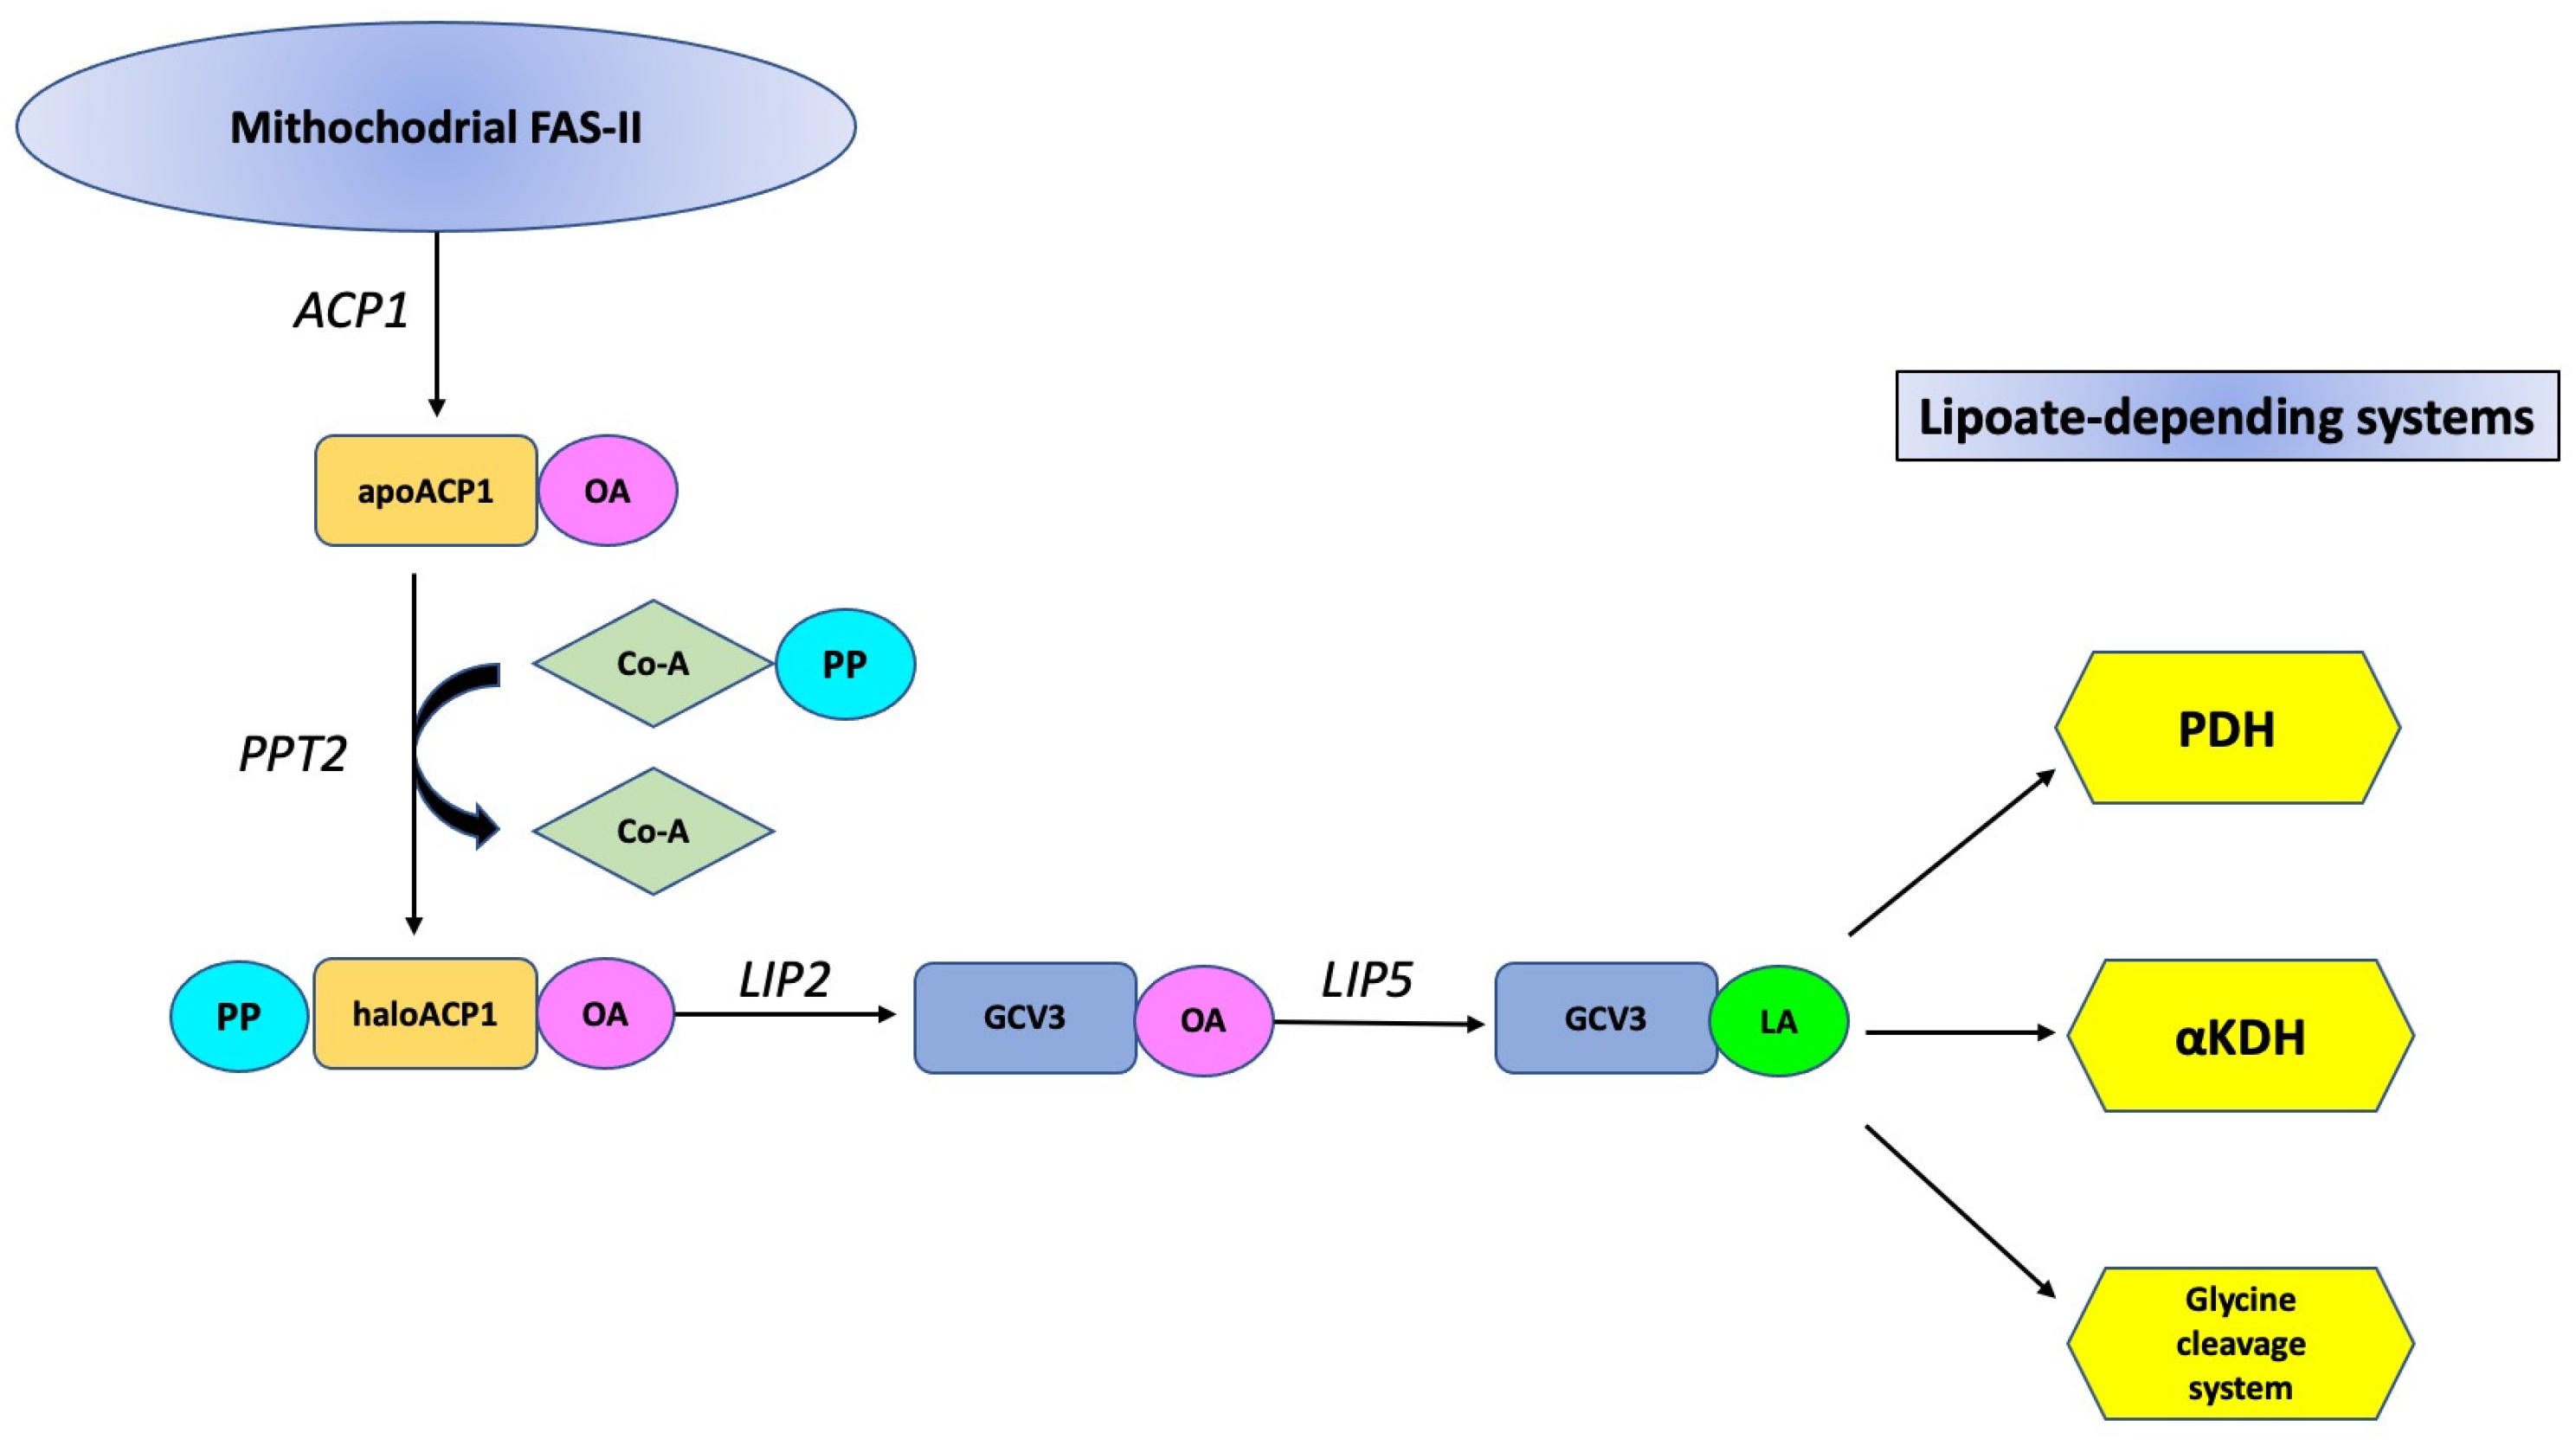
As can be seen, in the presence of glucose, the SICD in the sample with OA (super) did not differ from the level of SICD in the sample without OA (water). The observed difference is not significant (p > 0.05). At the same time, super with OA leads to a small but significant (p < 0.05) increase in dead cells in the medium without glucose. However, we believe that this is most likely an artifact resulting from the presence of glucose residues in the super (Supplementary Figure S2). Thus, this observed small but significant increase in the number of dead cells is most likely the result of SICD, but not the toxic effects of OA per se. We conclude that OA released from dead cells does not lead to additional cell death when it is present in the incubation medium. Obviously, the concentration of OA is too low to cause necrosis. But we must take into account that this is the concentration of OA, which appeared in 10 mL of the incubation medium after the death of a part of the cells and, therefore, is very highly diluted compared to the real intracellular one. We have attempted to calculate the possible intracellular concentration of OA. Cell suspension of 10 mL volume contains 1.45 × 10⁹ cells. The average level of SICD in BY4741 cells is 24%. This means that 3.48 × 10⁸ cells are dead, and their membrane is damaged. Given that the volume of one cell is 1 pL [43], we obtain 34.8 µL as the total volume of all dead cells. Based on the concentration of OA in the medium (0.7 µM), the intracellular concentration of OA is 194 µM. This is already a high enough concentration to lead to cell death. Naturally, the question arose about the source of OA in the cells of S. cerevisiae. In yeast, there are two independent pathways for OA synthesis. The first is the synthesis of OA in the FAS-I cytoplasmic complex during alcoholic fermentation as a result of the thioesterase activity of several enzymes [28]. The second is the synthesis in the mitochondrial FAS-II complex by the mitochondrial matrix acyl carrier protein encoded by the ACP1 gene [35]. In mitochondria, OA is a precursor for the synthesis of lipoic acid, which is necessary for the activity of three complexes: pyruvate dehydrogenase, which catalyzes the formation of acetyl-CoA from pyruvate; α-ketoglutarate dehydrogenase, which catalyzes the formation of succinate from α-ketoglutarate in the Krebs cycle; and the glycine cleavage system (GCV) involved in the utilization of glycine as the sole source of nitrogen. Another important characteristic of lipoic acid is its antioxidant properties [40], and SICD occurs in cells with an increased content of ROS [8]. To make our logic clear, it should be noted that the data published to date somehow consider mitochondria as a key element in the development of SICD. Moreover, in all the cases described, SICD had an apoptotic nature. Since it is not completely clear what and where is the trigger for the onset of necrosis in the form of SICD, we also decided to start by considering mitochondria as a possible locus of initiation of necrosis. We hypothesized that SICD is the result of some disturbance in the biosynthetic pathway for the synthesis of lipoic acid (Figure 2).
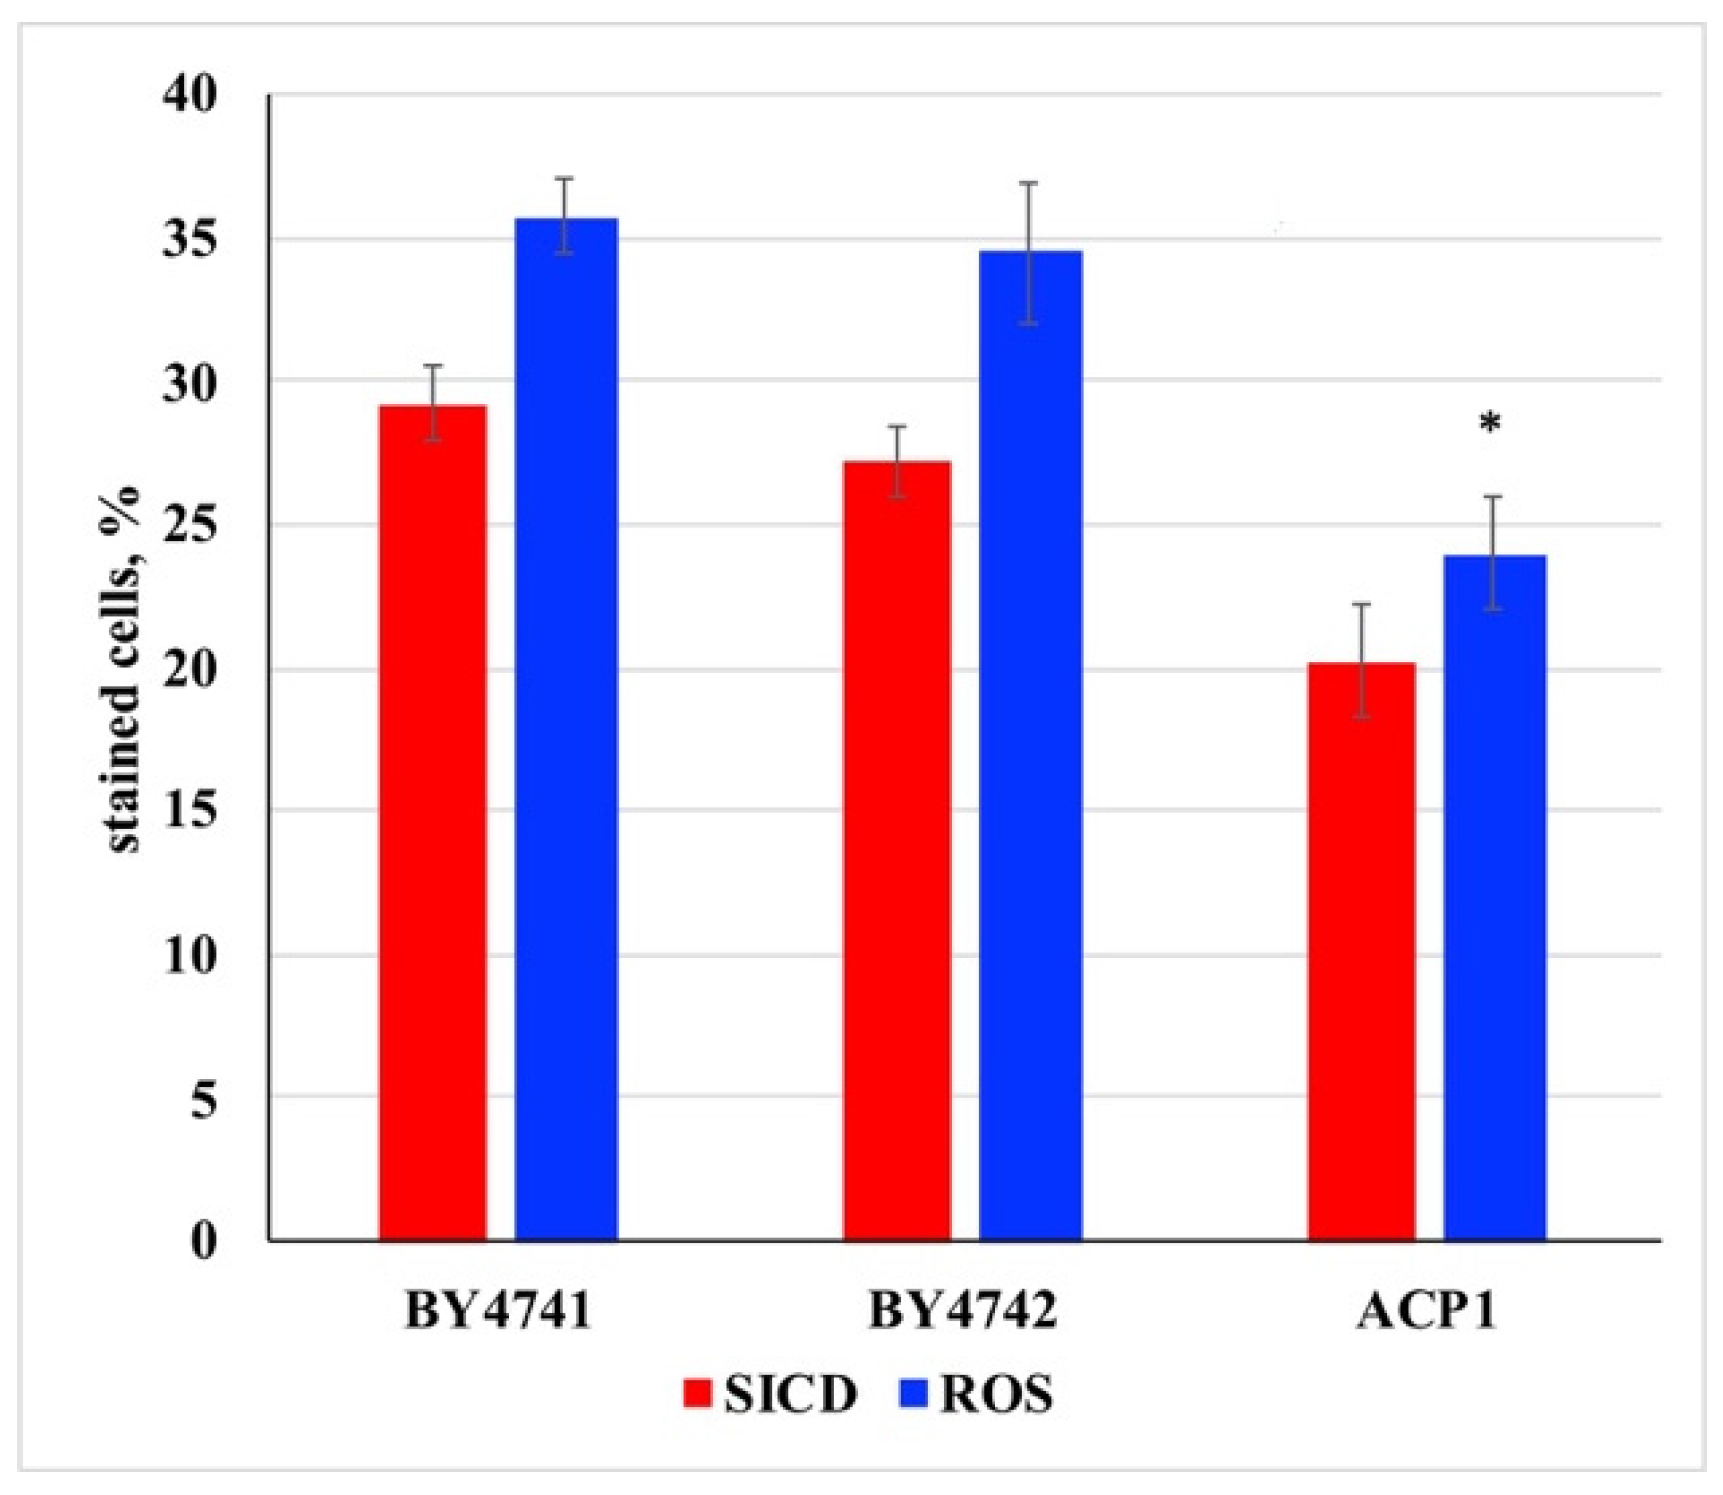
Taking into account the appearance of free OA in the incubation medium, we hypothesized that during incubation with glucose in the absence of other nutrients, OA is not converted to lipoic acid for unknown reasons. On the one hand, this leads to an excess of toxic OA, and on the other hand, to the accumulation of ROS in the cell. Both of these factors could well have caused SICD. To test our hypothesis, we determined the levels of OA, SICD, and ROS in the ΔACP1 strain. Acp1p is a mitochondrial acyl-carrying protein synthesizing OA (C8) from a shorter precursor [44]. We expected that the deletion of this gene would completely or partially prevent SICD due to the lack of OA synthesis in mitochondrial FAS-II. At the same time, we tested the levels of OA, SICD, and ROS in strain BY4742, since this strain is the parent strain of ΔACP1 and other strains involved in lipoic acid biosynthesis. The level of OA, SICD, and ROS in strain BY4741 has already been determined previously. The main difference between strains BY4741 and BY4742 is the mating type. BY4742 (MATα his3Δ1 leu2Δ0 lys2Δ0 ura3Δ0) vs. BY4741 (MATa his3Δ1 leu2Δ0 lys2Δ0 ura3Δ0). The data obtained show that SICD and ROS generation are independent of S. cerevisiae mating type. The results on the level of SICD and ROS in strains BY4741, BY4742, and ΔACP1 are shown in Figure 3.
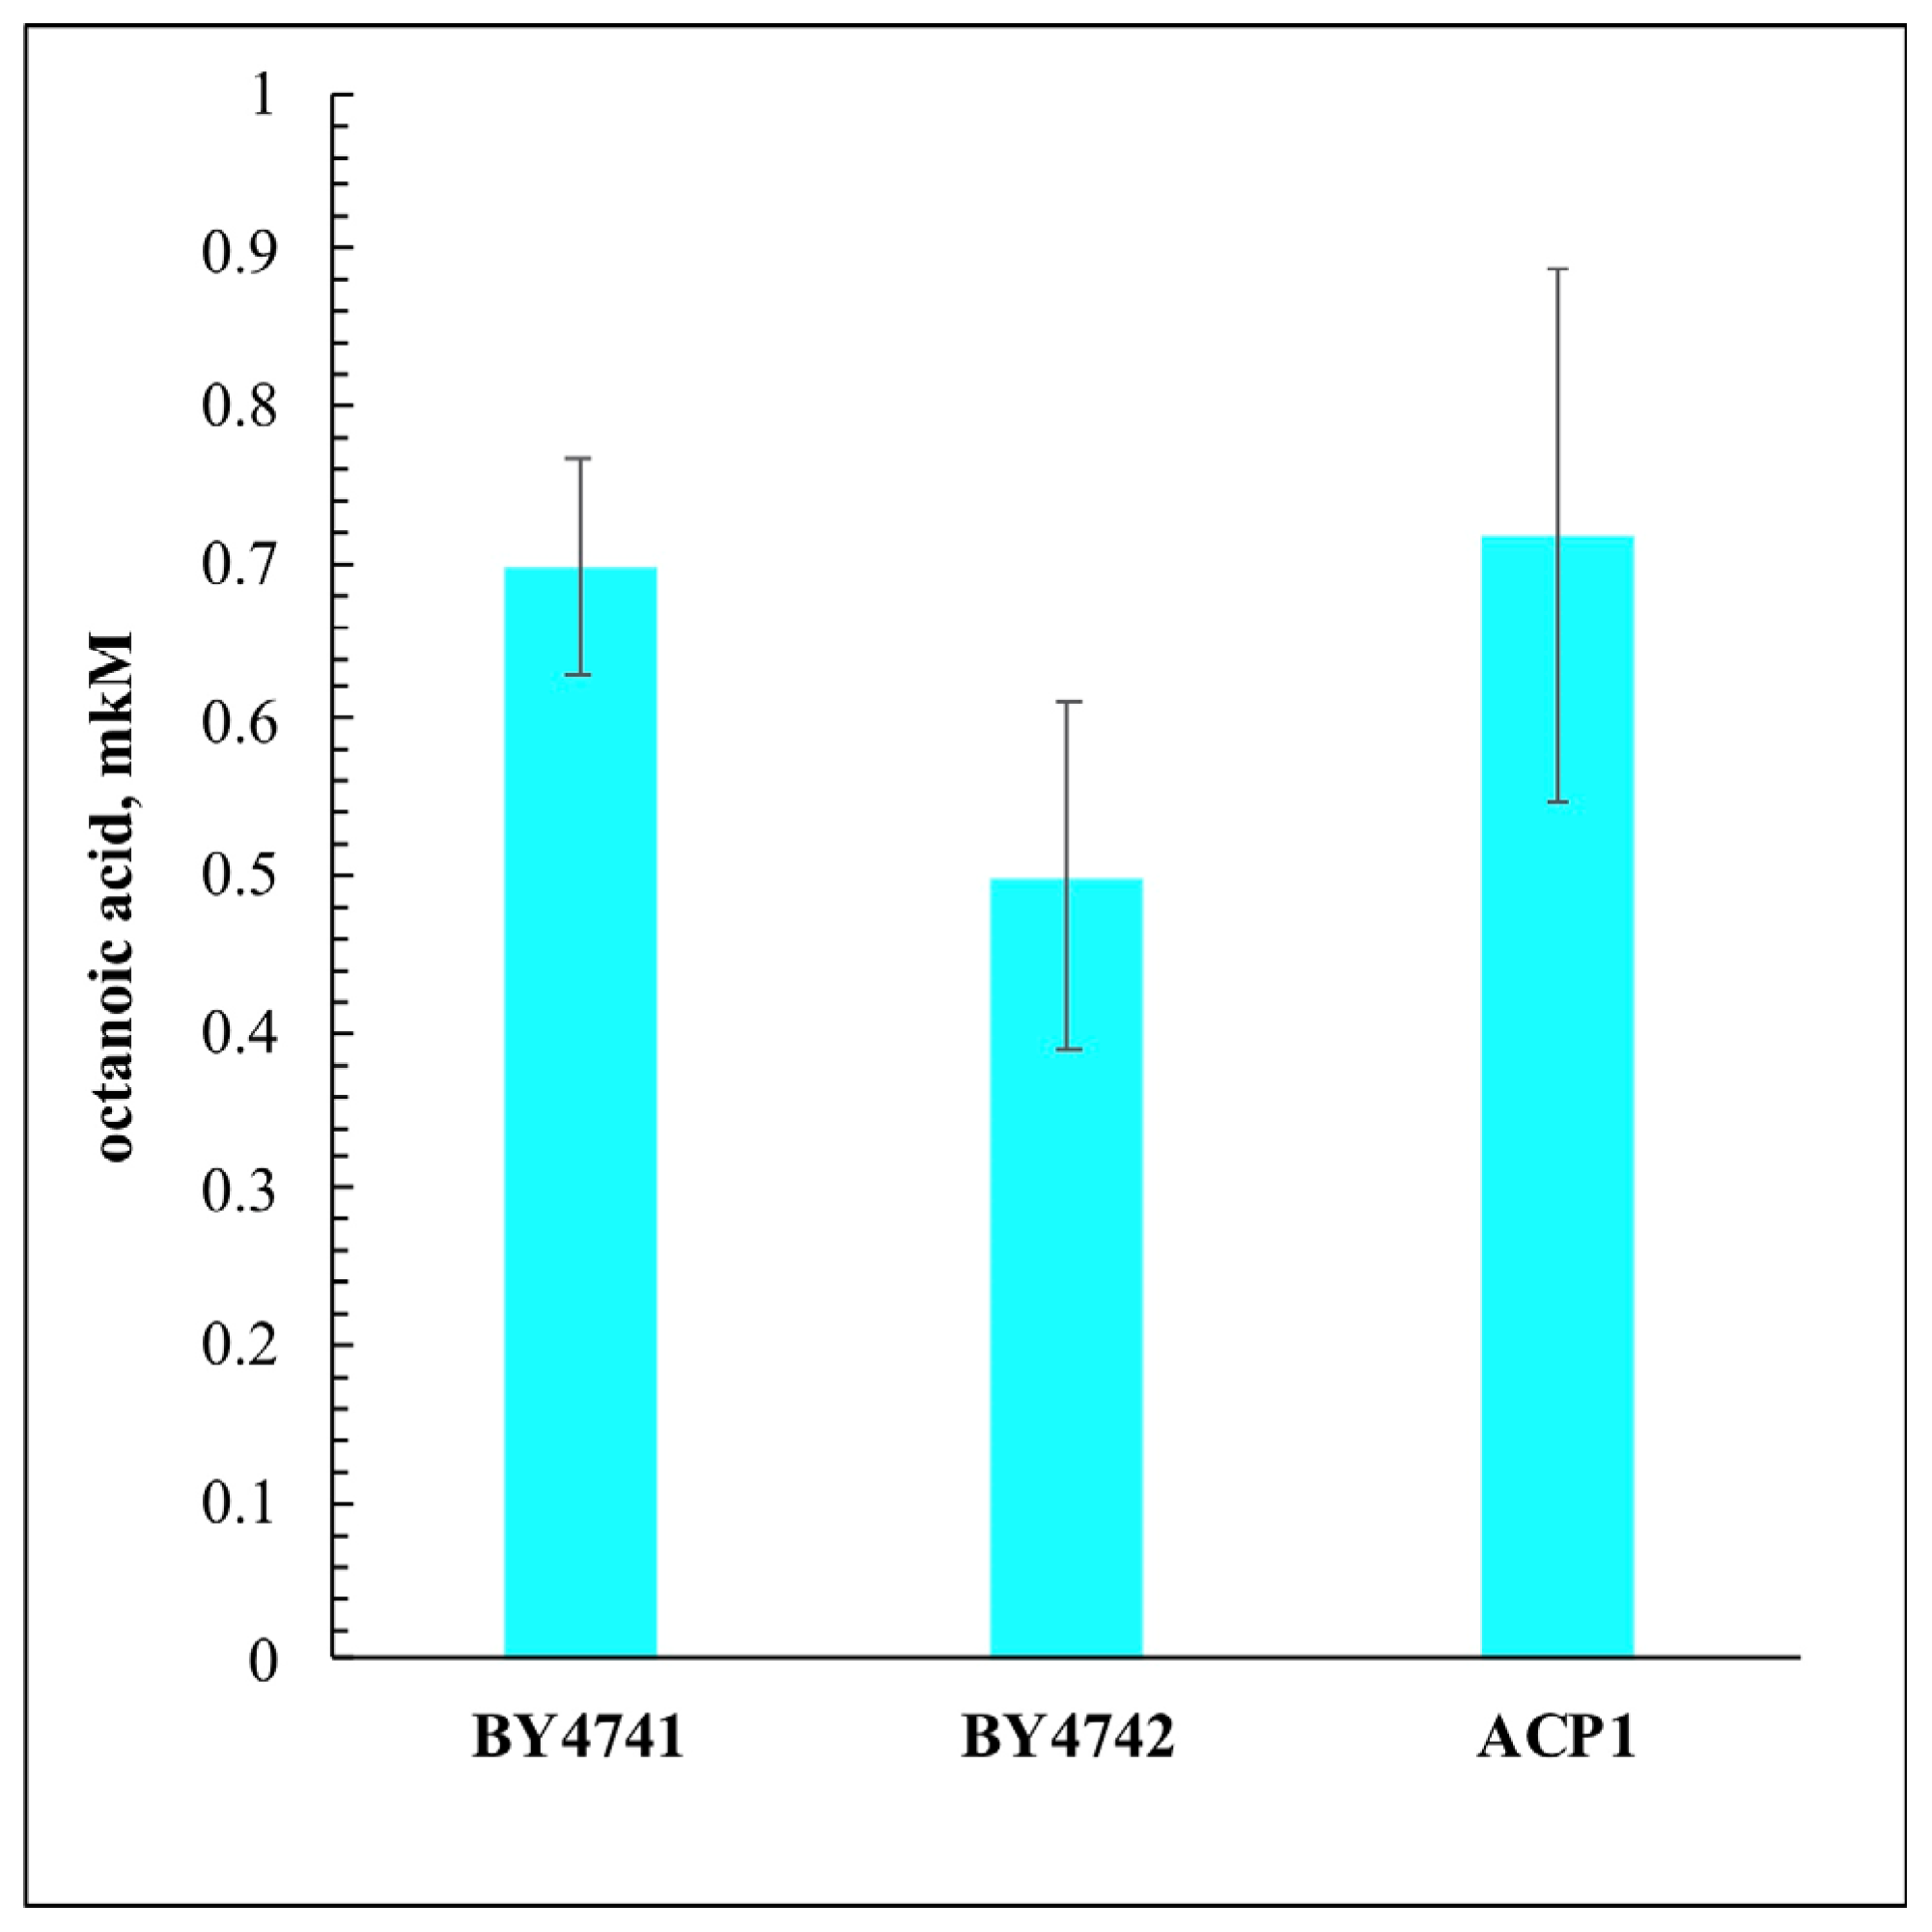
Although the numbers for the ΔACP1 strain are lower, the one-way ANOVA test showed that there was no significant difference in the level of SICD and ROS generation in the strains BY4742 and ΔACP1. A significant difference (p < 0.05) is observed only between the BY4741 and ΔACP1 strains. However, the BY4741 strain is not a parent strain of the ΔACP1 strain and therefore is not suitable for a correct comparison. Surprisingly, the deletion of the ACP1 gene did not significantly affect the concentration of OA in the medium-0.7 µM (Figure 4).
The observed difference in the concentration of OA in the incubation medium of these three strains is most likely the result of an error during the preparation of FAME, and the p-value was >0.05. The data obtained completely rule out the possible involvement of OA synthesized in mitochondrial FAS-II in the development of SICD. Therefore, OA released from cells as a result of SICD is a product of cytosolic multifunctional enzyme complexes FAS-I.
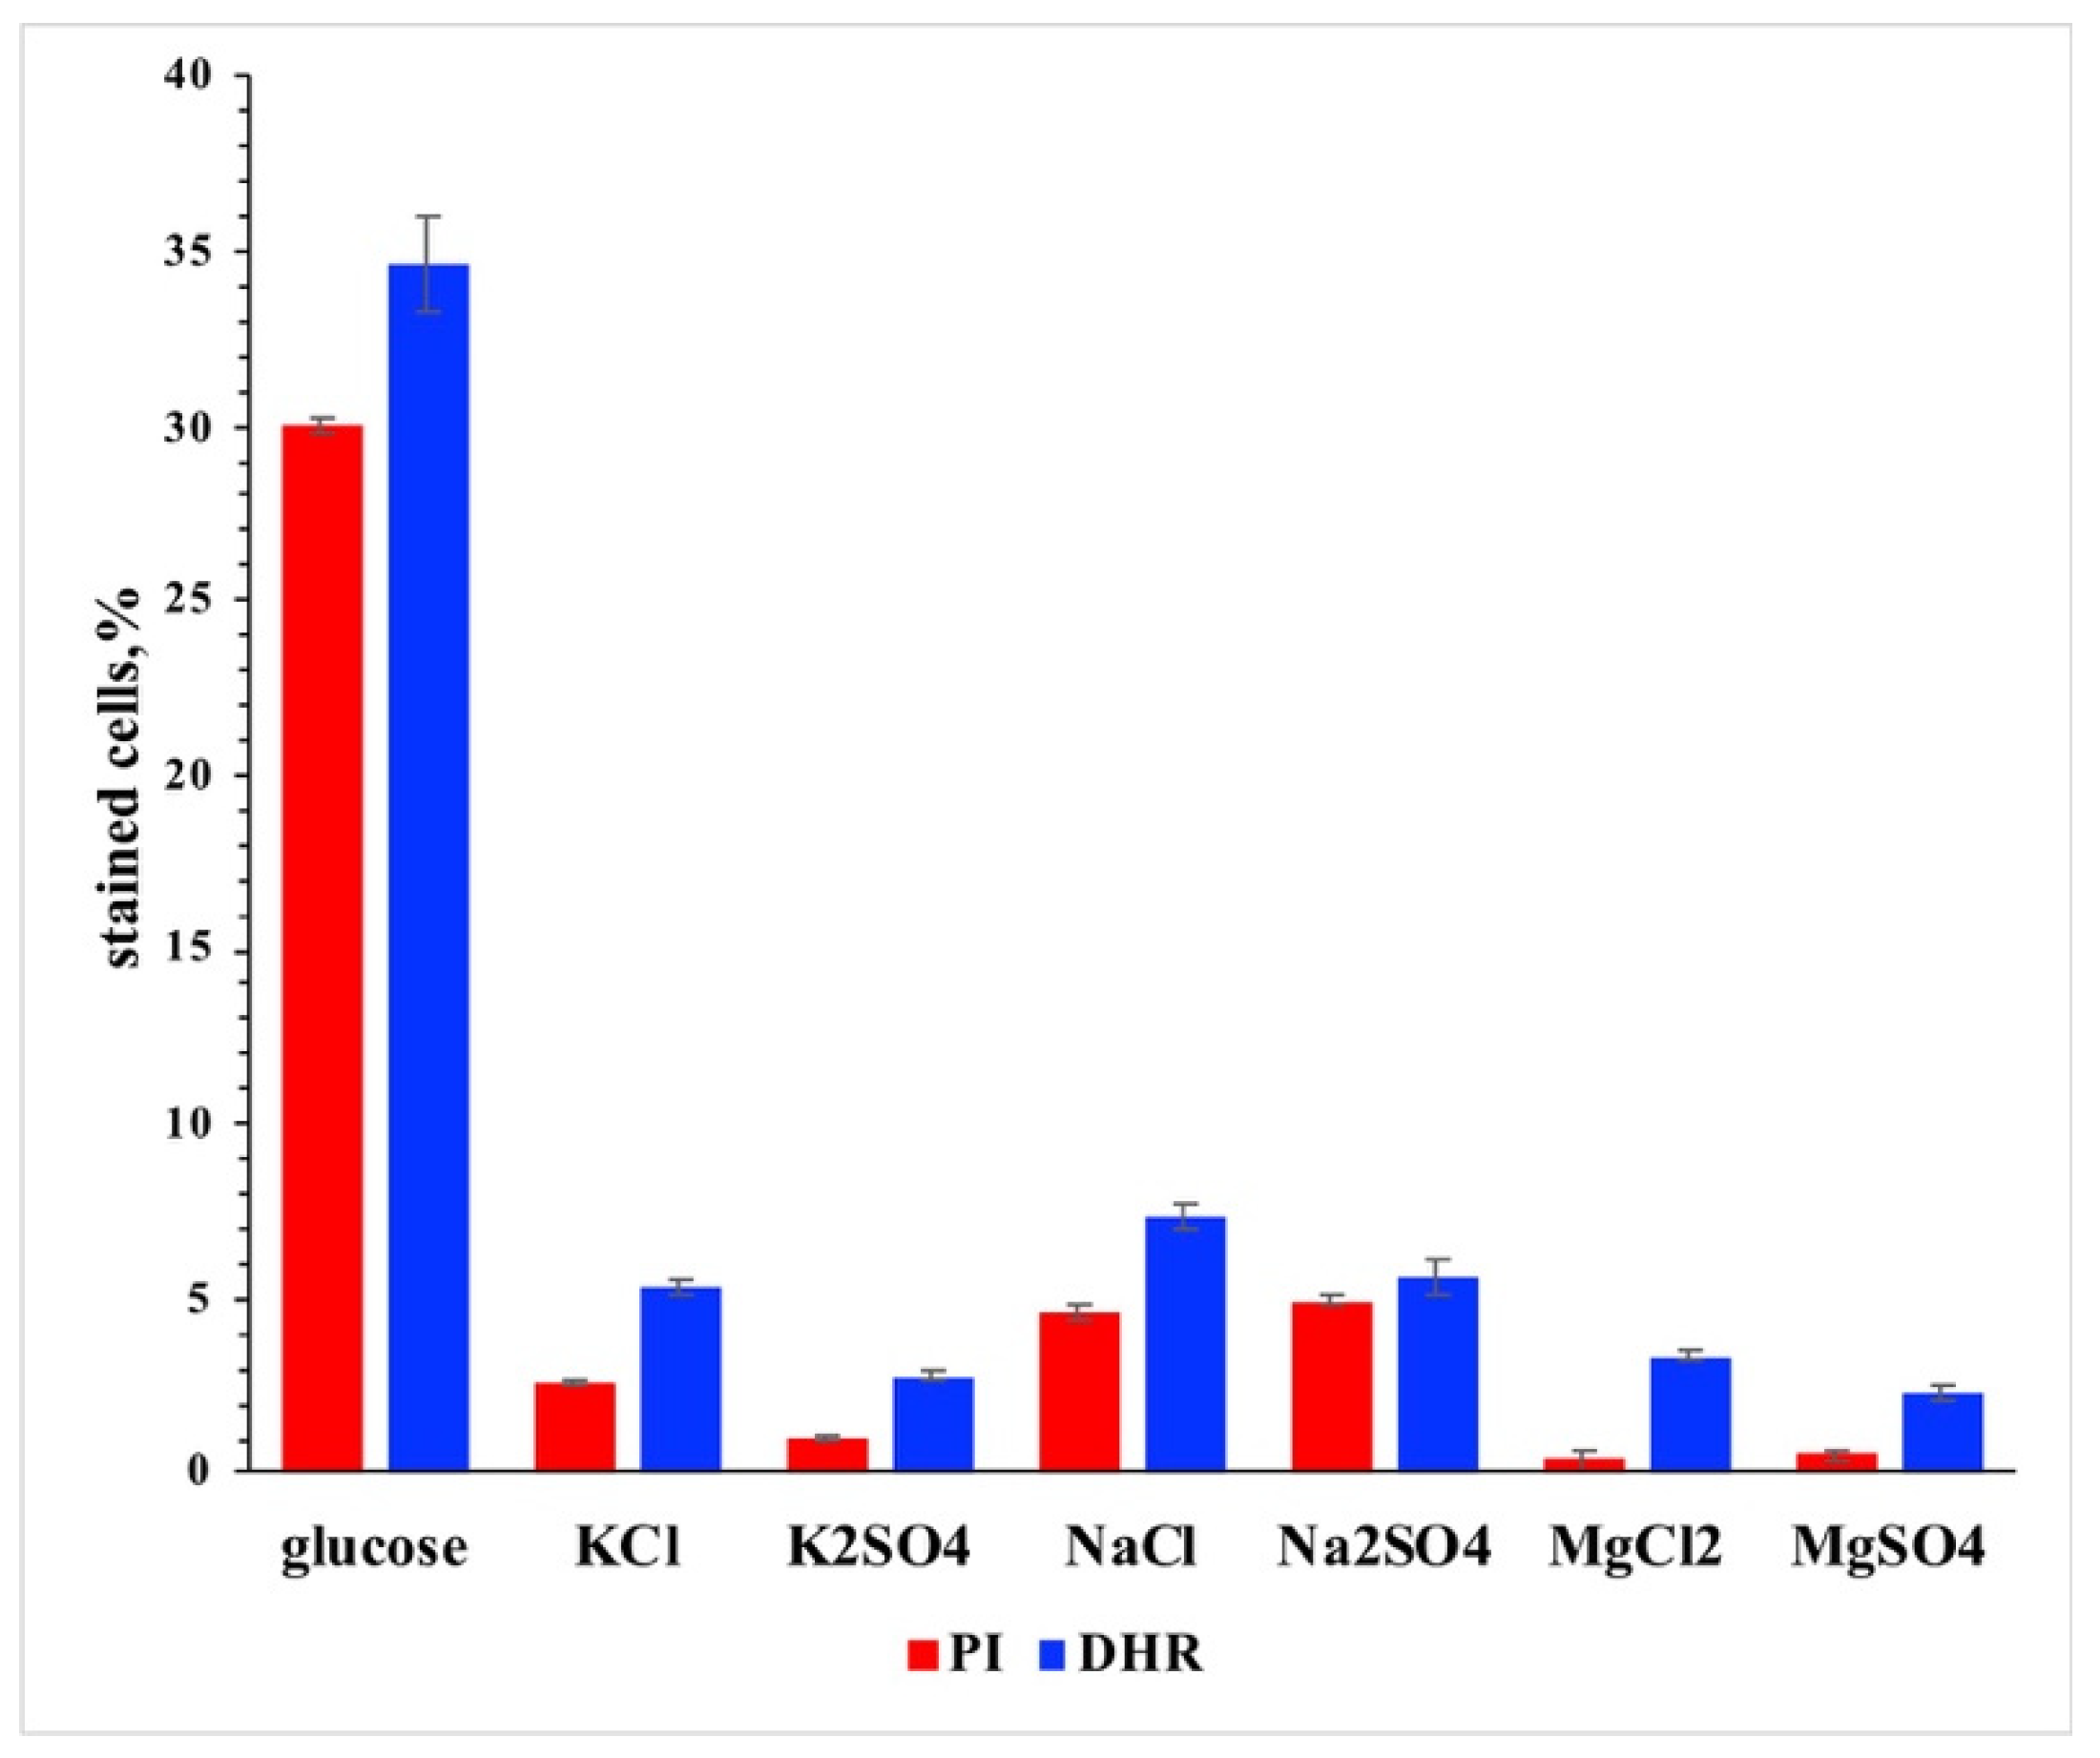
OA synthesized in the mitochondrial FAS-II system serves exclusively as a precursor of lipoic acid [36]. Lipoic acid, as noted above, has a pronounced antioxidant effect [40]. Recently, intensive biotechnological work has been carried out to improve the efficiency of obtaining lipoic acid from yeast as an important dietary supplement [45,46]. The conversion of OA to lipoic acid occurs due to the attachment of two thiol groups to 6 and 8 carbon atoms of the octanoyl domain by lipoyl synthetase encoded by the LIP5 gene [47,48]. The donor of thiol groups is S-adenosylmethionine [48], which is synthesized from ATP and methionine. Most bacteria, yeasts, and fungi use inorganic sulfate to synthesize sulfur-containing amino acids. It is important to note that most of the genes involved in methionine synthesis are expressed in the S-phase of the cell cycle (https://cyclebase.org/CyclebaseSearch accessed on 11 June 2023). SICD in exponentially growing yeast also occurs in S-phase [8] when incubated with glucose in the absence of other nutrients. It is possible that the lack of sulfate in the incubation medium resulted in OA not being converted to lipoic acid because cells in S phase do not have enough sulfur reserves to synthesize S-adenosylmethionine. To test this assumption, we evaluated the effect of inorganic sulfates on SICD levels (Figure 5).
Since SICD is voltage dependent, it was important to take into account the charge of the ions when evaluating their effect on SICD. Therefore, solutions of mono- and divalent salts were normalized by ionic strength. The effect of equimolar ion concentrations on SICD is shown in Supplementary Figure S3. We used solutions with an ionic strength of 50 mM. At the same solution ionic strength, sulfates were more effective at suppressing SICD than chlorides (p-value < 0.001). However, the overall suppression of SICD by inorganic salts was approximately at the same level, which suggests that this suppression is due to the modification of the membrane potential by ions [10] rather than the restoration of the conversion of OA to lipoic acid in the presence of the SO42− anion.
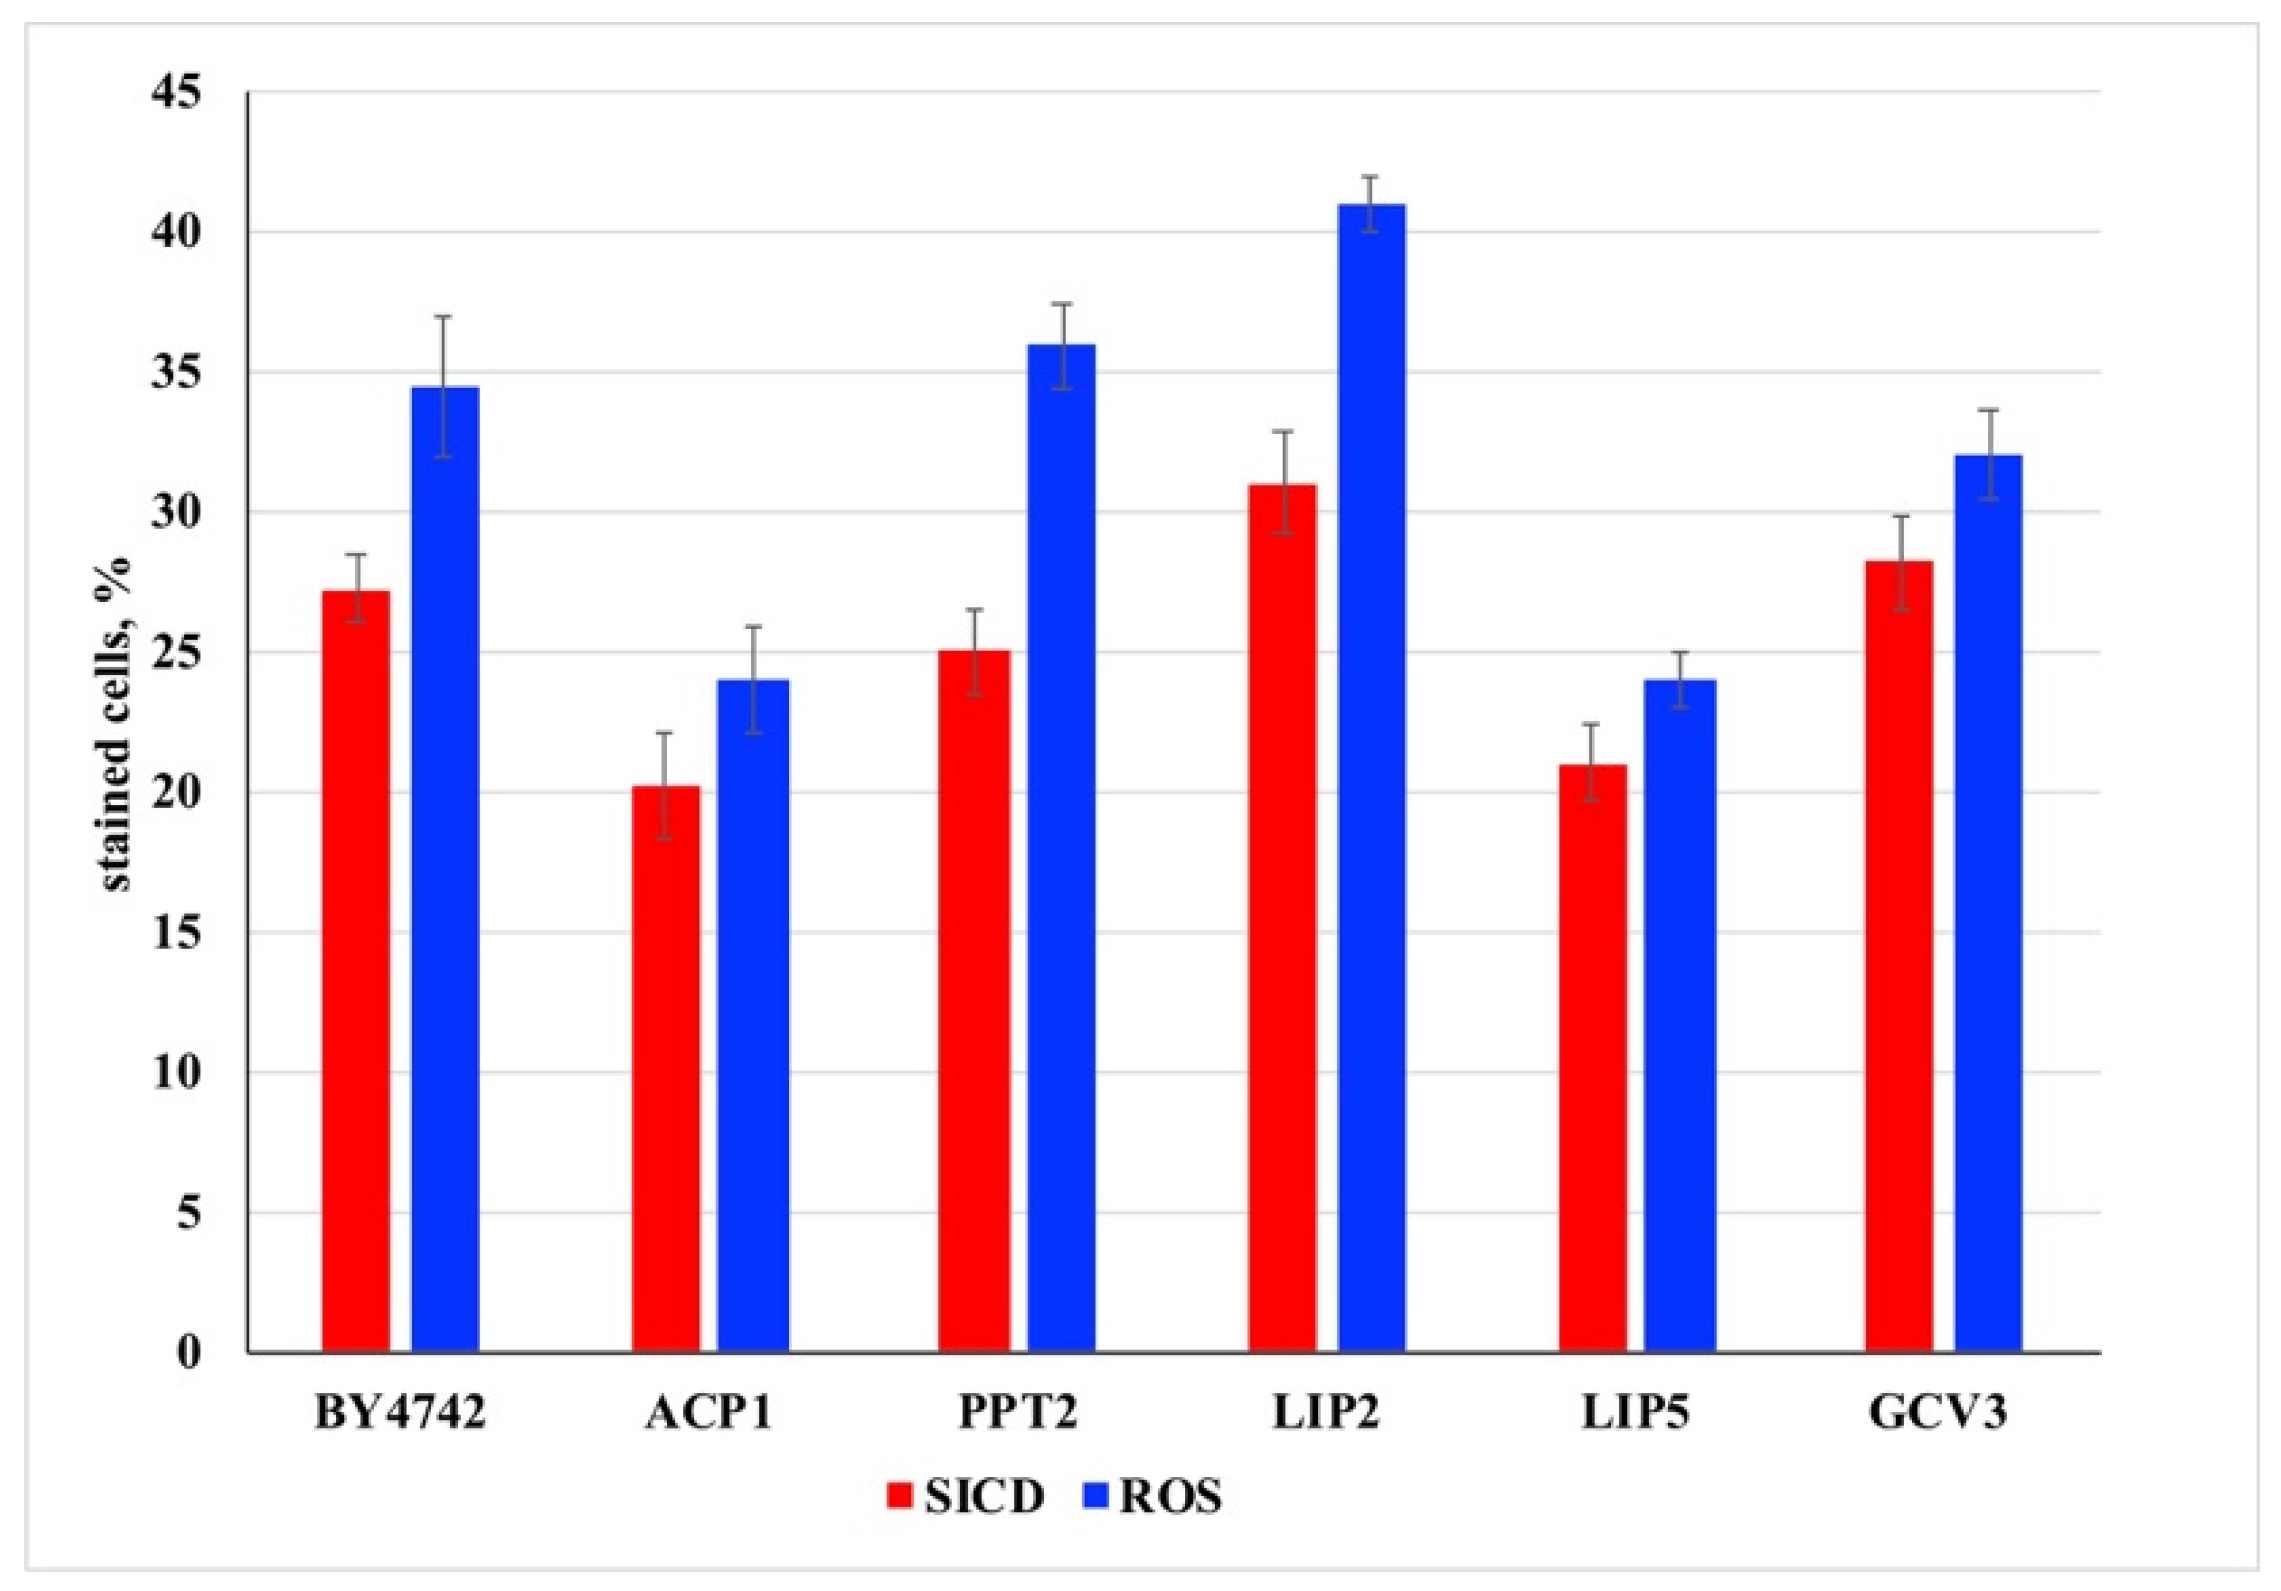
It is known that the deletion of ACP1 in yeast causes a significant decrease in the level of lipoic acid and results in a respiratory-deficient phenotype [35]. By itself, the respiratory-deficient phenotype did not affect SICD and ROS accumulation [10]. At the same time, lipoic acid was still detected in the ΔACP1 strain, although in a much smaller amount [36]. We hypothesized that this amount of lipoic acid is sufficient to effectively protect cells from ROS in G1 and G2 phases of the cell cycle, but not in the S phase, in which SICD is observed [8]. Then, blocking the lipoic acid biosynthesis pathway should have led to an increase in SICD level and accumulation of ROS due to the involvement of cells in G1 and/or G2 phases in these processes. To confirm this assumption, we tested the level of ROS and SICD in strains carrying one of the following deletions: ∆PPT2, ∆LIP2, ∆LIP5, and ∆SGV3. These genes are involved in the biosynthesis of lipoic acid at various stages (Figure 2). PPT2—phosphopantetheine:protein transferase that transfers 4′-phosphopantetheine prosthetic group from coenzyme A to the apo-ACP, converting it to holo-APC [49]. Similar to ΔACP1, cellular lipoic acid synthesis and respiration were abolished in ΔPPT2. LIP2—octanoyl-ACP:protein transferase, which transfers octanoyl domain from Acp1 to Gcv3 [37]. ΔLIP2 is a respiratory deficient strain. LIP5—is a lipoyl synthase, which catalyzes formation of lipoyl-ACP from octanoyl-ACP by the sulfur insertions on the octanoyl moiety [50]. ΔLIP5—is respiration-deficient strain. GCV3 is the H-subunit of the mitochondrial glycine decarboxylase complex [51]. After lipoylation, GCV3 transfers lipoyl-domain to other ketoacid dehydrogenase complexes [36,38]. ΔGCV3 strain is unable to utilize glycine as a nitrogen source [51] and displays a complete absence of protein lipoylation [36]. We expected that the lack of lipoic acid in any deletion strain would lead to an increase in the number of cells with an excess of ROS and a corresponding increase in SICD due to the death of some cells in the G1 and G2 phases. However, our expectations were not confirmed. The number of cells with excess ROS and the level of SICD in all tested strains were approximately the same (Figure 6).
p-value when comparing null mutants with BY4742 was >0.05. The number of cells with excess ROS in all cases slightly exceeded the number of dead cells. As we noted earlier, this is due to the fact that the time and/or sufficient concentration of ROS are necessary for the manifestation of the necrotic effect [8].
Thus, lipoic acid synthesized in yeast mitochondria is not involved in the regulation of ROS generation during the development of SICD. Taking into account that neither the respiratory chain nor octanoic acid originated from mitochondrial FAS-II, nor the deficiency of the antioxidant lipoic acid in any way affects the development of SICD and the concomitant generation of ROS, we can exclude mitochondria from the list of places in the cell where primary necrosis starts. This once again underlines the different nature of necrosis and apoptosis, in which the process of fatal cell changes begins in mitochondria. If the trigger for SICD is an excess of OA originated from the cytoplasmic FAS-I system, then it can be assumed that the initial events of primary necrosis begin in the yeast cytoplasm.

4. Conclusions

The incubation medium after SICD was analyzed to determine the presence of carboxylic acids. The presence of acetate or carboxylic acids of the Krebs cycle was not detected. However, the presence of OA in the incubation medium was established. It has been shown that the mitochondrial FAS-II system is not responsible for the appearance of OA in the medium. It has been shown that blocking the biosynthesis of lipoic acid at any stage does not lead to an increase in the number of cells with excess ROS and does not increase the SICD level. In combination with earlier data, we suggest that:
(1)
OA originated from mitochondrial FAS-II systems is not the cause of SICD;
(2)
mitochondria are not the site of initiation of primary necrosis in the form of SICD.

Supplementary Materials

The following supporting information can be downloaded at: https://www.mdpi.com/article/10.3390/applmicrobiol3030050/s1, Figure S1: TIC of GC–MS chromatogram; Figure S2: Glucose content in incubation media; Figure S3: Equimolar vs. ionic strength of chlorine and sulfate salts.

Author Contributions

Conceptualization, A.V. and V.K.; methodology, A.V., A.A. and B.B.; formal analysis, A.A., B.B., V.K. and A.V.; investigation, A.A., B.B. and A.V.; data curation, A.V.; writing—original draft preparation, A.V.; writing—review and editing, V.K.; supervision, A.V. All authors have read and agreed to the published version of the manuscript.

Funding

The determination of OA content using GC–MS was supported by the Ministry of Science and Higher Education of the Russian Federation (grant agreement No. 075-15-2021-1051).

Institutional Review Board Statement

Not applicable.

Informed Consent Statement

Not applicable.

Data Availability Statement

Data is contained within the article.

Conflicts of Interest

The authors declare no conflict of interest.

References

  1. Madeo, F.; Frohlich, E.; Frohlich, K.U. A yeast mutant showing diagnostic markers of early and late apoptosis. J. Cell Biol. 1997, 139, 729–734. [Google Scholar] [CrossRef] [PubMed] [Green Version]
  2. Granot, D.; Snyder, M. Glucose induces cAMP-independent growth-related changes in stationary-phase cells of Saccharomyces cerevisiae. Proc. Natl. Acad. Sci. USA 1991, 88, 5724–5728. [Google Scholar] [CrossRef] [PubMed]
  3. Granot, D.; Levine, A.; Dor-Hefetz, E. Sugar-induced apoptosis in yeast cells. FEMS Yeast Res. 2003, 4, 7–13. [Google Scholar] [CrossRef] [PubMed] [Green Version]
  4. Granot, D.; Dai, N. Sugar induced cell death in yeast is dependent on the rate of sugar phosphorylation as determined by Arabidopsis thaliana hexokinase. Cell Death Differ. 1997, 4, 555–559. [Google Scholar] [CrossRef] [PubMed] [Green Version]
  5. Granot, D.; Snyder, M. Carbon source induces growth of stationary phase yeast cells, independent of carbon source metabolism. Yeast 1993, 9, 465–479. [Google Scholar] [CrossRef]
  6. Lee, Y.J.; Burlet, E.; Galiano, F.; Circu, M.L.; Aw, T.Y.; Williams, B.J.; Witt, S.N. Phosphate and succinate use different mechanisms to inhibit sugar-induced cell death in yeast: Insight into the Crabtree effect. J. Biol. Chem. 2011, 286, 20267–20274. [Google Scholar] [CrossRef] [Green Version]
  7. Yoshimoto, H.; Ohuchi, R.; Ikado, K.; Yoshida, S.; Minato, T.; Ishiguro, T.; Mizutani, S.; Kobayashi, O. Sugar induces death of the bottom fermenting yeast Saccharomyces pastorianus. J. Biosci. Bioeng. 2009, 108, 60–62. [Google Scholar] [CrossRef]
  8. Valiakhmetov, A.Y.; Kuchin, A.V.; Suzina, N.E.; Zvonarev, A.N.; Shepelyakovskaya, A.O. Glucose causes primary necrosis in exponentially grown yeast Saccharomyces cerevisiae. FEMS Yeast Res. 2019, 19, foz019. [Google Scholar] [CrossRef]
  9. Carmona-Gutierrez, D.; Bauer, M.A.; Zimmermann, A.; Aguilera, A.; Austriaco, N.; Ayscough, K.; Balzan, R.; Bar-Nun, S.; Barrientos, A.; Belenky, P.; et al. Guidelines and recommendations on yeast cell death nomenclature. Microb. Cell 2018, 5, 4–31. [Google Scholar] [CrossRef] [PubMed] [Green Version]
  10. Bidiuk, V.A.; Alexandrov, A.I.; Valiakhmetov, A.Y. Extracellular pH and high concentration of potassium regulate the primary necrosis in the yeast Saccharomyces cerevisiae. Arch. Microbiol. 2021, 204, 35. [Google Scholar] [CrossRef]
  11. Lapathitis, G.; Kotyk, A. Different sources of acidity in glucose-elicited extracellular acidification in the yeast Saccharomyces cerevisiae. Biochem. Mol. Biol. Int. 1998, 46, 973–978. [Google Scholar] [CrossRef] [PubMed] [Green Version]
  12. Kotyk, A.; Lapathitis, G.; Krenkova, S. Glucose- and K(+)-induced acidification in different yeast species. Folia Microbiol. 1999, 44, 295–298. [Google Scholar] [CrossRef]
  13. Martins, V.M.; Fernandes, T.R.; Lopes, D.; Afonso, C.B.; Domingues, M.R.M.; Corte-Real, M.; Sousa, M.J. Contacts in Death: The Role of the ER-Mitochondria Axis in Acetic Acid-Induced Apoptosis in Yeast. J. Mol. Biol. 2019, 431, 273–288. [Google Scholar] [CrossRef] [PubMed]
  14. Ludovico, P.; Rodrigues, F.; Almeida, A.; Silva, M.T.; Barrientos, A.; Corte-Real, M. Cytochrome c release and mitochondria involvement in programmed cell death induced by acetic acid in Saccharomyces cerevisiae. Mol. Biol. Cell 2002, 13, 2598–2606. [Google Scholar] [CrossRef] [PubMed] [Green Version]
  15. Ludovico, P.; Sousa, M.J.; Silva, M.T.; Leao, C.; Corte-Real, M. Saccharomyces cerevisiae commits to a programmed cell death process in response to acetic acid. Microbiology 2001, 147, 2409–2415. [Google Scholar] [CrossRef] [Green Version]
  16. Viegas, C.A.; Rosa, M.F.; Sa-Correia, I.; Novais, J.M. Inhibition of Yeast Growth by Octanoic and Decanoic Acids Produced during Ethanolic Fermentation. Appl. Environ. Microbiol. 1989, 55, 21–28. [Google Scholar] [CrossRef] [Green Version]
  17. Taylor, G.; Kirsop, B. The origin of the medium chain length fatty acids present in beer. J. Inst. Brew. 1977, 83, 241–243. [Google Scholar] [CrossRef]
  18. Lafon-Lafourcade, S.; Geneix, C.; Ribéreau-Gayon, P. Inhibition of Alcoholic Fermentation of Grape Must by Fatty Acids Produced by Yeasts and Their Elimination by Yeast Ghosts. Appl. Environ. Microbiol. 1984, 47, 1246–1249. [Google Scholar] [CrossRef] [Green Version]
  19. Liu, P.; Chernyshov, A.; Najdi, T.; Fu, Y.; Dickerson, J.; Sandmeyer, S.; Jarboe, L. Membrane stress caused by octanoic acid in Saccharomyces cerevisiae. Appl. Microbiol. Biotechnol. 2013, 97, 3239–3251. [Google Scholar] [CrossRef] [Green Version]
  20. Borrull, A.; Lopez-Martinez, G.; Poblet, M.; Cordero-Otero, R.; Rozes, N. New insights into the toxicity mechanism of octanoic and decanoic acids on Saccharomyces cerevisiae. Yeast 2015, 32, 451–460. [Google Scholar] [CrossRef]
  21. Legras, J.L.; Erny, C.; Le Jeune, C.; Lollier, M.; Adolphe, Y.; Demuyter, C.; Delobel, P.; Blondin, B.; Karst, F. Activation of two different resistance mechanisms in Saccharomyces cerevisiae upon exposure to octanoic and decanoic acids. Appl. Environ. Microbiol. 2010, 76, 7526–7535. [Google Scholar] [CrossRef] [PubMed] [Green Version]
  22. Viegas, C.A.; Sa-Correia, I. Activation of plasma membrane ATPase of Saccharomyces cerevisiae by octanoic acid. J. Gen. Microbiol. 1991, 137, 645–651. [Google Scholar] [CrossRef] [PubMed] [Green Version]
  23. Viegas, C.A.; Almeida, P.F.; Cavaco, M.; Sa-Correia, I. The H(+)-ATPase in the plasma membrane of Saccharomyces cerevisiae is activated during growth latency in octanoic acid-supplemented medium accompanying the decrease in intracellular pH and cell viability. Appl. Environ. Microbiol. 1998, 64, 779–783. [Google Scholar] [CrossRef] [Green Version]
  24. Stevens, S.; Hofmeyr, J.-H.S. Effects of ethanol, octanoic and decanoic acids on fermentation and the passive influx of protons through the plasma membrane of Saccharomyces cerevisiae. Appl. Microbiol. Biotechnol. 1993, 38, 656–663. [Google Scholar] [CrossRef]
  25. Alexandre, H.; Mathieu, B.; Charpentier, C. Alteration in membrane fluidity and lipid composition, and modulation of H(+)-ATPase activity in Saccharomyces cerevisiae caused by decanoic acid. Microbiology 1996, 142 Pt 3, 469–475. [Google Scholar] [CrossRef] [PubMed] [Green Version]
  26. Besada-Lombana, P.B.; Fernandez-Moya, R.; Fenster, J.; Da Silva, N.A. Engineering Saccharomyces cerevisiae fatty acid composition for increased tolerance to octanoic acid. Biotechnol. Bioeng. 2017, 114, 1531–1538. [Google Scholar] [CrossRef]
  27. Cabral, M.G.; Viegas, C.A.; Sa-Correia, I. Mechanisms underlying the acquisition of resistance to octanoic-acid-induced-death following exposure of Saccharomyces cerevisiae to mild stress imposed by octanoic acid or ethanol. Arch. Microbiol. 2001, 175, 301–307. [Google Scholar] [CrossRef]
  28. Wernig, F.; Baumann, L.; Boles, E.; Oreb, M. Production of octanoic acid in Saccharomyces cerevisiae: Investigation of new precursor supply engineering strategies and intrinsic limitations. Biotechnol. Bioeng. 2021, 118, 3046–3057. [Google Scholar] [CrossRef]
  29. Baumann, L.; Wernig, F.; Born, S.; Oreb, M. Engineering Saccharomyces cerevisiae for Production of Fatty Acids and Their Derivatives. In Genetics and Biotechnology; Benz, J.P., Schipper, K., Eds.; Springer International Publishing: Cham, Switzerland, 2020; pp. 339–368. [Google Scholar] [CrossRef]
  30. Henritzi, S.; Fischer, M.; Grininger, M.; Oreb, M.; Boles, E. An engineered fatty acid synthase combined with a carboxylic acid reductase enables de novo production of 1-octanol in Saccharomyces cerevisiae. Biotechnol. Biofuels 2018, 11, 150. [Google Scholar] [CrossRef] [Green Version]
  31. Schneider, R.; Massow, M.; Lisowsky, T.; Weiss, H. Different respiratory-defective phenotypes of Neurospora crassa and Saccharomyces cerevisiae after inactivation of the gene encoding the mitochondrial acyl carrier protein. Curr. Genet. 1995, 29, 10–17. [Google Scholar] [CrossRef]
  32. Miinalainen, I.J.; Chen, Z.J.; Torkko, J.M.; Pirilä, P.L.; Sormunen, R.T.; Bergmann, U.; Qin, Y.M.; Hiltunen, J.K. Characterization of 2-enoyl thioester reductase from mammals. An ortholog of YBR026p/MRF1’p of the yeast mitochondrial fatty acid synthesis type II. J. Biol. Chem. 2003, 278, 20154–20161. [Google Scholar] [CrossRef] [Green Version]
  33. Zhang, L.; Joshi, A.K.; Smith, S. Cloning, expression, characterization, and interaction of two components of a human mitochondrial fatty acid synthase. Malonyltransferase and acyl carrier protein. J. Biol. Chem. 2003, 278, 40067–40074. [Google Scholar] [CrossRef] [Green Version]
  34. Zhang, L.; Joshi, A.K.; Hofmann, J.; Schweizer, E.; Smith, S. Cloning, expression, and characterization of the human mitochondrial beta-ketoacyl synthase. Complementation of the yeast CEM1 knock-out strain. J. Biol. Chem. 2005, 280, 12422–12429. [Google Scholar] [CrossRef] [Green Version]
  35. Brody, S.; Oh, C.; Hoja, U.; Schweizer, E. Mitochondrial acyl carrier protein is involved in lipoic acid synthesis in Saccharomyces cerevisiae. FEBS Lett. 1997, 408, 217–220. [Google Scholar] [CrossRef] [PubMed] [Green Version]
  36. Schonauer, M.S.; Kastaniotis, A.J.; Kursu, V.A.S.; Hiltunen, J.K.; Dieckmann, C.L. Lipoic Acid Synthesis and Attachment in Yeast Mitochondria *. J. Biol. Chem. 2009, 284, 23234–23242. [Google Scholar] [CrossRef] [PubMed] [Green Version]
  37. Marvin, M.E.; Williams, P.H.; Cashmore, A.M. The isolation and characterisation of a Saccharomyces cerevisiae gene (LIP2) involved in the attachment of lipoic acid groups to mitochondrial enzymes. FEMS Microbiol. Lett. 2001, 199, 131–136. [Google Scholar] [CrossRef] [PubMed]
  38. Pietikäinen, L.P.; Rahman, M.T.; Hiltunen, J.K.; Dieckmann, C.L.; Kastaniotis, A.J. Genetic dissection of the mitochondrial lipoylation pathway in yeast. BMC Biol. 2021, 19, 14. [Google Scholar] [CrossRef] [PubMed]
  39. Schonauer, M.S.; Kastaniotis, A.J.; Hiltunen, J.K.; Dieckmann, C.L. Intersection of RNA processing and the type II fatty acid synthesis pathway in yeast mitochondria. Mol. Cell. Biol. 2008, 28, 6646–6657. [Google Scholar] [CrossRef] [Green Version]
  40. Della Croce, C.; Bronzetti, G.; Cini, M.; Caltavuturo, L.; Poi, G. Protective effect of lipoic acid against hydrogen peroxide in yeast cells. Toxicol. Vitr. 2003, 17, 753–759. [Google Scholar] [CrossRef]
  41. Ichihara, K.; Fukubayashi, Y. Preparation of fatty acid methyl esters for gas-liquid chromatography. J. Lipid. Res. 2010, 51, 635–640. [Google Scholar] [CrossRef] [Green Version]
  42. Almeida, B.; Ohlmeier, S.; Almeida, A.J.; Madeo, F.; Leao, C.; Rodrigues, F.; Ludovico, P. Yeast protein expression profile during acetic acid-induced apoptosis indicates causal involvement of the TOR pathway. Proteomics 2009, 9, 720–732. [Google Scholar] [CrossRef] [PubMed]
  43. Volkov, V. Quantitative description of ion transport via plasma membrane of yeast and small cells. Front. Plant Sci. 2015, 6, 425. [Google Scholar] [CrossRef] [Green Version]
  44. Mikolajczyk, S.; Brody, S. De novo fatty acid synthesis mediated by acyl-carrier protein in Neurospora crassa mitochondria. Eur. J. Biochem. 1990, 187, 431–437. [Google Scholar] [CrossRef]
  45. Chen, B.; Foo, J.L.; Ling, H.; Chang, M.W. Mechanism-Driven Metabolic Engineering for Bio-Based Production of Free R-Lipoic Acid in Saccharomyces cerevisiae Mitochondria. Front. Bioeng. Biotechnol. 2020, 8, 965. [Google Scholar] [CrossRef] [PubMed]
  46. Chang, M.W.; Binbin, C.; FOO, J.L.; Hua, L. Metabolic engineering for production of lipoic acid. Google Patents: WO2021177896A1, 10 September 2021. [Google Scholar]
  47. White, R.H. Stable isotope studies on the biosynthesis of lipoic acid in Escherichia coli. Biochemistry 1980, 19, 15–19. [Google Scholar] [CrossRef] [PubMed]
  48. Booker, S.J.; Cicchillo, R.M.; Grove, T.L. Self-sacrifice in radical S-adenosylmethionine proteins. Curr. Opin. Chem. Biol. 2007, 11, 543–552. [Google Scholar] [CrossRef] [Green Version]
  49. Stuible, H.-P.; Meier, S.; Wagner, C.; Hannappel, E.; Schweizer, E. A Novel Phosphopantetheine:Protein Transferase Activating Yeast Mitochondrial Acyl Carrier Protein *. J. Biol. Chem. 1998, 273, 22334–22339. [Google Scholar] [CrossRef] [Green Version]
  50. Sulo, P.; Martin, N.C. Isolation and characterization of LIP5. A lipoate biosynthetic locus of Saccharomyces cerevisiae. J. Biol. Chem. 1993, 268, 17634–17639. [Google Scholar]
  51. Nagarajan, L.; Storms, R.K. Molecular characterization of GCV3, the Saccharomyces cerevisiae gene coding for the glycine cleavage system hydrogen carrier protein. J. Biol. Chem. 1997, 272, 4444–4450. [Google Scholar] [CrossRef] [Green Version]
Figure 1. Effect of OA in the post-SICD media on the percentage of the PI-positive cells BY4741. After 1 h of incubation of the cells with 100 mM glucose, the cells were pelleted, and the OA-containing supernatant (super) was used to suspend fresh cells. Cells were incubated with either no glucose (left panel) or 100 mM glucose (right panel). For comparison with standard SICD assay, the fresh cells were incubated in parallel either in water (water) or in 50 mM HEPES pH7.0 (pH7). *—p-value < 0.05, **—p-value < 0.001.
Applmicrobiol 03 00050 g001
Figure 2. The current model of the lipoylation process in yeast mitochondria. Octanoylated ACP1 generated in the FAS-II system. Phosphopantetheine:protein transferase PPT2 transfers the 4′-phosphopantetheine prosthetic group from coenzyme A to the apo-ACP1, converting it to holo-APC1. Holo-APC1 serves as a substrate for the transfer of the octanoyl domain by the octanoyl transferase Lip2 to Gcv3, the H protein of the GCS. Then, lipoyl synthase Lip5 adds the thiol groups to carbons 6 and 8, forming the lipoyl domain. Finally, Gcv3 transfers the lipoyl domain to the E2p subunit of pyruvate dehydrogenase, to the E2o subunit of α-ketoglutarate dehydrogenase, and the H protein of the glycine cleavage enzyme. Abbreviations: OA—octanoyl domain; PP—phosphopantetheine prosthetic group; LA—lipoyl domain; PDH—pyruvate dehydrogenase; α-KDH—α-ketoglutarate dehydrogenase; Co-A—coenzyme A.
Applmicrobiol 03 00050 g002
Figure 3. Percentage of PI- and DHR-positive cells in BY4741, BY4742, and ΔACP1 strains. Cells were incubated with 100 mM glucose in water for 1 h. Cells were stained with PI for SICD detection and stained with DHR for ROS detection. *—p < 0.05 for ROS between BY4741 and ΔACP1. In all other cases, differences were insignificant.
Applmicrobiol 03 00050 g003
Figure 4. OA content in the medium after incubation of BY4741, BY4742, and ΔACP1 cells with 100 mM glucose for 1 h. The one-way ANOVA test showed that there was no significant difference in the OA concentrations in the BY4741, BY4742, and ΔACP1 incubation media.
Applmicrobiol 03 00050 g004
Figure 5. Comparison of SO42− and Cl effect on SICD and ROS production in BY4741 strain. Cells were incubated with 100 mM glucose for 1 h in the presence of salts at the following concentrations: KCl, NaCl—200 mM; K2SO4, Na2SO4, MgCl2—70 mM; MgSO4—50 mM. At these concentrations, the ionic strength of all solutions was 50 mM. The difference between Cl and SO42− salts was significant in all cases (p < 0.05), except for Mg salts (p > 0.05).
Applmicrobiol 03 00050 g005
Figure 6. Percentage of PI- and DHR-positive cells in BY4742, ΔPPT2, ΔLIP2, ΔLIP5, and ΔSGV3 strains after incubation with 100 mM glucose in water during 1 h. The one-way ANOVA test showed that there was no significant difference in SICD and ROS production in all strains.
Applmicrobiol 03 00050 g006
Disclaimer/Publisher’s Note: The statements, opinions and data contained in all publications are solely those of the individual author(s) and contributor(s) and not of MDPI and/or the editor(s). MDPI and/or the editor(s) disclaim responsibility for any injury to people or property resulting from any ideas, methods, instructions or products referred to in the content.