Article

RGB-Derived Indices Accurately Detect Genotypic and Agronomic Differences in Canopy Variation in Durum Wheat

1
CREA Research Centre for Cereal and Industrial Crops, CREA-CI, SS 673 M 25200, 71122 Foggia, FG, Italy
2
Department of Agriculture, Food, Natural Resources and Engineering (DAFNE), University of Foggia, Via Napoli 25, 71122 Foggia, FG, Italy
3
CREA Research Centre for Engineering and Agro-Food Processing, CREA-IT, Via Milano 43, 24047 Treviglio, BG, Italy
4
CNR-IBBR, National Research Council of Italy, Institute of Biosciences and Bioresources, Via Università 133, 80055 Portici, NA, Italy
*
Authors to whom correspondence should be addressed.
Crops 2025, 5(6), 85; https://doi.org/10.3390/crops5060085
Submission received: 28 August 2025 / Revised: 20 October 2025 / Accepted: 15 November 2025 / Published: 19 November 2025

Abstract

Durum wheat (Triticum turgidum ssp. durum) represents a strategic crop for the Mediterranean basin and global semiarid regions, being the raw material for pasta and a key component of sustainable cereal production. Improving early vigor and canopy development is essential to enhance resource-use efficiency and yield stability under variable agronomic conditions. For these reasons, we report the application of a series of RGB-derived vegetation indices (VIs) from Unmanned Aerial Vehicle (UAVs) to evaluate their effectiveness in capturing canopy variation in the early growth stages in a large collection of durum wheat varieties and on their validation under different agronomic managements. Digital RGB images from seedling emergence to grain filling were taken in two field experiments, and RGB-based indices were calculated over four consecutive growing seasons. In the first experiment, 521 durum wheat varieties were evaluated, showing highly significant genotypic differences for all VIs (p < 0.001) and explaining up to 72% of the phenotypic variance at the end of tillering. In addition, TGI explained more variation than CSI when recorded at the end of the tillering stage. In the second experiment, two contrasting genotypes managed under two sowing rates and six nitrogen (N) treatments displayed a strong discriminating capacity of NGRDI and TGI for genotype and sowing density (η2 = 0.50). These results highlight the potential use of RGB-derived VIs for high-throughput phenotypic selection of soil coverage ability in durum wheat, even under different agronomic conditions.

1. Introduction

Durum wheat (Triticum durum Desf.) is a cornerstone crop in the Mediterranean basin, where it plays a pivotal role in the agricultural economies of several countries such as Italy, Turkey, Spain, and North African nations, as a primary ingredient for traditional products like pasta, couscous, and semolina-based bread [1]. Unfortunately, durum wheat production in these regions is increasingly at risk due to the impacts of climate change, including rising global temperatures, altered rainfall patterns, and increased frequency of drought events. These climatic factors directly affect crop yields and grain quality by causing physiological stress and reducing the efficiency of water and nutrient utilization [2,3,4]. Additionally, durum wheat typically exhibits limited early vigor, hindering its ability to achieve rapid ground cover [5]. This characteristic results in reduced competitive capacity against weeds, increased soil water evaporation, and lower overall resource-use efficiency, ultimately affecting productivity and sustainability [6,7,8,9]. In response to these challenges, breeding efforts aim to develop durum wheat varieties adapted specifically to projected climate scenarios characterized by higher temperatures, irregular precipitation, and reduced water availability expected of future Mediterranean climates [1,10]. Therefore, to ensure food security and sustainability of agriculture as a whole in the Mediterranean region, it will be necessary to focus on breeding activities to develop new varieties adapted to both climate change and low-input cereal systems [11].
Early vigor, defined as rapid biomass accumulation and leaf area expansion during initial growth stages, is a crucial physiological trait influencing crop competitiveness against weeds, efficient resource utilization, stress resilience, and ultimately, yield potential and stability [8,12,13,14,15]. In particular, early soil coverage can directly influence evapotranspiration partitioning: while increased canopy cover reduces soil evaporation (E), it increases transpiration (T) through greater leaf area [16,17,18,19]. Field studies in water-limited environments demonstrate that vigorous genotypes achieve optimal E/T ratios faster, conserving more soil moisture during early vegetative stages compared to low-vigor lines [10,20,21,22,23,24,25]. This physiological advantage is magnified under nitrogen-limiting conditions, where early canopy closure improves nitrogen-use efficiency through reduced leaching and volatilization [26,27].
However, breeding progress remains constrained by the polygenic nature of early vigor, a quantitative trait controlled by dozens of quantitative trait loci (QTLs) associated with secondary traits as coleoptile length and thickness, leaf emergence rate, tillering, plant height, and root architecture [28,29,30]. This means that the breeding programs for early soil cover ability require extensive phenotyping and robust statistical analyses to identify genetic components effectively [30].
High-throughput phenotyping tools are therefore essential to dissect these genetic components, particularly given the poor heritability (H2 < 0.3) of traditional visual scoring methods for ground coverage [31]. Recent advances in field phenotyping have provided a wide spectrum of platforms and sensors for monitoring crop growth and physiological performance [32,33]. Ground-based systems such as field robots, tractor-mounted phenocarts, and proximal canopy sensors, as well as aerial and spaceborne tools including multispectral and hyperspectral cameras, LiDAR, and satellite imagery, are increasingly used to capture plant structural and spectral information at various spatial scales [34,35,36]. While these technologies offer valuable insights, they often present trade-offs in terms of spatial resolution, operational flexibility, and cost. In this context, UAVs equipped with RGB cameras represent a practical and affordable solution for quantifying early soil coverage dynamics [37,38,39]. For example, [38] emphasized that visual scoring methods for ground cover estimation are labor intensive, subjective, and often irreproducible, significantly reducing their utility in breeding contexts. White et al. (2012) [40] also pointed to the lack of standardization in visual assessments and advocated for automated, sensor-based methods (e.g., RGB indices) to minimize human error and improve data reliability. Liu and Pattey (2010) [41] recommended the use of digital photography to acquire LAI and vegetation fraction of crops, because the approach was less limited by radiation conditions and the protocol could be easily implemented for large-scale sampling at low cost. This evidence underlines that RGB-derived vegetation indices (VIs) derived from UAV imagery are not only viable but also superior for assessing ground cover traits in a high-throughput manner [5,42]. These RGB-derived indices, including Green Area (GA), Greener Area (GGA), Normalized Green Red Difference Index (NGRDI), Crop Senescence Index (CSI), and Triangular Greenness Index (TGI), are vegetation indices calculated using the red, green, and blue color channels of digital images, offering a low-cost alternative to multispectral or hyperspectral imagery for monitoring various plant parameters, including chlorophyll content, water stress, and overall vegetation vigor, and ground coverage [43,44,45,46].
Despite substantial literature on RGB-based ground cover estimation, the majority of existing studies have primarily focused on agronomic applications, such as intra-field variability assessment, weed management, and optimization of agricultural practices, rather than genotype screening for breeding purposes. For instance, Torres-Sánchez et al. [47] developed a multitemporal RGB-based framework to discriminate wheat row structures for weed management purposes, while [48] employing RGB imagery to estimate vegetation fraction within maize fields to evaluate intra-field variability and agronomic management. Moreover, these and other similar studies suggest that RGB-based indices effectively monitor vegetation fraction during early crop growth stages, although later growth stages may require the use of near-infrared (NIR)-based indices [48,49,50]. This is because soil can influence the spectral determination of chlorophyll in the early stages of plant growth [51,52]. Consequently, there remains a significant knowledge gap concerning the application of RGB-derived indices specifically for assessing genetic variability among durum wheat genotypes in breeding contexts, highlighting the need for targeted research to explore and validate these approaches for genotype screening.
In the present study, we report the application of a series of RGB-derived vegetation indices to (i) evaluate their effectiveness in discriminating among a wide range of durum wheat genotypes during early growth stages, and (ii) validate their performance under different agronomic management practices, including sowing rate and N fertilization. Additionally, we aimed to establish correlations between RGB-derived indices and key agronomic traits such as grain yield and other morphophysiological traits.

2. Materials and Methods

2.1. Plant Material and Experimental Field Trials

Two field experiments were carried out during four consecutive growing seasons (2015–2019) on a clay-loam soil (Typic Chromoxerert) at the experimental farm of CREA-CI Research Centre for Cereal and Industrial Crops, Foggia, Italy (41°27′44.9″ N 15°30′03.9″ E, Figure 1). For all study years, durum wheat was the previous crop grown in the experimental field. In the first experiment (Exp. 1), 521 durum wheat varieties (Supplementary Table S1) were grown during 2015–2016 growing season in a randomized complete block design (RCBD) with three replications. The sowing date was 15 December 2015 in plots (6 rows, 1 m long) and the sowing density was 350 seeds m−2. The agronomic management reflected standard regional practices commonly adopted in the reference area (Southern Italy) and provided pre-sowing (36 kg N/ha; 92 kg P/ha as ammonium biphosphate) and top-dressing fertilization (52 kg N/ha as ammonium nitrate). Plots were mechanically harvested on 22 June 2016.
In the second field experiment (Exp. 2), the two durum wheat varieties, both released by CREA in Italy in 2017, were selected from Exp. 1, where they showed contrasting behavior in RGB-derived vegetation indices. Although other varieties may have exhibited more extreme VIs values, our choice was guided by multiple criteria: (i) Natal and Nadif displayed a clear contrast in RGB-derived indices; (ii) both varieties were developed and released in Italy by CREA, and (iii) we had sufficient seed quantities available to establish the field trials in Exp. 2. The field trials were carried out over three growing seasons (2016–2017, 2017–2018, and 2018–2019), using two durum wheat varieties (Natal and Nadif), two sowing rates (200 and 400 seeds/m2), and six N treatments (N0 = 0 kg N; N1 = 60 kg N; N2 = 90 kg N; N3 = 120 kg N; N4 = 180 kg N; N5 = 240 kg N) were arranged in an RCBD with three replicates and 10 square meter plots. Apart from the N0 treatment, for all other N treatments, 200 kg ha−1 of ammonium biphosphate (36 kg N ha−1; 92 kg P ha−1) was applied, while the remaining portion of the specific N dose for each treatment was applied as a top-dressing at the beginning of stem elongation (GS31), in the form of ammonium nitrate. The sowing dates for the study period were 13, 11, and 14 December in 2016, 2017 and 2018, respectively. At the end of the growing seasons, plants were mechanically harvested after physiological maturity on 10 June 2017, on 21 June 2018, and on 19 June 2019, respectively.
For both field experiments and all growing-seasons, weeds were controlled with the herbicides Tralcossidim (1.7 L ha−1), Clopiralid + MCPA + Fluroxypyr (2.0–2.5 L ha−1). Daily maximum and minimum temperatures and rainfall were recorded at the meteorological station beside the experimental fields.

2.2. Phenotyping Measurements

Aerial and ground phenotyping measurements and samplings were performed during four growing seasons for both experimental field trials.

2.2.1. Ground Phenotyping Measurements

Plant height (PH) was measured in cm during the waxy milk maturation when the maximum height level was achieved. Heading date (HD), calculated in number of days from April 1st, was recorded when at least half of the culms showed emerging spikes (growth stage 59) [53]. Plots were harvested mechanically, and grain yield (GY, t/ha) was determined and then adjusted to 13% moisture content. Protein content (PC) was determined with FOSS Infratec 1241 Grain Analyzer (FOSS North America, Eden Prairie, MN, USA). The described workflow was implemented in both Exp. 1 and Exp. 2, except for PC, which was determined only in Exp. 2.

2.2.2. Aerial Platform Description and RGB-Derived Vegetation Indexes

The aerial UAV system was a DJI Matrice 100 Quadcopter Drone equipped with an RGB camera. Aerial RGB images were obtained using ZenMuse X5 camera (DJI, Shenzhen, China), mounted with a three-axis gimbal for pitch and roll correction. Flights were performed under clear sky conditions, with slow (<10 m/s) or absent wind, when the sun was in zenithal position (12 am/2 pm). Flight altitude was 30 m with a high overlap (at least 80%) and slow drone speed. According to the camera used, the ground sample distance (GSD) for flight of 30 m altitude was 0.941 cm/pixel. Radiometric calibration was based on a single white reference panel (nominal reflectance ≈ 99%), which provided per-flight normalization to account for illumination and exposure variability. This approach standardizes image brightness across dates but does not constitute an absolute reflectance calibration. A growing stages assessment was performed each flying day. Table 1 reports on the day of assessment, the growing stages, and the number of images collected for both experiments.
Pre-processed aerial images from RGB camera were combined to obtain an accurate orthomosaic by producing a 3D reconstruction with Pix4D mapper (Pix4D SA, Prilly, Switzerland. www.pix4d.com, accessed on 17 November 2025). Regions of interest were segmented from the orthomosaic and exported with ImageJ (version 1.52) plugin MosaicTool (Shawn C. Kefauver, University of Barcelona, Barcelona, Spain). The Breedpix 2.0 plugin (Jaume Casadesús, IRTA, Lleida, Spain) was employed to analyze segmented aerial images for the extraction of VIs concerning different color properties. Average values for Hue, referring to color tint; saturation, indicating the dilution of pure color with white; and intensity, a measure of achromatic reflection, were determined from all pixels in the image. Specifically, GA quantifies the portion of green pixels to the total pixels of the image and is a reliable estimator of vegetation cover [54]. GGA is a more restrictive variant of GA, identifying only pixels exhibiting particularly intense green hues, excluding the yellowish green fraction of vegetation when the GA becomes saturated during late phenological periods [42]. NGRDI was originally proposed as an alternative to the Normalized Difference Vegetation Index (NDVI) and is useful for estimating vegetation fraction and biomass, especially before canopy closure [55]. The CSI was developed by integrating two previously established indices [56], employing a normalized ratio between yellow and green pixels to quantify plant senescence levels. Finally, TGI, which is based on a linear combination of RGB channel values, is a fairly good proxy for chlorophyll content in areas of high leaf cover [57]. All these RGB-derived indices are non-invasive, scalable, and cost effective, making them ideal tools for breeding programs and precision agriculture. All reference VIs and formulas are shown in Table 2.

2.3. Yield and Protein Content Prediction

We quantified associations between UAV-derived phenotyping indices and two response variables, grain yield (GY), and grain protein content (PC), using year-specific linear regression models using Exp. 2 results. For each growing season, we fit separate single-predictor models for numeric index (GA, GGA, CSI, NGRDI, TGI), one for each date, and their area-under-the-curve summaries. Model estimation used repeated 10-fold cross-validation with 3 replicates, yielding out-of-fold predictions per resample that were linked to experimental units for unbiased, fold-wise performance assessment. Predictive performance was summarized using root mean squared error (RMSE), mean absolute error (MAE), and the coefficient of determination (R2). Data wrangling and model construction were performed within R software 4.1.0 [62] using package “caret” and “lubridate”.

2.4. Statistical Analyses

Data was statistically analyzed using R software 4.1.0 [62]. The effects of factors (genotype, sowing rate, N fertilization) and their interaction were determined through a two-factor analysis of variance (ANOVA) using the car package [63]. Duncan’s test was used to determine post hoc differences between treatments. BLUEs and standard errors of the phenotypic data and indices were calculated using 2-dimensional p-spline approach, contained in SpATS package [64]. Broad sense heritabilities (H2) were computed as proposed by Rodríguez-Álvarez et al., [64]. Pearson correlation coefficients were computed among traits and VIs. To evaluate the magnitude of the effects of experimental factors (genotype, sowing rate, nitrogen dose) on the VIs, we calculated the η2 (eta squared) statistic from multivariate ANOVA results. η2 represents the proportion of total variance in the dependent variables that is attributable to a given factor and is widely used as an effect size indicator in the context of ANOVA and ANCOVA. Higher η2 values indicate a stronger association between the factor and the observed variation in VIs. While no fixed thresholds exist, η2 values above 0.01, 0.06, and 0.14 are conventionally interpreted as small, medium, and large effects, respectively [65].

3. Results

3.1. Experiment 1

3.1.1. Germplasm Survey and Genotypic Differences

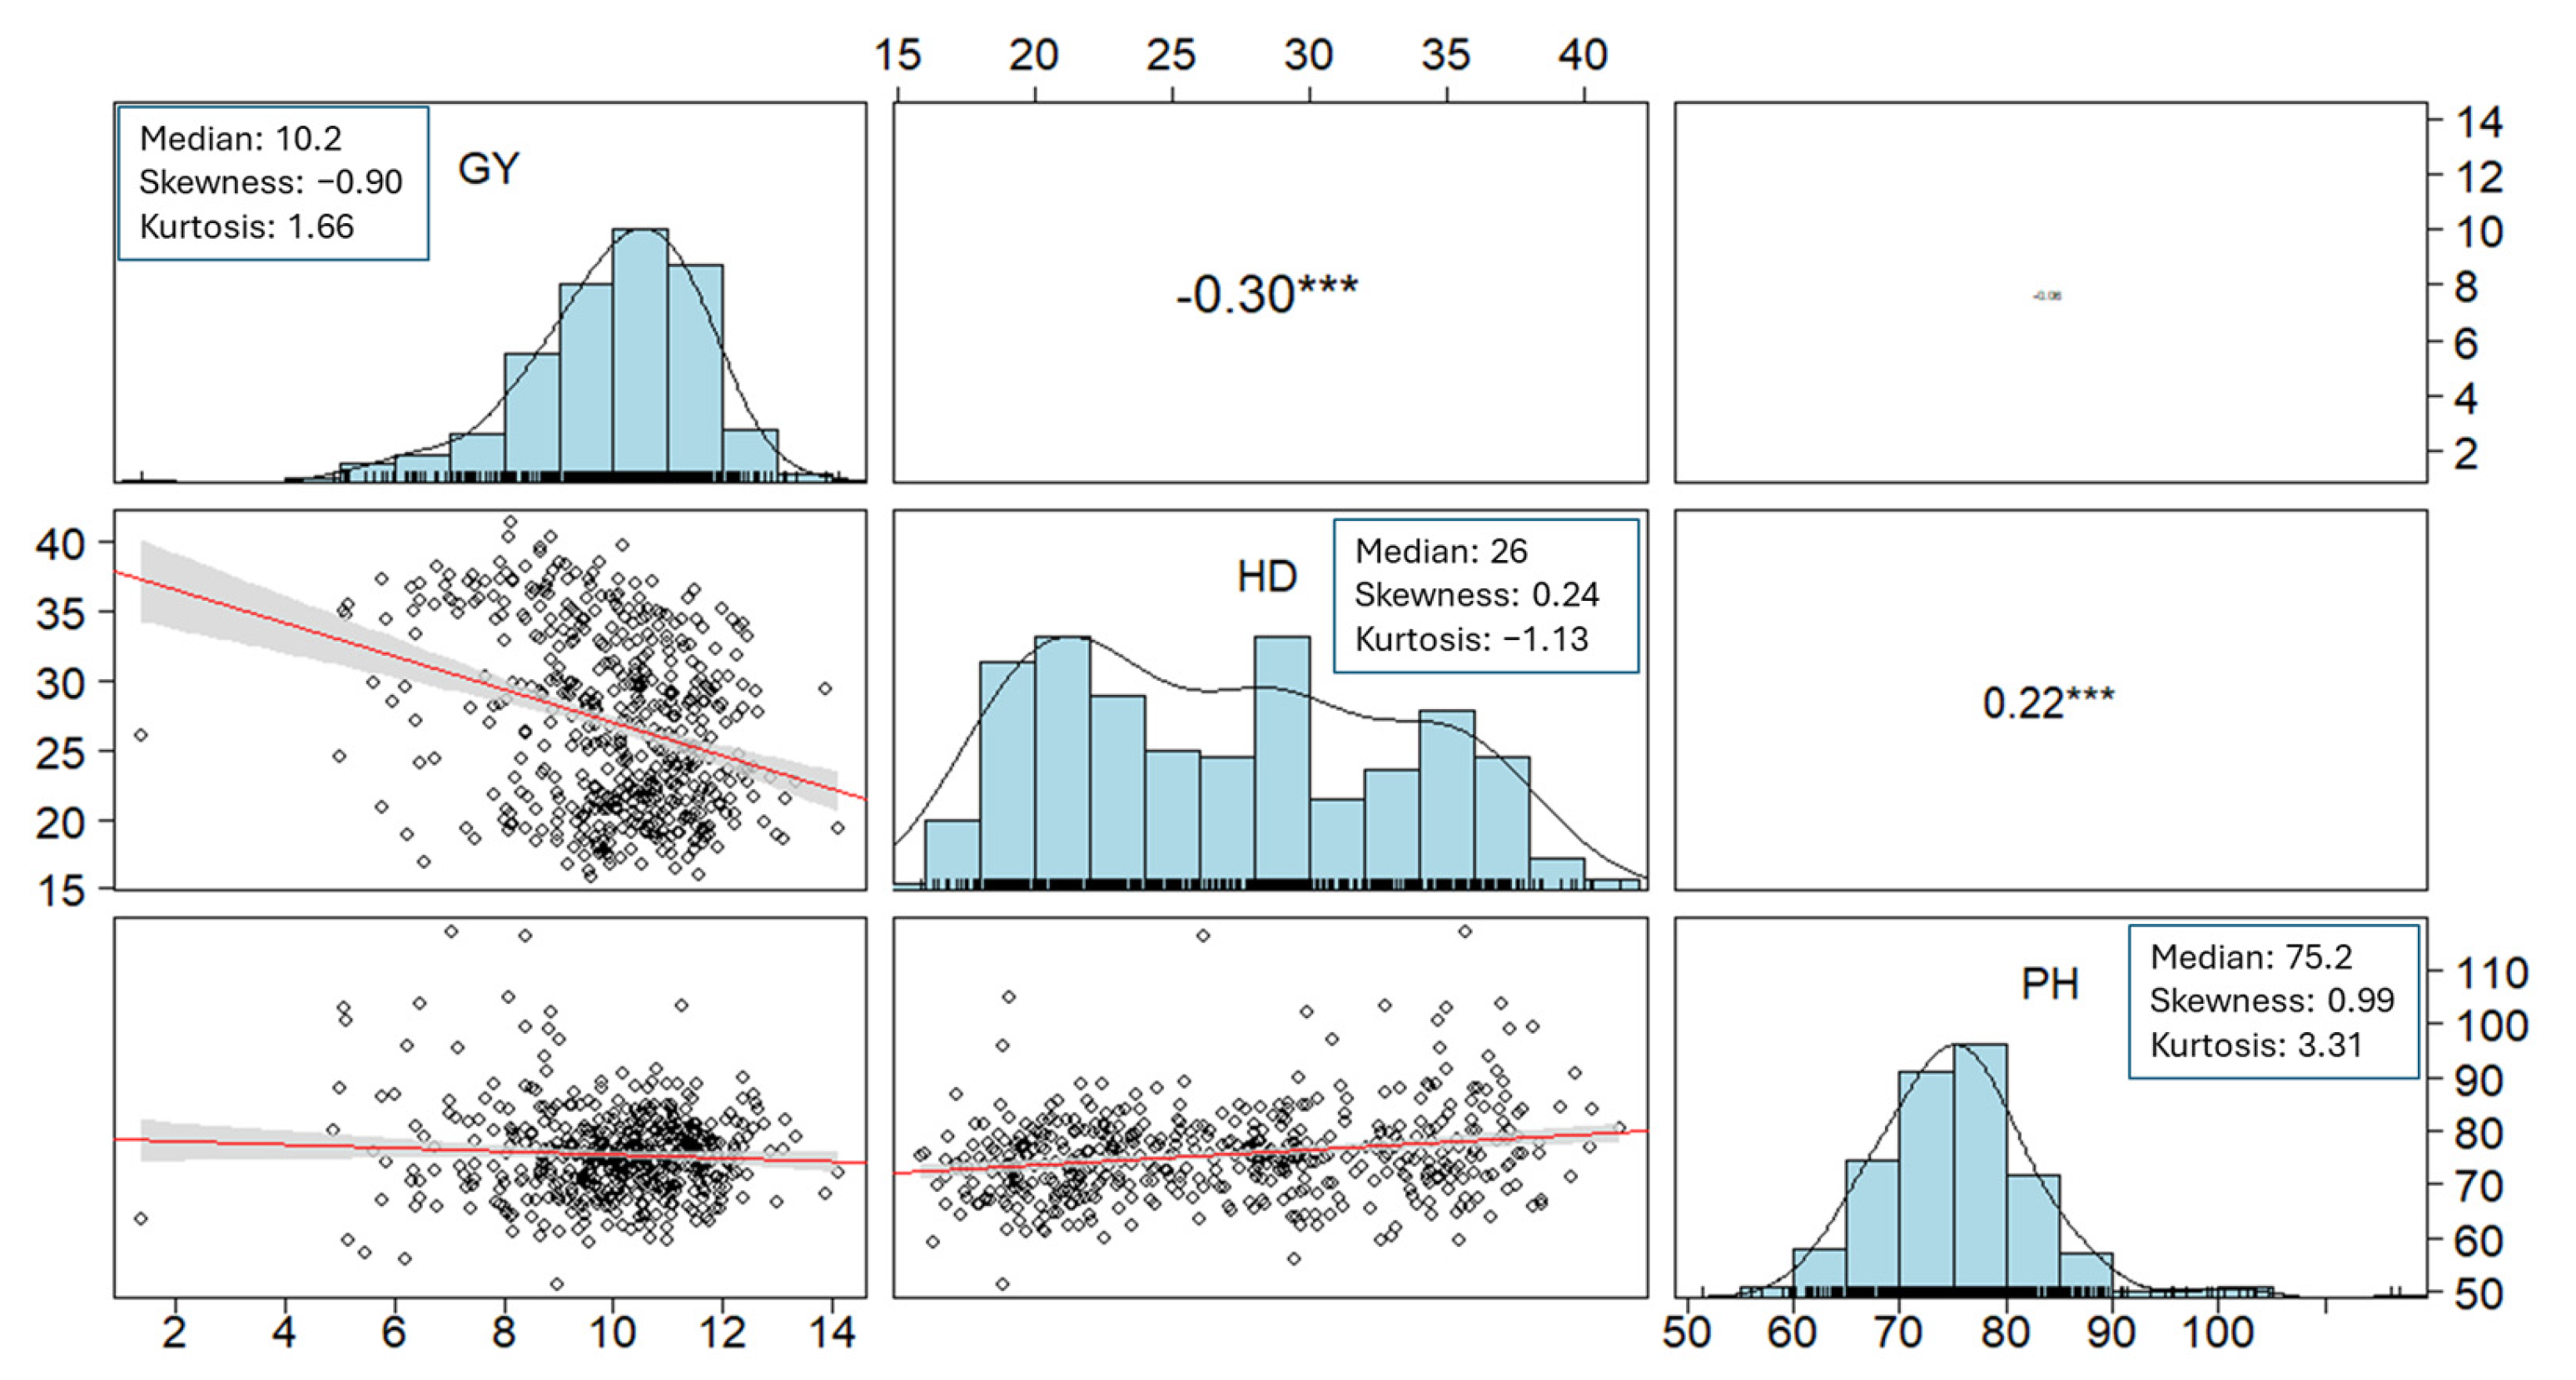
The distribution of ground-measured phenotypic data (GY, HD, and PH) is displayed in Figure 2. As expected, given the large number of durum wheat varieties tested, the ANOVA highlighted significant differences for all genotypes. The mean yield of the entire panel of varieties tested was 9.8 t/ha, ranging from 2.3 to 13.8 t/ha, while the average HD was 26 days, ranging between 6.3 and 38.0 days from April 1st. Considering that the panel included old and modern (semi-dwarf) varieties, the PH also showed a wide variability around the average (about 74 cm), ranging from 50 to 116.5 cm. Frequency distributions deviated from normality for all traits analyzed. In particular, HD showed a multimodal distribution, while the frequency distributions for GY and PH showed a slight skew, respectively, to the right and left of the curves.

3.1.2. Temporal Patterns and Discrimination Power of RGB-Derived Vegetation Indices

Statistically significant differences among varieties were observed for all VIs evaluated in the first experiment. The boxplots reported in Figure 3 provided a concise and informative distribution of RGB-derived VIs recorded across the four growth phenological stages in 2015–2016. The shapes and distributions of VIs values are rather normal, with only a few exceptions for some flights and some VIs (i.e., 4th flight and TGI). Overall, these vegetation indices collectively provided insights into the dynamic temporal variations in the measured parameters, contributing valuable information for the characterization of the studied system. The distributions showed a temporal increase with maximum values either in the 3rd flight for NGRDI and TGI or between the 3rd and 4th flight for GA and GGA. On the contrary, the CSI showed a decreasing trend, ranging from 6.31 to 12.55, with a minimum value coinciding with the third flight.
Based on the VIs data, it was possible to discriminate the behavior of the varieties during the growing season and identify genotypes with contrasting VIs values in the initial growth stages (mainly GS25 and GS31). Figure 3 also shows Natal and Nadif consistently belonging to two contrasting groups of varieties for all VIs considered and in almost all timings, with a particularly clear behavior in the 2nd flight (GS31). Therefore, these two varieties were selected to set up the second experiment.

3.1.3. Multivariate Analysis and Selection of Contrasting Genotypes

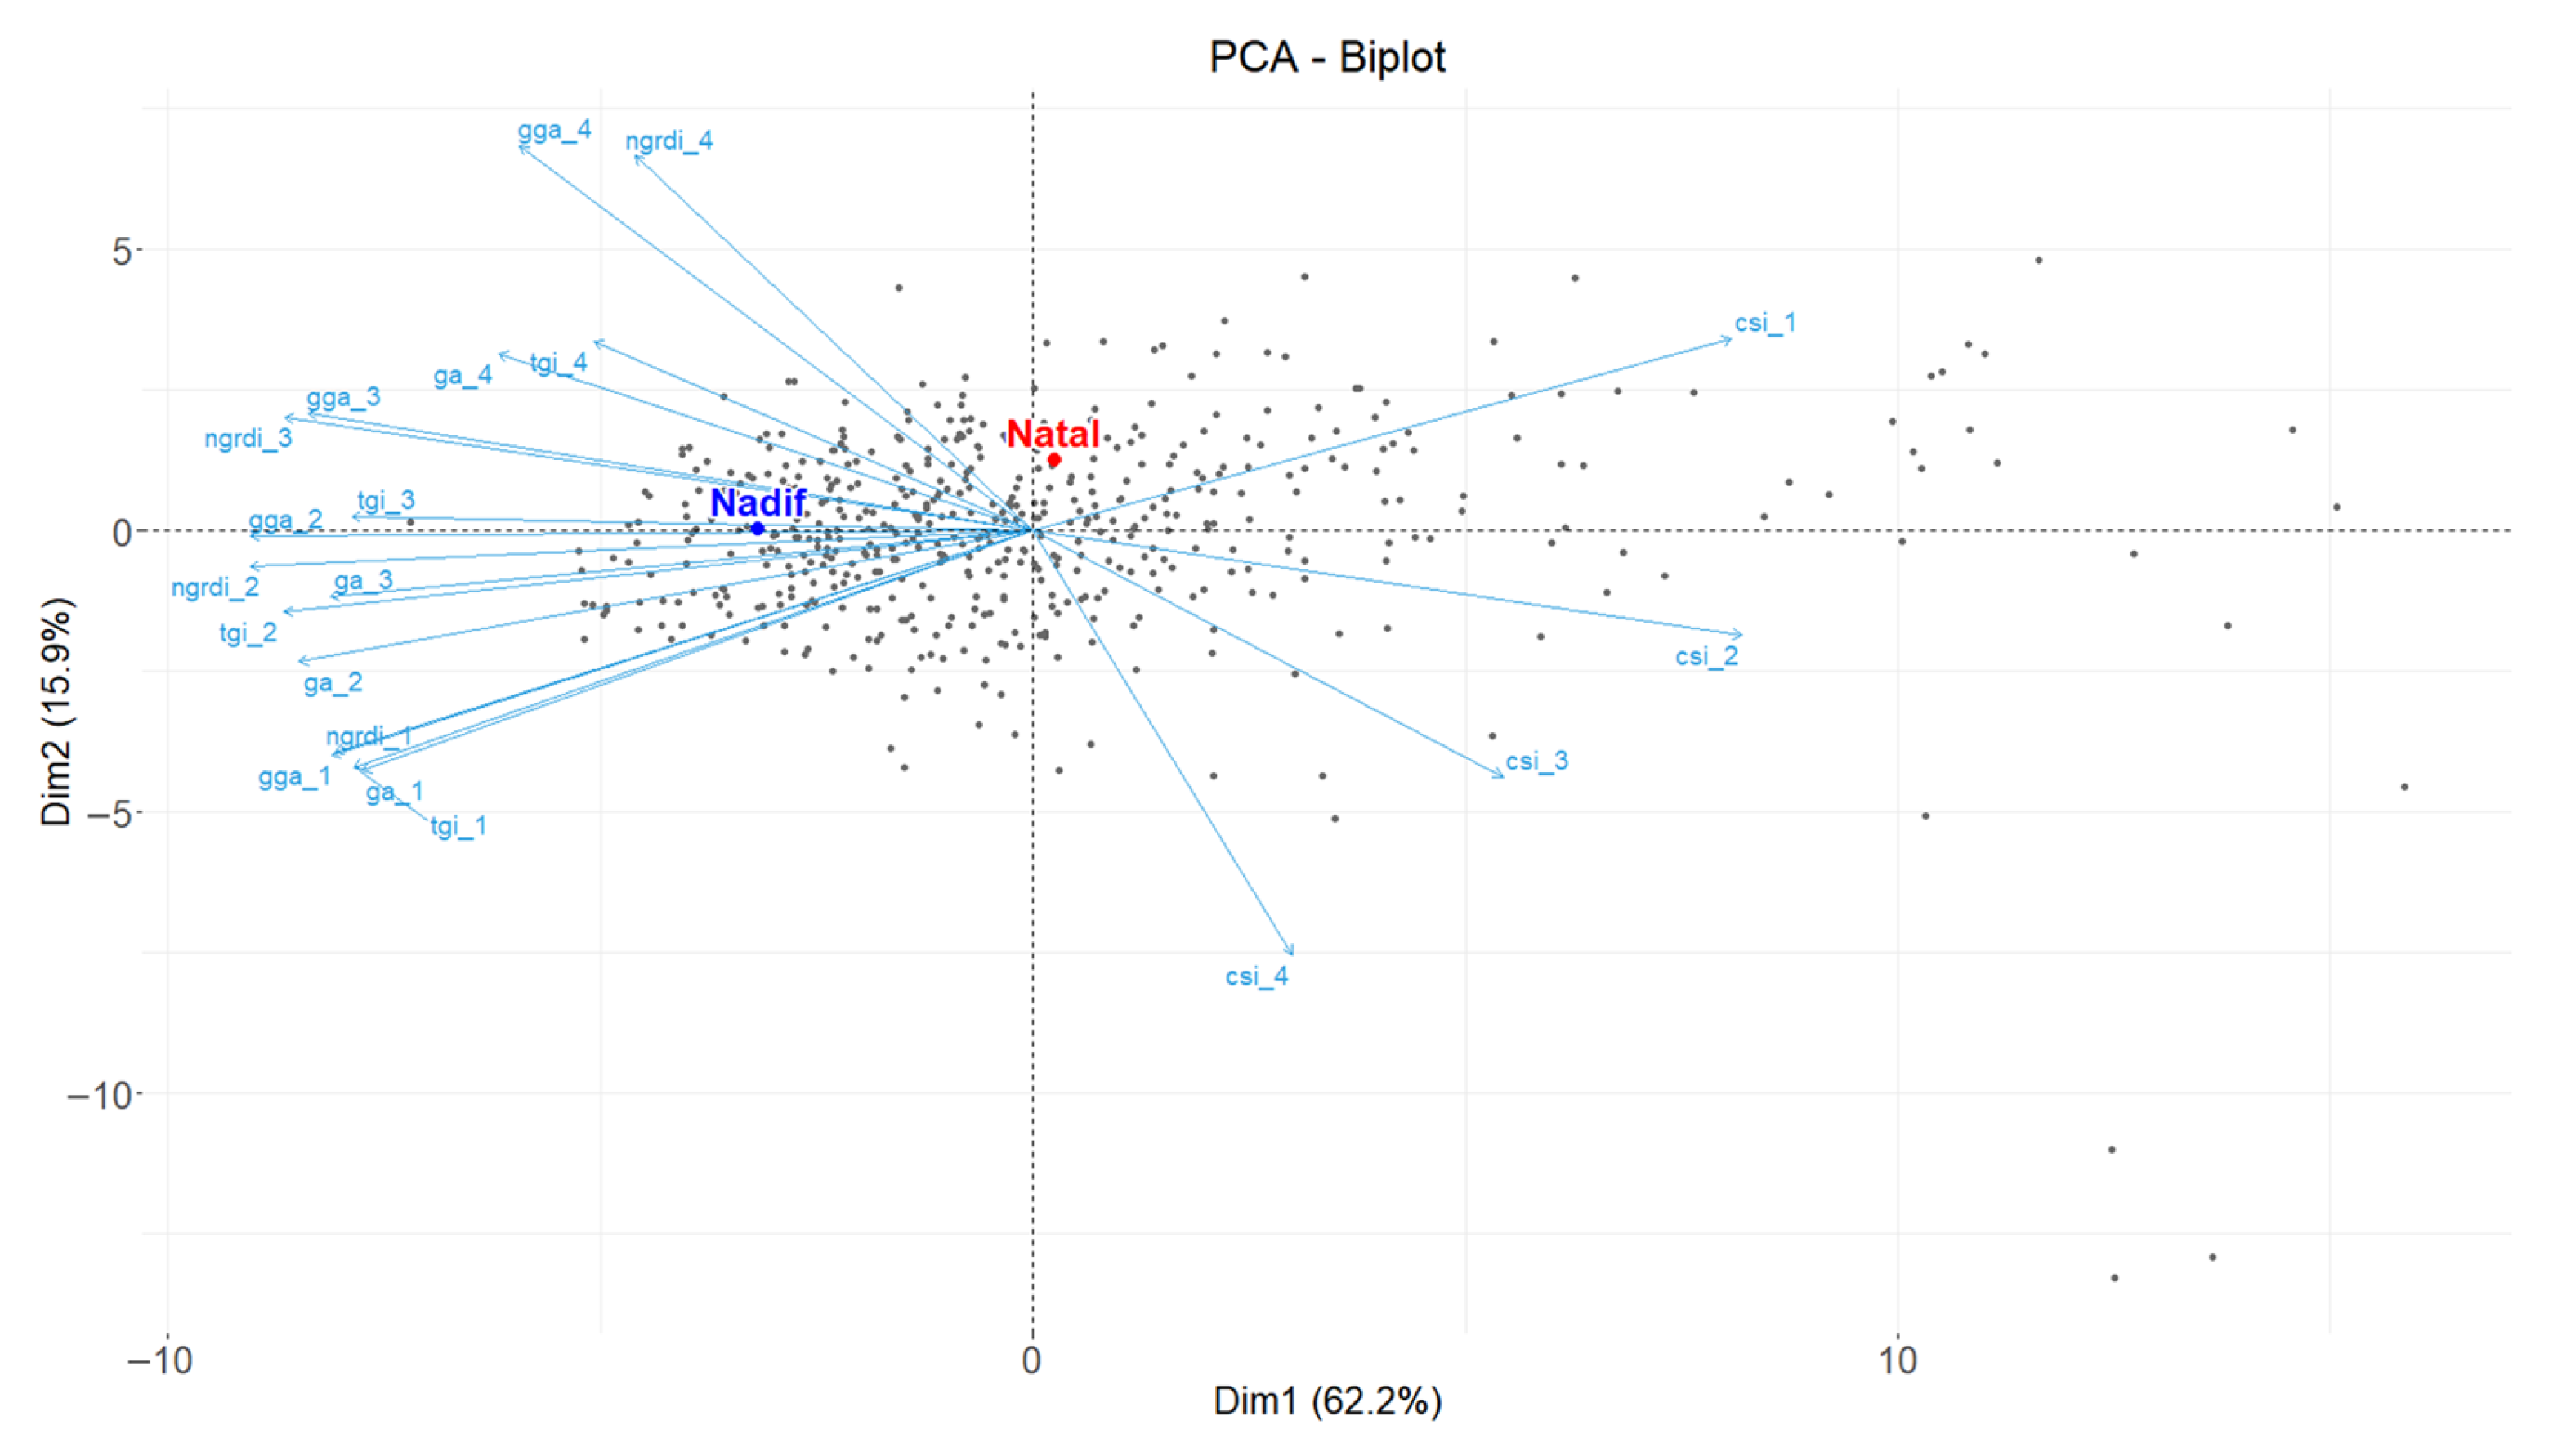
To verify the behavior of the two varieties, a Principal Component Analysis (PCA) was conducted with all the VIs (Figure 4). The results confirmed the presence of genotypes with contrasting values of RGB-derived indices, highlighting the contrasting profiles and supporting the appropriate selection of Natal and Nadif. In the first component, genotypes were discriminated based on VIs, showing a distinct behavior for CSI compared to the other 4 indices. In contrast, in the second component, the discriminating power of the 4 RGB-derived indices was related to the growth stage, indicating a temporal differentiation in plant responses. Together, PC1 and PC2 provided significant information on the patterns of variability within the dataset.

3.2. Experiment 2

3.2.1. Effects of Management on VIs: Sowing Rate and N Fertilization

The dataset of three-year field trials was examined with an ANOVA and revealed significant effects on GY, HD, PC, and VIs for all factors considered in Exp. 2 (Supplementary Tables S3 and S5). The total rainfall during the 2018–2019 crop cycle was abundant, exceeding the long-term average (543 mm compared to 500 mm). In contrast, the 2016–2017 growing season experienced below average rainfall overall, despite a peak in precipitation during January. The 2017–2018 season was also marked by reduced rainfall in the early stages, followed by an increase during the final phase of the crop cycle (Supplementary Table S2). These differences in rainfall patterns across years were the main source of variation for all the traits analyzed, highlighting the strong influence of seasonal climatic conditions on crop performance. Sowing density also showed a significant effect, for RGB-derived indices recorded in the early growth. The different N doses, on the other hand, seemed not to affect ground cover capacity, but only, as we expected, the PC and the HD. This is because the N fertilization followed the standard local management practices for durum wheat, as described in the Materials and Methods section, at two specific stages in the durum wheat growth cycle. Therefore, in the early growth stages, there were no differences between the various N theses.

3.2.2. Main Effects of Genotype, Sowing Rate, and Nitrogen Dose

ANOVA showed a clear interaction between genotype and sowing rate in the 1st and 3rd flight (p ≤ 0.000 and p ≤ 0.019, respectively). There was also a three-way interaction with G × E × M, for the same growing period, between year, genotype, and sowing rate (p ≤ 0.000; p ≤ 0.017). While there was no triple interaction between year, sowing rate, and N dose, and also between genotype, sowing rate, and N dose (p ≤ 0.500).
Table 3 shows the ANOVA main effects of genotype, sowing rate, and N doses on RGB-derived vegetation indices across the five growth stages (GS23–GS65) and the standardized mean differences (Hedges’ g) for the main contrasts. The index that consistently maintained the ability to discriminate between the two varieties across all flights is the TGI. Additionally, the NGRDI demonstrated discriminative capability in all flights except the fifth. Conversely, they provided no information regarding the effects of N fertilization, except for the NGRDI in the later flights. Indeed, flights with the highest discriminative capacities regarding N doses were the fourth and fifth for most of the vegetation indices (i.e., GA, GGA, and CSI), which exhibited excellent discriminative ability only in flights 4 and 5 under different nitrogen fertilization conditions.
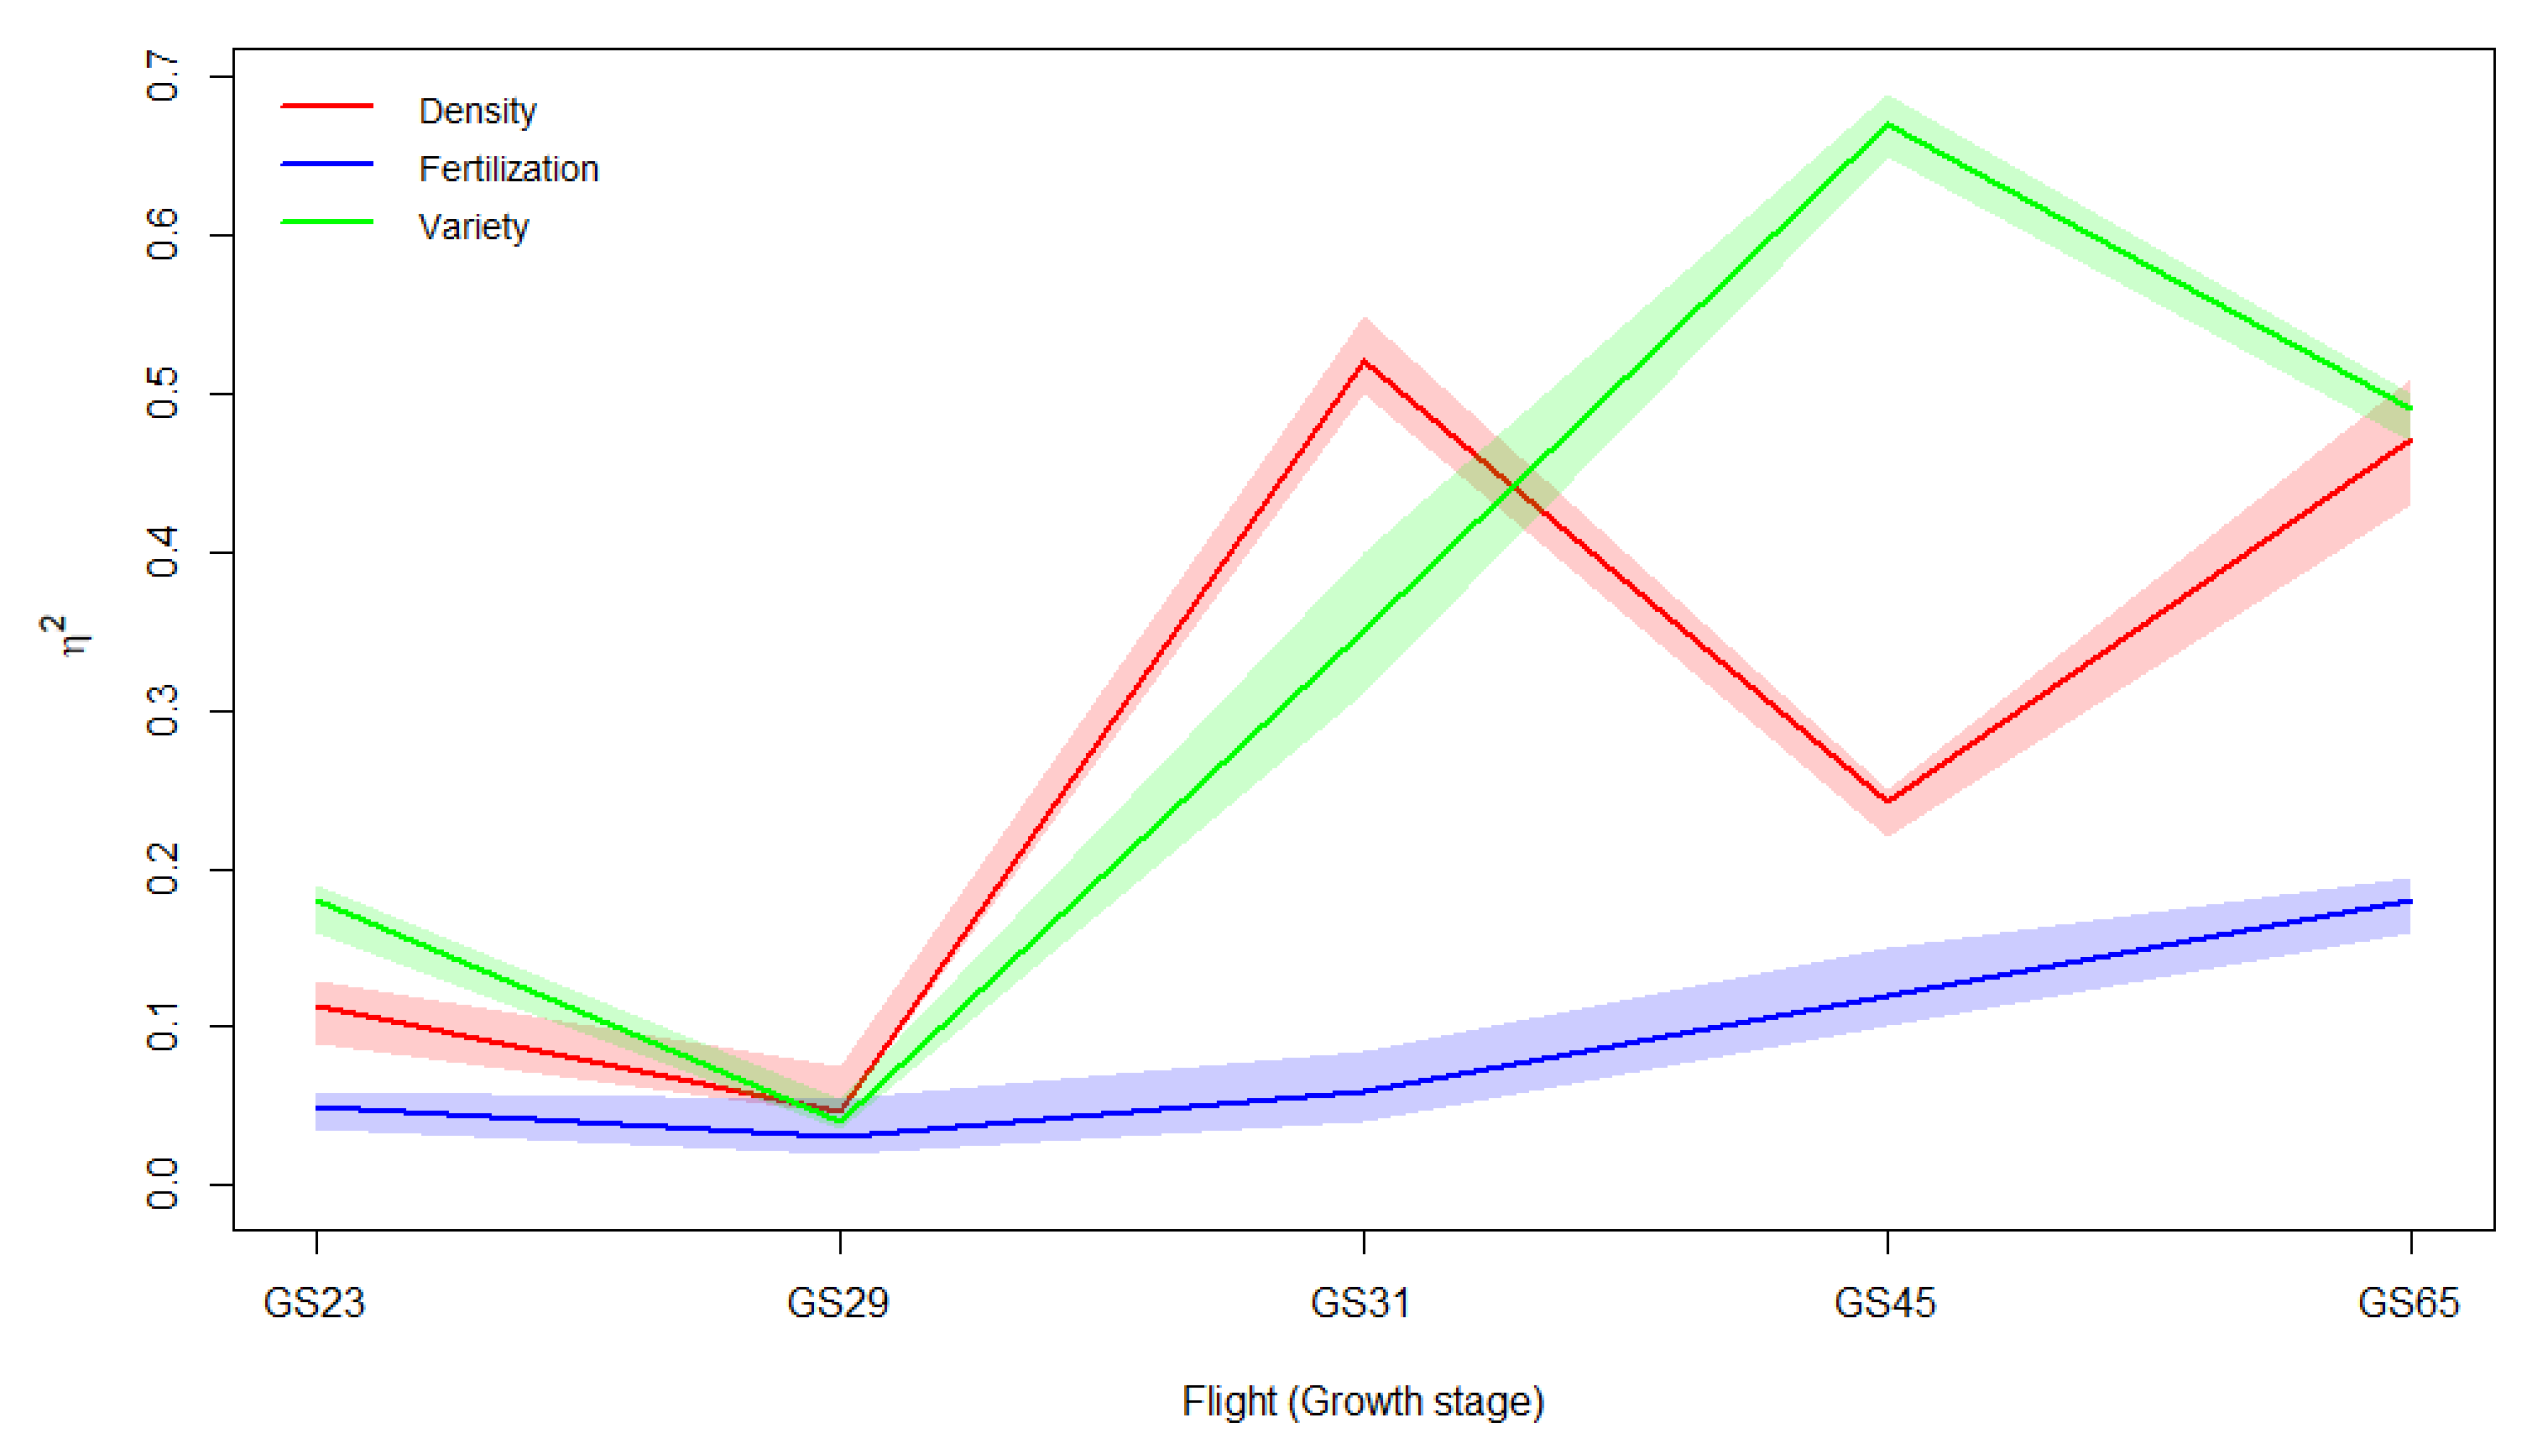
The multivariate analysis of variance (MANOVA) confirmed the good discriminating capacity of the VIs for the two contrasting genotypes and the sowing rate (Figure 5), starting from the tillering stage (η2 = 0.50), whereas for the N doses, the differences were significant only from the heading date, i.e., only after the absorption and utilization of N by the crop. For the two varieties, significance emerged after the third flight (GS31), with a maximum of η2 coinciding with the GS45.

3.2.3. Heritability and Correlation Analyses and PCA of Vegetation Indices

The heritability (H2) values (Supplementary Table S4), calculated for the five flights carried out over the three growing seasons, were above 0.90 for all VIs recorded in all flights except GS29, where they were below 0.90, and for CSI, lower than 0.70. Anomalous was the H2 value of the NGRDI recorded in GS65.
The analysis of Pearson correlation coefficients reveals some insight into the relationships between vegetation indices and the target variables GY, HD, and PC, as well as among the indices themselves across the five flights (Supplementary Table S5). GY and HD correlated negatively on average with all vegetation indices except NGRDI (all flights), the first CSI flights, and the 5th flight for all indices. In contrast, PC correlated positively with all indices, especially for NGRDI, and apart from the first CSI flights. The analysis of the correlations between the flights of the same VIs autocorrelated with very high r values, except for the 5th flight (GS65). The only evident difference is referred to the CSI for which opposite correlations are observed between the first two flights and the second two flights.
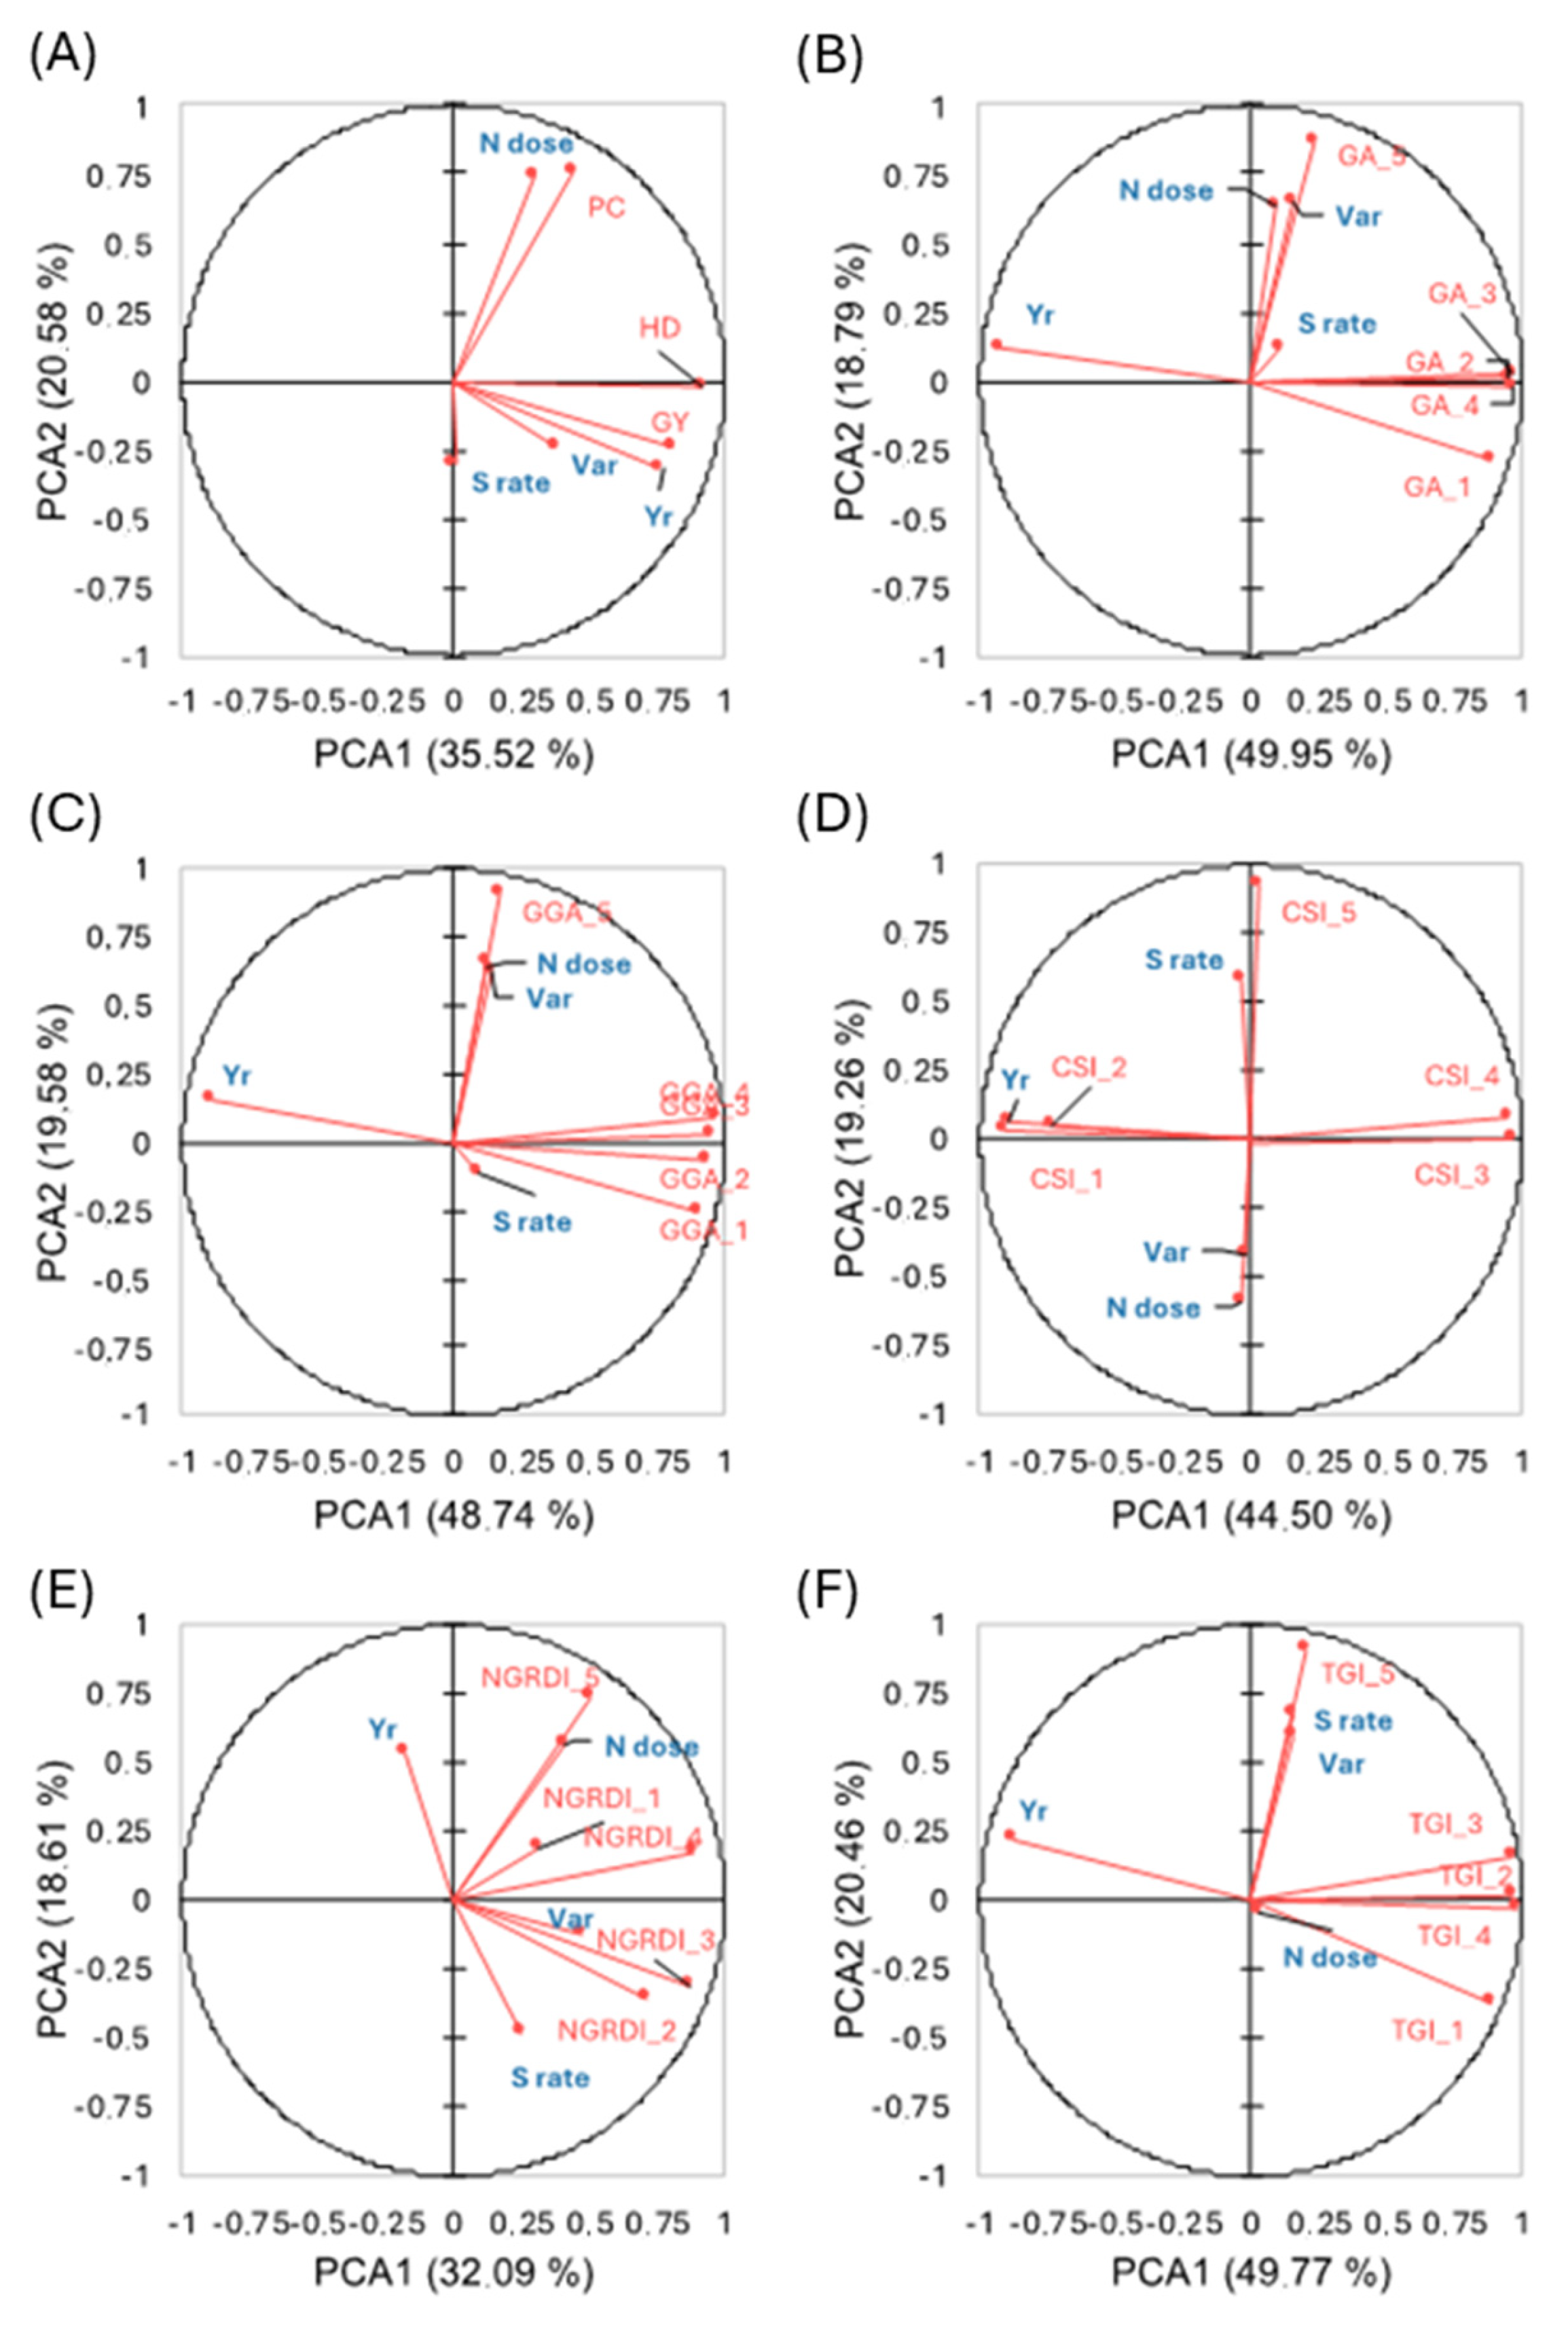
The results of the PCA performed for the individual vegetation indices with respect to the examined factors (Figure 6), confirmed that the CSI was very sensitive to variations due to the year, while NGRDI and TGI better discriminated the other factors.

3.2.4. Yield and Protein Prediction

The predictive capacity of visible-spectrum indices for grain yield and protein content was evaluated using year-specific, single-predictor linear models. For grain yield, accuracy was moderate overall, with best models reaching R2 ≈ 0.40 and RMSE ranging from 0.46 to 0.56 t/ha. The top-performing indices were GA_5 (R2 = 0.40, RMSE = 0.46 t/ha), GGA_5 (R2 = 0.38, RMSE = 0.47 t/ha), and TGI_5 (R2 = 0.36, RMSE = 0.48 t/ha). AUC metrics were comparable, with AUC_GA, AUC_GGA, and AUC_NGRDI each yielding R2 = 0.37 and RMSE ≈ 0.52 t/ha. For protein content, prediction accuracy was higher, with R2 values up to 0.69 and RMSE between 0.95 and 1.09%. The best results were obtained with CSI_5 and GGA_5 (both R2 = 0.69, RMSE = 0.95%), followed by GA_5 (R2 = 0.68, RMSE = 0.97%) and NGRDI_5 (R2 = 0.67, RMSE = 0.99%). Other strong predictors included GGA_4 and TGI_5 (R2 ≈ 0.63, RMSE between 0.98 and 1.05%). Among AUC metrics, AUC_CSI achieved R2 = 0.62 and RMSE ≈ 0.99%. Comprehensive results are reported in the Supplementary Materials.

4. Discussion

Currently, HTFP platforms, equipped with various types of sensors, allow non-invasive, rapid, and standardized assessments of large numbers of genotypes, agronomical traits, and complex physiological variables [39].
Our study fits into this advanced technological context, aiming to fill the existing gaps in the comparative evaluation of large durum wheat germplasm collections. Specifically, the present study aimed to evaluate the sensitivity of RGB-derived Vis for the early-stage screening of durum wheat genotypes with higher ground coverage ability. RGB-derived vegetation indices, indeed, are closely linked to the canopy development and ground coverage capacity of durum wheat, particularly during early growth stages. Indices such as GA and GGA effectively capture variations in green canopy cover by quantifying the relative proportion of green pixels in UAV-acquired images [66]. This makes them valuable proxies for assessing early ground coverage. The ability to detect such variation among genotypes enables high-throughput, image-based screening of ground cover potential, which has traditionally been overlooked in durum wheat breeding programs, addressing the urgent need for resilient and high-yielding cultivars in a changing climate [67]. Our findings underline the potential of these indices as reliable tools for phenotyping in durum wheat breeding programs.

4.1. Assessment of Soil Coverage Using RGB-Derived Indices

The significant variability observed in VIs among the durum wheat genotypes in Exp. 1 underscores the effectiveness of RGB-derived indices in capturing differences in soil coverage ability [39,68]. Notably, indices such as GA, GGA, TGI and NGRDI exhibited temporal dynamics, with peak values synchronizing with specific growth stages, thereby reflecting the progression of crop development. These findings align with previous studies emphasizing the temporal responsiveness of vegetation indices to various phenological stages [69]. This variability underscores the genetic diversity within the studied panel and its relevance for identifying genotypes with distinct soil coverage abilities. Notably, the early growth stages (GS25 and GS31) enabled discrimination between genotypes with contrasting soil coverage abilities, exemplified by the selection of the contrasting varieties Natal and Nadif for the second experiment. Specifically, on the second growth stage (i.e., GS31), all RGB-derived indices except for CSI were effective at discriminating genotypes with contrasting early vigor, thus demonstrating their efficiency in targeting this trait for breeding purposes. Their effectiveness in detecting early canopy development highlights their potential as practical tools in breeding programs focused on early vigor and rapid soil coverage. Additionally, the PCA confirmed the robustness of RGB-derived indices in differentiating genotypes, making them particularly suitable for early-stage phenotyping [45,51]. Significant variability was also observed for the three agronomic traits examined in the panel of durum wheat genotypes (i.e., GY, HD, PH). The high number of genotypes, combined with the temporal resolution of image acquisition, revealed a broad range of responses both in VIs and agronomic traits. This variability enabled the detection of positive correlations between certain RGB-derived indices and GY, with values comparable to those reported in previous studies [44,45,66].

4.2. Influence of Agronomic Management Practices

Exp. 2 was conducted to validate the performance of RGB-based indices under different agronomic management practices, specifically varying sowing rates and N fertilization levels. To this end, two durum wheat varieties with contrasting early ground coverage abilities, Natal (low values of GA, GGA, TGI, NGRDI) and Nadif (high values of GA, GGA, TGI, NGRDI), were selected based on the results of Exp. 1. In this experiment, the effects of sowing rate and nitrogen (N) fertilization on GY, HD, PC, and VIs were investigated over three growing seasons, with a coverage of UAV images acquired mainly in the early stages, especially in the third growing season. The results highlighted the significance of year-to-year climatic variation, particularly rainfall, in influencing these traits. Sowing density significantly affected RGB-derived indices during early growth stages, with higher densities enhancing the values of the VIs. This finding aligns with previous studies demonstrating that increased sowing rates could improve early canopy closure, thereby enhancing soil coverage and potentially suppressing weed growth [70,71]. In contrast, N fertilization did not markedly influence early RGB-derived indices, but significantly affected protein content and heading date, suggesting that N application primarily impacts physiological traits and yield components rather than early canopy development, likely due to the staggered application of fertilizers throughout the growth cycle. These findings support earlier results indicating an absence or a minimal early growth response to N inputs at planting [72]. This is because the N demand in the very early stages of wheat seedling development is mainly satisfied by nitrogen reserves present in the seeds [73,74].
The observed negative correlations between early growth stage VIs and HD can be attributed not only to the phenological dynamics of durum wheat development but also to the presence of other visible surfaces in early-stage images, such as bare soil and non-photosynthetic vegetation. Genotypes that flower later (i.e., those with higher HD values) typically exhibit slower early growth and reduced canopy coverage during the initial stages, leading to lower VIs values. Conversely, in the more closed canopies observed later in the season, when soil exposure becomes minimal, the correlation between VIs and HD shifts to positive for all indices. This trend is particularly evident for the NGRDI, which shows stronger positive correlations at later growth stages (e.g., r = 0.378 at GS45 and r = 0.526 at GS65). Similar reasoning could be applied to the negative correlation with GY observed during the early phenological growth stages. In contrast, at the final assessment, all vegetation indices showed positive correlations with GY, consistent with findings of Exp. 1, although with lower values. In this context as well, the NGRDI emerged as particularly predictive of yield performance in both experiments. On the contrary, the positive correlation observed between VIs and PC indeed suggests that these indices are more closely related to canopy “greenness”, likely reflecting chlorophyll content and nitrogen (N) status, rather than ground cover alone. Although we did not directly measure chlorophyll concentration or canopy N content in this study, this interpretation is supported by previous literature. RGB-based indices, particularly those sensitive to color components such as Hue and green intensity, have been shown to correlate with chlorophyll and N status in various crops [56,58,59]. These indices can thus provide indirect estimates of physiological traits linked to N dynamics, especially in later growth stages when protein synthesis is active.
Multivariate analyses demonstrated that VIs effectively discriminated between genotypes, sowing rates, and, to a lesser extent, N fertilization levels. The TGI and NGRDI consistently distinguished between the two genotypes contrasting for RGB-derived indices across all growth stages. The CSI, while not suitable for targeting early growth differences, was particularly effective in differentiating between N fertilization treatments during later growth stages; this was observed to a lesser extent also by all other VIs except TGI. In particular, referring to single spectral band, genotype differences were captured primarily by TGI and NGRDI from early stages (GS23 onward). In both the indices the green band, in contrast with red one, made these indices suitable for detecting early genetic differences in growth habits. For sowing rate, the clearest separation occurred around stem elongation (GS31), where all indices except CSI were significant; this likely reflects phenological timing and partial canopy closure—plots with slower development had lower green reflectance (e.g., GA), while indices incorporating red and blue (NGRDI, TGI) also captured concurrent changes in absorption as cover increased. For N fertilization, stage-dependent pigment dynamics dominated at later stages (GS45–GS65): increases or declines in green reflectance (GA, GGA), yellowing captured via blue sensitivity (CSI), and red-absorption shifts (NGRDI) aligned with chlorophyll degradation and N remobilization, matching the observed end-season separability.
The ability of RGB-based VIs to discriminate between different agronomic management practices has been corroborated by other studies. For instance, research has shown that certain RGB indices can effectively monitor crop responses to varying N fertilization levels, aiding in the optimization of N management strategies [75]. Additionally, the use of RGB-derived VIs has been explored for assessing soil coverage and crop vigor under different sowing rates, providing valuable information for sowing rate optimization [76,77,78]. Therefore, besides the findings presented by [79], which highlighted the superior reliability of NDVI for estimating ground cover under specific thresholds (LAI < 2.5, NDVI < 0.8), our study suggests that other RGB indices also exhibit a strong ability to discriminate canopy cover from bare soil during early growth stages. Finally, the predictive power of RGB indices should not be overlooked; correlations between GY and VIs generally showed weaker relationships, indicating that such indices may not directly predict yield, confirming previous studies [39].
A limitation of this validation experiment (Exp. 2) is that only two contrasting genotypes were evaluated, which restricts the generalization of the management-related findings. However, a leave-one-year-out sensitivity analysis of η2 values (Δη2 < 0.06) confirmed the stability of genotype and sowing rate effects across years. A power analysis further indicated that 4–6 genotypes would be required to detect effects of comparable magnitude (η2 = 0.12–0.15 at GS31–GS45, α = 0.05, power = 0.8).

4.3. Environmental Modulation of VI Performance

The significant year effects observed in Exp. 2 (Supplementary Table S3) reflect the substantial climatic variability across the three growing seasons (2016–2017, 2017–2018, 2018–2019), which directly influenced both crop development patterns and VI temporal dynamics (Supplementary Table S2). Rainfall timing and quantity emerged as primary modulators of VI trajectories. The 2017–2018 season, with above-average precipitation (358 mm, +14% vs. long-term mean) particularly during tillering, promoted rapid canopy expansion, resulting in higher GA and GGA values at early stages (GS23–GS29) compared to drier years. Conversely, the 2016–2017 season, characterized by mid-season drought (January–March, cumulative deficit > 80 mm), showed delayed canopy closure and persistently lower VI values through GS45. These findings align with established relationships between water availability and leaf area development [44], where moisture stress during early vegetative stages constrains cell expansion and tillering, directly reducing green canopy cover. Temperature effects were most evident through phenological acceleration. The 2016–2017 season, the warmest of the study period (mean temperature +0.6 °C above average), exhibited earlier heading dates (mean HD = 24.3 days from April 1st vs. 28.7 days in 2018–2019), compressing the vegetative growth period. This phenological acceleration partially explains the observed year × growth stage interactions for VIs: equivalent calendar dates corresponded to more advanced developmental stages in warmer years, affecting green area and senescence dynamics. The significant year × genotype × sowing rate interaction for early-stage VIs (GS23–GS31, p < 0.001; Supplementary Table S3) suggests that genotype-specific responses to sowing density are modulated by environmental conditions—vigorous genotypes like Nadif may capitalize more effectively on high sowing rates under favorable moisture conditions (2018–2019) but show diminished advantages under water limitation (2016–2017).
Nitrogen-weather interactions were evident in the delayed expression of N fertilization effects on VIs. Under dry early-season conditions (2016–2017), nitrogen uptake was likely constrained by limited soil moisture, reducing early-stage differentiation among N treatments. In contrast, the wetter 2018–2019 season showed earlier divergence of VI values among N doses (visible by GS45 vs. GS65 in drier years), consistent with enhanced nutrient availability and uptake under adequate soil moisture [26,73]. This environmental dependency underscores the importance of multi-year validation when developing VI-based phenotyping protocols.
Importantly, despite this environmental variability, the relative rankings of genotypes based on early-stage VIs (GS31) remained stable across years (Spearman rank correlation ρ > 0.85 for NGRDI and TGI between years), as confirmed by high heritability estimates (H2 > 0.90; Supplementary Table S4). This stability indicates that while absolute VI values are environmentally sensitive—as expected for any growth-related trait—the underlying genetic differences in early vigor are robust, supporting the utility of these indices for breeding selection. The leave-one-year-out sensitivity analysis further corroborated this, showing stable effect sizes (η2) for genotype and sowing rate factors across year subsets. These findings carry practical implications: breeding programs should prioritize multi-environment phenotyping to capture genotype × environment interactions in early vigor but can confidently use relative VI rankings from individual environments for preliminary screening. Additionally, understanding weather-VI relationships enables post hoc adjustment or environment-specific threshold calibration to improve selection accuracy across target production environments.

5. Conclusions

This study underscores the potential of UAV-obtained RGB-derived vegetation indices as reliable and cost-effective tools for estimating the proportion of ground covered by crop during early growth stages, evaluating genotypic variability, and assessing the influence of agronomic practices on durum wheat performance under field conditions. Among the indices evaluated, the NGRDI and TGI consistently demonstrated robust performance across early growth stages, making them particularly valuable for high-throughput field phenotyping applications.
Our findings emphasize the pivotal role of high-throughput phenotyping in bridging the gap between pre-breeding and breeding, facilitating the selection of durum wheat genotypes with enhanced early vigor, and ultimately contributing to more resilient and productive cropping systems.
Future studies focusing on integrating UAV-RGB indices with additional sensor modalities (i.e., multispectral, thermal, or LiDAR data) will capture additional and complementary information on plant physiology and stress responses. In addition, combining image-derived traits with genomic and transcriptomic data will enhance predictive models for genotype performance and accelerate the development of improved varieties.

Supplementary Materials

The following supporting information can be downloaded at: https://www.mdpi.com/article/10.3390/crops5060085/s1, Table S1: List of genotypes tested in Exp. 1; Table S2: Weather conditions during the four seasons of the study; Table S3: Effect of year (Y), variety (G), sowing rates (S), nitrogen doses (N), and their interaction on agronomic traits and VIs evaluated in three study years in Exp. 2; Table S4: Heritability (H2) calculated for the five flights carried out over the three growing seasons in Exp. 2; Table S5: Correlation matrix (Pearson) for the traits analyzed in Exp. 2.

Author Contributions

Conceptualization, P.D.V.; methodology, P.D.V., I.P. and P.S.; software, E.R. and F.F.; formal analysis and data curation, E.R., F.F. and P.D.V.; investigation, I.P. and P.S.; resources, P.D.V. and N.P.; writing—original draft preparation, P.D.V. and F.F.; writing—review and editing, P.D.V., N.P., E.R., F.F., P.S., S.E. and I.P.; visualization, E.R. and F.F.; supervision, project administration, and funding acquisition, P.D.V.; funding acquisition, N.P. All authors have read and agreed to the published version of the manuscript.

Funding

This study was carried out with internal funding.

Data Availability Statement

The data presented in this study are available on request from the corresponding authors.

Acknowledgments

We would like to thank Antonio Troccoli for meteorological data support, as well as Antonio Gallo and Vito De Gregorio for their technical support in managing the field trials.

Conflicts of Interest

The authors declare no conflicts of interest.

Abbreviations

The following abbreviations are used in this manuscript:
UAVUnmanned Aerial Vehicle
GAGreen Area
GGAGreener Area
NGRDIINormalized Green Red Difference Index
TGITriangular Greenness Index
CSICrop Senescence Index
VIVegetation index
QTLQuantitative Trait Loci
HDHeading Date
PHPlant Height
GSDGround Sample Distance

References

  1. De Vita, P.; Taranto, F. Durum Wheat (Triticum turgidum ssp. durum) Breeding to Meet the Challenge of Climate Change. In Advances in Plant Breeding Strategies: Cereals; Al-Khayri, J.M., Jain, S.M., Johnson, D.V., Eds.; Springer International Publishing: Cham, Switzerland, 2019; Volume 5, pp. 471–524. ISBN 978-3-030-23108-8. [Google Scholar]
  2. Ferrise, R.; Moriondo, M.; Bindi, M. Probabilistic assessments of climate change impacts on durum wheat in the Mediterranean region. Nat. Hazards Earth Syst. Sci. 2011, 11, 1293–1302. [Google Scholar] [CrossRef]
  3. UnNisa, Z.; Govind, A.; Marchetti, M.; Lasserre, B. A review of crop water productivity in the Mediterranean basin under a changing climate: Wheat and barley as test cases. Irrig. Drain. 2022, 71, 51–70. [Google Scholar] [CrossRef]
  4. Ventrella, D.; Charfeddine, M.; Moriondo, M.; Rinaldi, M.; Bindi, M. Agronomic adaptation strategies under climate change for winter durum wheat and tomato in southern Italy: Irrigation and nitrogen fertilization. Reg. Environ. Change 2012, 12, 407–419. [Google Scholar] [CrossRef]
  5. Richards, R.A.; Lukacs, Z. Seedling vigour in wheat—Sources of variation for genetic and agronomic improvement. Aust. J. Agric. Res. 2002, 53, 41–50. [Google Scholar] [CrossRef]
  6. Beres, B.L.; Rahmani, E.; Clarke, J.M.; Grassini, P.; Pozniak, C.J.; Geddes, C.M.; Porker, K.D.; May, W.E.; Ransom, J.K. A Systematic Review of Durum Wheat: Enhancing Production Systems by Exploring Genotype, Environment, and Management (G × E × M) Synergies. Front. Plant Sci. 2020, 11, 568657. [Google Scholar] [CrossRef]
  7. Hendriks, P.-W.; Gurusinghe, S.; Weston, P.A.; Ryan, P.R.; Delhaize, E.; Weston, L.A.; Rebetzke, G.J. Introgression of early shoot vigour in wheat modifies root systems, increases competitiveness and provides options for integrated weed management. Plant Soil 2024, 504, 717–736. [Google Scholar] [CrossRef]
  8. Hendriks, P.-W.; Gurusinghe, S.; Ryan, P.R.; Rebetzke, G.J.; Weston, L.A. Competitiveness of Early Vigour Wheat (Triticum aestivum L.) Genotypes Is Established at Early Growth Stages. Agronomy 2022, 12, 377. [Google Scholar] [CrossRef]
  9. Xynias, I.N.; Mylonas, I.; Korpetis, E.G.; Ninou, E.; Tsaballa, A.; Avdikos, I.D.; Mavromatis, A.G. Durum Wheat Breeding in the Mediterranean Region: Current Status and Future Prospects. Agronomy 2020, 10, 432. [Google Scholar] [CrossRef]
  10. Vadez, V.; Grondin, A.; Chenu, K.; Henry, A.; Laplaze, L.; Millet, E.J.; Carminati, A. Crop traits and production under drought. Nat. Rev. Earth Environ. 2024, 5, 211–225. [Google Scholar] [CrossRef]
  11. Pérez-Méndez, N.; Miguel-Rojas, C.; Jimenez-Berni, J.A.; Gomez-Candon, D.; Pérez-de-Luque, A.; Fereres, E.; Catala-Forner, M.; Villegas, D.; Sillero, J.C. Plant Breeding and Management Strategies to Minimize the Impact of Water Scarcity and Biotic Stress in Cereal Crops under Mediterranean Conditions. Agronomy 2022, 12, 75. [Google Scholar] [CrossRef]
  12. Nelsen, T.S.; Hegarty, J.; Tamagno, S.; Lundy, M.E. NDVI-based ideotypes as a cost-effective tool to support wheat yield stability selection under heterogeneous environments. Field Crops Res. 2025, 322, 109727. [Google Scholar] [CrossRef]
  13. Rebetzke, G.J.; Richards, R.A. Genetic improvement of early vigour in wheat. Aust. J. Agric. Res. 1999, 50, 291. [Google Scholar] [CrossRef]
  14. Soltani, A.; Galeshi, S. Importance of rapid canopy closure for wheat production in a temperate sub-humid environment: Experimentation and simulation. Field Crops Res. 2002, 77, 17–30. [Google Scholar] [CrossRef]
  15. Wilson, P.B.; Rebetzke, G.J.; Condon, A.G. Of growing importance: Combining greater early vigour and transpiration efficiency for wheat in variable rainfed environments. Funct. Plant Biol. 2015, 42, 1107. [Google Scholar] [CrossRef]
  16. Condon, A.G.; Richards, R.A.; Rebetzke, G.J.; Farquhar, G.D. Breeding for high water-use efficiency. J. Exp. Bot. 2004, 55, 2447–2460. [Google Scholar] [CrossRef]
  17. Ludwig, F.; Asseng, S. Potential benefits of early vigor and changes in phenology in wheat to adapt to warmer and drier climates. Agric. Syst. 2010, 103, 127–136. [Google Scholar] [CrossRef]
  18. Mullan, D.J.; Reynolds, M.P. Quantifying genetic effects of ground cover on soil water evaporation using digital imaging. Funct. Plant Biol. 2010, 37, 703–712. [Google Scholar] [CrossRef]
  19. Zhao, Z.; Rebetzke, G.J.; Zheng, B.; Chapman, S.C.; Wang, E. Modelling impact of early vigour on wheat yield in dryland regions. J. Exp. Bot. 2019, 70, 2535–2548. [Google Scholar] [CrossRef]
  20. Devi, J.M.; Sinclair, T.R.; Chen, P.; Carter, T.E. Evaluation of Elite Southern Maturity Soybean Breeding Lines for Drought-Tolerant Traits. Agron. J. 2014, 106, 1947–1954. [Google Scholar] [CrossRef]
  21. Lobell, D.B.; Hammer, G.L.; McLean, G.; Messina, C.; Roberts, M.J.; Schlenker, W. The critical role of extreme heat for maize production in the United States. Nat. Clim. Change 2013, 3, 497–501. [Google Scholar] [CrossRef]
  22. Messina, C.D.; Sinclair, T.R.; Hammer, G.L.; Curan, D.; Thompson, J.; Oler, Z.; Gho, C.; Cooper, M. Limited-Transpiration Trait May Increase Maize Drought Tolerance in the US Corn Belt. Agron. J. 2015, 107, 1978–1986. [Google Scholar] [CrossRef]
  23. Schoppach, R.; Sadok, W. Differential sensitivities of transpiration to evaporative demand and soil water deficit among wheat elite cultivars indicate different strategies for drought tolerance. Environ. Exp. Bot. 2012, 84, 1–10. [Google Scholar] [CrossRef]
  24. Sinclair, T.R.; Hammer, G.L.; van Oosterom, E.J. Potential yield and water-use efficiency benefits in sorghum from limited maximum transpiration rate. Funct. Plant Biol. 2005, 32, 945–952. [Google Scholar] [CrossRef] [PubMed]
  25. Wilson, P.B.; Rebetzke, G.J.; Condon, A.G. Pyramiding greater early vigour and integrated transpiration efficiency in bread wheat; trade-offs and benefits. Field Crops Res. 2015, 183, 102–110. [Google Scholar] [CrossRef]
  26. Liao, M.; Fillery, I.R.P.; Palta, J.A. Early vigorous growth is a major factor influencing nitrogen uptake in wheat. Funct. Plant Biol. 2004, 31, 121–129. [Google Scholar] [CrossRef]
  27. Pang, J.; Palta, J.A.; Rebetzke, G.J.; Milroy, S.P. Wheat genotypes with high early vigour accumulate more nitrogen and have higher photosynthetic nitrogen use efficiency during early growth. Funct. Plant Biol. 2013, 41, 215–222. [Google Scholar] [CrossRef]
  28. Li, G.; Bai, G.; Carver, B.F.; Elliott, N.C.; Bennett, R.S.; Wu, Y.; Hunger, R.; Bonman, J.M.; Xu, X. Genome-wide association study reveals genetic architecture of coleoptile length in wheat. Theor. Appl. Genet. 2017, 130, 391–401. [Google Scholar] [CrossRef]
  29. Sharma, D.; Kumari, A.; Sharma, P.; Singh, A.; Sharma, A.; Mir, Z.A.; Kumar, U.; Jan, S.; Parthiban, M.; Mir, R.R.; et al. Meta-QTL analysis in wheat: Progress, challenges and opportunities. Theor. Appl. Genet. 2023, 136, 247. [Google Scholar] [CrossRef]
  30. Vukasovic, S.; Alahmad, S.; Christopher, J.; Snowdon, R.J.; Stahl, A.; Hickey, L.T. Dissecting the Genetics of Early Vigour to Design Drought-Adapted Wheat. Front. Plant Sci. 2022, 12, 754439. [Google Scholar] [CrossRef]
  31. Araus, J.L.; Kefauver, S.C. Breeding to adapt agriculture to climate change: Affordable phenotyping solutions. Curr. Opin. Plant Biol. 2018, 45, 237–247. [Google Scholar] [CrossRef]
  32. Jiang, N.; Zhu, X.-G. Modern phenomics to empower holistic crop science, agronomy, and breeding research. J. Genet. Genom. 2024, 51, 790–800. [Google Scholar] [CrossRef] [PubMed]
  33. Angidi, S.; Madankar, K.; Tehseen, M.M.; Bhatla, A. Advanced High-Throughput Phenotyping Techniques for Managing Abiotic Stress in Agricultural Crops—A Comprehensive Review. Crops 2025, 5, 8. [Google Scholar] [CrossRef]
  34. Karim, M.R.; Reza, M.N.; Jin, H.; Haque, M.A.; Lee, K.-H.; Sung, J.; Chung, S.-O. Application of LiDAR Sensors for Crop and Working Environment Recognition in Agriculture: A Review. Remote Sens. 2024, 16, 4623. [Google Scholar] [CrossRef]
  35. Farhan, S.M.; Yin, J.; Chen, Z.; Memon, M.S. A Comprehensive Review of LiDAR Applications in Crop Management for Precision Agriculture. Sensors 2024, 24, 5409. [Google Scholar] [CrossRef]
  36. Atefi, A.; Ge, Y.; Pitla, S.; Schnable, J. Robotic Technologies for High-Throughput Plant Phenotyping: Contemporary Reviews and Future Perspectives. Front. Plant Sci. 2021, 12, 611940. [Google Scholar] [CrossRef]
  37. Araus, J.L.; Kefauver, S.C.; Vergara-Díaz, O.; Gracia-Romero, A.; Rezzouk, F.Z.; Segarra, J.; Buchaillot, M.L.; Chang-Espino, M.; Vatter, T.; Sanchez-Bragado, R.; et al. Crop phenotyping in a context of global change: What to measure and how to do it. J. Integr. Plant Biol. 2022, 64, 592–618. [Google Scholar] [CrossRef]
  38. Araus, J.L.; Cairns, J.E. Field high-throughput phenotyping: The new crop breeding frontier. Trends Plant Sci. 2014, 19, 52–61. [Google Scholar] [CrossRef]
  39. Gracia-Romero, A.; Kefauver, S.C.; Fernandez-Gallego, J.A.; Vergara-Díaz, O.; Nieto-Taladriz, M.T.; Araus, J.L. UAV and Ground Image-Based Phenotyping: A Proof of Concept with Durum Wheat. Remote Sens. 2019, 11, 1244. [Google Scholar] [CrossRef]
  40. White, J.W.; Andrade-Sanchez, P.; Gore, M.A.; Bronson, K.F.; Coffelt, T.A.; Conley, M.M.; Feldmann, K.A.; French, A.N.; Heun, J.T.; Hunsaker, D.J.; et al. Field-based phenomics for plant genetics research. Field Crops Res. 2012, 133, 101–112. [Google Scholar] [CrossRef]
  41. Liu, J.; Pattey, E. Retrieval of leaf area index from top-of-canopy digital photography over agricultural crops. Agric. For. Meteorol. 2010, 150, 1485–1490. [Google Scholar] [CrossRef]
  42. Gracia-Romero, A.; Kefauver, S.C.; Vergara-Díaz, O.; Zaman-Allah, M.A.; Prasanna, B.M.; Cairns, J.E.; Araus, J.L. Comparative Performance of Ground vs. Aerially Assessed RGB and Multispectral Indices for Early-Growth Evaluation of Maize Performance under Phosphorus Fertilization. Front. Plant Sci. 2017, 8, 2004. [Google Scholar] [CrossRef]
  43. Abrougui, K.; Khemis, C.; Guebsi, R.; Ouni, A.; Mohammadi, A.; Amami, R.; Kefauver, S.; Mansour, H.B.; Chehaibi, S. Efficient management of potato fields: Integrating ground and UAV vegetation indexes for optimal mechanical planting parameters. Euro-Mediterr. J. Environ. Integr. 2024, 10, 2033–2048. [Google Scholar] [CrossRef]
  44. Buchaillot, M.L.; Gracia-Romero, A.; Vergara-Diaz, O.; Zaman-Allah, M.A.; Tarekegne, A.; Cairns, J.E.; Prasanna, B.M.; Araus, J.L.; Kefauver, S.C. Evaluating Maize Genotype Performance under Low Nitrogen Conditions Using RGB UAV Phenotyping Techniques. Sensors 2019, 19, 1815. [Google Scholar] [CrossRef] [PubMed]
  45. Fernandez-Gallego, J.A.; Kefauver, S.C.; Vatter, T.; Gutiérrez, N.A.; Nieto-Taladriz, M.T.; Araus, J.L. Low-cost assessment of grain yield in durum wheat using RGB images. Eur. J. Agron. 2019, 105, 146–156. [Google Scholar] [CrossRef]
  46. Hamdane, Y.; Segarra, J.; Buchaillot, M.L.; Rezzouk, F.Z.; Gracia-Romero, A.; Vatter, T.; Benfredj, N.; Hameed, R.A.; Gutiérrez, N.A.; Torró, I.T.; et al. Using Ground and UAV Vegetation Indexes for the Selection of Fungal-Resistant Bread Wheat Varieties. Drones 2023, 7, 454. [Google Scholar] [CrossRef]
  47. Torres-Sánchez, J.; Peña, J.M.; de Castro, A.I.; López-Granados, F. Multi-temporal mapping of the vegetation fraction in early-season wheat fields using images from UAV. Comput. Electron. Agric. 2014, 103, 104–113. [Google Scholar] [CrossRef]
  48. Marcial-Pablo, M.d.J.; Gonzalez-Sanchez, A.; Jimenez-Jimenez, S.I.; Ontiveros-Capurata, R.E.; Ojeda-Bustamante, W. Estimation of vegetation fraction using RGB and multispectral images from UAV. Int. J. Remote Sens. 2019, 40, 420–438. [Google Scholar] [CrossRef]
  49. Prey, L.; Von Bloh, M.; Schmidhalter, U. Evaluating RGB Imaging and Multispectral Active and Hyperspectral Passive Sensing for Assessing Early Plant Vigor in Winter Wheat. Sensors 2018, 18, 2931. [Google Scholar] [CrossRef]
  50. Zheng, H.; Cheng, T.; Li, D.; Zhou, X.; Yao, X.; Tian, Y.; Cao, W.; Zhu, Y. Evaluation of RGB, Color-Infrared and Multispectral Images Acquired from Unmanned Aerial Systems for the Estimation of Nitrogen Accumulation in Rice. Remote Sens. 2018, 10, 824. [Google Scholar] [CrossRef]
  51. Kipp, S.; Mistele, B.; Baresel, P.; Schmidhalter, U. High-throughput phenotyping early plant vigour of winter wheat. Eur. J. Agron. 2014, 52, 271–278. [Google Scholar] [CrossRef]
  52. Qiu, Q.; Zhang, M.; Wang, N.; Qiu, R.; Miao, Y. Plant Phenotyping. In Soil and Crop Sensing for Precision Crop Production; Li, M., Yang, C., Zhang, Q., Eds.; Springer International Publishing: Cham, Switzerland, 2022; pp. 185–250. ISBN 978-3-030-70432-2. [Google Scholar]
  53. Zadoks, J.C.; Chang, T.T.; Konzak, C.F. A decimal code for the growth stages of cereals. Weed Res. 1974, 14, 415–421. [Google Scholar] [CrossRef]
  54. Lukina, E.V.; Stone, M.L.; Raun, W.R. Estimating vegetation coverage in wheat using digital images. J. Plant Nutr. 1999, 22, 341–350. [Google Scholar] [CrossRef]
  55. Hunt, E.R.; Cavigelli, M.; Daughtry, C.S.T.; Mcmurtrey, J.E.; Walthall, C.L. Evaluation of Digital Photography from Model Aircraft for Remote Sensing of Crop Biomass and Nitrogen Status. Precis. Agric. 2005, 6, 359–378. [Google Scholar] [CrossRef]
  56. Zaman-Allah, M.; Vergara, O.; Araus, J.L.; Tarekegne, A.; Magorokosho, C.; Zarco-Tejada, P.J.; Hornero, A.; Albà, A.H.; Das, B.; Craufurd, P.; et al. Unmanned aerial platform-based multi-spectral imaging for field phenotyping of maize. Plant Methods 2015, 11, 35. [Google Scholar] [CrossRef]
  57. Hunt, E.R.; Doraiswamy, P.C.; McMurtrey, J.E.; Daughtry, C.S.T.; Perry, E.M.; Akhmedov, B. A visible band index for remote sensing leaf chlorophyll content at the canopy scale. Int. J. Appl. Earth Obs. Geoinf. 2013, 21, 103–112. [Google Scholar] [CrossRef]
  58. Casadesús, J.; Kaya, Y.; Bort, J.; Nachit, M.M.; Araus, J.L.; Amor, S.; Ferrazzano, G.; Maalouf, F.; Maccaferri, M.; Martos, V.; et al. Using vegetation indices derived from conventional digital cameras as selection criteria for wheat breeding in water-limited environments. Ann. Appl. Biol. 2007, 150, 227–236. [Google Scholar] [CrossRef]
  59. Vergara-Díaz, O.; Zaman-Allah, M.A.; Masuka, B.; Hornero, A.; Zarco-Tejada, P.; Prasanna, B.M.; Cairns, J.E.; Araus, J.L. A Novel Remote Sensing Approach for Prediction of Maize Yield Under Different Conditions of Nitrogen Fertilization. Front. Plant Sci. 2016, 7, 666. [Google Scholar] [CrossRef] [PubMed]
  60. Stern, A.J.; Doraiswamy, P.C.; Hunt, R.E., Jr. Changes of crop rotation in Iowa determined from the United States Department of Agriculture, National Agricultural Statistics Service cropland data layer product. J. Appl. Remote Sens. 2012, 6, 063590. [Google Scholar] [CrossRef]
  61. Hunt, E.R., Jr.; Daughtry, C.S.T.; Eitel, J.U.H.; Long, D.S. Remote Sensing Leaf Chlorophyll Content Using a Visible Band Index. Agron. J. 2011, 103, 1090–1099. [Google Scholar] [CrossRef]
  62. R Core Team. R: A Language and Environment for Statistical Computing; R Foundation for Statistical Computing: Vienna, Austria, 2021; Available online: https://www.R-project.org/ (accessed on 20 October 2025).
  63. Fox, J.; Weisberg, S.; Price, B. Car: Companion to Applied Regression, Version 3.1-3; Sage: Thousand Oaks, CA, USA, 2001.
  64. Rodríguez-Álvarez, M.X.; Boer, M.P.; van Eeuwijk, F.A.; Eilers, P.H.C. Correcting for spatial heterogeneity in plant breeding experiments with P-splines. Spat. Stat. 2018, 23, 52–71. [Google Scholar] [CrossRef]
  65. Cohen, J. (Ed.) Statistical Power Analysis for the Behavioral Sciences. In Statistical Power Analysis for the Behavioral Sciences; Academic Press: Cambridge, MA, USA, 1977; p. iii. ISBN 978-0-12-179060-8. [Google Scholar]
  66. Kefauver, S.C.; El-Haddad, G.; Vergara-Diaz, O.; Araus, J.L. RGB picture vegetation indexes for High-Throughput Phenotyping Platforms (HTPPs). In Remote Sensing for Agriculture, Ecosystems, and Hydrology XVII, Proceedings of the SPIE Remote Sensing, Toulouse, France, 21–24 September 2015; Neale, C.M.U., Maltese, A., Eds.; SPIE: Bellingham, WA, USA, 2015; p. 96370J. [Google Scholar] [CrossRef]
  67. Wang, Y.; Zhang, Z.; Feng, L.; Du, Q.; Runge, T. Combining Multi-Source Data and Machine Learning Approaches to Predict Winter Wheat Yield in the Conterminous United States. Remote Sens. 2020, 12, 1232. [Google Scholar] [CrossRef]
  68. Duan, T.; Chapman, S.C.; Guo, Y.; Zheng, B. Dynamic Monitoring of NDVI in Wheat Agronomy and Breeding Trials Using an Unmanned Aerial Vehicle. Field Crops Res. 2017, 210, 71–80. [Google Scholar] [CrossRef]
  69. Farooq, M.; Hussain, M.; Ul-Allah, S.; Siddique, K.H.M. Physiological and Agronomic Approaches for Improving Water-Use Efficiency in Crop Plants. Agric. Water Manag. 2019, 219, 95–108. [Google Scholar] [CrossRef]
  70. Jha, P.; Kumar, V.; Godara, R.K.; Chauhan, B.S. Weed Management Using Crop Competition in the United States: A Review. Crop Prot. 2017, 95, 31–37. [Google Scholar] [CrossRef]
  71. Kristensen, L.; Olsen, J.; Weiner, J. Crop Density, Sowing Pattern, and Nitrogen Fertilization Effects on Weed Suppression and Yield in Spring Wheat. Weed Sci. 2008, 56, 97–102. [Google Scholar] [CrossRef]
  72. Chalise, D.P.; Snider, J.L.; Virk, G. Assessing the Effects of Cultivar and Nitrogen Application Rate on Seedling Vigor and Early-Season Canopy Growth in Cotton. Agron. J. 2023, 115, 713–725. [Google Scholar] [CrossRef]
  73. Li, S.; Li, Z.; Bi, X.; Feng, B.; Wang, Z.; Wang, F.; Si, J.; Shi, J.; Liu, K. Nitrogen Fertilizer Management on Wheat Yield and Nitrogen Utilization. J. Plant Nutr. 2022, 45, 1953–1960. [Google Scholar] [CrossRef]
  74. Moussavi-Nik, M.; Pearson, J.N.; Hollamby, G.J.; Graham, R.D. Dynamics of Nutrient Remobilization during Germination and Early Seedling Development in Wheat. J. Plant Nutr. 1998, 21, 421–434. [Google Scholar] [CrossRef]
  75. Maresma, Á.; Ariza, M.; Martínez, E.; Lloveras, J.; Martínez-Casasnovas, J. Analysis of Vegetation Indices to Determine Nitrogen Application and Yield Prediction in Maize (Zea mays L.) from a Standard UAV Service. Remote Sens. 2016, 8, 973. [Google Scholar] [CrossRef]
  76. Jin, X.; Liu, S.; Baret, F.; Hemerlé, M.; Comar, A. Estimates of Plant Density of Wheat Crops at Emergence from Very Low Altitude UAV Imagery. Remote Sens. Environ. 2017, 198, 105–114. [Google Scholar] [CrossRef]
  77. Liu, T.; Li, R.; Jin, X.; Ding, J.; Zhu, X.; Sun, C.; Guo, W. Evaluation of Seed Emergence Uniformity of Mechanically Sown Wheat with UAV RGB Imagery. Remote Sens. 2017, 9, 1241. [Google Scholar] [CrossRef]
  78. Wilke, N.; Siegmann, B.; Postma, J.A.; Muller, O.; Krieger, V.; Pude, R.; Rascher, U. Assessment of Plant Density for Barley and Wheat Using UAV Multispectral Imagery for High-Throughput Field Phenotyping. Comput. Electron. Agric. 2021, 189, 106380. [Google Scholar] [CrossRef]
  79. Deery, D.M.; Smith, D.J.; Davy, R.; Jimenez-Berni, J.A.; Rebetzke, G.J.; James, R.A. Impact of Varying Light and Dew on Ground Cover Estimates from Active NDVI, RGB, and LiDAR. Plant Phenomics 2021, 2021, 9842178. [Google Scholar] [CrossRef] [PubMed]
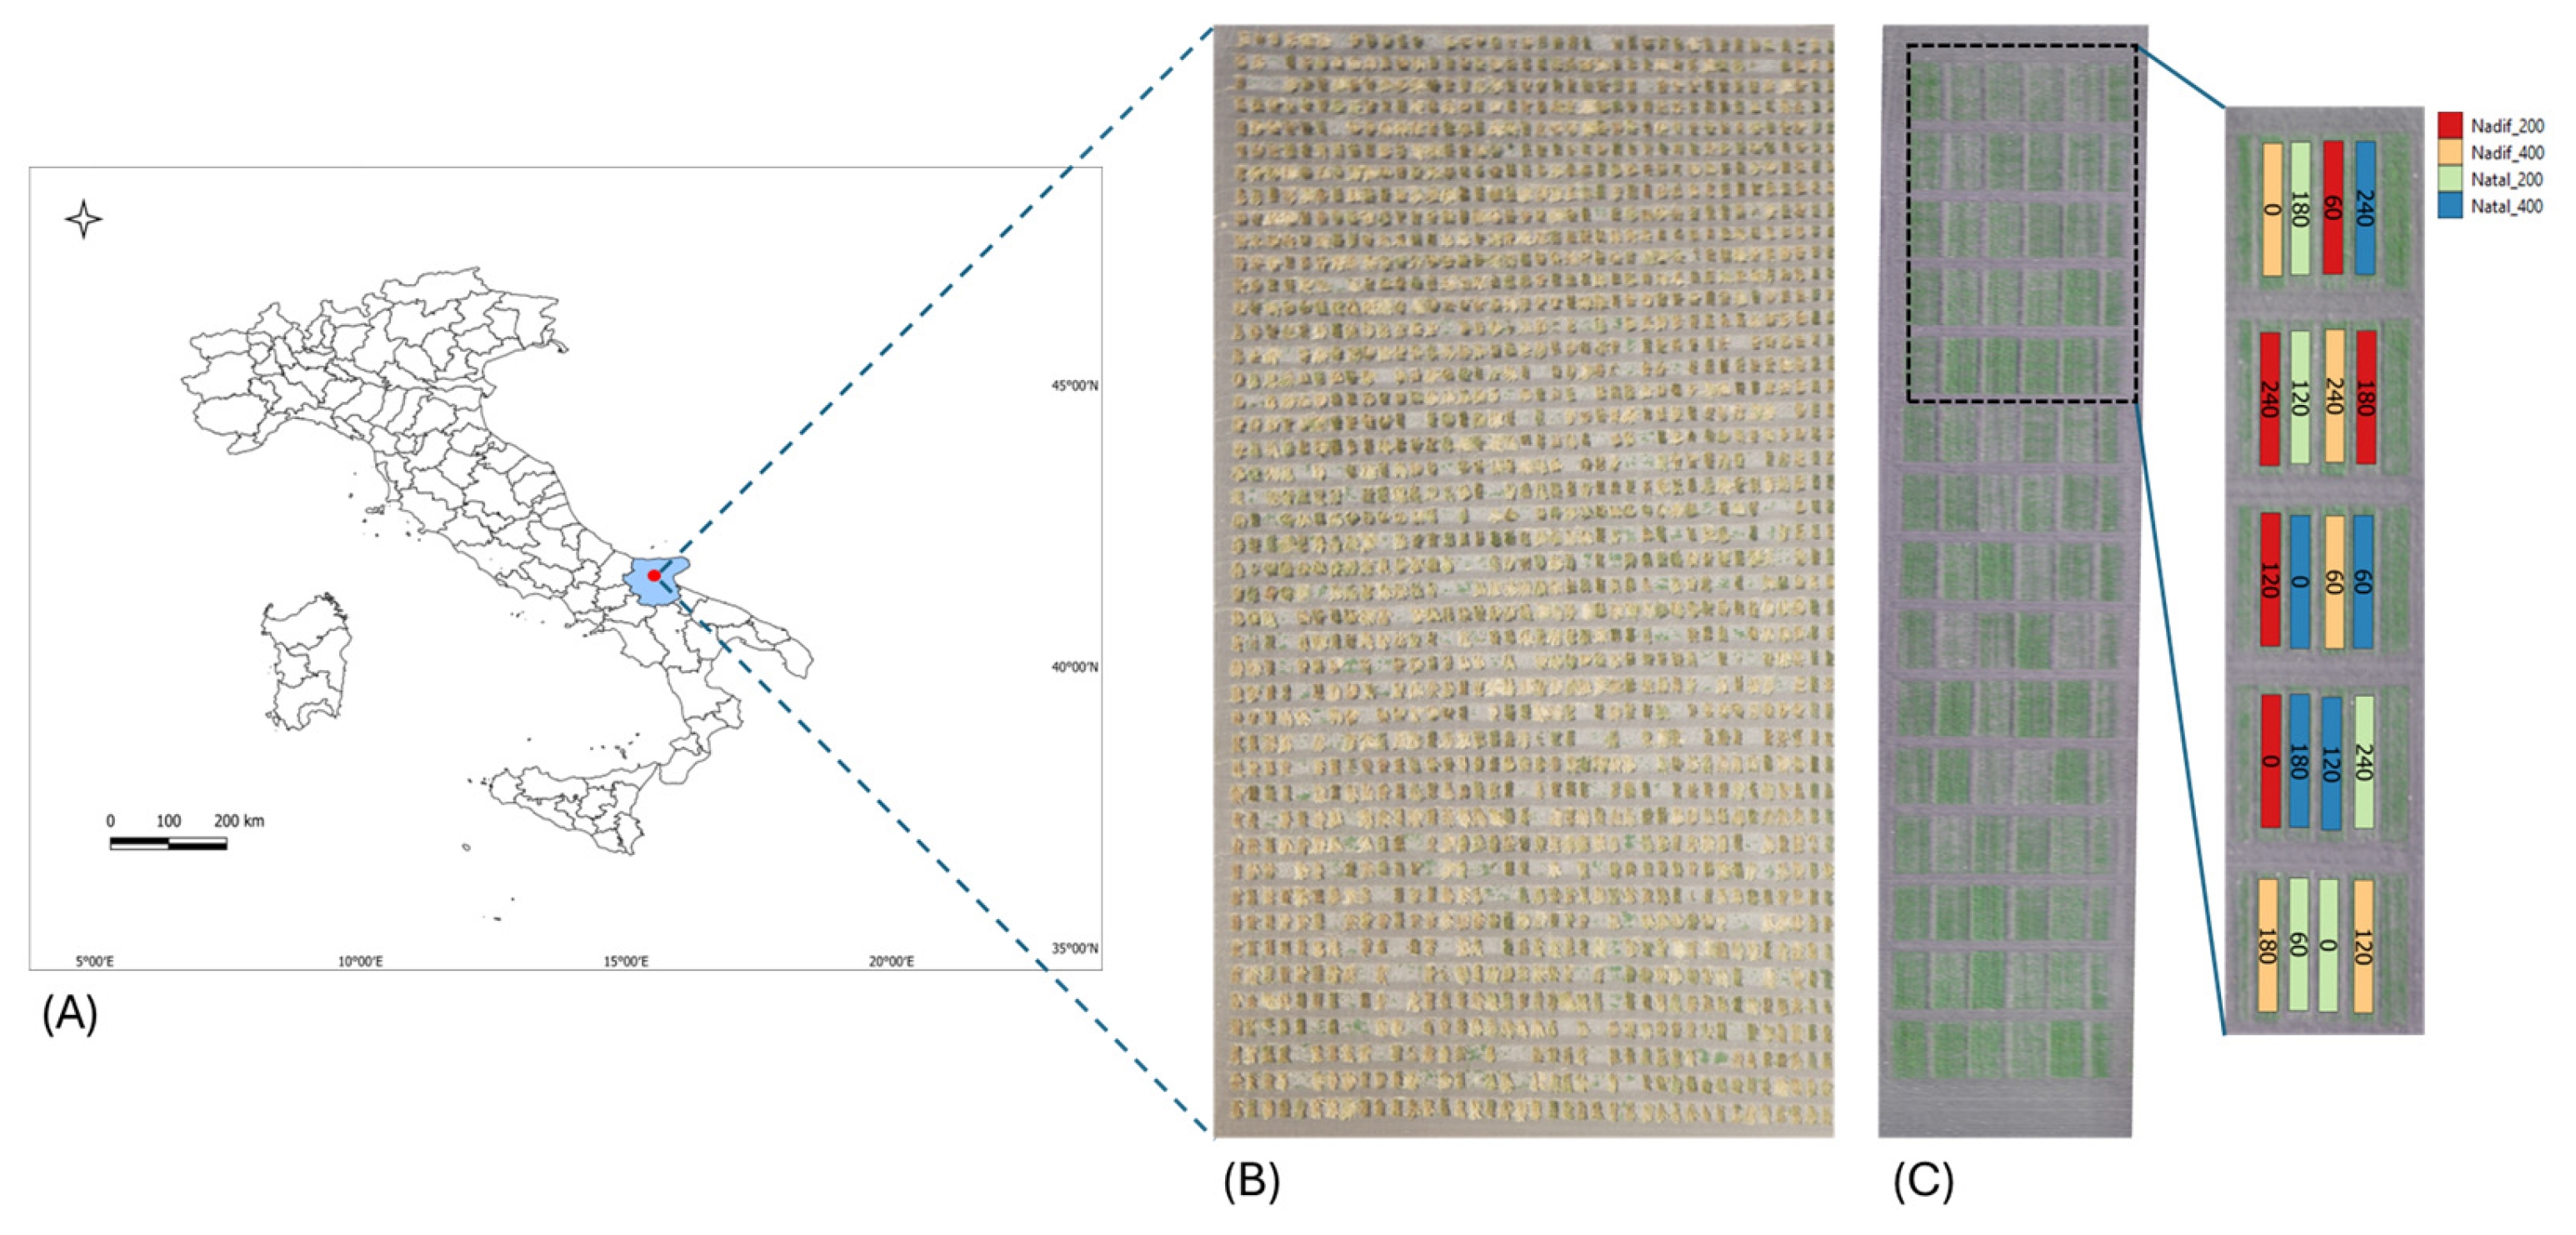
Figure 1. Overview of trial and experimental fields. (A) Geographical location of the trial site in Foggia, Italy (41°27′44.9″ N 15°30′03.9″ E). (B) Orthomosaic image of the varietal experiment. (C) Orthomosaic image of the agronomic experiment, with the detail of N treatments (labels) and Genotype and Sowing Rate (colors).
Crops 05 00085 g001
Figure 2. Frequency distributions and simple correlations for grain yield (GY), heading date (HD), and plant height (PH) traits recorded in the 2015–2016 growing season. Asterisks indicate the significance level of the Pearson correlation coefficient: p < 0.001.
Crops 05 00085 g002
Figure 3. Boxplots showing the distribution of all Vis values (CSI, Crop Senescence Index; GA, Green Area Index; GGA, Greener Green Area Index; NGRDI, Normalized Green–Red Difference Index; and TGI, Triangular Greenness Index) derived from the images recorded across the 4 growth phenological stages in 2015–2016 growing season. The two selected varieties (Natal and Nadif) are highlighted in each boxplot.
Crops 05 00085 g003
Figure 4. PCA obtained using all the VIs recorded in Exp. 1. The black dots indicate the durum wheat panel; the blue arrows indicate the vegetation indices. The two varieties selected in Exp. 1, Natal and Nadif, are shown in blue and red, respectively.
Crops 05 00085 g004
Figure 5. Line plot of Eta squared values (η2) for each flight calculated for three study-years on varieties, sowing rate, and N doses. 95% confidence intervals for η2 values, computed using bootstrap resampling are visualized as shaded areas around η2 lines (red= density, blue= fertilization, green= genotype).
Crops 05 00085 g005
Figure 6. PCA for the main sources of variation and agronomic traits (A), GA index (B), GGA (C), CSI (D), NGRDI (E), and TGI (F). The number after each RGB-derived vegetation index indicates the growth stage (GS) at which it was recorded: 1 = GS23; 2 = GS29; 3 = GS31; 4 = GS45, and 5 = GS65.
Crops 05 00085 g006
Table 1. Date of flights, phenological stage for each experimental trial.
TrialYearSowing DateDay of FlightPhenological
Growth Stage
Zadoks
Growth Scale (GS)
[53]
Exp. 12015–201615 December 20159 March 2016Tillering25
23 March 2016Stem Elongation31
10 April 2016Booting45
4 May 2016Late Flowering69
Exp. 22016–201713 December 201615 February 2017Early Tillering23
2 March 2017Late Tillering29
16 March 2017Stem Elongation31
5 April 2017Booting45
2 May 2017Flowering65
2017–201811 December 201716 February 2018Early Tillering23
1 March 2018Late Tillering29
14 March 2018Stem Elongation31
29 March 2018Booting45
25 April 2018Heading55
2018–201914 December 201819 February 2019Early Tillering23
28 February 2019Late Tillering29
13 March 2019Stem Elongation
1st node detectable
31
18 March 2019Stem Elongation
2nd node detectable
32
Table 2. List of RGB-derived vegetation indices used in this study.
Spectral IndexEquationReference
Green Area (GA)60° < Hue < 180°[58]
Greeness Area (GGA)80° < Hue < 180°[58]
Crop Senescence Index (CSI)100 × (GA − GGA)/GA[59]
Normalized Green
Red Difference Index (NGRDI)
(Green − Red)/(Green + Red)[60]
Triangular Green Index (TGI)−0.5 [190 (Red − Green) − 120 (Red − Blue)][61]
Table 3. Analysis of Variance (ANOVA) results for RGB-derived vegetation indices (VIs) across five growth stages under varying factors: genotype, sowing rate, and nitrogen (N) doses.
VIsGenotype Sowing Rate N Dose
GS23GS29GS31GS45GS65 GS23GS29GS31GS45GS65 GS23GS29GS31GS45GS65
GA ** (0.48) ** (−1.08) *** (−0.15)*** (−0.18)
GGA ** (−0.71) *** (−0.46)*** (−0.43)
CSI ** (0.21)*** (0.61)*** (0.24)
NGRDI** (−0.55)** (0.31)*** (0.45)*** (0.80) ** (−0.44)*** (−0.93) *** (−0.32)*** (−0.58)
TGI*** (−0.34*** (0.25)*** (0.80)*** (0.23)*** (0.10) ** (−0.59)*** (−1.06)*** (−0.30)*** (−0.29)
Significant interactions are shown across growth stages (GS) for each source of variation: *, **, ***, and empty cells, respectively, indicate significance levels at p-values of 0.05, 0.01, 0.001, and not significant. The numbers in brackets indicate Hedges’ g. The vegetation indices analyzed include Green Area (GA), Greener Green Area (GGA), Crop Senescence Index (CSI), Normalized Green–Red Difference Index (NGRDI), and Triangular Greenness Index (TGI).
Disclaimer/Publisher’s Note: The statements, opinions and data contained in all publications are solely those of the individual author(s) and contributor(s) and not of MDPI and/or the editor(s). MDPI and/or the editor(s) disclaim responsibility for any injury to people or property resulting from any ideas, methods, instructions or products referred to in the content.