1. Introduction
With the increasing global demand for food, one of the major challenges in agriculture is achieving sustainable production across the environmental, social, and economic dimensions [
1]. Addressing this challenge requires the development of technologies that assist market agents in making timely and well-informed decisions. These technologies must provide accurate, reliable and comprehensive information that reflects the complexity of the agricultural environment throughout the entire production cycle, from sowing to harvest [
2].
Brazil encompasses a vast territorial area characterized by highly heterogeneous soils with diverse classifications. Although this variability is routinely considered in soil correction and fertilization practices, it is rarely considered when determining the optimal soybean plant population [
3,
4]. Similarly to fertilizers, seeds represent a high value-added input, and optimizing their use can reduce production costs while enhancing the overall profitability and attractiveness of soybean cultivation [
5,
6].
The number of plants per unit area directly influences intraspecific competition, affecting the availability of environmental resources and, consequently, plant phenology and productivity. Recommendations for optimal plant populations have been revised over time in response to genetic, anatomical, and biochemical improvements in cultivars, as well as advances in management practices [
7].
For soybeans, a quantitative short-day species, intraspecific competition is particularly critical, as its reproductive development is highly sensitive to both photoperiod and light quality. Under high plant density, mutual shading intensifies the competition for photosynthetically active radiation, triggering morphological responses typical of etiolation, such as excessive stem elongation. Although this adaptation enhances light capture in the canopy, it simultaneously increases the risk of lodging and leads to an imbalance in assimilate allocation, favoring vegetative over root growth and, consequently, reducing grain yield [
8].
Recommendations for seeding populations are typically provided by plant breeders. However, these guidelines are often generalized and do not account for soil variability [
4]. Currently, adopting a uniform plant population across an entire area has not consistently achieved the expected yield levels, as yield potential is strongly influenced by microregional conditions. More specific recommendations must therefore consider additional factors such as climate, production investment level, and soil characteristics [
9].
In precision agriculture, variable rate seeding (VRS) is often implemented with the premise that increasing seeding density in low-fertility zones can compensate for resource limitations, thereby optimizing the use of inputs and maximizing productivity [
10]. According to Melo et al. [
11], management zones can be delineated using multiple data sources, including yield maps, soil and topographic attributes, vegetation indices, and soil electrical conductivity. Baio et al. [
12] reported that reducing plant populations in high fertility areas can potentially increase yields by approximately 10%, while simultaneously lowering production costs. However, the effectiveness of this strategy remains uncertain, as it does not consider the potential intensification in intraspecific competition for already limited resources, such as water and nutrients. Such competition can negatively affect the productive potential of individual plant, a factor rarely quantified in VRS studies that focus on soil-specific limiting factors.
The nutrients found in the soil solution are essential for healthy plant development and are critical, along with other factors, for achieving maximum productivity [
13]. Liebig, a chemist renowned for formulating the law of the minimum, demonstrated that crop production potential is determined by the availability of all essential elements at optimal levels, since a given nutrient in limiting conditions restricts overall productivity [
14].
Few studies have examined the application of the Law of the Minimum to define management zones at varying seeding rates [
12]. According to the same author, it is essential to identify the factors limiting crop productivity within a given field and to use their spatial variability to adjust plant populations accordingly.
Thus, the primary objective of this study is to investigate and identify the optimal soybean population in areas of low-yield potential, an issue that has not been well elucidated in previous studies. This approach aims to provide a data-driven strategy for adjusting soybean seeding rates specifically within low-fertility zones [
4,
10,
12]. The conventional VRS strategy, previously mentioned, is often implemented based on a rationale of compensation: practitioners increase seeding rates in low-fertility zones assuming this will offset the lower emergence rates or reduced individual plant vigor expected in poor soil, with the primary goal of achieving a target final plant stand.
The hypothesis of this study posits that this compensation strategy is fundamentally counterproductive. We argue that this added density does not merely ensure a final stand; it critically intensifies the intraspecific competition for the very resources (light, water, and nutrients) that are already limiting. This added stress is expected to trigger the negative morphological trade-offs previously described—such as etiolation and reduced root biomass—thereby compromising reproductive development and, ultimately, reducing grain yield.
Thus, the objective of this study was to determine the optimal seeding strategy for variable-rate soybean sowing by evaluating the agronomic and physiological effects of contrasting plant population densities, with particular emphasis on the management of low fertility zones identified based on the most limiting nutrient.
2. Materials and Methods
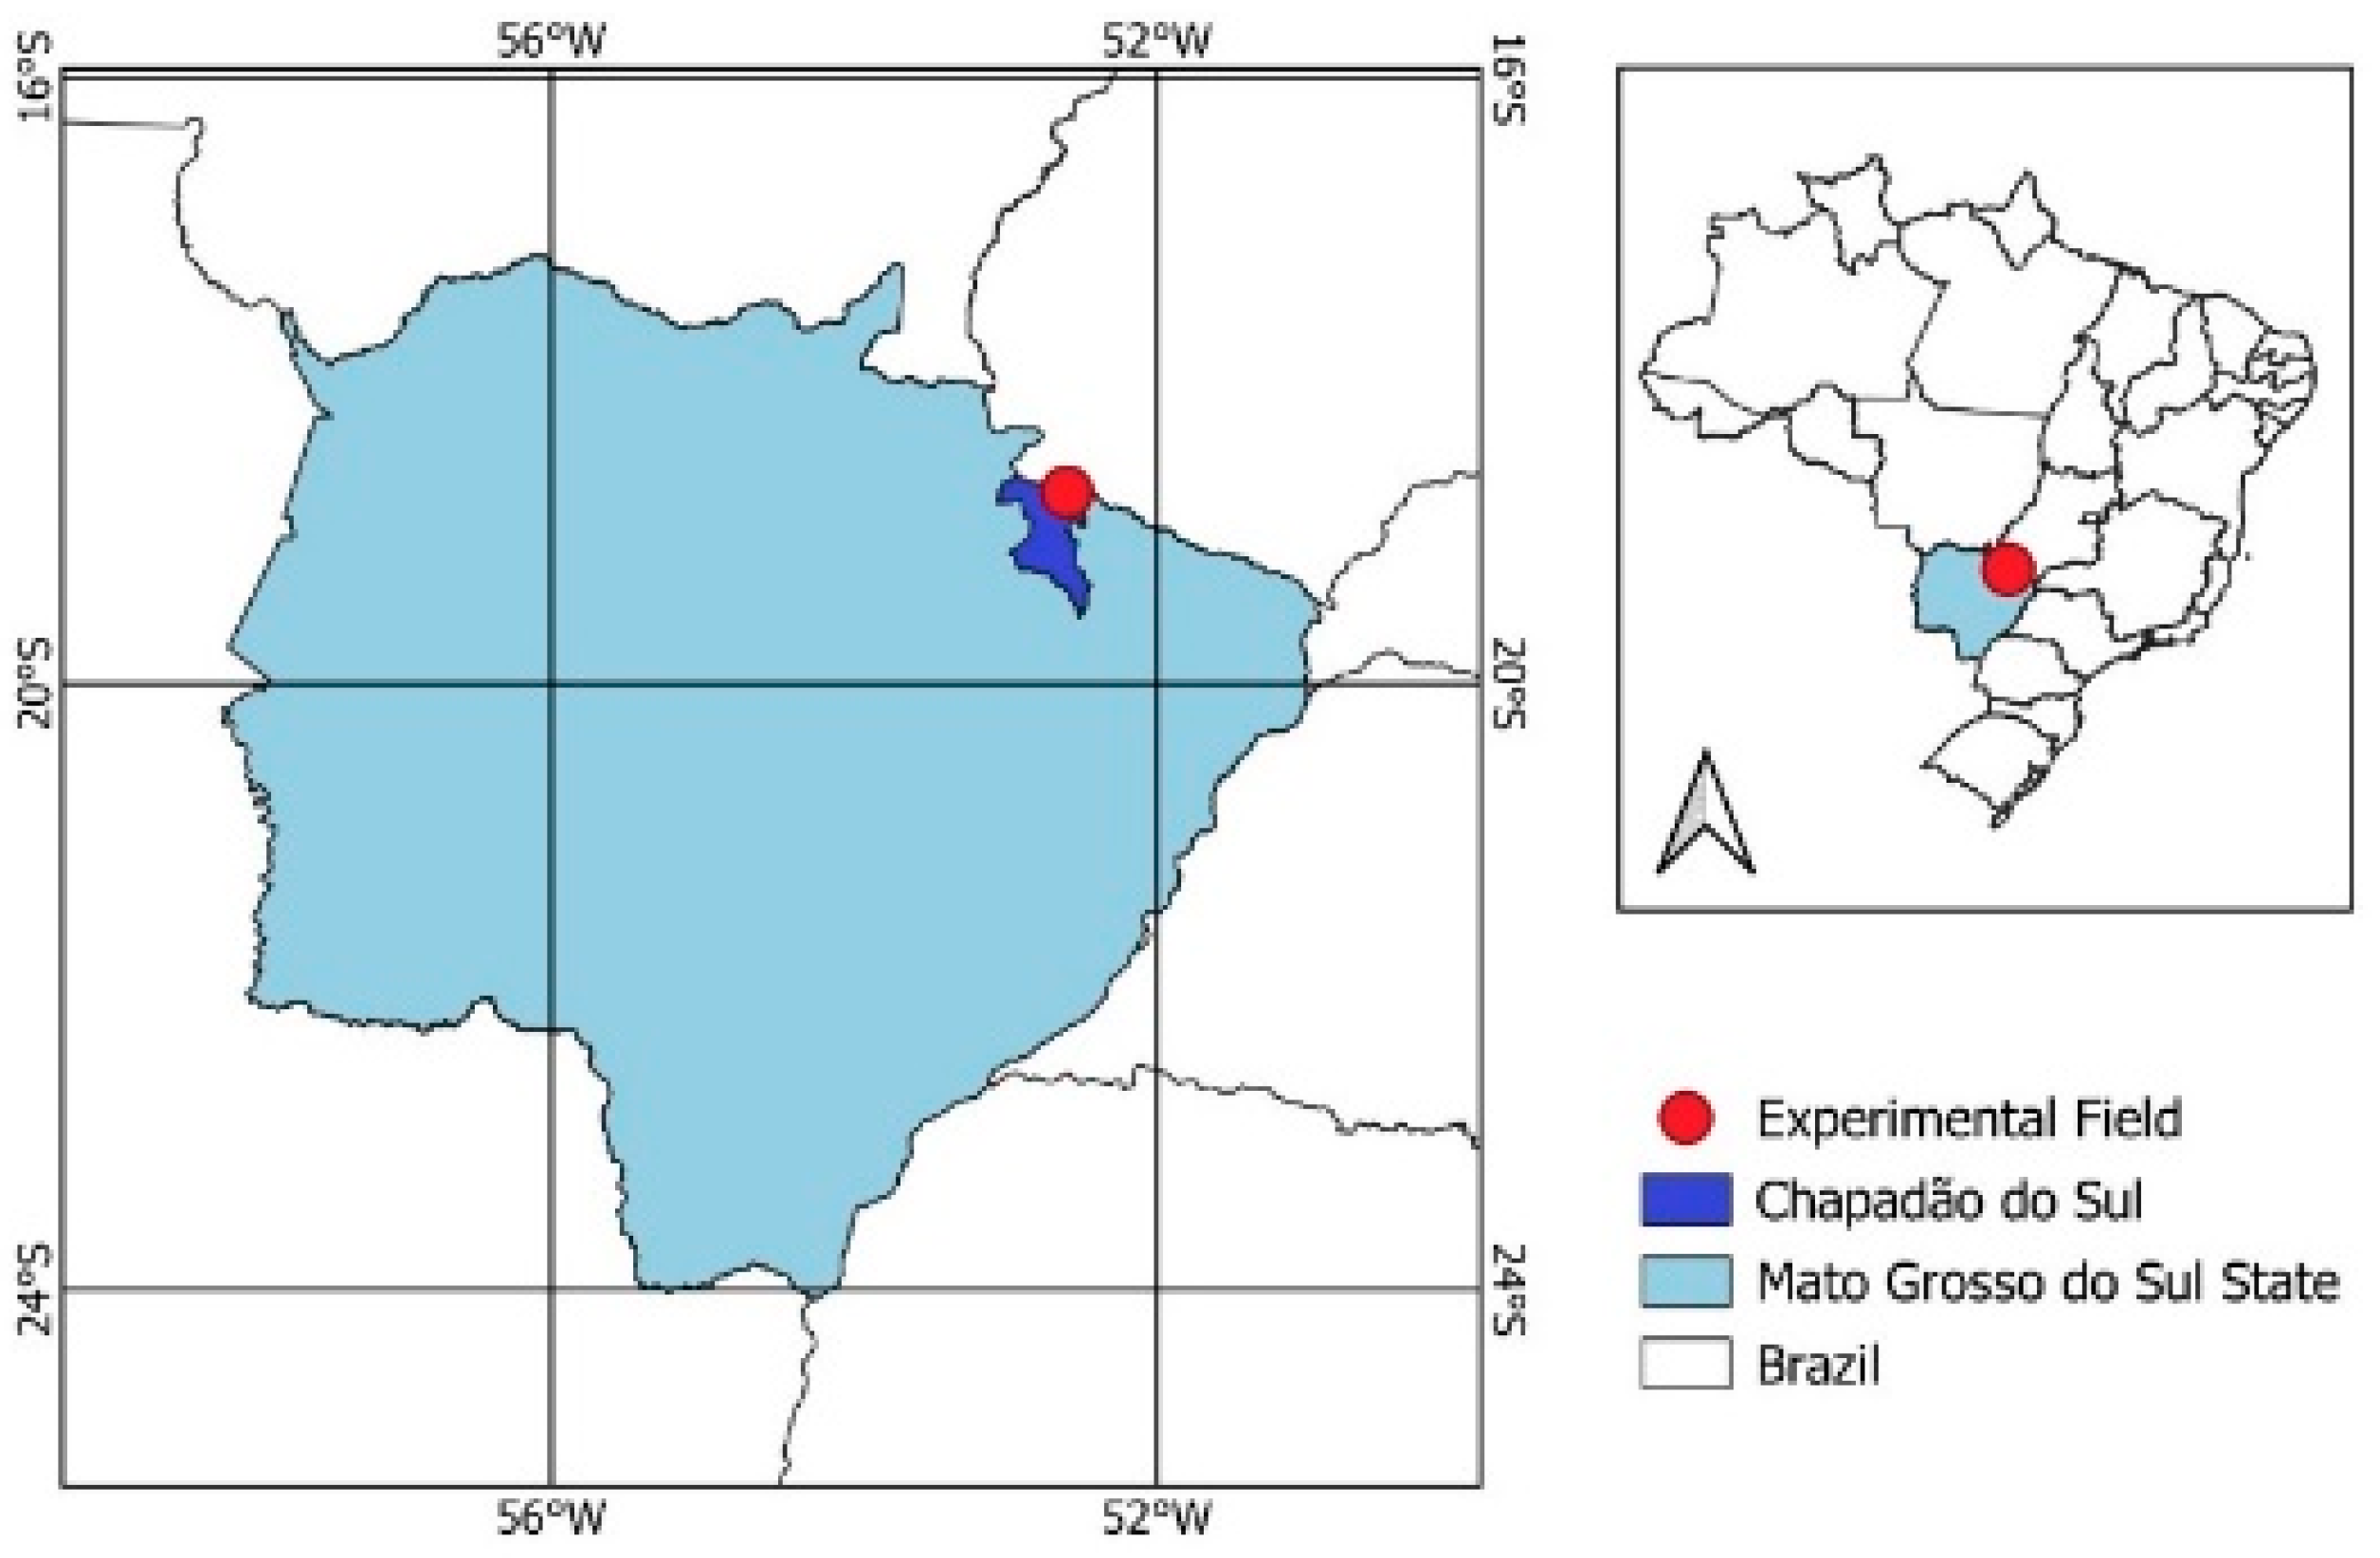
This study was conducted during the 2024/2025 harvest at the Federal University of Mato Grosso do Sul, in Chapadão do Sul, Mato Grosso do Sul, MS, Brazil (18°46′49″ S and 52°38′51″ W, altitude of 810 m) (
Figure 1). The soil at the site was classified as a Red-Yellow Latosol [
15], a typical feature of Cerrado soils, characterized by advanced weathering and low clay activity [
16]. In the experimental area, the soil texture is clayey, with clay content ranging from 415 to 490 g kg
−1. The area trial was established in October 2024, within the recommended period for genetic material collection. The experiment was conducted in two side-by-side areas of 1 ha each.
The local climate is classified as humid tropical, characterized by a rainy summer and a dry winter, with an average annual temperature of 25 °C and annual precipitation of 1600–1800 mm [
17]. During the experimental period, no adverse weather events or water limitation occurred that could have affected crop development.
2.1. Characterization of the Experimental Area
The physical and chemical properties of the soil were characterized by point sampling, in which eight subsamples were collected and combined to form a composite sample. Sampling followed a predefined 20 m × 20 m grid at a depth of 0–0.2 m. The evaluated attributes included clay content, macronutrients (Ca, Mg, and K were extracted using the ion-exchange resin method), pH (determined in a 0.01 M CaCl
2 solution), cation exchange capacity (CEC), and base saturation (V%), with a target level of 55%. The need for soil amendments and fertilizers was determined based on the expected yield of 4500 kg ha
−1 [
9]. The experimental area was cultivated under a minimum tillage system.
Potassium was identified as the most limiting nutrient, exhibiting the largest negative percentage discrepancy (−55.97%) between its measured soil content and the level considered suitable for soybean cultivation (
Table 1). This result made its spatial variability the key factor for generating the VRS prescription map [
18]. Among the analyzed nutrients, potassium showed the lowest relative adequacy in relation to crop requirements. Accordingly, spatial variability was observed not only in soil K levels, but also in cation exchange capacity (CEC) [
10,
12].
The spatial variability of these attributes was used to support recommendations for soybean population adjustment. In the management zone with low potassium (K) availability and reduced cation exchange capacity (CEC), two planting densities were evaluated: medium and high. This subdivision within the low-fertility zone was established to identify the most suitable population level under these conditions. Below, in
Figure 2, are the spatial distribution maps used to develop the seeding prescription map.
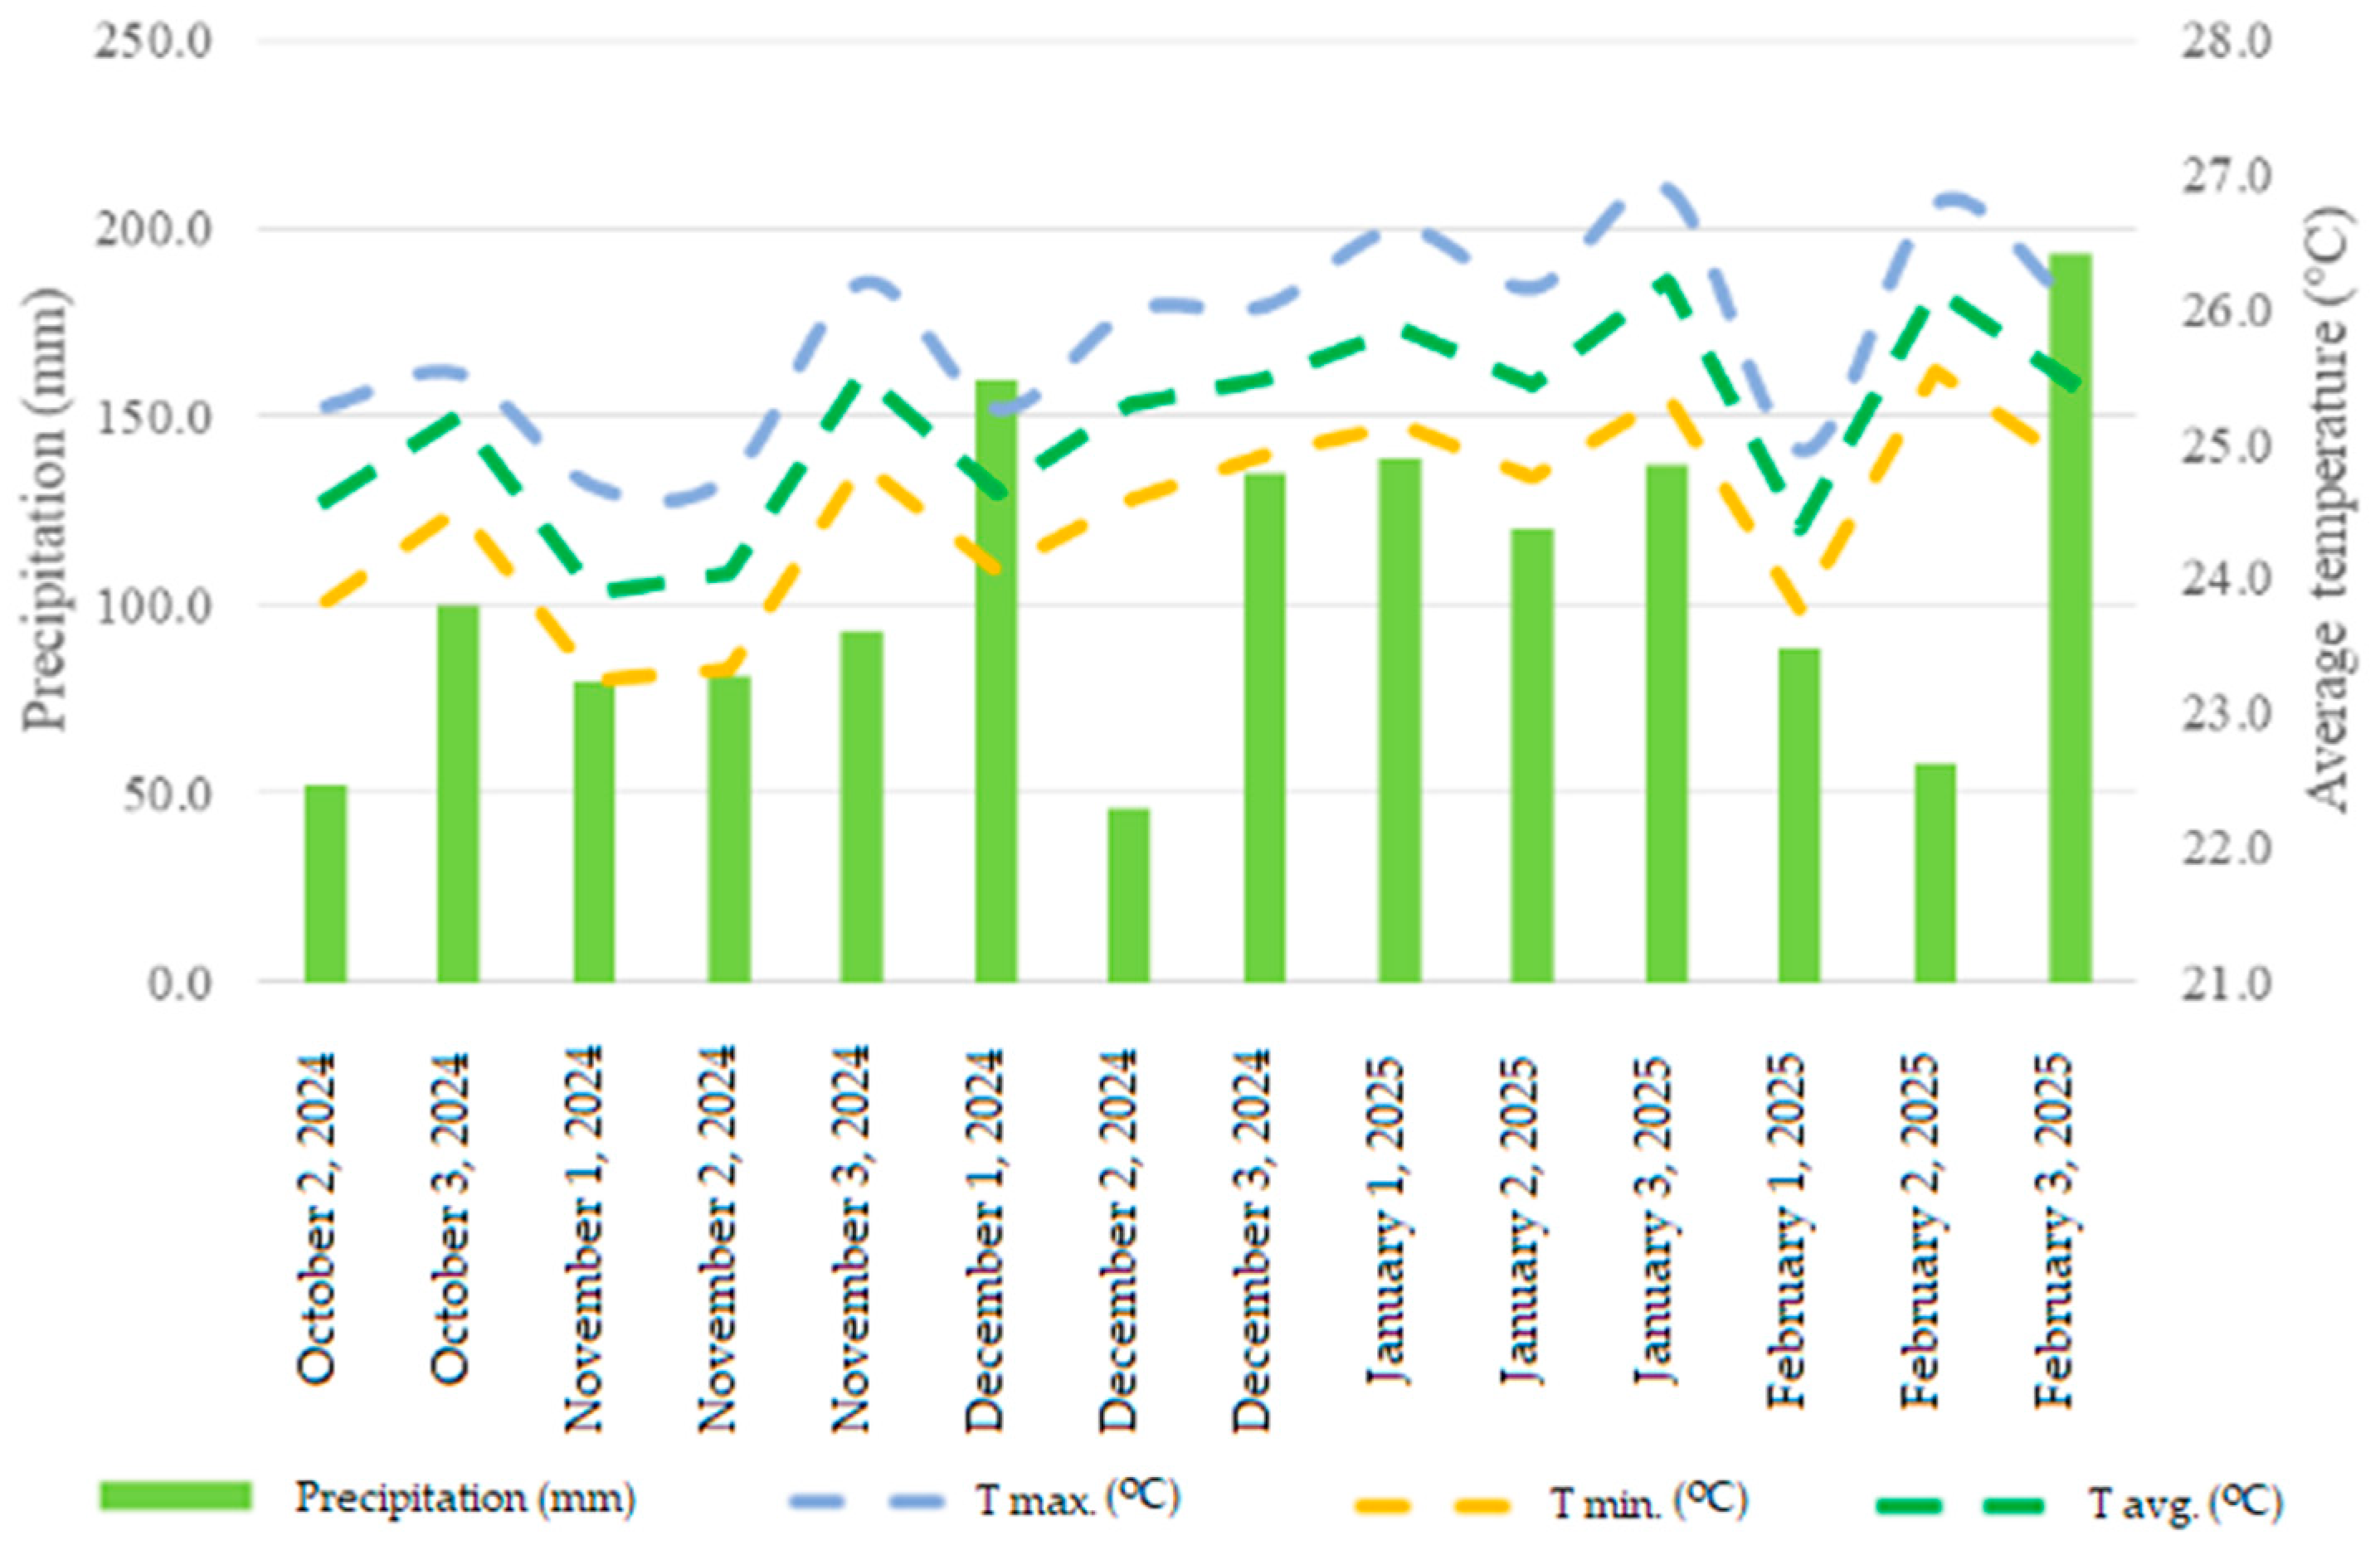
The meteorological characteristics of this harvest were obtained through an automated station of the National Institute of Meteorology (INMET), located in Chapadão do Sul, Mato Grosso do Sul. The precipitation regime was favorable for the crop development, with accumulations exceeding 50 mm per ten-day period. Below, in
Figure 3, are the climate data during the crop season.
2.2. Experimental Design
The experiment was conducted in a randomized block design with four treatments. The 1-ha experimental area was sown with variable plant densities using VRS. The soybean cultivar used was Soy Combate IPRO (GNS 7400 IPRO), which belongs to maturity group 7.4 and exhibits indeterminate growth [
19]. Different plant populations were established in each management zone, defined according to the spatial variability of K and CEC levels.
The experiment was designed to test the central hypothesis regarding intraspecific competition in nutrient-limited zones. Four treatments were established, with 10 georeferenced sampling points (replicates) per treatment:
- -
Low (200,000 seeds ha−1 in High-Fertility Zone): This treatment served as a baseline to evaluate crop performance with a reduced population under optimal soil conditions (High K and CEC).
- -
Mean (240,000 seeds ha−1 in Medium-Fertility Zone): This treatment represented the standard recommended population for the cultivar, serving as the control.
- -
H_Mean (240,000 seeds ha−1 in Low-Fertility Zone): This treatment was designed to evaluate the performance of the standard recommended population under nutrient-limited conditions (Low K and CEC).
- -
High (280,000 seeds ha−1 in Low-Fertility Zone): This treatment directly tested the study’s main hypothesis by implementing the conventional VRT strategy (increasing population) in the most nutrient-stressed zone (Low K and CEC).
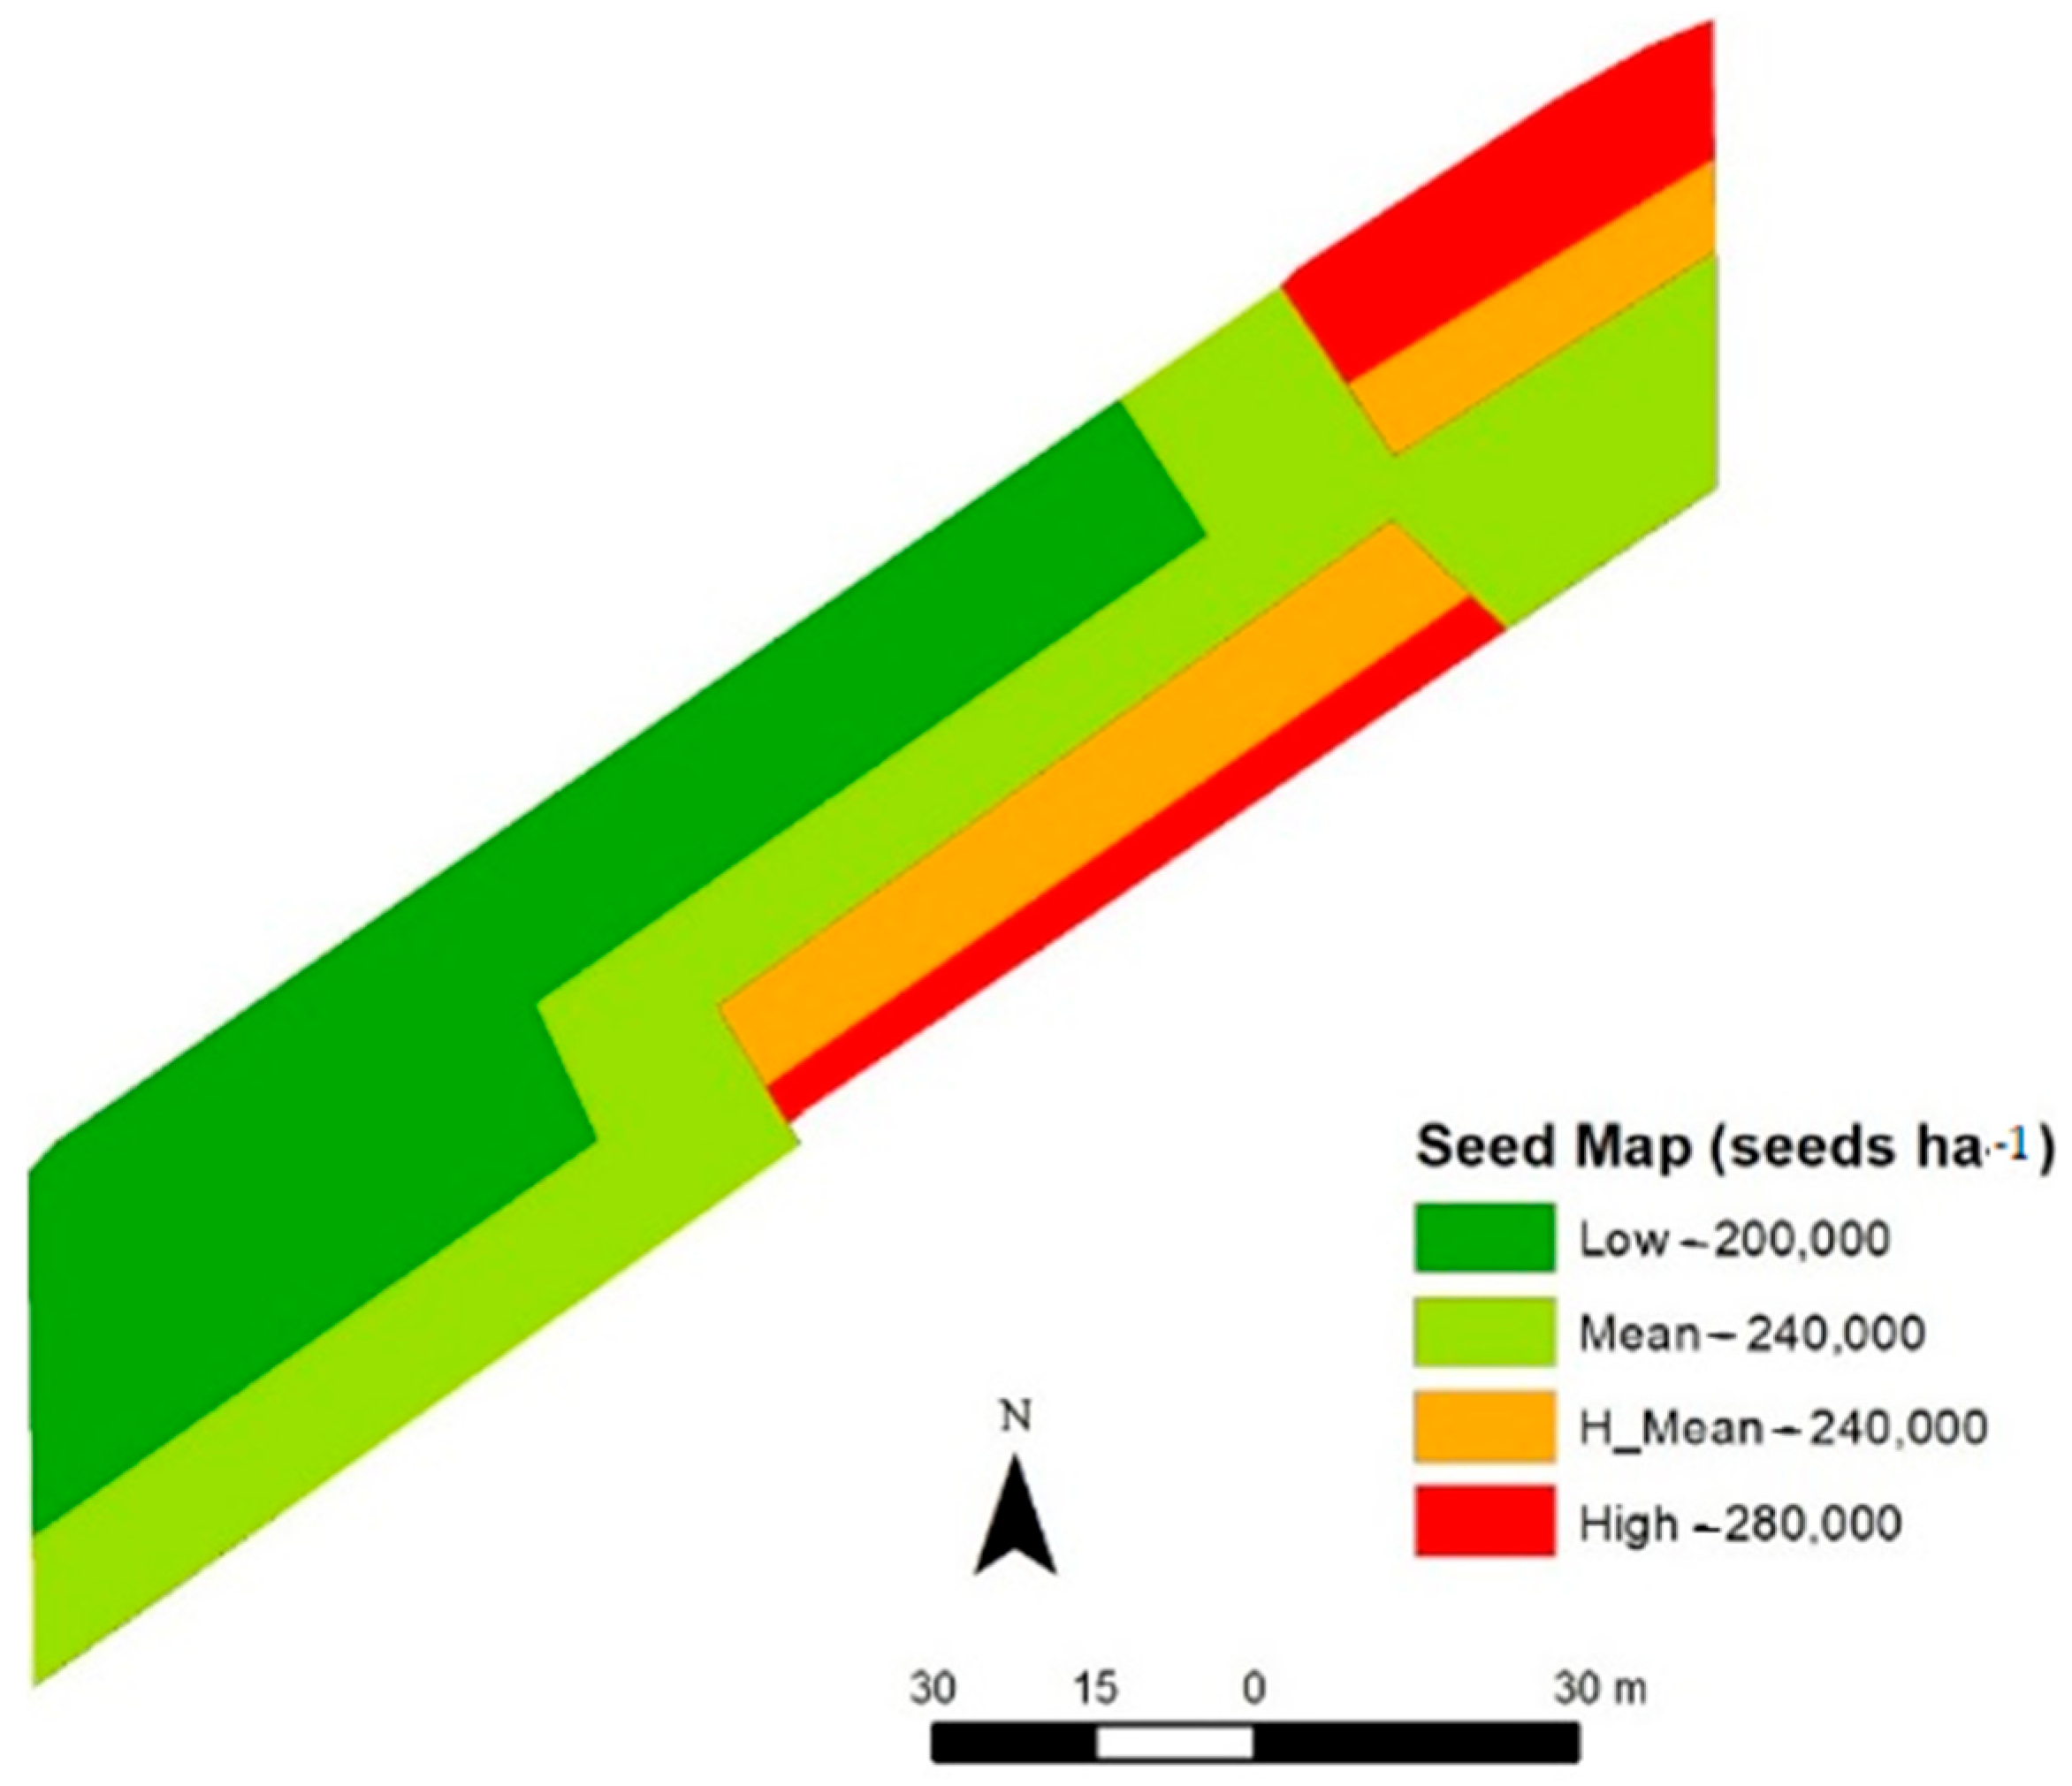
This design allowed for a direct comparison between the standard (H_Mean) and high-density (High) populations within the same low-fertility zone, providing the primary contrast to test our hypothesis.
Figure 4 shows the seed population prescription map.
Limestone was applied in October at the recommended rate of 1000 kg ha
−1, aiming to increase base saturation to 55% [
16]. Base fertilization at sowing was performed using an NPK fertilizer (00-25-15) at a rate of 300 kg ha
−1, applied directly in the furrow by the seeder. Sowing was conducted with a Jumil pop seeder equipped with a vertical vacuum seed meter and a row spacing of 0.5 m. The seeder’s transmission ratios were adjusted for each management zone to achieve the target plant population.
At the V4 phenological stage, 100 kg ha
−1 potassium chloride (60% K) was applied as top-dressing [
19]. Other phytosanitary treatments were applied as needed, based on pests and diseases monitoring, following regional management practices.
2.3. Data Collection and Measurements
Plant population was evaluated 10 days after emergence (DAE), corresponding to the V2 vegetative stage of soybean [
19], to determine the actual number of germinated plants. Root samples were collected at the R5 reproductive stage by carefully digging between rows to preserve root integrity. Collected roots were washed through a fine-mesh sieve to avoid loss of fine roots and subsequently weighed. The roots were placed in paper bags and dried in a forced-ventilation oven at 105 °C for 24 h. They were then weighed using a digital scale with a precision of four decimal places. This procedure enabled the assessment of root system development across different plant populations and the evaluation of potential intraspecific competition. Vegetation indices were measured at two crop phenological stages, V8 and R5, using a multispectral camera installed on a SenseFly eBee RTK remotely piloted aircraft (RPA; SenseFly SA, Lausanne, Switzerland). This approach allowed the assessment of crop health and development across the variable population environment. Flights were conducted at 10:00 a.m. local time under full daylight conditions, at an altitude of 75 m, providing a spatial resolution of 0.08 m. The RPA, equipped with a Parrot Sequoia multispectral camera (Parrot SA, Paris, France), captured images for the analysis of crop biomass and its association with other phenological measurements. The images acquired by the RPA were radiometrically corrected using a standardized reflective plate. Orthorectification was performed with Pix4D software (version 4.1.22). Multispectral reflectance images were acquired in the green (550 nm ± 40 nm), red (660 nm ± 40 nm), red-edge (735 nm ± 10 nm) and near-infrared (NIR, 790 nm ± 40 nm) bands, enabling the calculation of vegetation indices (VI) commonly used in crop monitoring, including NDVI, SAVI, NDRE [
20,
21]. Maps were generated through interpolation using the inverse distance squared method.
Physiological variables related to gas exchange were measured on the first fully expanded leaf using an Infrared Gas Analyzer (IRGA, model Li6400XT, LiCor Inc., Lincoln, NE, USA). Measurements were conducted between 8:00 a.m. and 10:00 a.m. on cloudless days, at a temperature of 26 °C and relative humidity of 70–80%.
Harvesting was performed manually at the same georeferenced sampling points used for previous evaluations. Productivity was determined by harvesting plants from plots consisting of four 3 m long rows. Plant height and first pod insertion height were measured from the soil surface using a tape measure. Threshed samples were weighed and adjusted to 13% moisture content. Collected data were processed, normalized, and interpolated to generate spatial maps.
2.4. Statistical Analysis
All data were analyzed using ANOVA for the experiment’s randomized block design. Prior to analysis, the data were checked for the assumptions of ANOVA, including the normality of residuals (Shapiro–Wilk test) and the homogeneity of variances (Bartlett’s test). When the ANOVA F-test indicated significant differences among treatments (
p < 0.05), Duncan’s mean comparison test was applied at a 5% probability level to separate the means. Pearson’s correlation coefficient was calculated to visualize interactions between variables, and multivariate canonical variable analysis (CVA) was conducted to evaluate the interrelationships among the full set of variables and treatments. All analyses were performed using Rbio software (v.17) [
22,
23].
3. Results
Analysis of variance (
Table 2) indicated that the different soybean population density strategies, applied through VRS, resulted in statistically significant effects (
p < 0.05) on all evaluated agronomic, physiological, and remote sensing variables. This finding is crucial because it validates that the variation in seeding density among management zones influenced crop performance. Additionally, the coefficients of variation (CV) for most key variables, such as plant height (2.59%), NDVI (3.43%), and grain yield (9.03%), were low to moderate, indicating high experimental precision and reliability of the collected data.
The spatial variability maps (
Figure 5) illustrate the central findings regarding yield and key agronomic traits. Crucially,
Figure 5(A2) demonstrates that increasing the plant population within the low-fertility zone (High treatment) resulted in significantly lower average yields compared to the medium-population zones (Mean and H_Mean zones). The mechanism for this yield loss is evident in
Figure 5(B2), which shows that plants in the high-population zone were significantly taller than those in the medium-population zones. This response indicates that the intensified intraspecific competition forced a resource allocation shift toward the vegetative cycle (i.e., etiolation) at the expense of reproductive development. The first pod insertion height (
Figure 5(C2)) followed a similar pattern, reinforcing that competition induced greater plant stretching. The low-population zone, facing the least competition, exhibited the lowest average plant height and first pod insertion height.
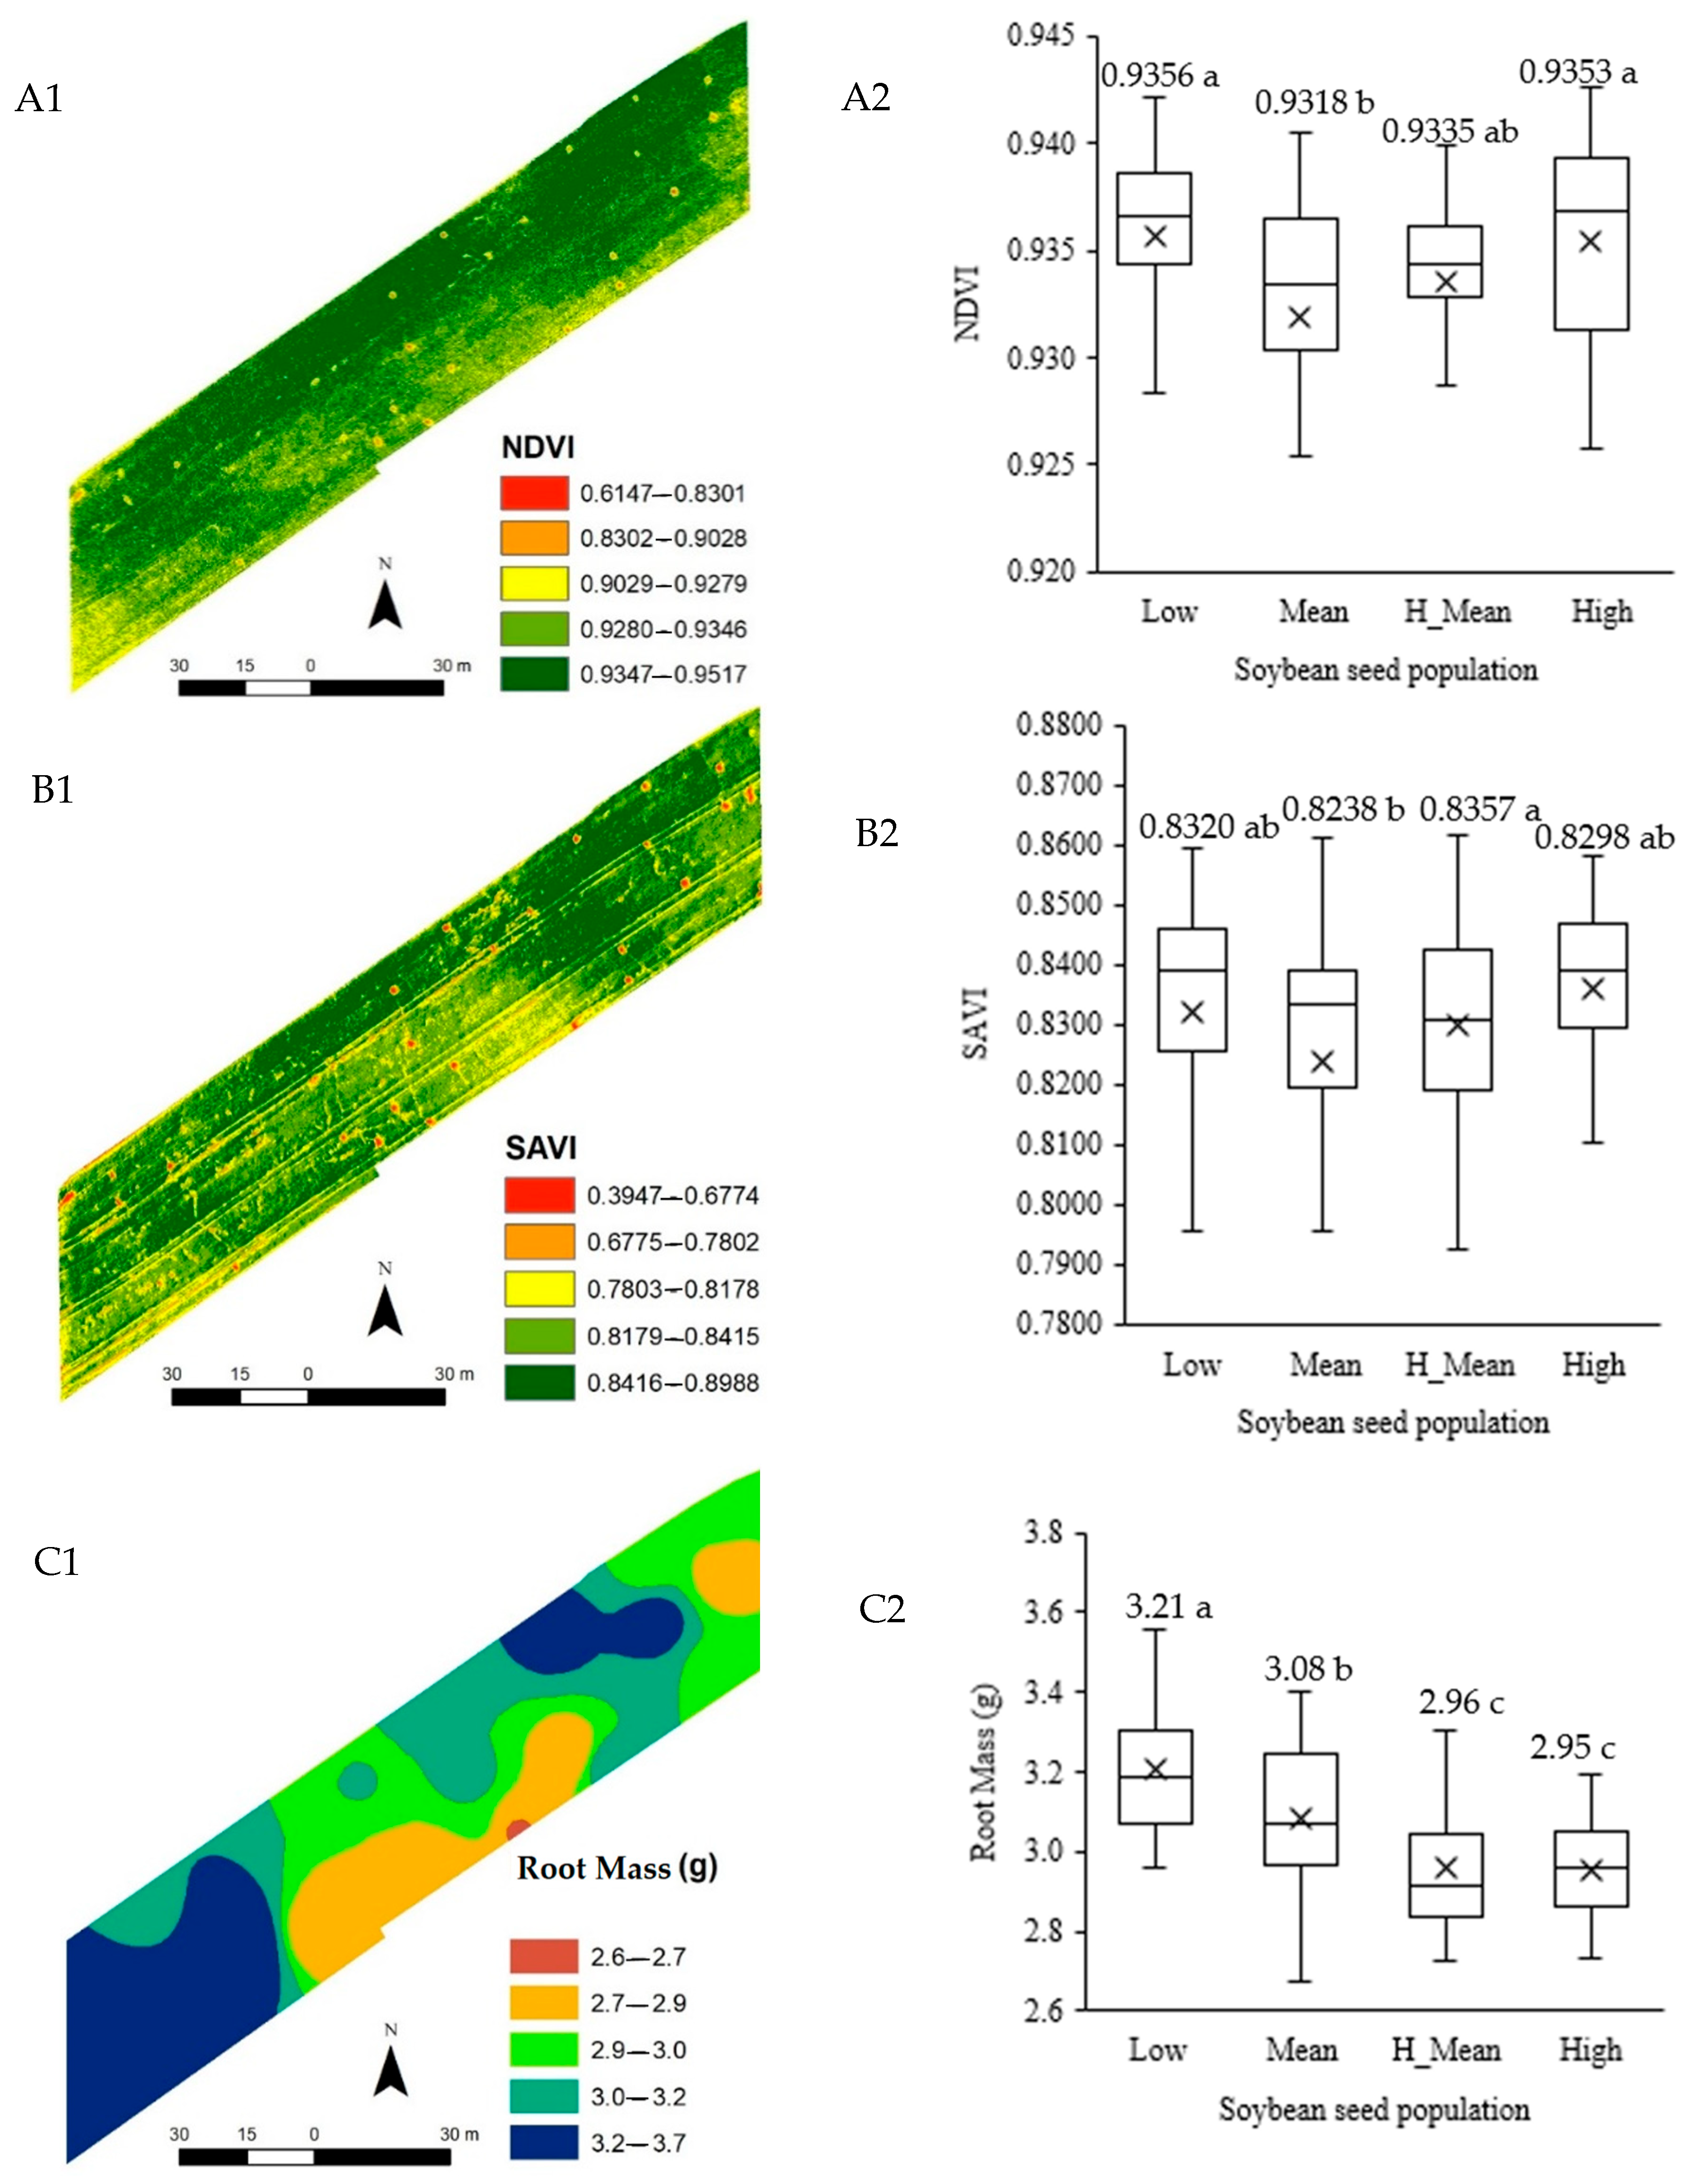
A critical finding that explains the observed yield loss was the effect of intraspecific competition on biomass allocation (
Figure 6). Root dry mass (
Figure 6(C2)) was highest in the low-population zone, which was significantly greater (
p < 0.05) than all other treatments. Conversely, both the high- and medium-population treatments within the low-fertility zone (High and H_Mean) produced comparable and significantly lower root mass. This demonstrates a clear resource allocation trade-off, as the vegetation indices (NDVI and SAVI) in these same high-density zones were high. This indicates that, under high competition, plants prioritized the development of vegetative canopy biomass at the direct expense of the root system, which ultimately limited nutrient uptake and yield.
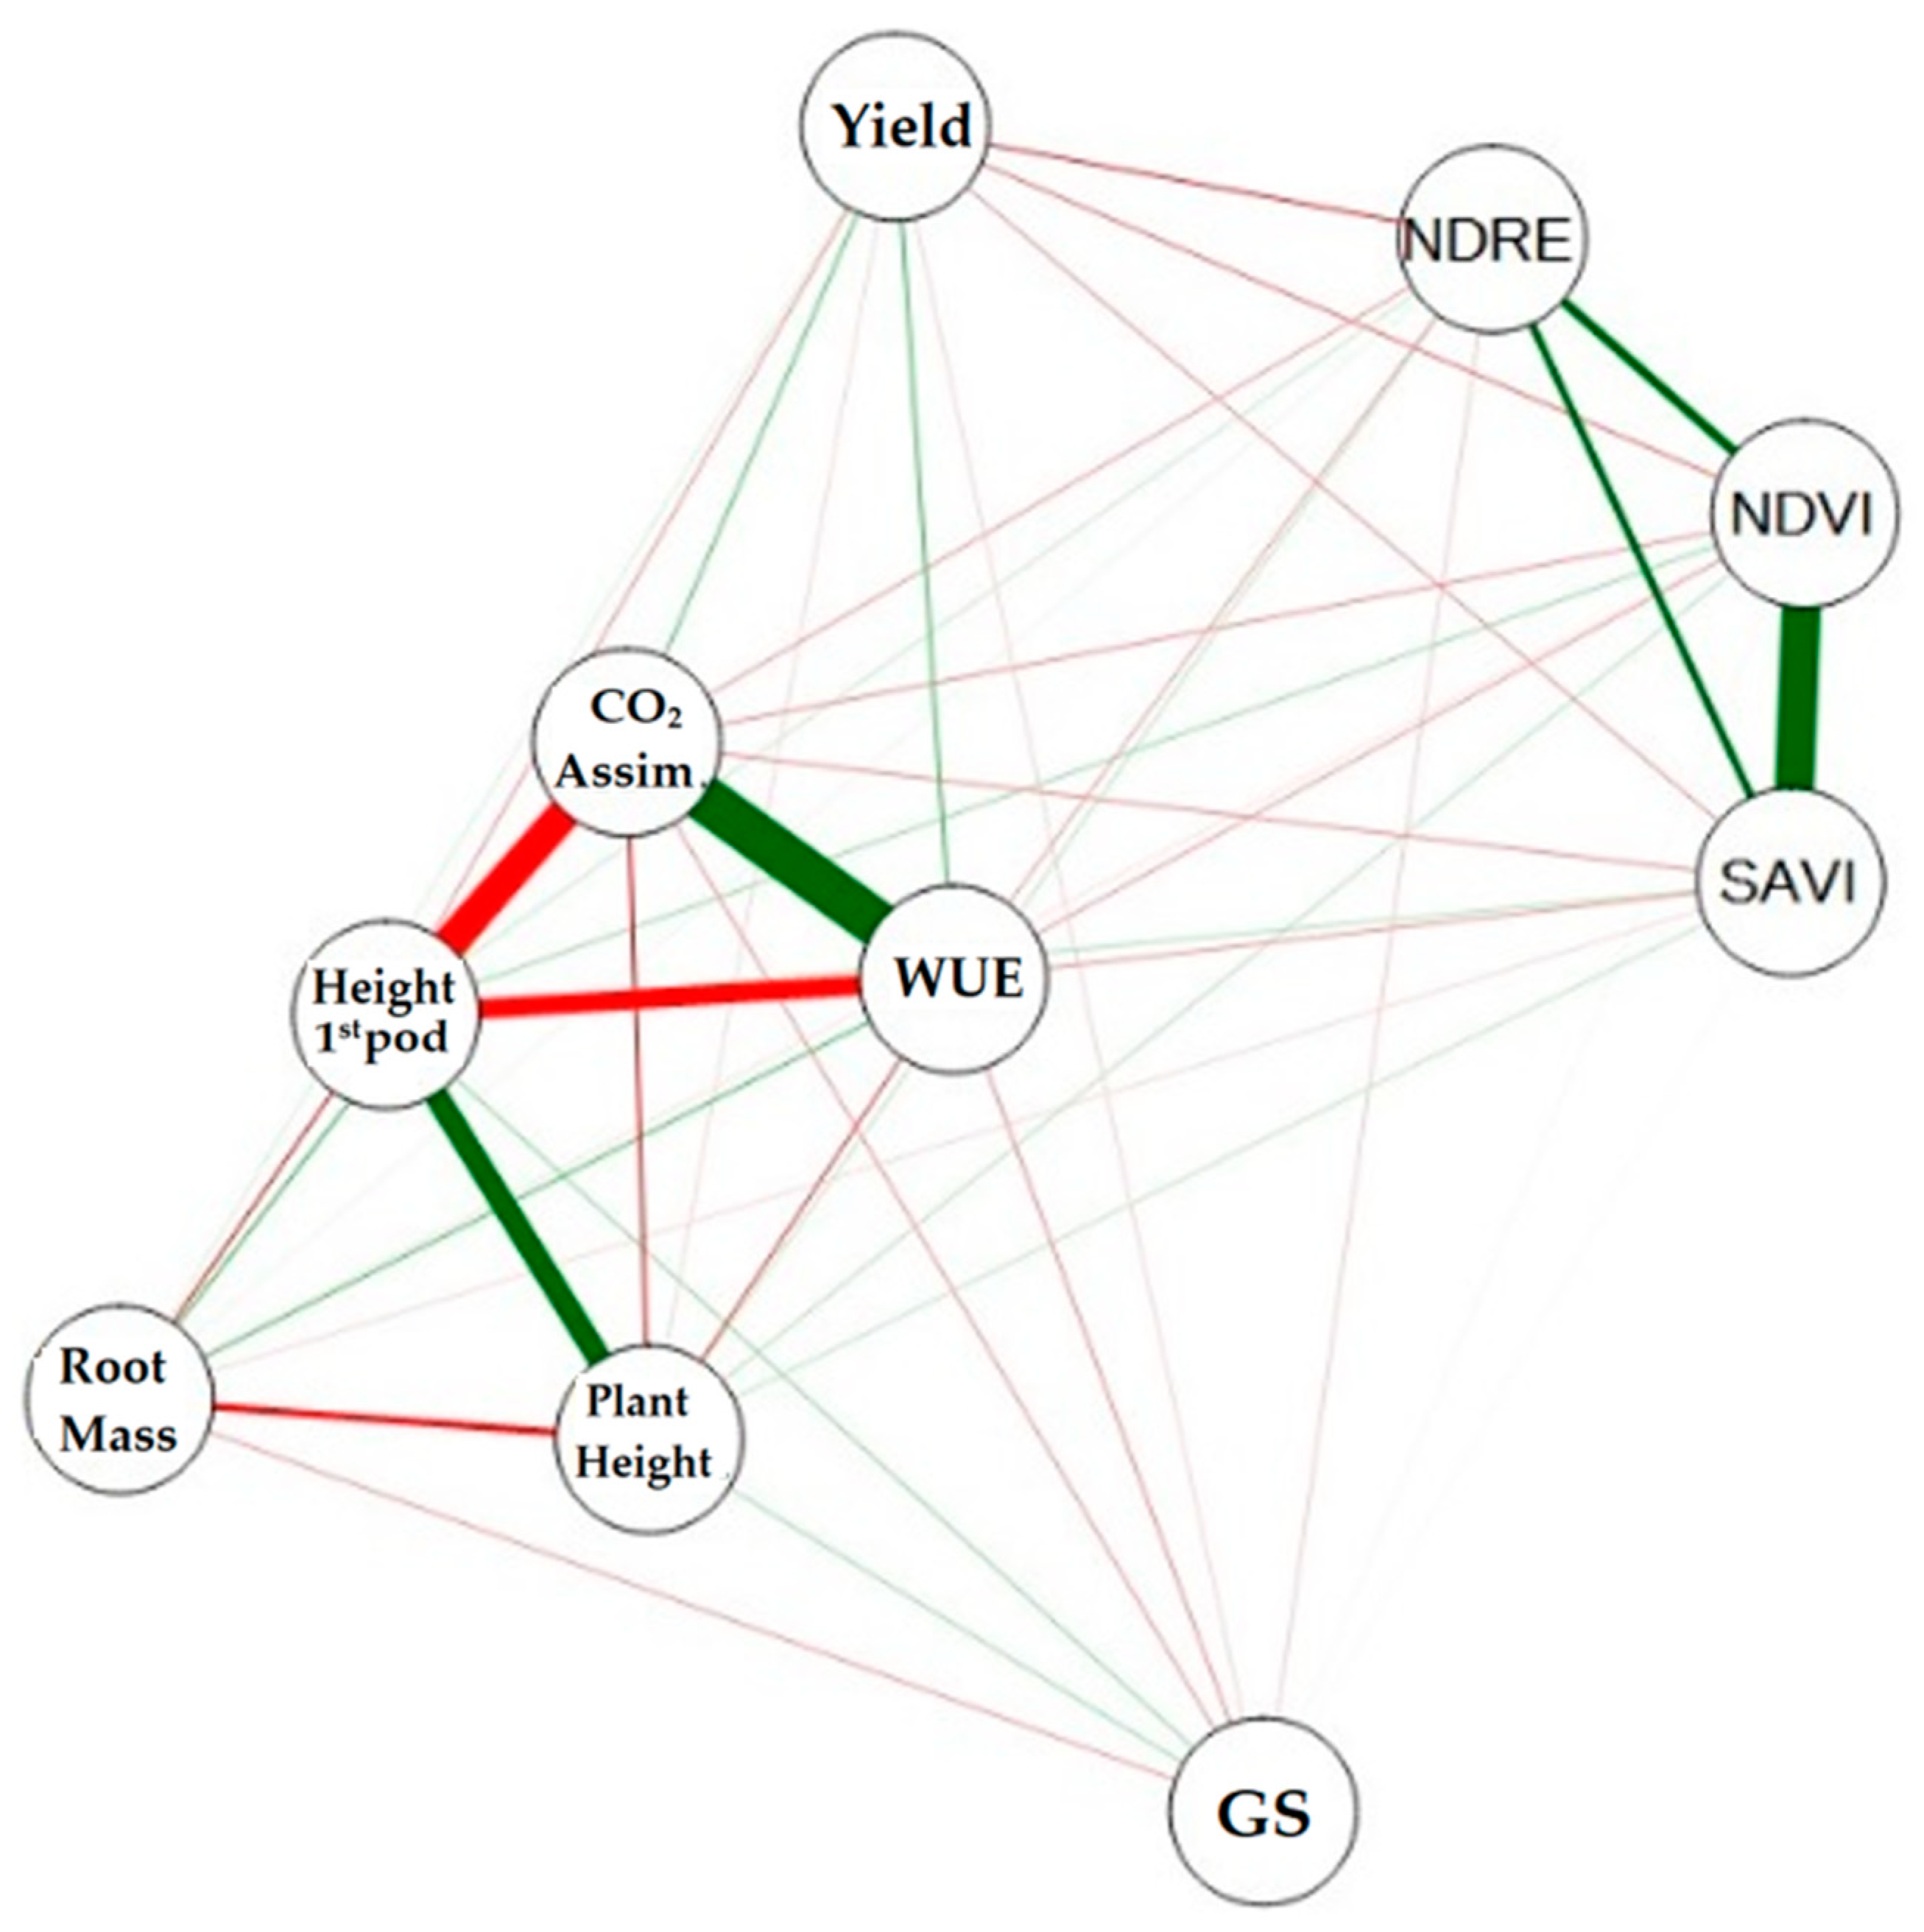
By analyzing the Pearson correlation network among the observed variables (
Figure 7), productivity (PROD) exhibited a positive correlation with net CO
2 assimilation rate and water- use efficiency. In contrast, PROD showed a negative correlation with the vegetation indices NDVI, SAVI, and NDRE. The vegetation indices were positively correlated with each other, reflecting their complementary nature. First pod insertion height was positively correlated with plant height; however, productivity showed no correlation with either variable. Net CO
2 assimilation and water-use efficiency were strongly correlated, indicating high photosynthetic activity.
Canonical variate analysis was conducted to visualize the relationship between population density treatments and the set of agronomic, physiological, and remote sensing variables (
Figure 8). The first two canonical variables (Can1 and Can2) accounted for 97.3% of the total variation. The first canonical variable (Can1) was primarily responsible for separating treatments. High population density treatments (High and H_Mean) clustered on the left side of the plot (negative Can1 scores), whereas the low-population density treatment (Low) clustered distinctly on the right side (positive Can1 scores). The medium-population density treatment (Mean) was positioned intermediately, near the center of the axis.
Vector analysis revealed significant correlations among variables. A strong antagonism was observed between physiological and vegetative growth variables. Net CO2 assimilation rate (CO2 Sim.) and water-use efficiency (WUE) were strongly negatively correlated (angle ≈ 180°) with plant height and NDVI, indicating that treatments promoting higher photosynthetic efficiency produced smaller plants and less dense canopies. Additionally, physiological variables (CO2 Sim. and WUE) were strongly positively correlated with root dry mass, suggesting that higher metabolic efficiency was associated with greater investment in the root system. In contrast, root mass was negatively correlated with plant height, confirming a trade-off in biomass allocation between the shoot and root system. Grain yield (Yield) was positively correlated with the mean-population treatment (Mean) and stomatal conductance (GS), positioning it opposite to the vectors associated with excessive vegetative growth.
4. Discussion
The yields analyzed in this study highlight the potential of precise plant population management enabled by detailed area mapping. These results indicate that sowing high soybean populations in areas with lower fertility may not be the most effective strategy. The observed increase in plant height under high population density, without a corresponding gain in productivity, suggests an etiolation response caused by intense intraspecific competition for light. This indicates that plants allocated more resources to vegetative growth at the expense of reproductive development.
While soybean population management and VRS based on soil attributes are established concepts [
10,
24], our findings provide a critical new insight that challenges the conventional VRS strategy. It is commonly believed that raising seeding density in areas with low fertility can help offset limited resources. Our study directly contradicts this assumption. We demonstrate that in potassium-limited zones, applying the Law of the Minimum reveals a counterproductive outcome: higher density intensifies intraspecific competition for the very nutrient that is already limiting. This leads to the observed trade-off—excessive vegetative growth at the expense of root development—which ultimately compromises grain yield. This result shifts the objective of VRS in low-fertility zones away from compensating for limitations and toward mitigating competition.
The average soybean yield measured in the VRS management zones was 4907.84 kg ha
−1, whereas the control zone, with a fixed population recommended by the developers, averaged 4200 kg ha
−1. Plant population is a key phytotechnical factor for optimizing productivity [
9]. However, a fixed population is often applied uniformly across the entire field, without accounting for spatial variation in soil attributes that affect crop productivity. Frequently, these areas are not mapped, and potential soil nutrient limitations remain unidentified.
The widely used median population performs well in more restrictive soils, particularly when these soils are not mapped—i.e., in situations where the soil limitations are unknown—resulting in greater productivity gains. Conversely, adjusting plant population without knowledge of soil attributes can lead to suboptimal outcomes.
In low-fertility zones, increases in soybean plant population primarily affect the vegetative cycle rather than the reproductive cycle. According to Rodigheri et al. [
25], this response is associated with stress from intraspecific competition, leading to reductions in plant growth and vigor. In contrast, plants in the average-population zone maintained a balance between vegetative and reproductive development.
High soybean yields are strongly influenced by environmental conditions, including solar radiation, temperature, photoperiod, and especially adequate precipitation. These factors can affect the successful establishment of sown seeds, potentially reducing the final plant population [
19]. Therefore, when any of these factors are suboptimal, plants undergo deleterious changes in vegetative growth. These changes can be reflected in root dry mass, plant height, first pod insertion height, and, ultimately, grain yield. The observed plant etiolation appears to be a strategy to enhance energy capture and conversion, resulting from intraspecific competition.
Similarly to environmental influences on productivity, genetic material may lack sufficient phenotypic plasticity to respond to changes in plant population, limiting the effectiveness of VRS. Even with complete area mapping to guide population adjustments, plants may not show changes in height if this trait is inherently absent [
26].
Maintaining the average plant population in the low-fertility zone resulted in improved first pod height, plant height, and productivity, comparable to those observed in a medium-population zone within an area of moderate fertility. This result suggests that maintaining manufacturer-recommended average populations in nutritionally limited areas can achieve better productivity. This approach avoids the false impression that increasing the plant population will necessarily lead to higher productivity. Oliveira Junior et al. [
9] emphasize that larger populations promote lodging, depending on the soybean variety, as a result of increased intraspecific competition. Branch prostration may disrupt vascular bundles and cause leaf overlap. For effective VRS, it is necessary to map the cation exchange capacity (CEC) along with the limiting nutrient, since CEC represents potential nutrient retention and does not reflect actual nutrient availability when assessed solely from K saturation.
According to Oliveira Junior et al. [
9], soybean crops export approximately 20 kg of potassium per ton of grain. Potassium (K) is responsible for several functions in plants, such as stomatal conductance, enzyme activation, and translocation of photoassimilates, contributing to higher grain weight and quality [
13]. Potassium fertilization recommendations for the Cerrado region, which target 3600 kg ha
−1 are somewhat outdated [
16]. Currently, farmers base fertilization on recent data, reflecting an expected yield of 5000 kg ha
−1. Increasing plant population in areas with low CTC and low K levels does not lead to significant gains. Positive economic viability is fundamental to the success of the enterprise in the field [
27,
28]. In addition to higher seed costs, productivity remains unchanged. Excessive canopy development can also increase the risk of pest and disease incidence by reducing the effectiveness of control measures and can exacerbate lodging during the critical reproductive stage of the crop [
4].
It is important to note that this study evaluated plant population effects under a uniform fertilization program, which meant that K limitations were not fully corrected in the low-fertility zones. Future studies should investigate the factorial interaction of variable-rate seeding with variable-rate fertilization, as it is possible that correcting the nutrient deficiency might alter the optimal plant population.
5. Conclusions
Variations in soybean seed population density within low-fertility management zones, defined by the law of the minimum with potassium (K) as the limiting nutrient, significantly affect crop development and yield. This study demonstrates that increasing plant populations in these lower fertility areas is counterproductive, resulting in a significant decrease in grain yield. The yield reduction is associated with intensified intraspecific competition, which reallocates plant resources toward vegetative growth at the expense of root development and grain production.
Maintaining a moderate seed population (240,000 seeds ha−1), as recommended for the cultivar, in low-fertility zones not only prevented yield losses but also produced yields statistically equivalent to those obtained in higher-fertility zones. Canonical variate analysis indicated that higher yields were positively associated with photosynthetic efficiency and stomatal conductance, rather than with increased vegetative biomass as suggested by vegetation indices.
The application of VRS in soybean sowing, guided by the identification of the most limiting soil factor, is an effective strategy for optimizing productivity. In low-fertility areas, the most resilient and economically advantageous approach is not to increase sowing density, but to maintain a moderate population that balances the crop’s productive potential with resource availability, thereby avoiding the negative effects of excessive intraspecific competition.
