Article

Screening of Winter Wheat Accessions from International Variety Trials for Drought Resistance in Southeastern Kazakhstan

by
Karlyga Jiyenbayeva
1,*,
Minura Yessimbekova
1,
Sholpan Bastaubayeva
1,
Alexey Morgounov
2 and
Kadyrzhan Mukin
1
1
Kazakh Research Institute of Agriculture and Plant Growing, Almalybak 040909, Kazakhstan
2
Biodiversity Department, Al Farabi Kazakh National University, Almaty 050051, Kazakhstan
*
Author to whom correspondence should be addressed.
Crops 2025, 5(6), 76; https://doi.org/10.3390/crops5060076
Submission received: 1 August 2025 / Revised: 16 October 2025 / Accepted: 20 October 2025 / Published: 24 October 2025

Abstract

Wheat production, globally and in Kazakhstan, is significantly limited by heat stress and drought. The evaluation of agronomic traits related to yield under stress conditions is crucial for identifying yield-limiting factors and selecting drought-tolerant germplasm. The aim of this study was to evaluate the variability of the main agronomic and physiological characteristics of 45 winter wheat collection accessions obtained during CIMMYT international variety trials (23IWWYT-IRR and 22IWWYT-SA) in the arid conditions of Southeastern Kazakhstan (foothills of the Zailiyskiy Alatau, 48° N, 77° E, 740 m above sea level) and to identify drought-resistant germplasm. As a result of three years of research (2019–2022) under drought conditions during the 2020–2021 growing season with a high negative environment index (Ij = −3.07), three adapted genotypes were identified: BONITO-37/MV10-2000, LYMARIVNA, and OK12D22004-016. They had yields of 5.3, 5.6, and 5.2 t/ha, respectively, significantly exceeding the yield of the local commercial variety STEKLOVIDNAYA 24 by 15.4–22.8%. The correlation coefficient between productivity variables was significant and varied from 0.55 ** to 0.82 ***. The percentage decrease in yield under drought conditions was 72.3%, while the drought resistance index was 0.27.

1. Introduction

Agriculture is a strategically important sector of the economy, and its sustainability is directly dependent on climatic conditions. In an era of global climate change, food security is determined by the stability of crop yields. Climate shifts, accompanied by increasing water shortages and unpredictable droughts, threaten wheat production both globally and in arid regions [1]. Predicting the potential impacts of drought on agricultural production plays a key role in ensuring food security. Several studies (Martre et al. [2], Zhao et al. [3], Graziani et al. [4], Assen et al. [5]) have shown that the projected 1 °C increase in global average surface temperature poses a serious threat to wheat production. Leng and Hall [6] estimated that climate change could reduce global wheat yields by 12.3% by the end of the 21st century compared to historical levels.
Global climate change is characterized by a sustained trend of increasing average global surface air temperatures, leading to an increase in the frequency and intensity of extreme weather events. According to FAO data [7], in 2022, the average annual temperature change in more than 128 countries exceeded the average values for the period from 1951 to 1980 by at least 1.0 °C. This is confirmed by the recorded temperature peaks of 2016 (+1.66 °C), 2020 (+1.71 °C), and 2021 (+1.44 °C), which indicate significant deviations from the long-term average values. Kazakhstan is located in the continental climate zone of the Asian region, where, according to climate forecasts by the Intergovernmental Panel on Climate Change, global temperatures could rise by 2.7–4.8 °C by 2100. In particular, in 2020, there was an increase in temperature from 0.76 °C in 2000 to 1.56 °C [8]. The climate forecasts of the IPCC and FAO have been confirmed in Kazakhstan by climate studies for the period from 1950 to 2020. These studies have identified a high amplitude of temperature fluctuations (0.31 °C) and a negative trend in precipitation dynamics over most of the Republic during the summer (4–20% per decade) and autumn (2–20% per decade) periods. In this regard, one of the most relevant regional strategies for wheat adaptation in Kazakhstan is to increase the drought resistance of the crop [9,10].
The clearly evident trend of changes in temperature and precipitation, reduced soil moisture, and increased aridity invariably leads to changes in ecosystems. In this regard, one of the most pressing environmental problems for Kazakhstan, which has a negative impact on agriculture, is drought. Data from the FAO [7], as well as studies conducted between 2000 and 2016 by Dubovik E. et al. [11], showed that more than 50% of Kazakhstan’s territory experiences arid conditions, with the largest droughts occurring in 2012 and 2014. The observed climate changes have a negative impact on grain production in the Republic [12,13].
Winter wheat is an economically important cereal crop in Kazakhstan, accounting for about 20% of the national grain balance and cultivated on an area of over 600,000 hectares [14]. According to data from Morgunov et al. [15], the size of the area sown with this crop reached 14 million hectares in Western and Central Asia. Within Kazakhstan, the main crops were concentrated in the southern and southeastern regions, where winter wheat occupied up to 80% of the area designated for cereal crops in the region. The advantages of winter wheat over spring wheat are obvious and include a longer growing season, earlier maturity, and, as a result, more stable grain production. The effective use of autumn–winter moisture reserves, spring precipitation, and suitable temperature conditions contributes to yields that are usually 2–3 times higher than those of spring wheat [16,17]. However, in the arid climate typical of this region, winter wheat is also susceptible to stress factors. Studies of the climate of Kazakhstan for the period from 1941 to 2012, conducted by Salnikov and co-authors [18], revealed a steady trend towards higher temperatures in the southern regions, as evidenced by high values of the determination coefficient (25–36%). An agroclimatic assessment based on moisture intensity and hydrothermal coefficient (HTC) indicators, conducted in 2015–2016 and taking into account climate change, classifies this zone as a “very arid warm” region [19]. In this regard, forecasting the possible consequences of drought for agricultural production, in particular winter wheat, plays a key role in ensuring the country’s food security.
The complexity of assessing the impact of drought is due to its multifactorial nature, shaped by the complex interaction of various climatic variables, including precipitation, temperature, vapor pressure, and solar radiation.
Studies by Shirhorn et al. [12] and Karatayev et al. [9] assessed the impact of average temperature, heat, and precipitation on the yield and production of spring wheat in the arid conditions of Northern Kazakhstan, in particular, analyzing climate change covering the period from 1950 to 2020, drought conditions, and their impact.
For the winter wheat growing region (Southern and Southeastern Kazakhstan), which differs from the Northern steppe zones in terms of climate, soils, and crop production risks (wintering, frosts, snow cover, drought, and temperature extremes) [20,21], trends indicate a steady increase in air temperature. In particular, there was a linear increase in the average surface temperature from 0.25 °C to 0.40 °C per decade (with an increase of 0.25 °C in Almaty). The largest increase in the average surface air temperature was observed in spring (0.58 °C per decade); the smallest increase was observed in winter (0.07 °C per decade); and a steady increase was observed at a temperature of 0.20–0.21 °C per decade in summer and autumn (Karatayev et al.) [9].
However, despite the importance of the southern and southeastern regions of Kazakhstan for winter wheat production (≥600 thousand hectares), scientific research that takes into account the specifics of the regional climate (significant daily temperature fluctuations) remains limited and insufficiently studied. The following aspects require clarification: how seasonal precipitation combines with temperature in different phases of winter wheat development; the impact of summer drought; in particular, the combined effect on crop yields of heat stress during the spring–summer period (especially in June–July) and moisture deficit, which are characteristic of the southeastern region of the country.
The aim of this study is to assess the variability of key morphophysiological characteristics and productivity of winter wheat accessions in Southeastern Kazakhstan during the growing seasons from 2019 to 2022 and to identify drought-resistant germplasm.

2. Materials and Methods

2.1. Genetic Materials

The research objects were 45 accessions of winter bread wheat from two international CIMMYT nurseries (23IWWYT-IRR; 22IWWYT-SA), as shown in Table 1. The drought-resistant winter bread wheat variety STEKLOVIDNAYA 24, released in the area, was used as a local check.

2.2. Experimental Conditions

The research was conducted in 2019–2022 in the foothills of the Zailiyskiy Alatau on an unirrigated stationary plot (48° N, 77° E, 740 m above sea level) of the Agricultural Crop Gene Pool Department, Kazakh Research Institute of Agriculture and Plant Growing (“KazRIAPG” LLP).
Field trials were conducted using a completely randomized block design with three replicates. The experimental plot area was 10 m2. The intervals between blocks and replicates were maintained at 1 m. Row spacing was set at 15 cm, and the seed planting depth was 5 cm. The sowing rate was 200 kg/ha. Before sowing, mineral fertilizers were applied to the soil at a dosage of N30P30K30. Standard agronomic measures were applied during the growing season. The experimental plot was not irrigated; moisture came exclusively from atmospheric precipitation. To suppress weeds, an herbicide mixture was used, including Baron, Ether Premium and Beres-8 preparations in calibrated proportions. Plant protection against pests was provided by the insecticide Terrano.
The soil cover of the plot consisted of light brown, medium loamy soils with a humus content (0–30 cm) of up to 3.0%. The soil contained 0.15% total nitrogen, 0.21% phosphorus, and 1.67% potassium.
Sowing was carried out in the first ten days of October, which is the optimal sowing time for winter wheat in this area. The analysis was carried out at the level of the average values of the accession. Yield was calculated as the tons per hectare of harvested grain from each plot.

2.3. Methods

2.3.1. Data Collection

The methodology for phenotyping productivity traits is based on methodological guidelines, standards, and protocols for the study, characterization, and support of cereal crop genetic resources [22,23,24].
During each growing season, the main phases of plant development were noted (when 50% of plants in a single accession reached the corresponding phase), plant height (PH), and normalized relative vegetation index (NDVI) were measured, and the productivity of the accessions was determined.
The number of days to heading (DH) of winter wheat was calculated from 1 January. Plant height was measured by randomly selecting three plants from different points in the plot, from the soil surface to the top of the ear. Plant height was ranked according to the International Classification of the genus Triticum L.
Under field conditions, the normalized relative vegetation index (NDVI) of green leaves was measured using a portable Green Seeker device (Trimble Inc., Sunnyvale, CA, USA) during flowering. The NDVI characterizes the growth and development of plant biomass, allows for monitoring of plant condition, and predicts the expected productivity of wheat.
The NDVI is based on the difference in the reflectance of vegetation in the red (Red) and near-infrared (NIR) regions of the spectrum.
NDVI calculation formula:
NDVI = (NIR − RED)/(NIR + RED),
where NIR and RED are the coefficients of electromagnetic radiation reflection in the infrared and red regions of the spectrum.
The analysis was conducted using average values from accessions. Yield was determined by collecting grain from each plot and converting it into tons per hectare.

2.3.2. Drought and Moisture Availability Indices

The meteorological data in the article are represented as atmospheric precipitation values (mm), average daily air temperature (°C), and their average annual values recorded by the automatic weather station of “KazRIAPG” LLP in the period from September 2019 to August 2022.
The Standardized Precipitation Index (SPI) values were used to determine drought categories. Monthly precipitation trends were calculated using specialized software, the SPI Generator v 1.7.6 application—(https://drought.unl.edu/Monitoring/SPI/SPIProgram.aspx/ (accessed on 5 April 2024)). Monthly precipitation data presented as a time series obtained from the “KazRIAPG” LLP weather station were used to calculate the SPI. According to the SPI drought classification (Table 2), which is widely used to determine drought categories, drought is considered to occur when the SPI value drops to (−1) or below. Negative SPI values indicate the onset of a hydrological drought of varying categories [25].
The Selyaninov hydrothermal coefficient (HTC) is a climatic indicator used to assess the degree of moisture in an area during the growing season. It reflects the relationship between precipitation and temperature conditions, allowing the moisture supply to plants to be determined under a given thermal regime. To determine the degree of moisture, a gradation of HTC values is used, according to which the following categories are distinguished: very severe drought (≤0.19), severe drought (0.20–0.39), moderate drought (0.40–0.60), mild drought (0.61–0.75), and no drought (≥0.76). HTC was calculated as the ratio of the sum of precipitation to one-tenth of the sum of active air temperatures [26]:
HTC = R/(0.1∑T)
where R is the amount of precipitation during the period with temperatures above 10 °C, and ∑T > 10° is the sum of temperatures exceeding +10 °C.
Accumulated degree-days of heat (HDD) are estimated in °C by adapting the equation: HDD = ∑ (Tmax − Th) [27]
  • where Tmax is the maximum daily temperature; Th is the heat stress temperature threshold.

2.3.3. Statistical Data Analysis

Statistical analyses were performed using the R software environment, version 4.3.2 [28]. The dplyr and tidyr packages [29,30] were used for preliminary data processing and transformation, and the ggplot2 package [31] was used for graphical visualization of the results. The presence of statistically significant differences between years was established using the non-parametric Kruskal–Wallis test (p < 0.0001) [32].
The drought index (DI) was calculated using the method described by Bouslama, M. et al. [33], according to the following formula:
DI = Trait-DS/Trait-NS,
where Trait-DS is the average trait value under drought conditions, and Trait-NS is the average trait value under non-stress conditions.
The environment index (Ij) in the Eberhart and Russell model, used to analyze genotype–environment interaction (GEI), is calculated as follows [34]:
Ij = (Σn Yij/n) − (Σg Σn Yij/gn)
where
Ij: the environment index of the jth environment;
Σn Yij: sum of the mean values (Yij) of all genotypes (i) in the j-th environment;
n: the total number of genotypes in the experiment;
Σg Σn Yij: the arithmetic mean of all genotypes (i) in all environments (j);
g: the number of genotypes.

3. Results

3.1. Meteorological Observations

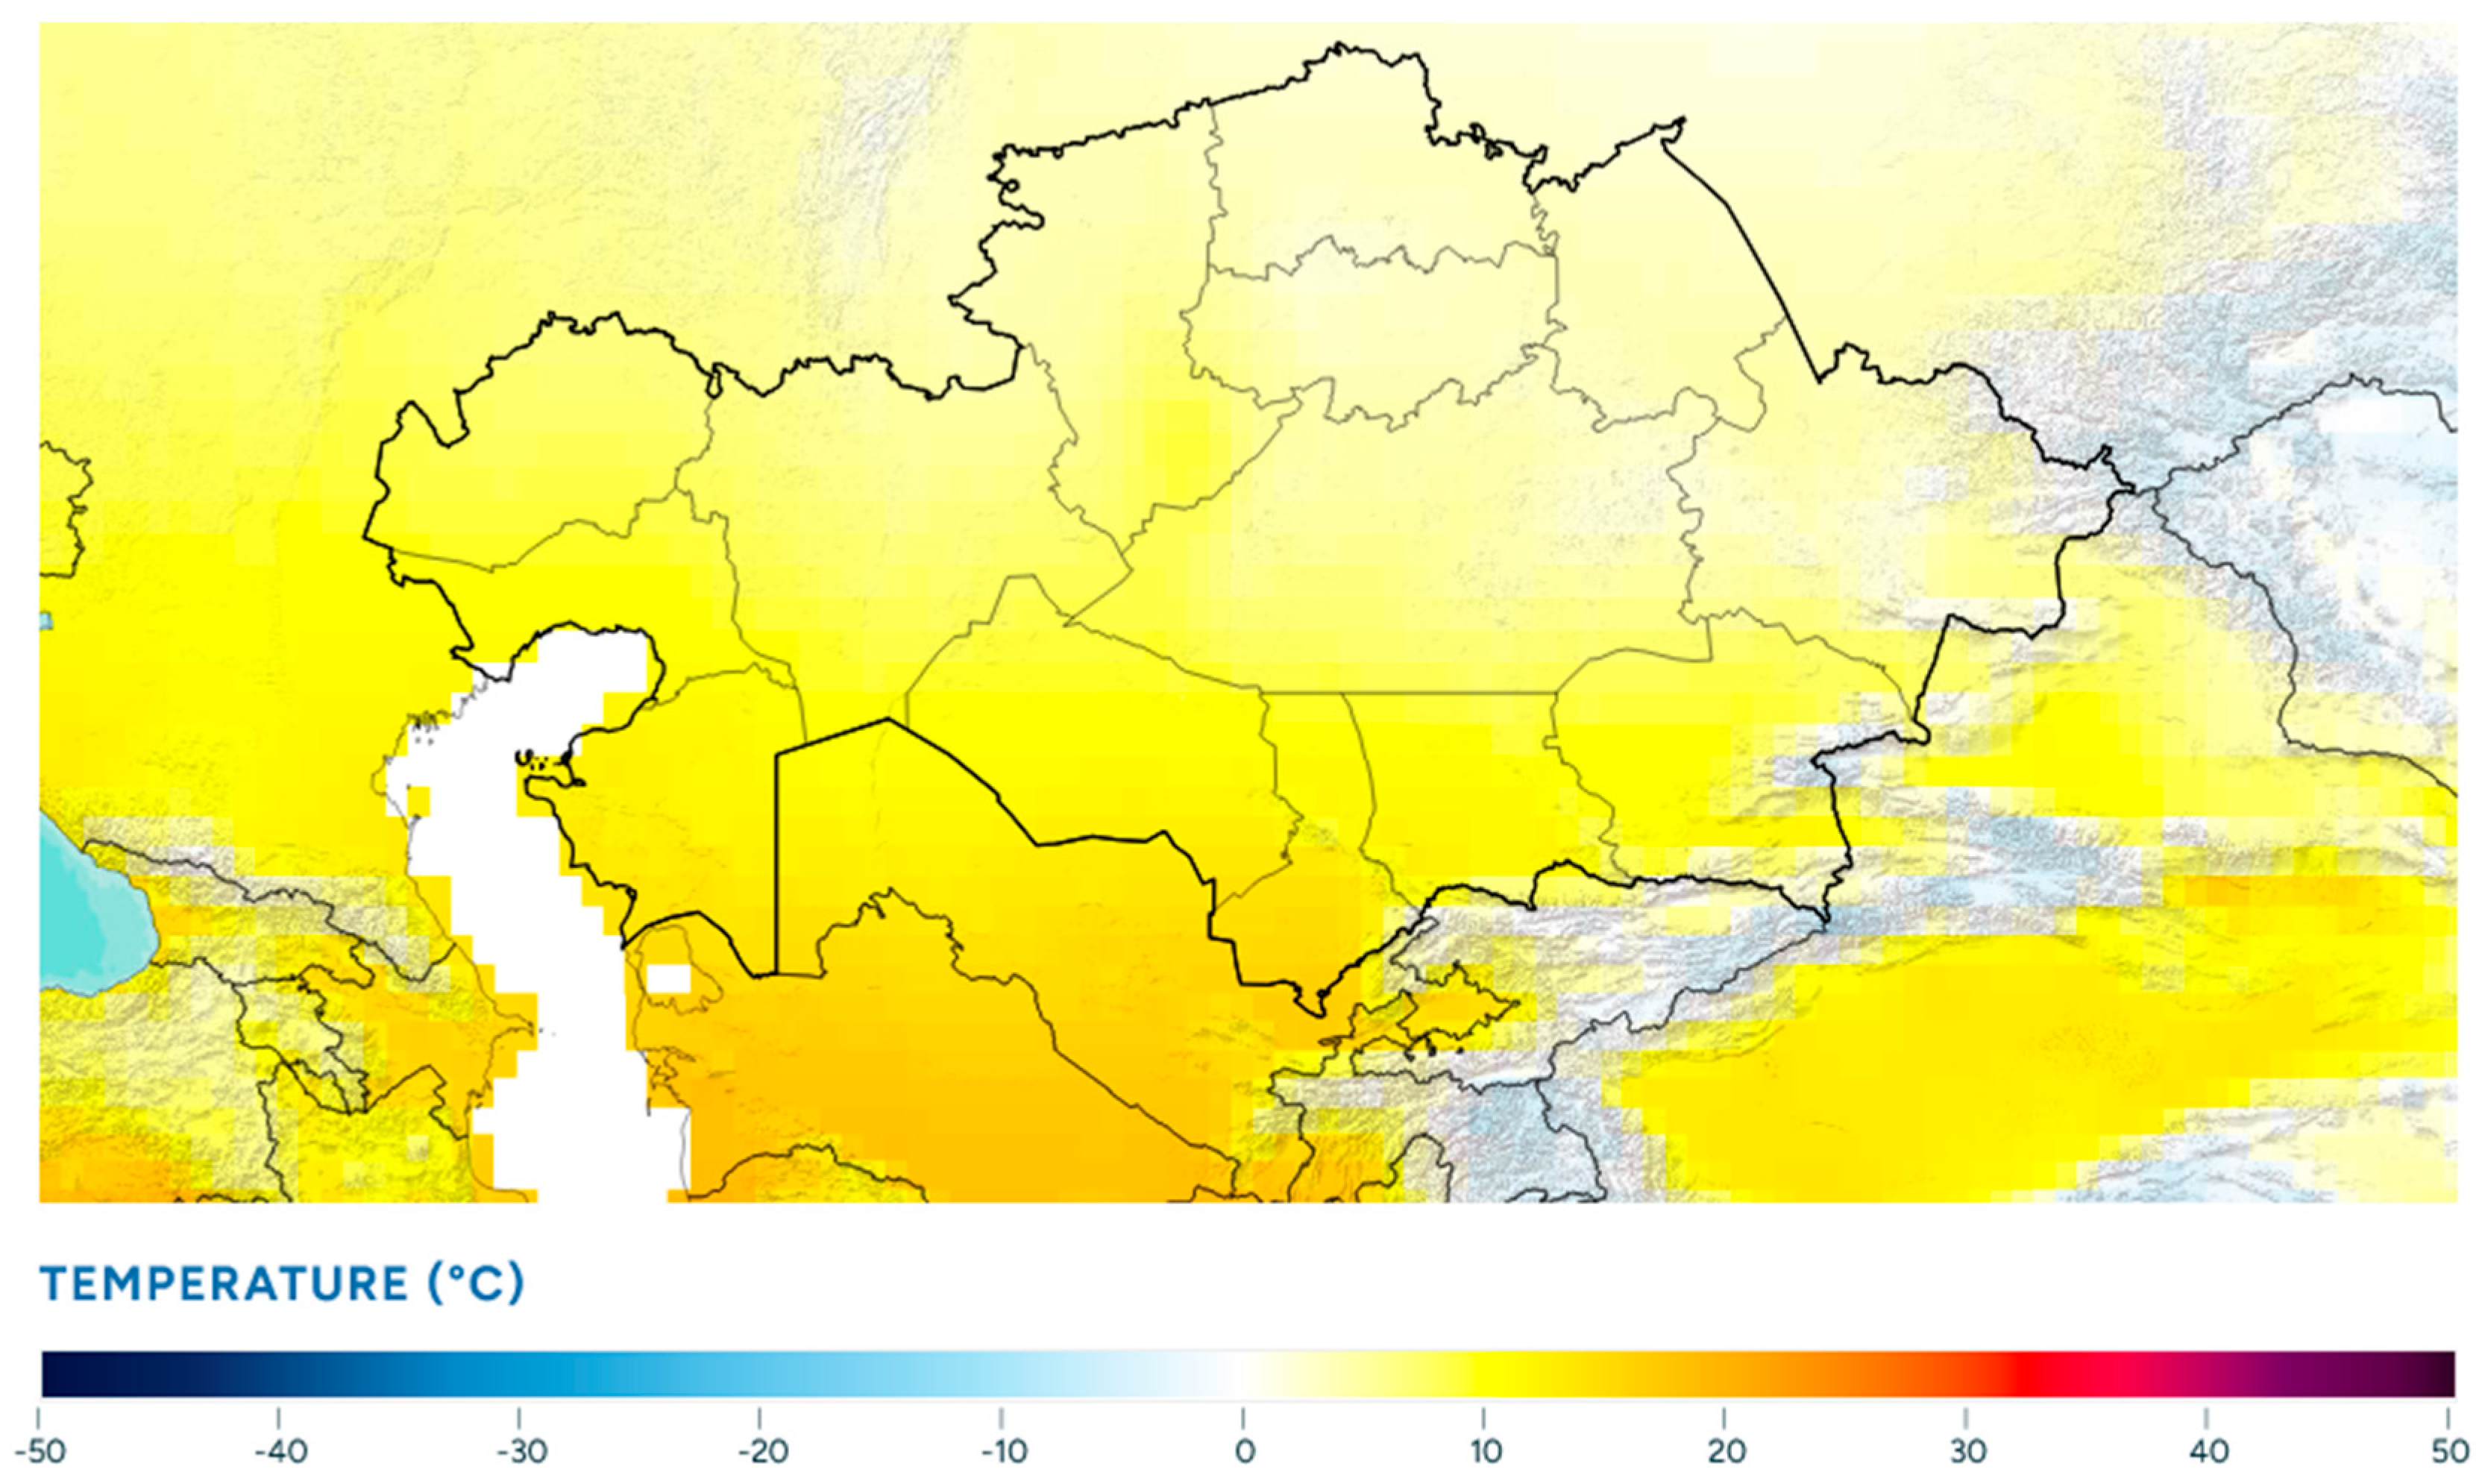
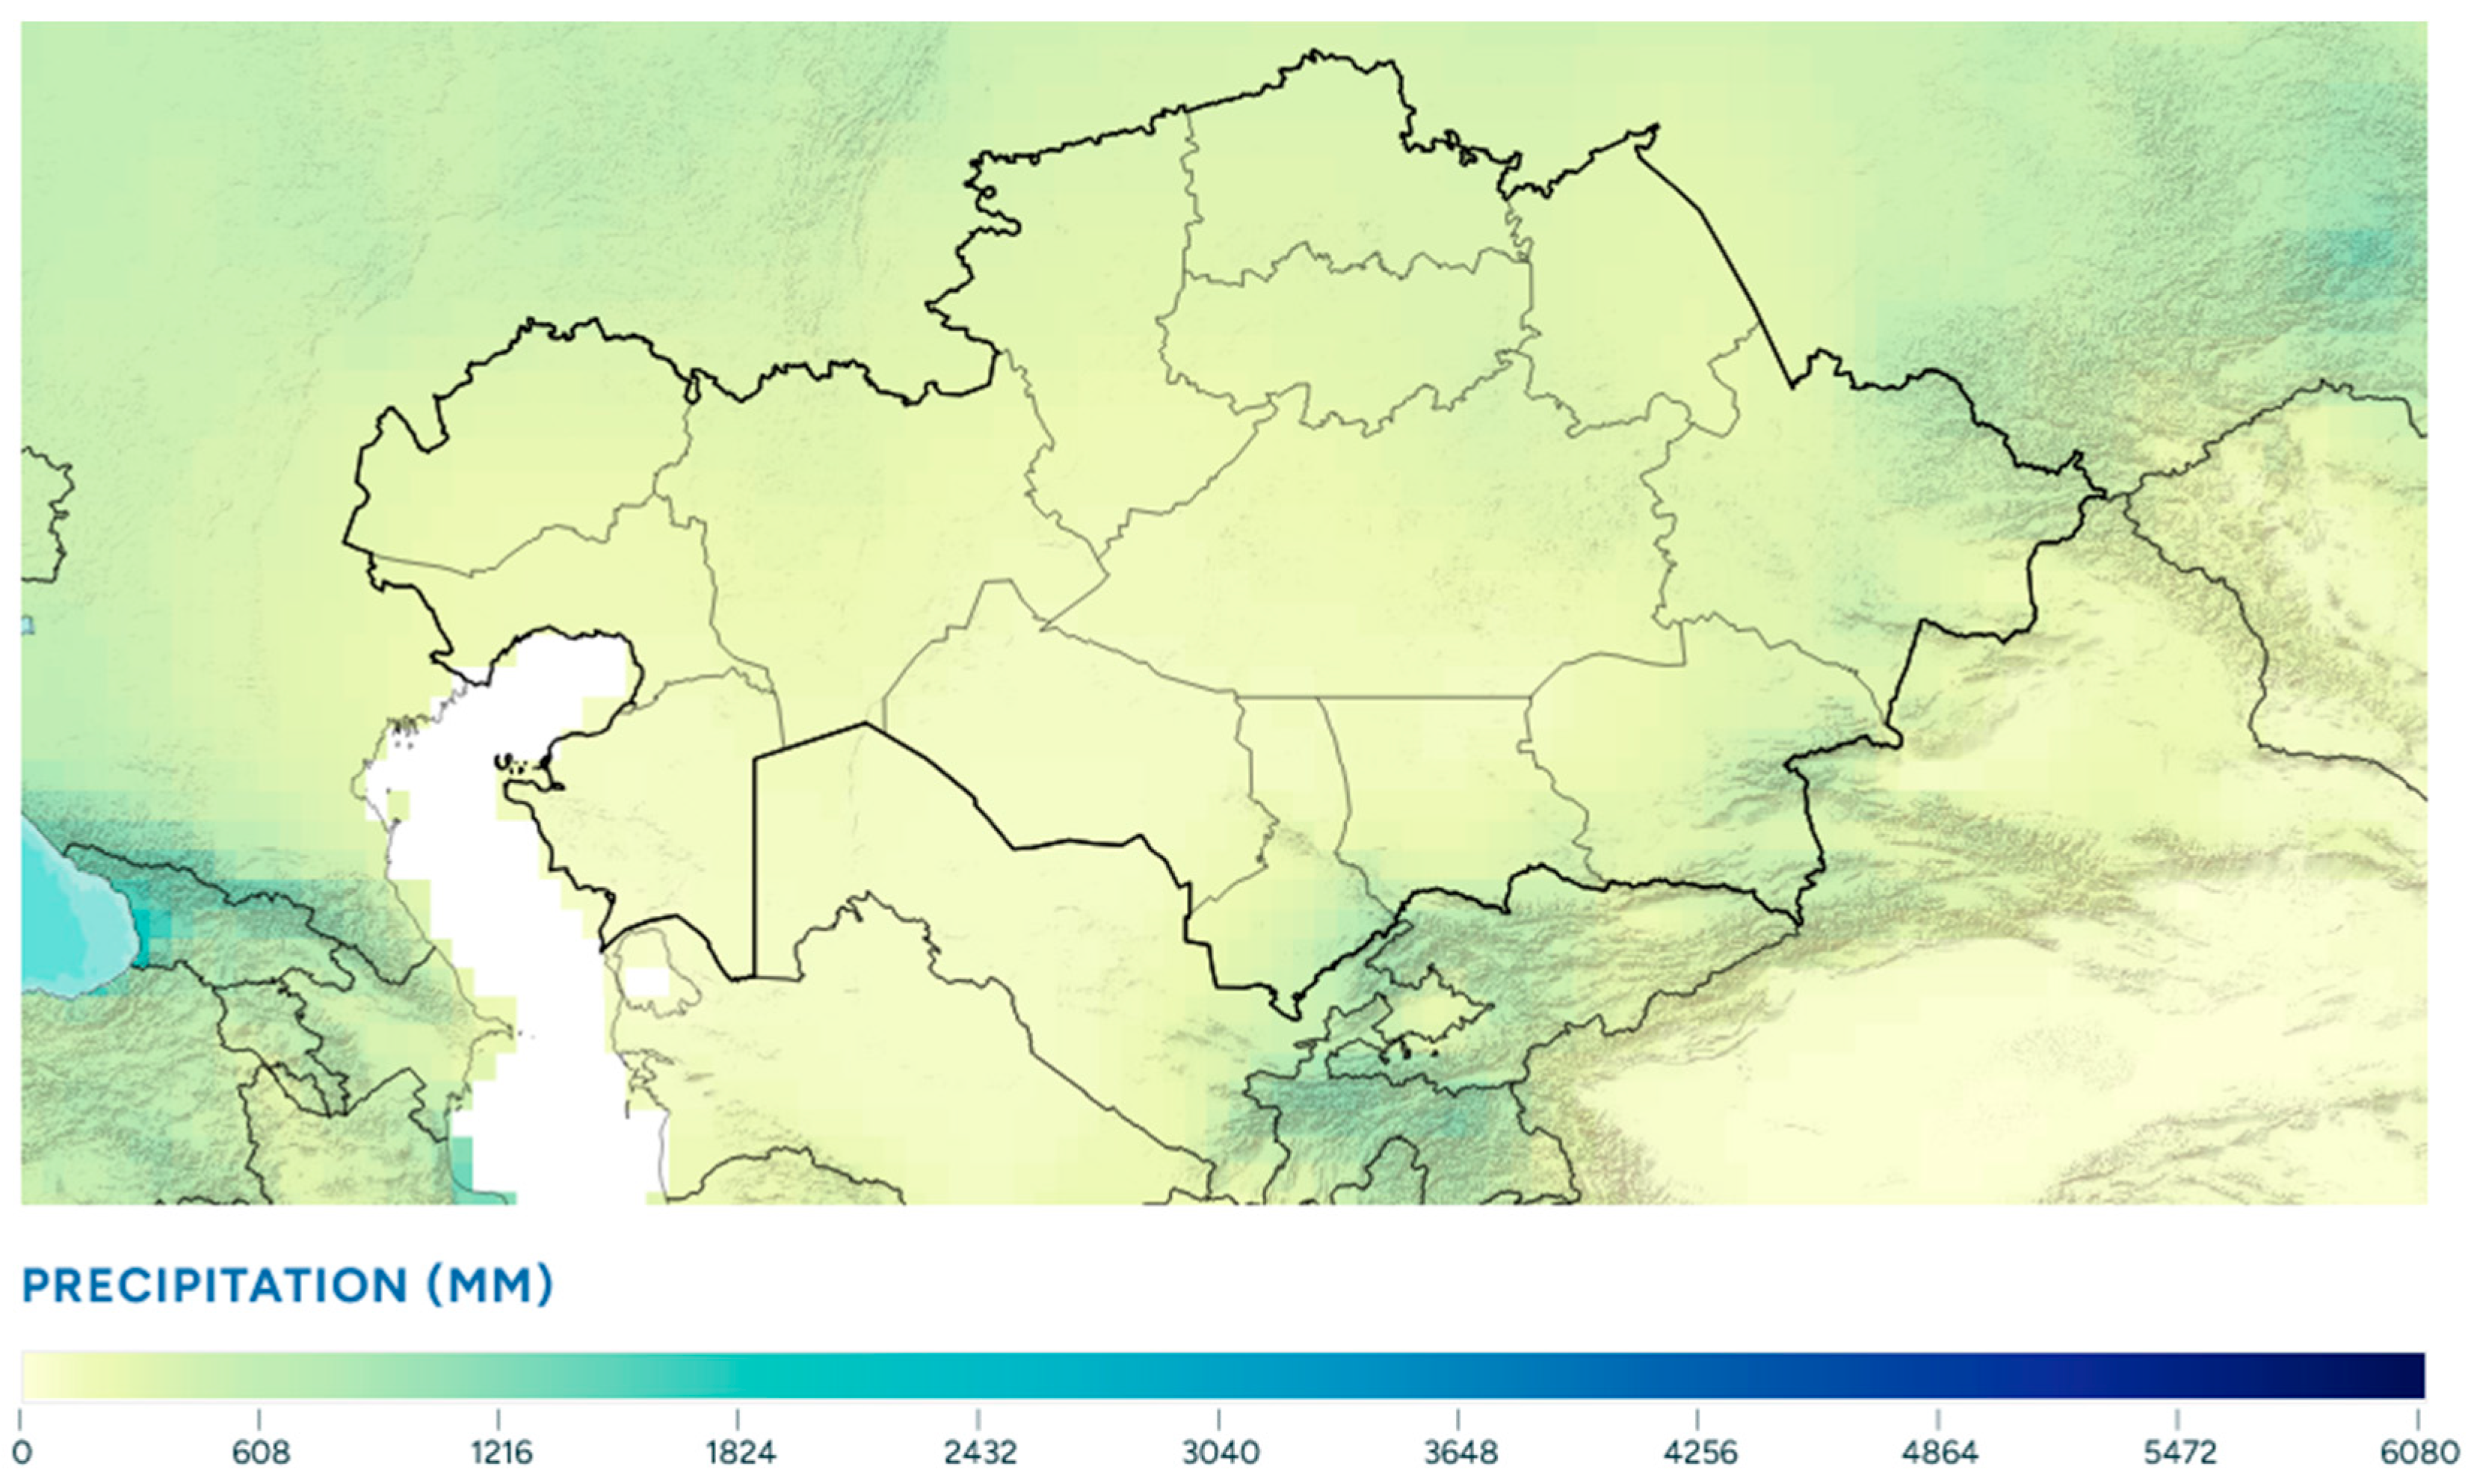
According to data from climate maps of the Republic of Kazakhstan [31], which show the distribution of average annual temperature and precipitation, the southeastern and southern regions of Kazakhstan (Almaty, Zhambyl, and Turkestan) experienced average annual temperature variations from 7.0 to 13.0 °C (Figure 1) and annual precipitation between 250 and 600 mm (Figure 2) during the period from 1991 to 2020 [35].
Analysis of the annual changes in temperature and moisture availability recorded by the meteorological station of “KazRIAPG” LLP during the research years (2019–2022) revealed significant positive deviations in ground-level temperature and precipitation amounts compared to long-term average values (Table 3).
Analysis of the meteorological conditions during three growing seasons (2019–2021, 2021–2022, and 2022–2023) in terms of temperature and precipitation showed the following:
(1)
The average annual temperature increased by +3.6 °C, which averaged +11.3 °C, with an average annual value in the zone of +7.6 °C;
(2)
Annual precipitation exceeded the average by 148.8 mm (totaling 573.3 mm) compared to the average annual values (424.5 mm).
The agrometeorological conditions of the analyzed growing seasons were generally favorable in terms of temperature and precipitation for the growth and development of winter wheat but showed differences in their severity during the main periods of crop development (Figure 3):
(1)
Autumn (September–November)
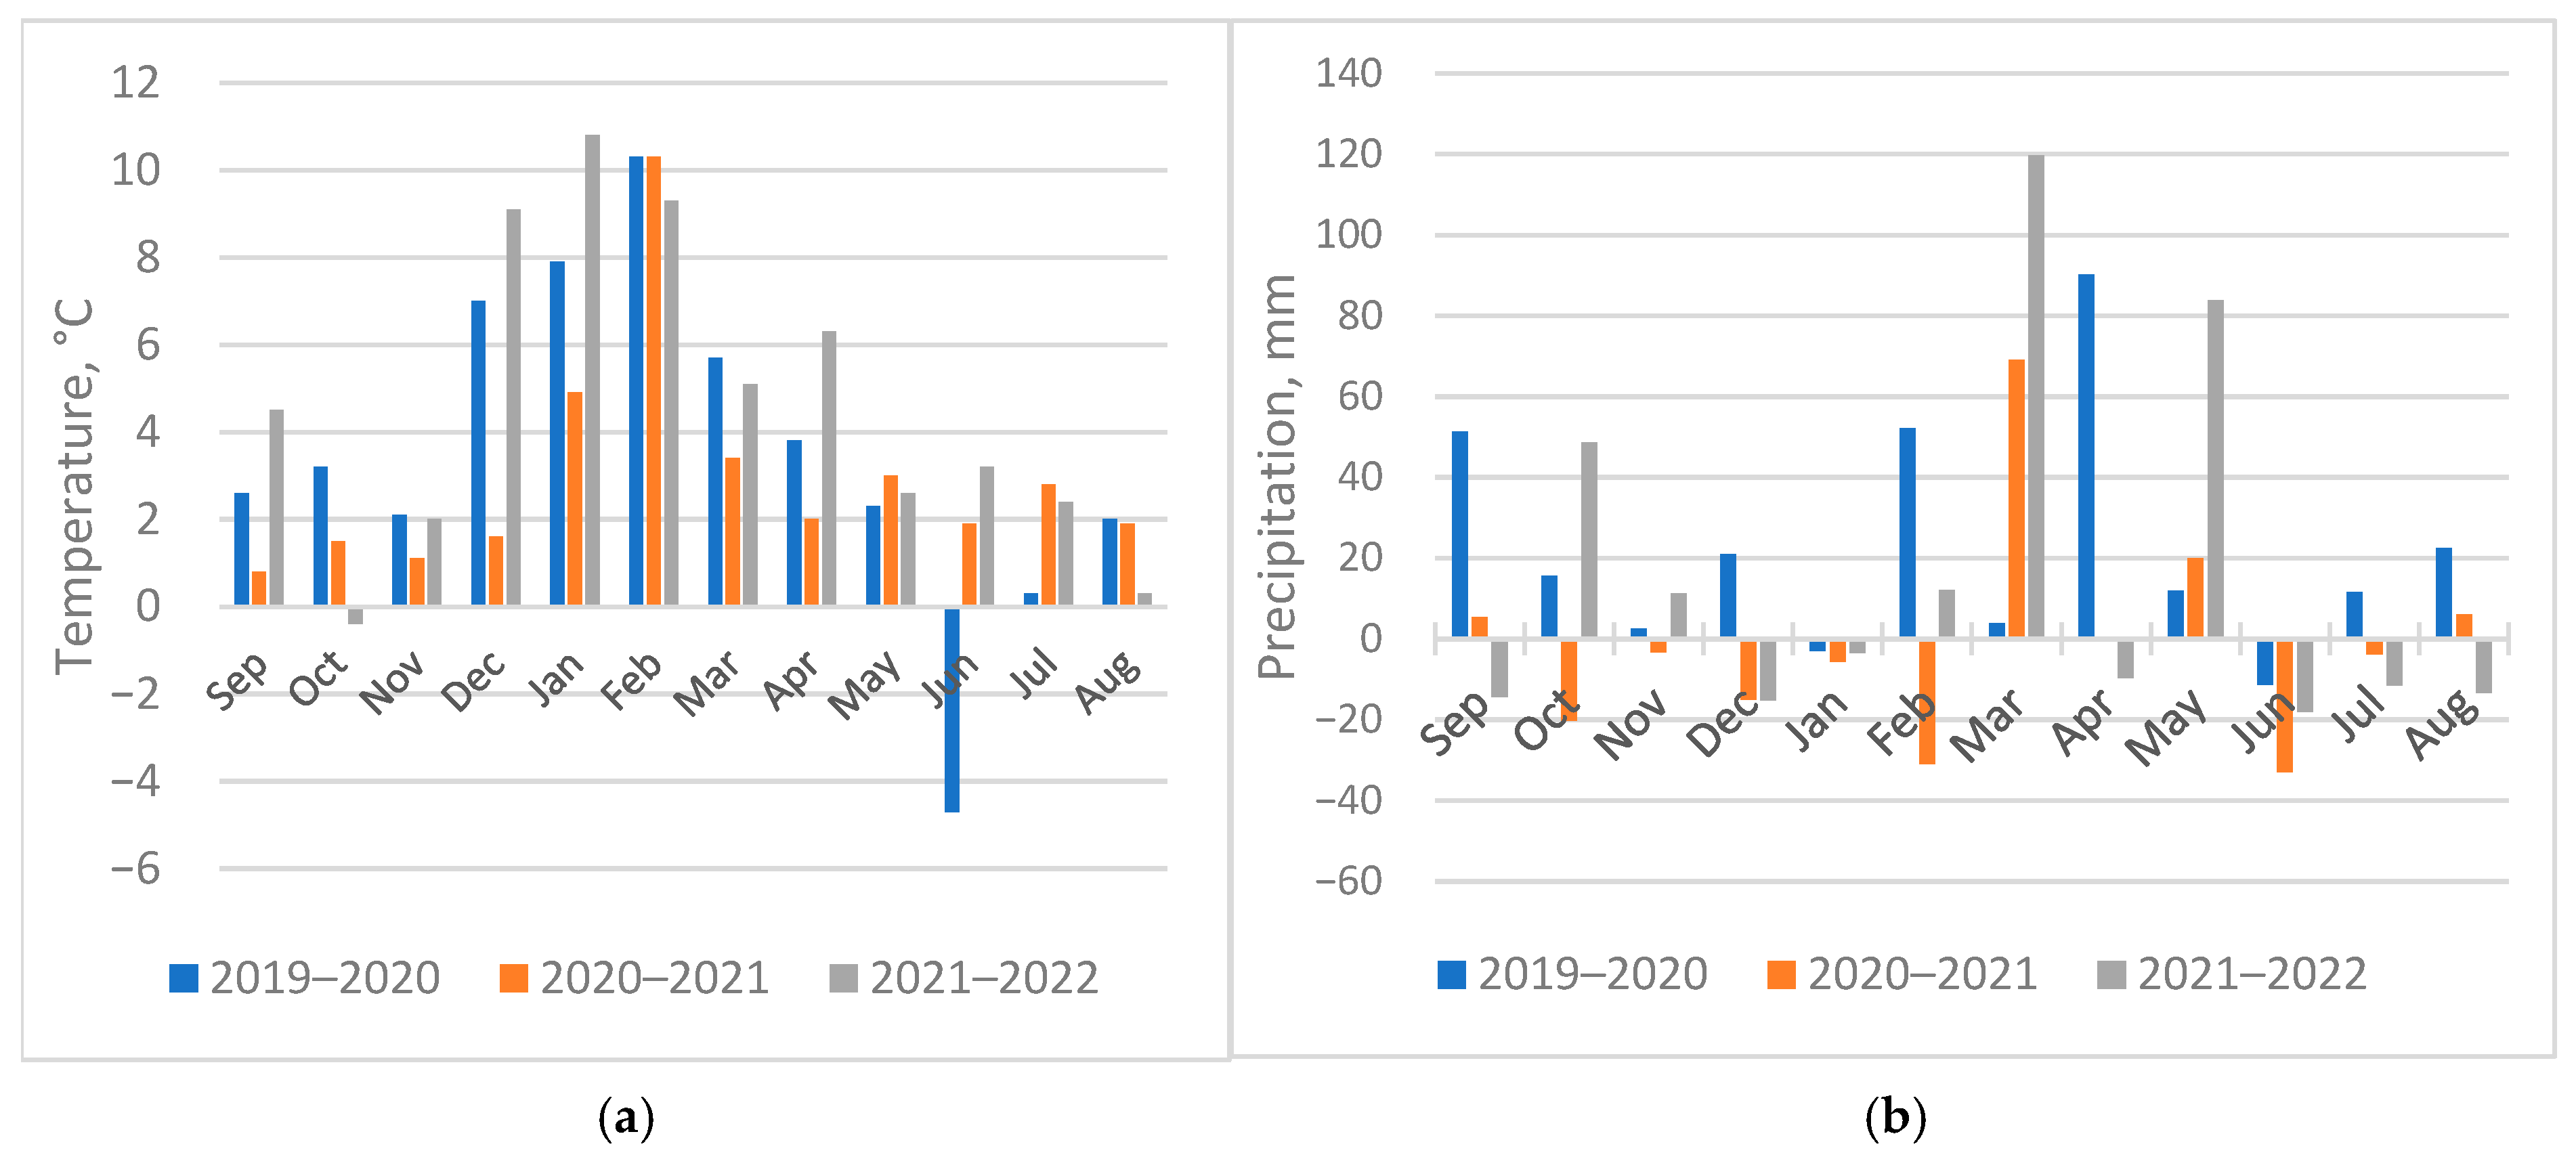
The most favorable period for sowing and germination was the autumn of 2019, which was characterized by positive temperatures and sufficient rainfall. Autumn 2020 was characterized by a lack of moisture in the soil (−20.2 mm). In particular, 8.9 mm of precipitation fell in October, which, combined with elevated temperatures, led to a pronounced soil moisture deficit during the winter wheat sowing period. September 2021 was marked by high temperatures (+4.5 °C) and critically low precipitation (1.6 mm). Heavy precipitation in October–November 2021 was recorded against the backdrop of a significant decrease in the average daily temperature.
(2)
Winter period (December–February)
The winter period was characterized by a relatively warm winter with low average monthly temperatures (−0.6 °C; −3.4 °C; +0.7 °C) compared to the average annual values of −7.8 °C; −10.8 °C; −8.3 °C, respectively. Uneven precipitation distribution was observed in December 2019, with rainfall reaching 1.7 times (50.1 mm) the average annual amount (29.1 mm), while December 2020 and 2021 experienced a moisture deficit of about half the average (14.1 and 14.0 mm, respectively). February was characterized by maximum precipitation levels, with 74.0 mm in 2020, 52.9 mm in 2021, and 33.9 mm in 2022, exceeding the average annual amounts by 3.4, 2.0, and 1.5 times, respectively.
(3)
Spring period (March–May)
During the spring months, from March to May, there was a steady upward trend in positive temperatures, ranging from 6.4 °C to 18.7 °C (2020), from 4.1 °C to 19.4 °C (2021), and from 5.8 °C to 19.0 °C (2022). April 2020, March 2021, and March 2022 were characterized by heavy precipitation (2.5 times higher than normal). The maximum precipitation values for all years of research (168.6 and 145.4 mm, 3.0 and 2.5 times higher than the long-term average, respectively) were recorded in March and May 2022.
(4)
Summer period (June–July)
In June 2020, temperatures and precipitation were below average. June 2021 was extremely dry (precipitation was half the average at 20.9 mm), with relatively high air temperatures. June 2022 was characterized by a steady increase in average daily temperatures (+3.1 °C), with precipitation levels low compared to the long-term average. The temperature regime and amount of precipitation in the first ten days of July, the month when winter wheat completes its growing season in Southern and Southeastern Kazakhstan, were close to the long-term average.

3.1.1. Standardized Precipitation Index SPI

Various indices are used to study the spatio-temporal patterns of drought periods, providing a more complete picture of drought dynamics and its impact on ecosystems [11,36,37,38,39,40,41]. Currently, more than 70 countries around the world use developed SPI calculation programs to monitor drought. The calculated SPI values allow drought or waterlogging to be determined for different time scales. SPI indices calculated from monthly precipitation totals are the most informative indicators for diagnosing drought, as they reflect short-term moisture conditions, which in turn are key during the growing season of agricultural crops and correlate more strongly with atmospheric and soil types of droughts [39,42]. For the period from September 2019 to August 2022, an analysis of the annual moisture supply was conducted to determine the relationship between precipitation indicators and the SPI.
The climate aridity category for the analyzed growing seasons (2019–2022), calculated based on SPI values, is presented in Table 4 according to the accepted classification.
According to the moisture index, the 2019–2020 growing season was generally favorable, although it was characterized by short periods of mild drought (SPI from −0.27 to −0.65). In 2020–2021, there was a negative precipitation trend (from −0.14 to −0.85), manifested in a mild but persistent and prolonged drought throughout almost the entire period. The downward trend in SPI values during the 2021–2022 growing season indicates an intensification of drought: the index values changed from −0.28 to −1.49, which corresponds to a transition from mild to moderate drought. Time series graphs were constructed to visualize the changes in monthly precipitation (Figure 4).
Analysis of precipitation observation data with identical time scales showed a downward trend in precipitation during the periods studied. As can be seen in Figure 4, there is a trend towards longer droughts lasting more than two months, especially in the summer and autumn months.

3.1.2. Hydrothermal Coefficient of G.T. Selyaninov (HTC)

The meteorological conditions of Southeastern Kazakhstan for the period from 2019 to 2022, assessed by the hydrothermal coefficient (HTC), are presented in Table 5.
A comparative analysis of seasonal moisture values showed that the average HTC values for the first two autumn months (September, October) of the two vegetation periods studied (2020–2021; 2021–2022) were 0.3–0.17 and 0.02–1.2, which corresponds to the “very severe drought” category. This indicates that winter crops were sown in conditions of severe drought in the years under review. The winter and spring seasons of the years under study were less prone to drought due to relatively low atmospheric temperatures and sufficient precipitation. The summer months were subject to very significant meteorological droughts (0.42, 0.27, 0.28, respectively). Against the backdrop of high daytime temperatures and low rainfall during the summer, the intensity of the drought was characterized as a sustained severe drought.

3.1.3. Heat Stress

The increase in the frequency of droughts and heat stress has a direct impact on wheat yields. Wheat is sensitive to temperature conditions at different stages of development, with optimal temperature ranges for growth (16–22 °C), flowering (12–22 °C), and ripening (21–25 °C) [43,44,45]. Meteorological conditions throughout the growing season have a significant impact on the formation of winter crop yields, with the most sensitive phases being heading and flowering as well as grain filling. Temperatures above 25 °C, especially during flowering and grain filling, can lead to heat stress, which disrupts the physiological processes of pollination and grain formation [44,46,47,48,49,50,51].
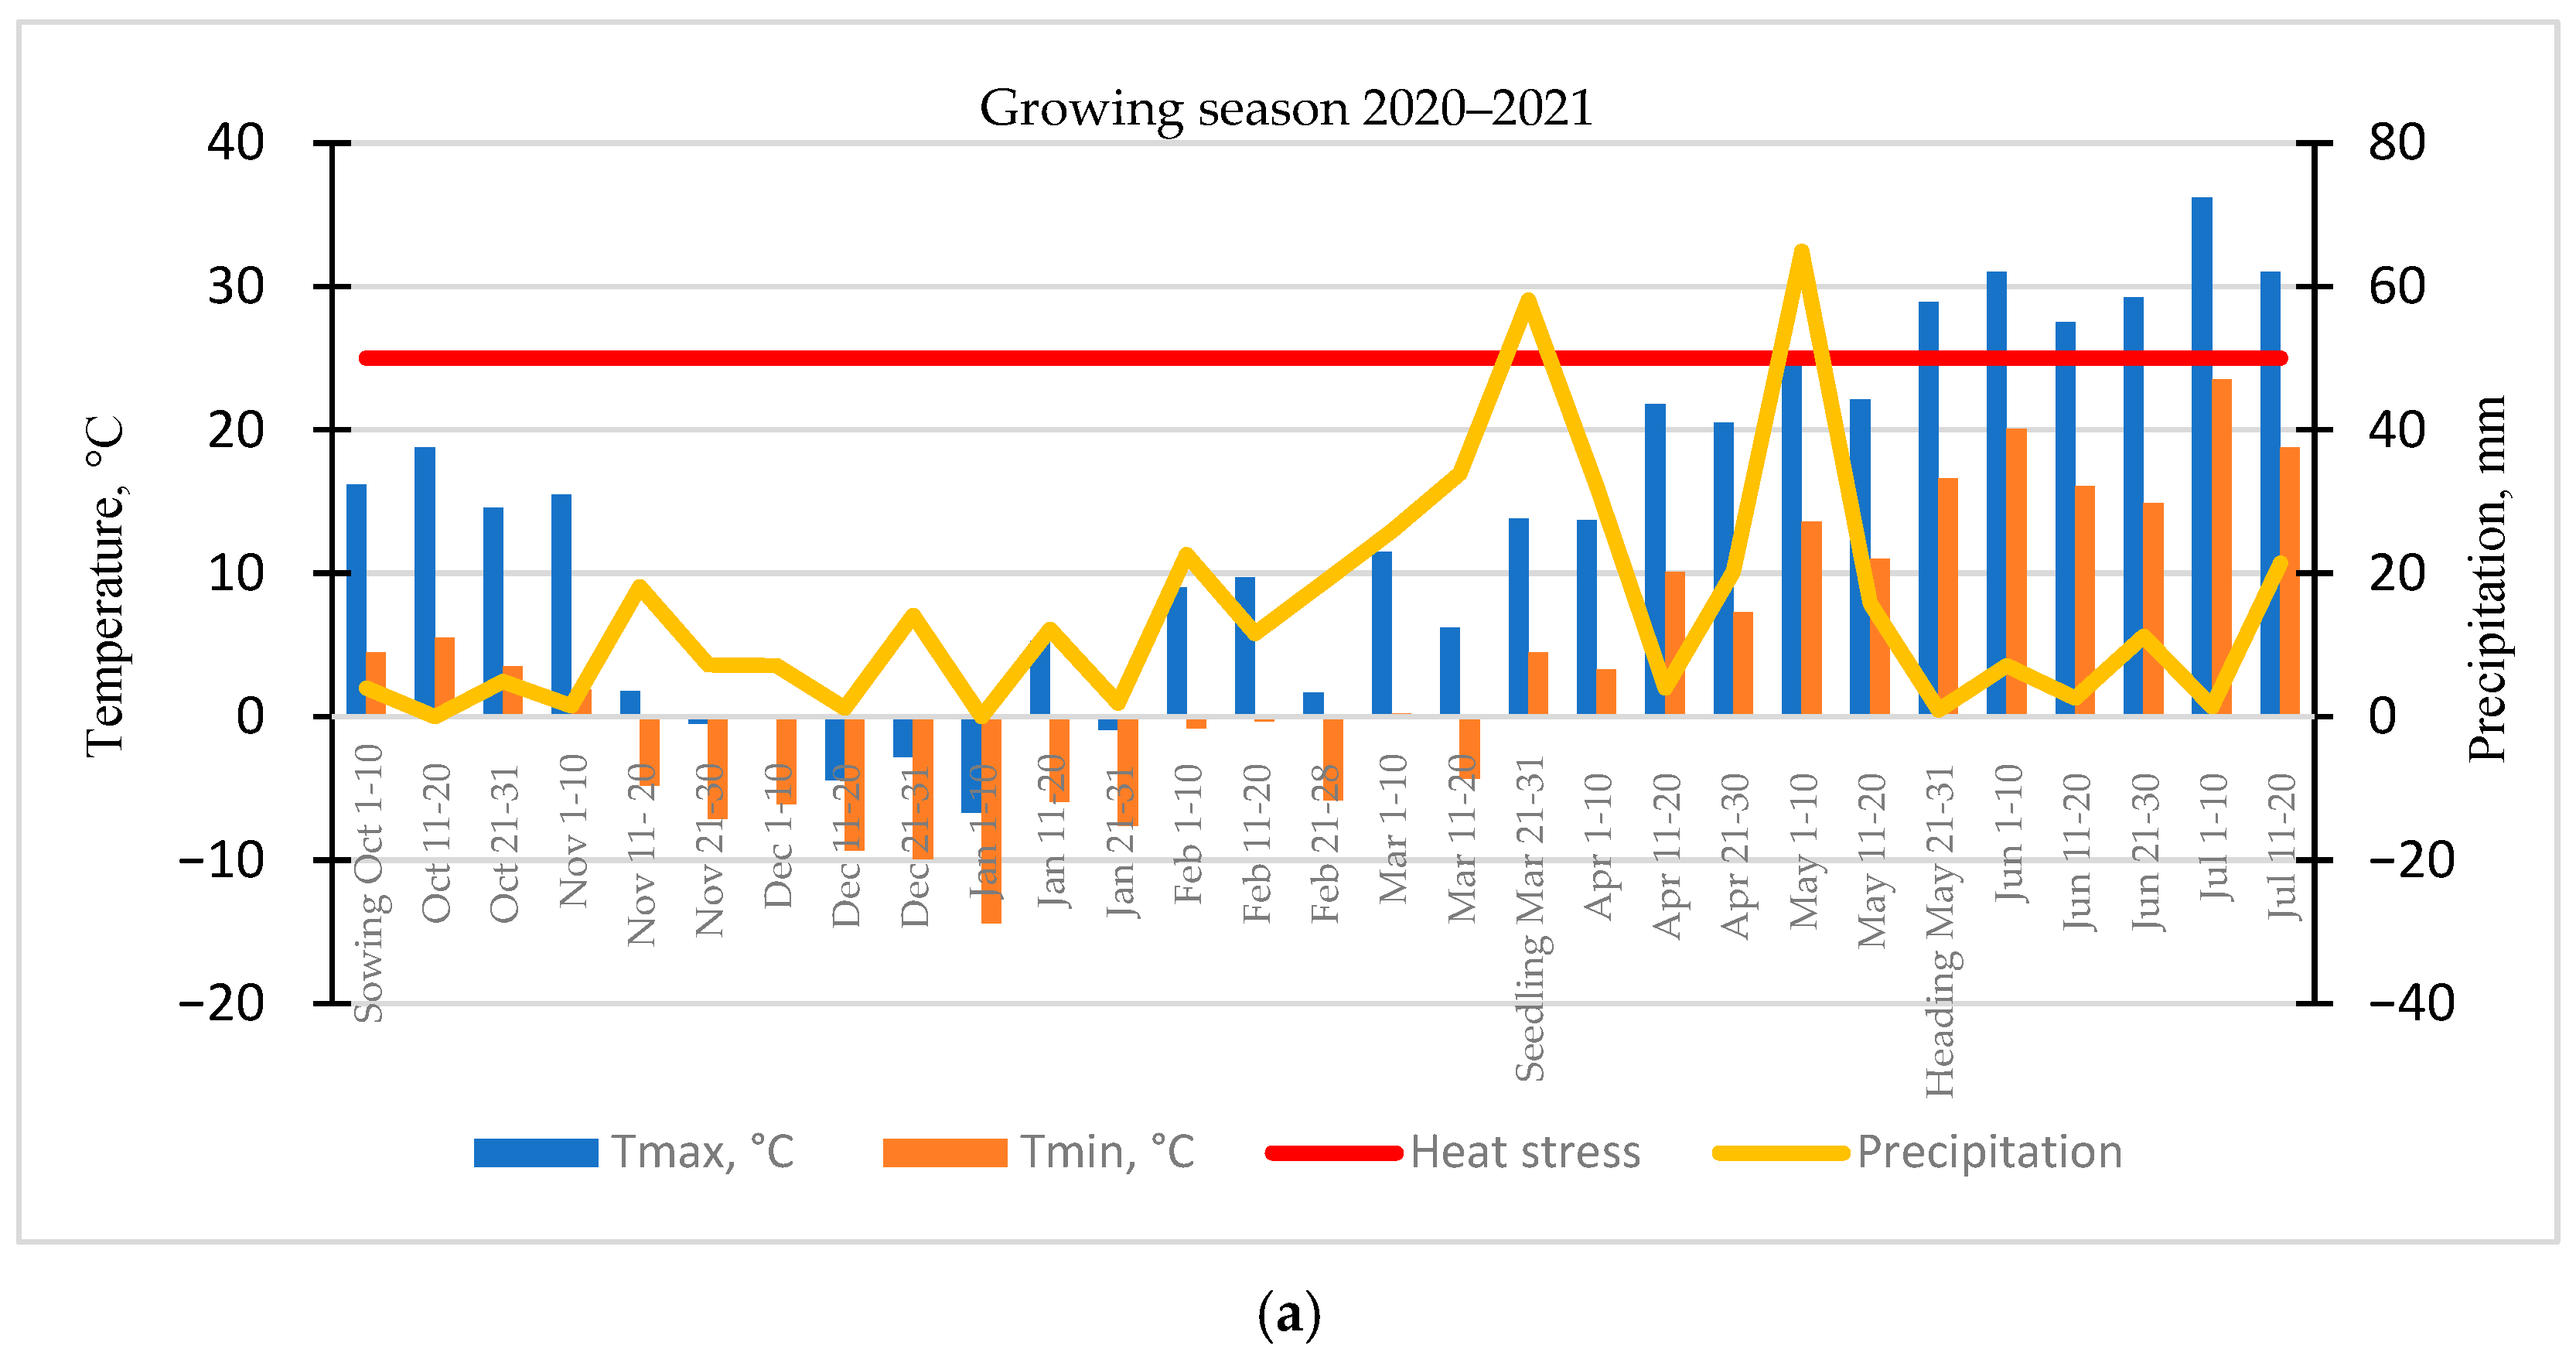
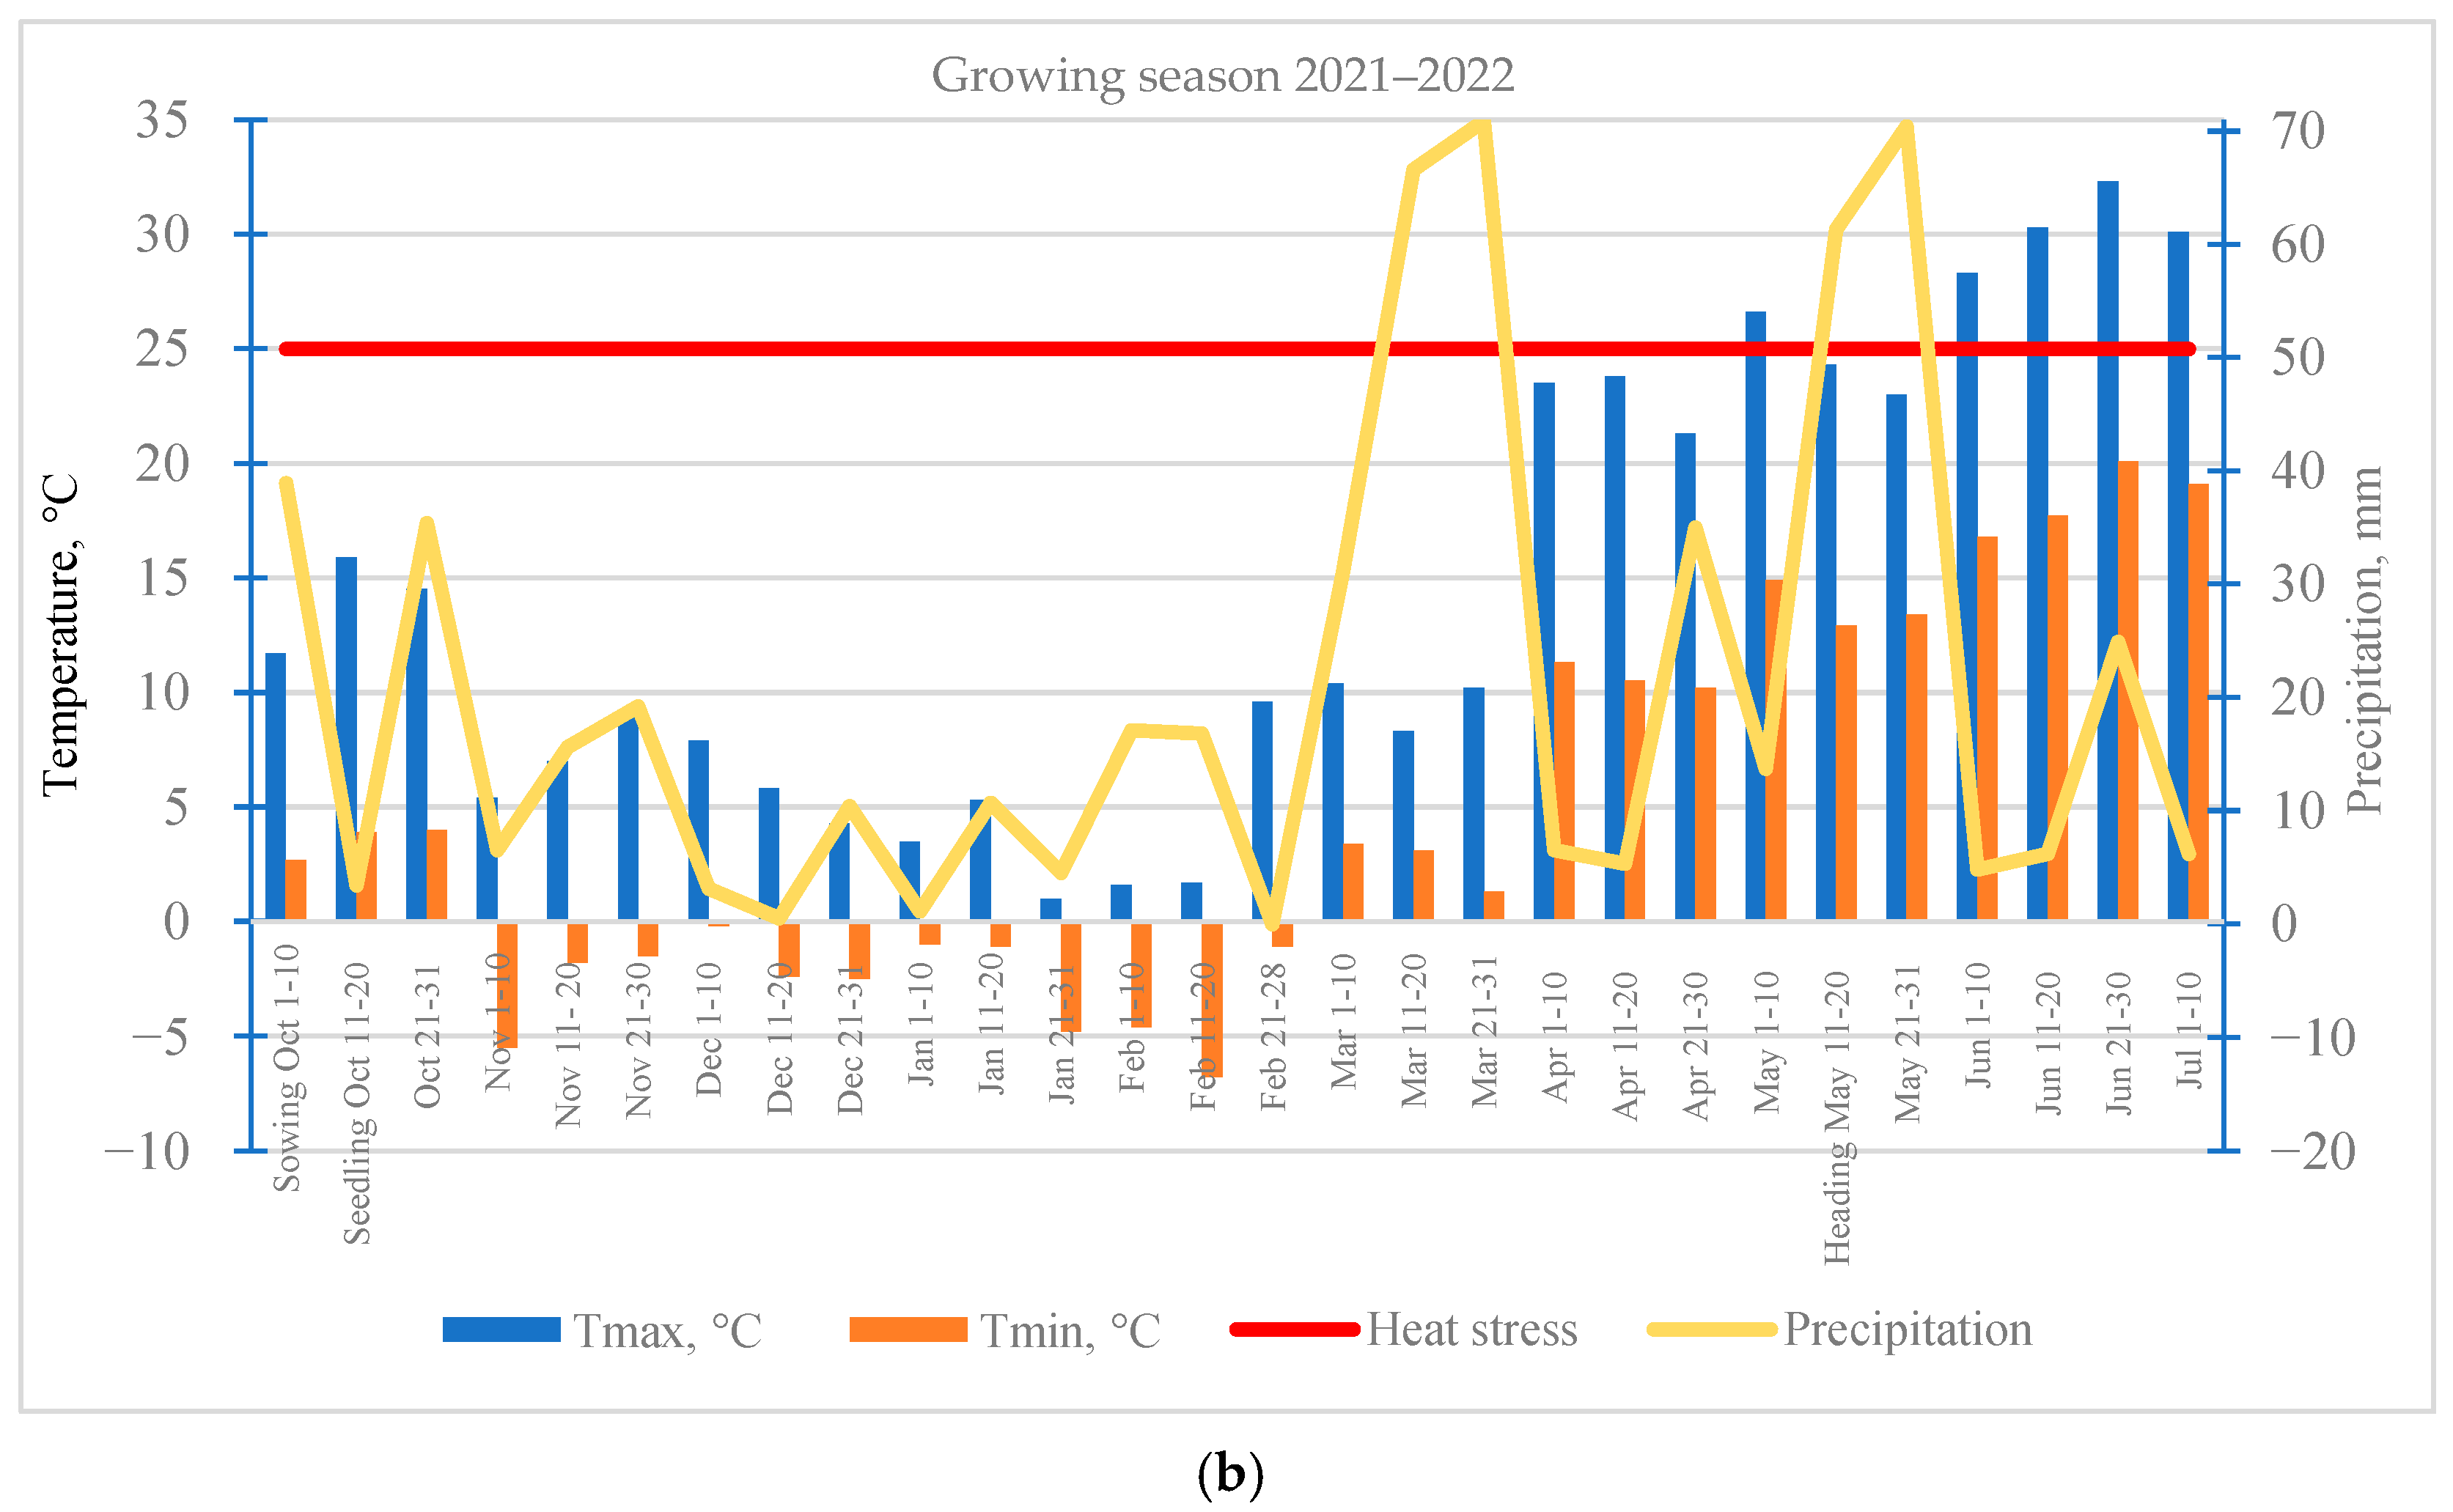
Studies to determine the effect of heat stress temperature on the development of winter wheat plants were conducted during the heading and ripening phases based on a comparative analysis of the growing seasons of 2020–2021 and 2021–2022, which differed in terms of the temperature regime during the spring–summer period of crop development. The threshold value of heat stress temperature in the heading and ripening phases of winter wheat in the study was set at 25 °C. Figure 5 shows the average temperatures and precipitation for the growing seasons of 2020–2021 (a) and 2021–2022 (b) from sowing to full ripening.
As can be seen in the graph (Figure 5a), from the third decade of May to August 2021, there was an increase in temperature (from 19.4 to 26.9 °C). The recorded temperature peaks exceeding the heat stress threshold coincided with the period of plant heading and continued until the end of the growing season (maturation). A comparative analysis of the heading–maturation period in the 2022 season showed (Figure 5b) a similar increase in the heat stress threshold temperature (from 19.0 to 26.5 °C). However, the difference in HDD (heat degree days, °C) between the two seasons during the heading periods was 12.8 °C (2021) and 4.9 °C (2022), and the stable trend of elevated temperatures in the 2021 season contributed to a high accumulation of HDD during the maturity period (34.2 °C) compared to 2022 (22.6 °C) (Table 6).

3.2. Agronomic Traits

In the southeastern region of Kazakhstan, winter wheat ripens in May and matures in June–July. Analysis of average HTC values during the ripening period (May) in the seasons analyzed showed no drought (1.01; 1.03; 1.91, respectively), weak drought according to SPI in 2020 (−0.27), and mild and moderate moisture in May 2021 and 2022 (0.58; 1.18, respectively). The maturity period was accompanied by moderate and severe drought according to the HTC (0.2; 0.4), mild and moderate aridity according to the SPI in 2021 and 2022 (−0.18; −1.22), and mild and severe moisture conditions in 2020 (0.43–1.58).
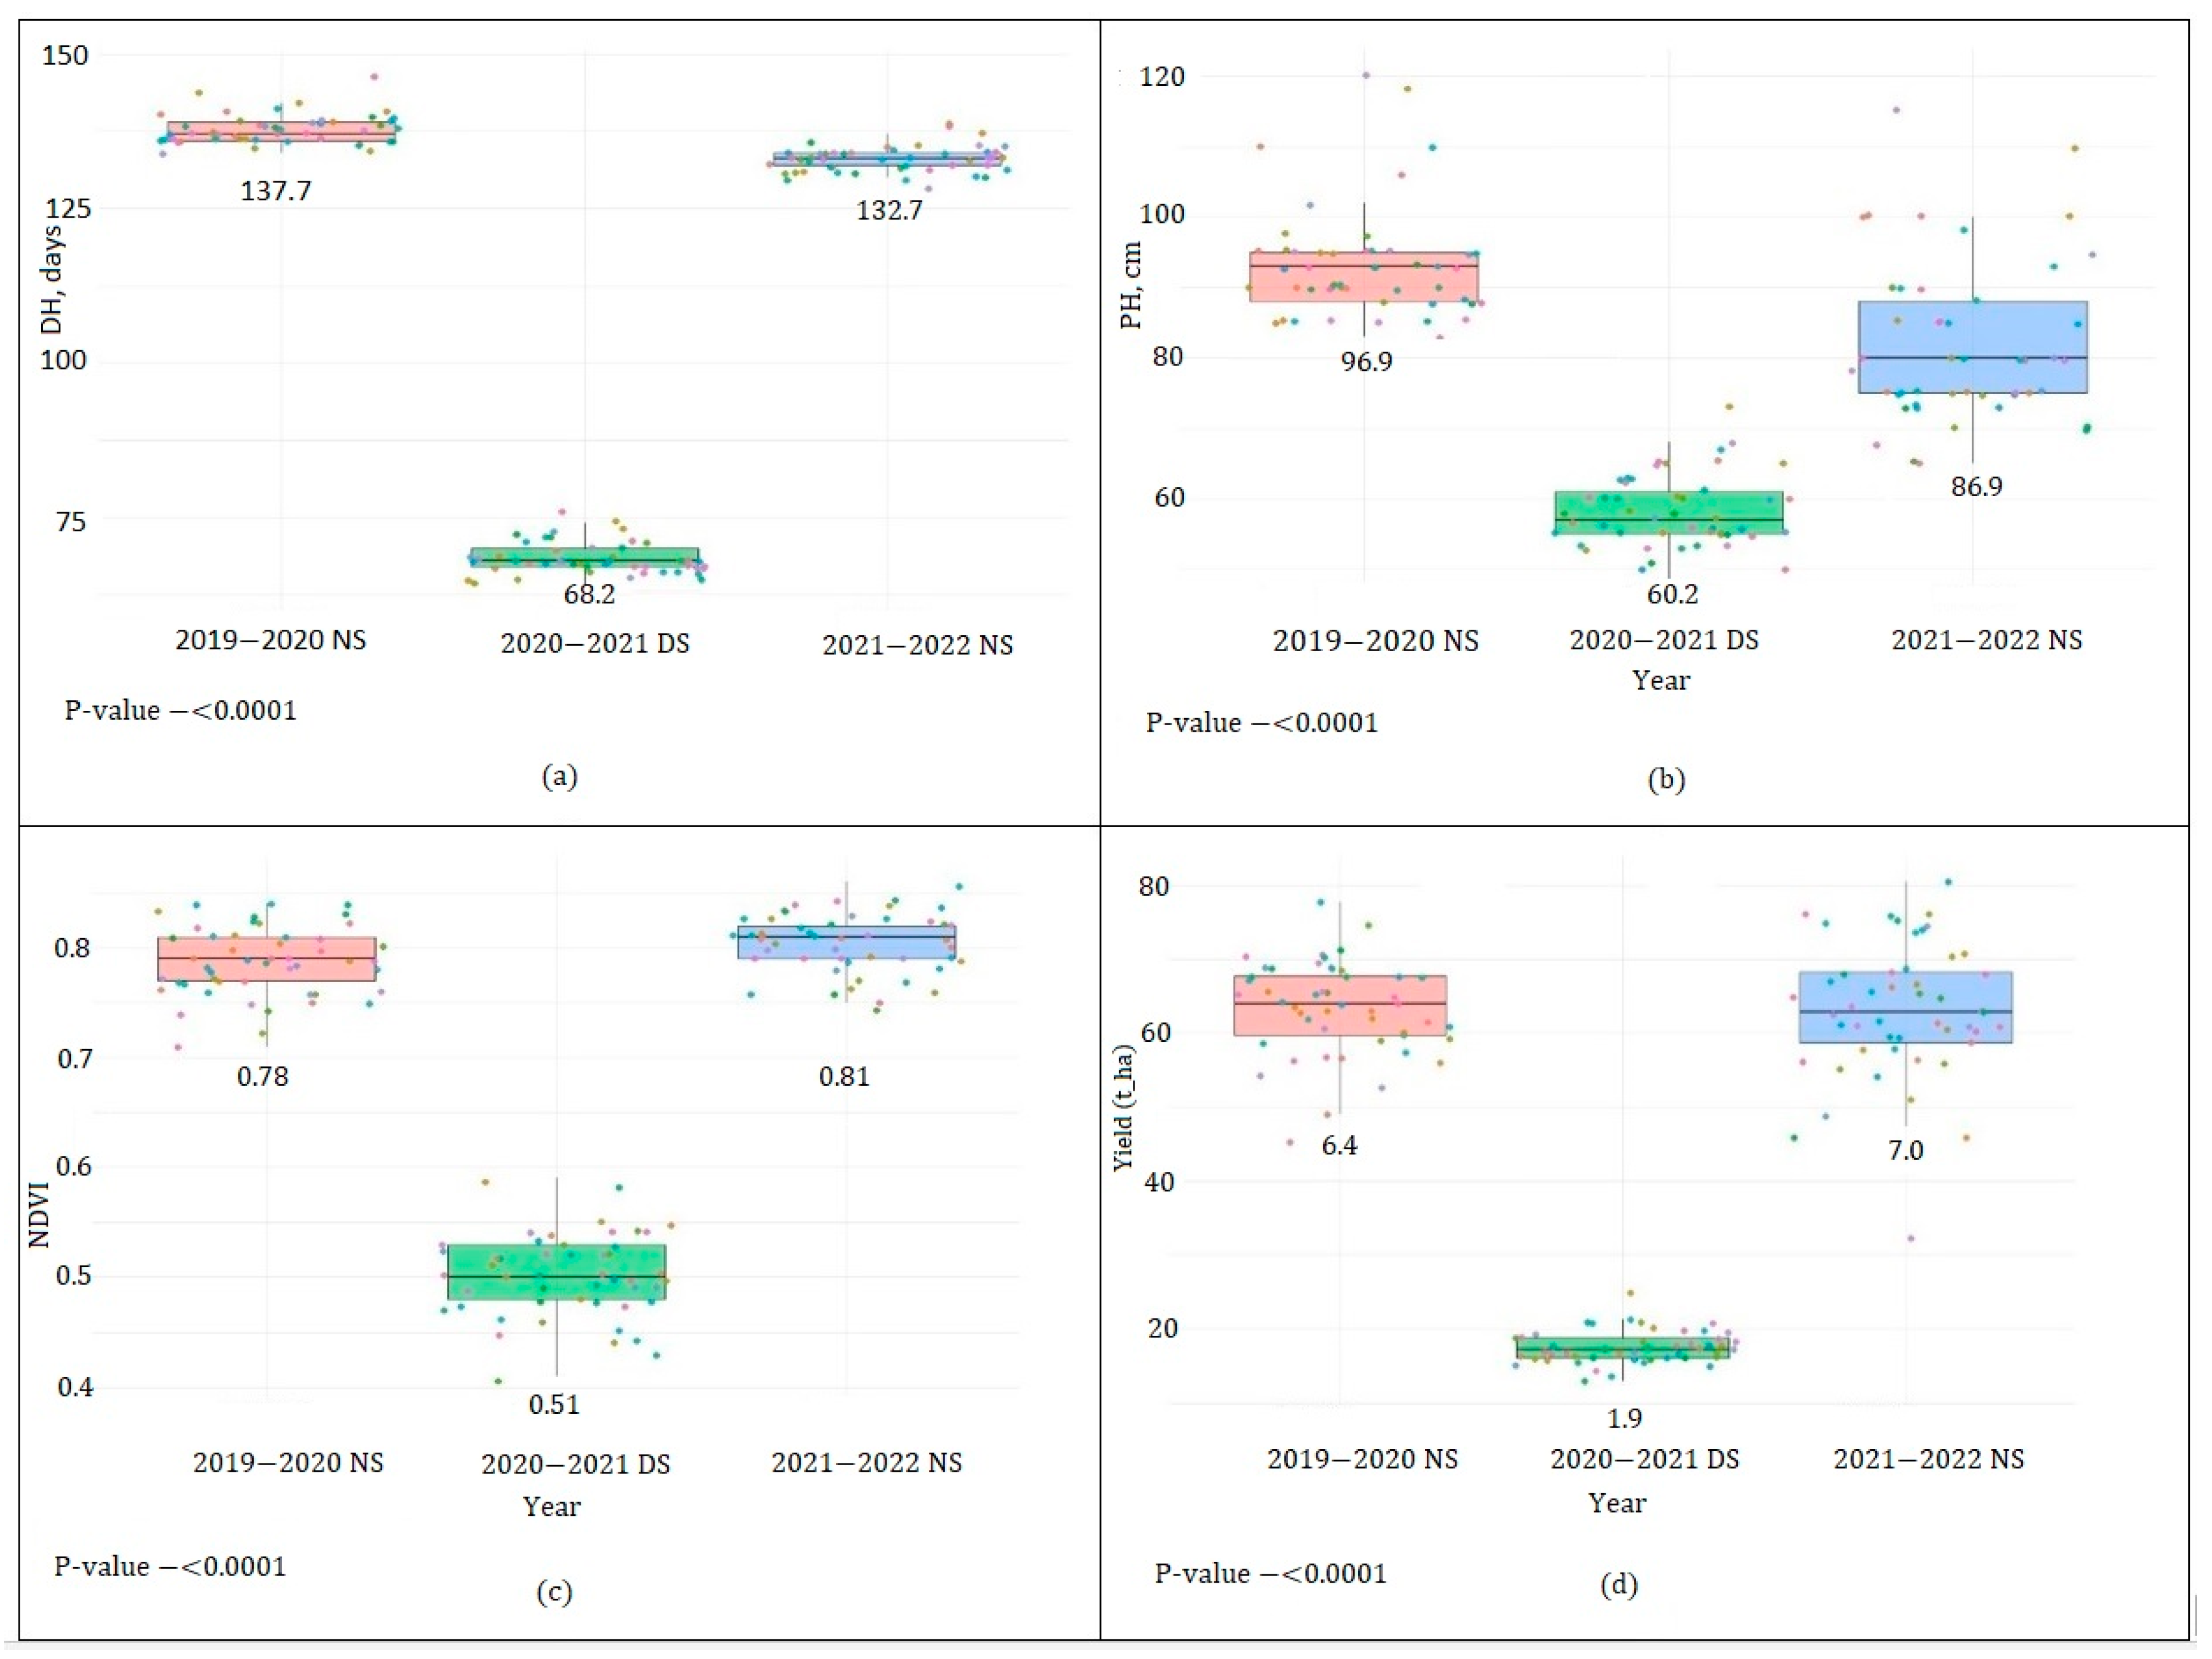
To assess the impact of meteorological conditions on the economically valuable traits of winter wheat, the dynamics of changes in dependent variables of productivity (duration of the days to heading (DH); plant height (PH); NDVI vegetation index value and yield) were analyzed over three growing seasons (non-stress (2019–2020), drought stress (2020–2021), non-stress (2021–2022)), as shown in Figure 6a–d.
Analysis of the dynamics of changes in biometric parameters revealed a sharp decrease in DH values, plant height, and yield in 2021 compared to 2020 and 2022 (Table 7, Figure 6). The results of the variance analysis revealed a statistically significant influence of the year on the agronomic characteristics of winter wheat (p < 0.001), which indicates a significant dependence of crop productivity on the conditions of the growing season.

3.2.1. Days to Heading

The abnormal drought in October 2020 (8.9 mm), defined as a “severe drought” according to the HTC (0.17), and the dryness of the autumn–winter period of 2020–2021 according to the SPI (−0.38; −0.85), affected the germination of winter wheat crops. Sprouting was observed in March 2021, which naturally affected the duration of the period until heading (DH, 68.2 days, Figure 6a), calculated from the emergence of shoots to 50.0–75% heading of the analyzed plots. In the relatively favorable growing seasons of 2019–2020 and 2021–2022, the DH was calculated in accordance with international practice from 1 January, resulting in 137.7 days (2020) and 132.7 days (2022), as shown in Table 7.

3.2.2. Plant Height

In 2019–2020, the collection nursery was characterized by predominantly medium-sized plants. Plant height in the nursery varied between 83 and 100 cm. The extreme agrometeorological conditions of the dry 2020–2021 period had a significant impact on plant height (Figure 6b). The average plant height was 68.2 cm (Table 7), with a range from 51 to 71 cm among the nursery accessions. In 2021–2022, plant height values were close to those of 2019–2020. The heights of plants of the standard variety, STEKLOVIDNAYA 24, in the years analyzed were 115.0 cm (2020), 68.0 cm (2021), and 115.0 cm (2022), respectively.

3.2.3. NDVI

Studies conducted during the heading stage of plants revealed significant variability in the NDVI vegetation index in accessions of winter wheat from the collection nursery. The average NDVI values were 0.78 in 2019–2020, 0.51 in 2020–2021, and 0.81 in 2021–2022 (Table 7). The decrease in NDVI values in the studied accessions during the 2020–2021 growing season demonstrated a statistically significant correlation between NDVI values and physiological parameters of plants, such as the duration of the period before heading, plant growth, and productivity during the analyzed growing season (Figure 6c).

3.2.4. Yield

Analysis of the yield of winter wheat accessions under varying agrometeorological conditions in Southeastern Kazakhstan for the period from 2019 to 2022 revealed significant variability. A significant decrease in yield was recorded under conditions of moisture deficit in 2020–2021, with SPI at −0.02 and HTC at 0.21 (Figure 6d). A 2–2.5-fold decrease in yield was observed in both the analyzed accessions and the commercial standard variety STEKLOVIDNAYA 24. The average yield in the nursery in a dry year was 1.9 t/ha, while in years with more favorable weather conditions, the yields were 6.4 t/ha and 7.0 t/ha, respectively (Table 7).

3.3. Statistical Assessment of Economically Valuable Characteristics

Correlation analysis (Table 8) revealed a strong positive correlation between the days to heading (DH) and plant height (correlation coefficient 0.84, p-value < 0.0001), as well as between yield and NDVI (correlation coefficient 0.82, p-value < 0.0001).
A positive correlation was observed between DH and NDVI (correlation coefficient 0.60, p-value < 0.01), as well as between DH and yield (correlation coefficient 0.56, p-value < 0.01). This indicates that accessions with longer days to heading (DH) tend to have higher NDVI values and higher yields. Moderate correlations were found between plant height and NDVI (correlation coefficient of 0.61, p-value < 0.01), as well as between plant height and yield (correlation coefficient of 0.55, p-value < 0.01).
The correlation coefficients between significant productivity variables (yield, DH, PH, and NDVI) were at confidence levels between 0.55 ** and 0.82 ***.
Assessment of the severity of economically valuable traits of winter wheat under conditions of no stress (NS, 2020) and drought (DS, 2021) revealed high sensitivity of the studied parameters to stress conditions (Table 9). The drought resistance index (DI) values calculated for individual traits reflect the pronounced depressing effect of drought, with 0.63 (PH), 0.63 (NDVI), and 0.50 (DH). The combined effect of these factors under stressful conditions had a significant impact on plant productivity, as confirmed by a DI value of 0.27 for yield.
A comparative analysis of the yield of winter wheat nursery accessions revealed individual genotypes that exceeded the local check for productivity under drought conditions. In particular, three accessions demonstrated a significant (≥10%) increase in yield above the STEKLOVIDNAYA 24 check during the dry growing season of 2020–2021, including BONITO-37…, LYMARIVNA, and OK12D22004-016. In a dry year, the selected genotypes were characterized by early heading (DH of 66–69 days; nursery average of 68.2 days); resistance to lodging (plant height of 55–73 cm; nursery average of 60.2 cm), which indicates a rapid transition to the generative phase; and a balanced level of photosynthetic activity (NDVI of 0.56–0.59, nursery average of 0.51) (Table 10).
Statistical analysis using the nonparametric Kruskal–Wallis test confirmed the presence of statistically significant differences in yield between the lines with promising productivity and the local check (p-value < 0.05). The genotype BONITO-37/MV10-2000… (TCI, 22IWWYT-SA) accession demonstrated a yield of 2.5 t/ha under moisture deficit conditions in 2021, which is 31.6% higher than the yield of the check STEKLOVIDNAYA 24 variety (Table 10).
For the genotype × environment analysis, the Eberhart and Russell stability model [34] was used, which is still currently used for quantitative assessment of the ecological plasticity and stability of varieties for various traits, including yield [52].
At the first stage, the environmental conditions were assessed using the environmental index (Ij). Positive environmental index values (1.60 and 1.46) were calculated for two growing seasons: 2019–2020 and 2021–2022, respectively. The dry growing season of 2020–2021, unfavorable for yield formation, had a negative environmental index value (Ij = −3.07). The “year” factor had the greatest influence on the variation in the “yield” trait (hx2 = 0.92). The “variety” factor had an insignificant effect (hx2 = 0.032). The “variety × year” interaction had a smaller effect, with an hx2 value of 0.015.

4. Discussion

According to the FAO [3], Kazakhstan is among the top ten wheat producers in the world, with 17.5 million hectares in 2020, accounting for 4% of global exports. To ensure food security and breeding programs in Kazakhstan, it is critical to understand how climate variability affects wheat yields, particularly winter wheat grown in Southern and Southeastern Kazakhstan (≥600,000 ha). This crop is extremely vulnerable to climate variability, with increased temperatures and a shortened photoperiod.
Meteorological conditions during the growing season have a critical impact on the yield of winter crops. Analysis of meteorological conditions in Southeastern Kazakhstan in 2019–2022 confirmed the previously established [19] steady trend of rising air temperatures. Average monthly temperatures exceeded long-term averages from (+2.9 °C) in 2020–2021 to (+4.6 °C) in 2021–2022, (+3.1 °C on average). The average monthly precipitation (574.2 mm) exceeded the long-term average by 149.7 mm.
The agrometeorological conditions of the analyzed growing seasons, which were generally favorable in terms of temperature and precipitation for the growth and development of winter wheat, showed differences in their severity during certain periods of crop development. HTC calculations showed that droughts in the area usually cover the summer and autumn seasons, last more than two months, and are persistent in nature.
The dry periods were characterized by atmospheric and soil drought, as well as elevated soil and air temperatures. Analysis of SPI values revealed short periods of mild drought (2020), sustained and prolonged drought (2021) throughout almost the entire period, and an intensification of drought from mild to moderate (2022). These results confirm the trend of decreasing precipitation in the summer and autumn months, as previously established by Karataev et al. [9] in Kazakhstan.
The negative correlation between the frequency of drought periods and winter wheat yield, identified in a number of studies, indicates a statistically significant effect of the year on the structural components of yield [53,54,55,56,57,58,59,60]. Assessing the variability and drought tolerance of key agronomic and physiological traits of wheat and screening germplasm resources for higher drought tolerance and yield stability are prerequisites for developing new, better-adapted wheat varieties.
Screening of 45 winter wheat accessions from international variety trials for drought tolerance was conducted in Southeastern Kazakhstan, where soil and climatic conditions have historically been more favorable for breeding research to assess the potential productivity of winter wheat under drought conditions and resistance to lodging and fungal diseases.
The abnormal drought recorded in October 2020 (8.9 mm of precipitation) and classified as “severe” according to the Selianinov HTC (0.17), as well as the dry conditions of the autumn–winter period of 2020–2021 (SPI = −0.38; −0.85), had a negative impact on the germination of winter wheat and the length of the growing season, with a reduction in the maximum daily temperature (MDT) by half (from 137.7 to 68.2 days).
This led to a decrease in (a) plant height by more than 30.0 cm and (b) yield by 72.3%. Under the drought conditions of 2020–2021, a heat stress threshold temperature (>+25 °C) was established. The sustained increase in temperature was reflected in the high accumulation of heat degree days (34.2 °C HDD) during the maturity period, which had a direct impact on wheat yield.
Low drought index (DI) values also confirmed the pronounced depressing effect of drought: 0.63 (DI PH); 0.63 (DI NDVI); 0.50 (DI DH); 0.27 (DI Yield). The NDVI vegetation index, widely used to assess vegetation condition and predict crop yields [61], also showed a decrease from 0.78 to 0.81 (2020, 2022) to 0.51 (2021), confirming the predictive value of NDVI, which is a sensitive indicator of plant response to agrometeorological conditions during a specific growing season. Strong positive correlations between the NDVI, growth indicators, and yield confirmed their value as stress indicators. This confirms that drought during critical phases of plant development significantly limits the realization of crop production potential.
For the genotype × environment analysis, the Eberhardt and Russell [34] stability model was used, which is still used today to quantitatively assess the ecological plasticity and stability of varieties for various traits, including yield. For two climatically favorable growing seasons (2019–2020 and 2021–2022), the environmental index (Ij) was positive at +1.60 and +1.46, respectively.
The dry growing season of 2020–2021, which was unfavorable for yield formation, had a negative environmental index (Ij = −3.07). The factor “year” had the greatest effect on the variation in the “yield” trait (hx2 = 0.92). The “variety” factor had a negligible effect (hx2 = 0.032). The interaction between “variety × year” had a smaller effect, with an hx2 value of 0.015. By analyzing the correlation coefficients between these traits, the traits that had the most significant effect on grain yield were identified.
As a result of three years of research (2019–2022), under drought conditions during the 2020–2021 growing season with a high negative environmental index (Ij = −3.07), three adaptive genotypes were selected: (1) BONITO-37/MV10-2000… (22IWWYT-SA), (2) LYMARIVNA (23IWWYT-IRR), and (3) OK12D22004-016 (23IWWYT-IRR), with yields of 5.3, 5.6, and 5.2 t/ha, respectively. These yields exceeded the productivity standard of the commercial variety of local breeding STEKLOVIDNAYA 24 by 15.4 to 22.8%. The correlation coefficient between significant productivity variables (yield, DH, PH, NDVI) was at a confidence level of 0.55 ** to 0.82 ***.
Analysis of climatic data (temperature and moisture supply) in combination with the use of meteorological indices for environmental assessment (SPI, HTC), phenotyping of productivity traits (DH, PH, yield), inclusion of physiological assessments (NDVI), and statistical data processing (genotype–environment, correlation relationships) make this work valuable for future breeding research in the region.
The current study had some limitations, such as only three experimental seasons, diverse but limited germplasm (45 entries), and one location. However, overall, the three-year (2019–2022) screening of winter wheat germplasm from international variety trials in the drought-resistant conditions of Southeastern Kazakhstan confirms regional empirical data on how climate variability affects winter wheat productivity. An adapted (drought-tolerant) germplasm has been identified that can be used in future breeding efforts to create climate-resistant wheat. In the context of global warming, screening wheat for drought resistance is crucial to ensuring the country’s food security.

5. Conclusions

Analysis of meteorological conditions for three growing seasons (2019–2021; 2021–2022; 2022–2023) based on temperature conditions in the foothills of the Zailiyskiy Alatau (Southeastern Kazakhstan, geographical data) is consistent with long-term climate forecasts by the IPCC and FAO for the Asian region. According to the Inter-Governmental Panel on Climate Change, global temperatures could rise by 2.7–4.8 °C by 2100 [8]. Regional climate trends from previous studies conducted in Kazakhstan for the period from 1950 to 2020 have also been confirmed [9].
The data from these studies in 2019–2022 show a steady increase in (1) the average annual temperature by +3.6 °C (+11.3 °C), with an average annual value in the zone of 7.6 °C, and (2) the total annual precipitation, which averaged 573.3 mm (average annual value of 424.5 mm). A comparison of SPI indices and HTC values for the period from 2019 to 2022 showed that both indicators demonstrated acceptable results when assessing climatic conditions in terms of moisture.
The data obtained indicate a prolonged drought period in the region, with the most pronounced manifestations in the autumn–winter and summer–autumn months. A comparison of temperature regimes during the “heading–ripening” period revealed that under the extreme vegetation conditions of 2020–2021, heat stress affected winter wheat throughout the entire period, whereas during the favorable vegetation period from 2021 to 2022, it affected only the ripening phase. A statistically significant influence of the year factor on the economically valuable traits of winter wheat was revealed (p < 0.001). A 3.4–3.7-fold decrease in yield under extreme conditions was noted, confirmed by the drought resistance index (0.27).
During the drought of 2020–2021, three adaptive genotypes were selected that exceeded the standard productivity by more than 10%. After three years of research, the drought-resistant accession BONITO-37/MV10-2000… (22IWWYT-SA) was selected, exceeding the yield (up to 31.6%) of the local commercial variety STEKLOVIDNAYA 24. This promising accession has been included in the breeding program of the Ministry of Agriculture of the Republic of Kazakhstan, “IRN BR24892821, Breeding and primary seed production of grain crops to increase the potential for productivity, quality, and stress resistance in various soil and climatic zones of Kazakhstan” for 2024–2026.
The information obtained as a result of the studies (1) confirms previously obtained data [16] on a steady trend towards rising temperatures in the southern regions of Kazakhstan, which classify this zone as a “very arid warm” region; (2) enables more accurate forecasting of the consequences of drought for agricultural production of important grain crops in Southeastern Kazakhstan, in particular, winter wheat in the foothills of the Zailiyskiy Alatau; and (3) improves the level of pre-breeding and breeding programs for winter wheat by the Ministry of Agriculture of Kazakhstan by including productive sources of drought resistance with early heading, resistance to lodging, and balanced levels of photosynthetic activity (NDVI 0.56–0.59), which indicates a rapid transition to a generative phase for the creation of climate-adapted varieties.
Author Contributions

Conceptualization, M.Y. and S.B.; Methodology, K.J.; Software, K.M.; Validation, M.Y. and A.M.; Formal analysis, S.B., K.J. and K.M.; Investigation, M.Y., K.J. and K.M.; Resources, M.Y. and A.M.; Data curation, K.J., M.Y. and K.M.; Writing—original draft, K.J.; Writing—review & editing, M.Y., S.B. and A.M.; Visualization, K.J. and K.M.; Supervision, M.Y. and S.B.; Project administration, M.Y.; Funding acquisition, M.Y. All authors have read and agreed to the published version of the manuscript.

Funding

The work was carried out within the framework of the 267 budget program “Increasing the availability of knowledge and scientific research” under subprogram 101 “Program-targeted financing of scientific research and activities” of the Ministry of Agriculture of the Republic of Kazakhstan under the program BR22885305, “Breeding and genetic of agrobiodiversity development technology (long-term storage, restoration, monitoring, rational use), as basic for improving RK breeding programs” for 2024–2026.

Data Availability Statement

The data are available from the authors upon request.

Acknowledgments

We express our sincere appreciation and gratitude to CIMMYT for providing the germplasm.

Conflicts of Interest

The authors declare no conflicts of interest.

Abbreviations

The following abbreviations are used in this manuscript:
SPIStandardized precipitation index
HTCHydrothermal coefficient of G.T. Selyaninov
HDDHeat degree days
DHDays to heading
PHPlant height
NDVINormalized difference vegetation index
DIDrought tolerance index

References

  1. Godfray, H.C.; Beddington, J.R.; Crute, I.R.; Haddad, L.; Lawrence, D.; Muir, J.F.; Pretty, J.; Robinson, S.; Thomas, S.M.; Toulmin, C. Food security: The challenge of feeding 9 billion people. Science 2010, 327, 812–818. [Google Scholar] [CrossRef]
  2. Martre, P.; Yin, X.; Frank, E. Modeling crops from genotype to phenotype in a changing climate. Field Crops Res. 2017, 202, 1–4. [Google Scholar] [CrossRef]
  3. Zhao, C.; Liu, B.; Piao, S.; Wang, X.; Lobell, D.; Huang, Y.; Huang, M.; Yao, Y.; Bassu, S.; Ciais, P.; et al. Temperature increase reduces global yields of major crops in four independent estimates. Proc. Natl. Acad. Sci. USA 2017, 114, 9326–9331. [Google Scholar] [CrossRef]
  4. Graziani, M.; Maccaferri, M.; Royo, C.; Salvatorelli, F.; Tuberosa, R. QTL dissection of yield components and morpho-physiological traits in a durum wheat elite population tested in contrasting thermo-pluviometric conditions. Crop Sci. Soc. 2014, 65, 80–95. [Google Scholar] [CrossRef]
  5. Asseng, S.; Cammarano, D.; Basso, B.; Chung, U.; Alderman, P.; Sonder, K.; Reynolds, M.; Lobell, D.B. Hot spots of wheat yield decline with rising temperatures. Global Change Biol. 2017, 23, 2464–2472. [Google Scholar] [CrossRef] [PubMed]
  6. Leng, G.; Hall, J. Crop yield sensitivity of global major agricultural countries to droughts and the projected changes in the future. Sci. Total Environ. 2019, 654, 811–821. [Google Scholar] [CrossRef] [PubMed]
  7. Food and Agriculture Organization of the United Nations. Statistical Yearbook—World Food and Agriculture; FAO: Rome, Italy, 2023. [Google Scholar]
  8. Intergovernmental Panel on Climate Change (IPCC). Climate change 2023: Synthesis report. In Contribution of Working Groups I, II and III to the Sixth Assessment Report of the Intergovernmental Panel on Climate Change; World Meteorological Organization: Geneva, Switzerland, 2023. [Google Scholar]
  9. Karatayev, M.; Clarke, M.; Salnikov, V.; Bekseitova, R.; Nizamova, M. Monitoring climate change, drought conditions and wheat production in Eurasia: The case study of Kazakhstan. Heliyon 2021, 8, e08660. [Google Scholar] [CrossRef]
  10. The United Nations. UN Framework Convention on Climate Change; The United Nations (UN): Washington, DC, USA, 2009. [Google Scholar]
  11. Dubovyk, O.; Ghazaryan, G.; Gonzalez, J.; Graw, V.; Low, F.; Schreier, J. Drought hazard in Kazakhstan in 2000–2016: A remote sensing perspective. Environ. Monit. Assess. 2019, 191, 510. [Google Scholar] [CrossRef]
  12. Schierhorn, F.; Hofmann, M.; Adrian, I.; Bobojonov, I.; Müller, D. Spatially varying impacts of climate change on wheat and barley yields in Kazakhstan. J. Arid Environ. 2020, 178, 104164. [Google Scholar] [CrossRef]
  13. Pavlova, V.N. Agroclimatic Resources of the Steppe Zone of the Republic of Kazakhstan and Russia Under Climate Change; Lomonosov Moscow State University: Moscow, Russia, 2022; 6p, (In Russian). Available online: https://link.springer.com/article/10.1134/S0001433825700999#:~:text=Abstract,of%20the%20macroregion%20remains%20significant. (accessed on 15 February 2025).
  14. National Statistics Bureau Agency for Strategic Planning and Reforms of the Republic of Kazakhstan 2025. (In Russian). Available online: https://stat.gov.kz/ru/industries/business-statistics/stat-forrest-village-hunt-fish/spreadsheets (accessed on 25 February 2025).
  15. Morgounov, A.; Ozdemir, F.; Keser, M.; Akin, B.; Payne, T.; Braun, H.J. International Winter Wheat Improvement Program: History, activities, impact and future. Front. Agric. Sci. Eng. 2019, 6, 240–250. [Google Scholar] [CrossRef]
  16. Urazaliev, R.A.; Zhangaziyev, A.S.; Nurbekov, S.I. Ecological selection of winter wheat varieties for the foothill and irrigated zones of the south and southeast of Kazakhstan and Central Asia (data from competitive and state variety testing for the period 1997–2007). Agromeridian Almaty 2008, 2, 33–41. [Google Scholar]
  17. Yesimbekova, M.A.; Morgunov, A.I.; Urazaliev, R.A. East European variety testing of winter wheat in Kazakhstan//Proceedings of the 1st Central Asian Conference on Wheat. Almaty 2003, 51–52. [Google Scholar]
  18. Salnikov, V.G.; Turulina, G.K.; Polyakova, S.E.; Petrova, E.E. Climate change and its regional manifestations in Kazakhstan. Hydrometeorol. Ecol. 2024, 2, 17–31. (In Russian) [Google Scholar]
  19. Centre for Emergency Situations and Disaster Risk Reduction. Study on Assessment of Drought Problems and Drought Monitoring Models in Central Asia. 2020. (In Russian). Available online: https://cesdrr.org/uploads/docs/2024/GENERAL%20ACTIVITY%20OUTCOMES.pdf (accessed on 3 March 2025).
  20. Amalova, A.; Yessimbekova, M.; Ortayev, A.; Baimagambetova, M.; Burakhodzha, A.; Abugalieva, S.; Turuspekov, E. Phenotypic variability of winter wheat collection from Central Asia grown in Kazakhstan. Exp. Biol. 2023, 96, 82–90. [Google Scholar] [CrossRef]
  21. Turebayeva, S.; Zhapparova, A.; Yerkin, A.; Aisakulova, K.; Yesseyeva, G.; Bissembayev, A.; Saljnikov, E. Productivity of rainfed winter wheat with direct sowing and economic efficiency of diversified fertilization in arid region of South Kazakhstan. Agronomy 2022, 12, 111. [Google Scholar] [CrossRef]
  22. Stalker, H.T.; Chapman, C. Scientific Management of Germplasm: Characterization, Evaluation and Enhancement; IPGRI: Rome, Italy, 1998. [Google Scholar]
  23. Dorofeev, V.A. Methodical Guidelines for the Study of the World Collection of Wheat; VIR Printing House: Leningrad, USSR, 1973. [Google Scholar]
  24. Temirbekova, S.; Kulikov, I.; Ionova, N.; Afanasyeva, Y.; Kalashnikova, E. Study of genetic resources of winter wheat and identification of sources with drought resistance for use in breeding and production. Bull. Russ. Agric. Sci. 2023, 2, 4–12. [Google Scholar]
  25. Available online: https://www.cpc.ncep.noaa.gov/products/Drought/Monitoring/spi-global.shtml?utm_source (accessed on 3 March 2025).
  26. Ionova, E.V.; Likhovidova, V.A.; Lobunskaya, I.A. Drought and hydrothermal humidity factor as one of the criteria to estimate its intensity degree (literature review). Grain Econ. Russ. 2019, 6, 18–22. [Google Scholar] [CrossRef]
  27. Liu, B.; Asseng, S.; Liu, L.; Tang, L.; Cao, W.; Zhu, Y. Testing the responses of four wheat crop models to heat stress at anthesis and grain filling. Glob. Change Biol. 2016, 22, 1890–1903. [Google Scholar] [CrossRef] [PubMed]
  28. de Micheaux, P.L.; Drouilhet, R.; Liquet, B. The R Software: Fundamentals of Programming and Statistical Analysis; Springer Science & Business: Berlin/Heidelberg, Germany, 2014; Volume 40, pp. 563–565. [Google Scholar]
  29. Yarberry, W. Dplyr. In CRAN Recipes: DPLYR, Stringr, Lubridate, and Regex in R. Berkeley; Apress: Berkeley, CA, USA, 2021; pp. 1–58. [Google Scholar]
  30. Wickham, H.; Wickham, M.H. Package ‘tidyr’. 2017. Available online: https://cran.uni-muenster.de/web/packages/tidyr/tidyr.pdf (accessed on 22 October 2025).
  31. Wickham, H. ggplot2. Wiley Interdiscip. Rev. Comput. Stat. 2011, 3, 180–185. [Google Scholar] [CrossRef]
  32. Aphalo, P.J. OpenIntro Statistics, 3ed by David M. Diez, Christopher D. Barr and Mine Çetinkaya-Rundel. UV4 Plants Bull 2017, 2016, 51–53. [Google Scholar] [CrossRef]
  33. Bouslama, M.; Schapaugh, W.T. Stress tolerance in soybeans. I. Evaluation of three screening techniques for heat and drought tolerance. Crop Sci. 1984, 24, 933–937. [Google Scholar] [CrossRef]
  34. Eberhart, S.A.; Russel, W.A. Stability Parameters for Comparing Varieties. Crop Sci. 1966, 6, 36–40. [Google Scholar] [CrossRef]
  35. Available online: https://climateknowledgeportal.worldbank.org/country/kazakhstan/climate-data-historical (accessed on 28 July 2025).
  36. Bong, C.H.J.; Richard, J. Drought and climate change assessment using Standardized Precipitation Index (SPI) for Sarawak River Basin. J. Water Clim. Change 2020, 11, 956–965. [Google Scholar] [CrossRef]
  37. He, Y.; Ye, J.; Yang, X. Analysis of the spatio-temporal patterns of dry and wet conditions in the Huai River Basin using the standardized precipitation index. Atmos. Res. 2015, 166, 120–128. [Google Scholar] [CrossRef]
  38. Jenkins, K.; Warren, R. Quantifying the impact of climate change on drought regimes using the Standardised Precipitation Index. Theor. Appl. Climatol. 2015, 120, 41–54. [Google Scholar] [CrossRef]
  39. Podlipenskaya, L.E.; Kusayko, N.P.; Ladysh, I.A.; Dolgikh, E.D. Monitoring of hydrological droughts based on the results of long-term data of the Lugansk city hydrometeorology center. Ecol. Bull. Donbass 2021, 2, 83–91. (In Russian) [Google Scholar]
  40. Bacanli, Ü.G. Trend analysis of precipitation and drought in the Aegean region, Turkey. Meteorol. Appl. 2017, 24, 239–249. [Google Scholar] [CrossRef]
  41. Kozhakhmetov, P.Z.; Iskakov, E.A.; Baibazarov, D.K. Using the Standardized Precipitation Index (SPI) to Identify Droughts in Kazakhstan. Hydrometeorol. Ecol. 2016, 1, 22–31. (In Russian) [Google Scholar]
  42. Salmin, A.S.; Asaulyak, I.F.; Belolyubtsev, A.I. Time series analysis of the standardized precipitation index (SPI). Adv. Mod. Nat. Sci. 2021, 5, 101–109. (In Russian) [Google Scholar]
  43. Zandalinas, S.I.; Mittler, R.; Balfagón, D.; Arbona, V.; Gómez-Cadenas, A. Plant adaptations to the combination of drought and high temperatures. Physiol. Plant. 2018, 162, 2–12. [Google Scholar] [CrossRef] [PubMed]
  44. Akter, N.; Rafiqul Islam, M. Heat stress effects and management in wheat. A review. Agron. Sustain. Dev. 2017, 37, 37. [Google Scholar] [CrossRef]
  45. Pan, X.; Chin, M.; Ichoku, C.; Field, R.D. Connecting Indonesian fires and drought with the type of El Niño and phase of the Indian Ocean Dipole during 1979–2016. J. Geophys. Res. Atmos. 2018, 123, 7974–7988. [Google Scholar] [CrossRef]
  46. Djanaguiraman, M.; Narayanan, S.; Erdayani, E.; Prasad, P.V.V. Effects of high temperature stress during anthesis and grain filling periods on photosynthesis, lipids and grain yield in wheat. BMC Plant Biol. 2020, 20, 268. [Google Scholar] [CrossRef] [PubMed]
  47. Mathur, S.; Agrawal, D.; Jajoo, A. Photosynthesis: Response to high temperature stress. J. Photochem. Photobiol. B Biol. 2014, 137, 116–126. [Google Scholar] [CrossRef]
  48. Farooq, M.; Bramley, H.; Palta, J.A.; Siddique, K.H.M. Heat stress in wheat during reproductive and grain-filling phases. Crit. Rev. Plant Sci. 2011, 30, 491–507. [Google Scholar] [CrossRef]
  49. Feng, B.; Liu, P.; Li, G.; Dong, S.T.; Wang, F.H.; Kong, L.A.; Zhang, J.W. Effect of heat stress on the photosynthetic characteristics in flag leaves at the grain-filling stage of different heat-resistant winter wheat varieties. J. Agron. Crop Sci. 2014, 200, 143–155. [Google Scholar] [CrossRef]
  50. Ullah, A.; Nadeem, F.; Nawaz, A.; Siddique, K.H.M.; Farooq, M. Heat stress effects on the reproductive physiology and yield of wheat. J. Agron. Crop Sci. 2022, 208, 1–17. [Google Scholar] [CrossRef]
  51. Groli, E.L.; Frascaroli, E.; Maccaferri, M.; Ammar, K.; Tuberosa, R. Dissecting the effect of heat stress on durum wheat under field conditions. Front. Plant Sci. 2024, 15, 1393349. [Google Scholar] [CrossRef]
  52. Parfenova, E.; Utkina, E.; Kedrova, L.; Psareva, E. Ecological Plasticity and Stability of Winter Rye Yield in the Kirov Region. Available online: https://cyberleninka.ru/article/n/ekologicheskaya-plastichnost-i-stabilnost-sortov-ozimoy-rzhi-po-regeneratsionnoy-sposobnosti-i-urozhaynosti-v-kirovskoy-oblasti (accessed on 21 June 2025).
  53. Dubovik, D.V.; Vinogradov, D.Y. The influence of climatic conditions of the year on the yield of winter wheat. Bul. Kursk. State Agric. Acad. 2012, 7. Available online: https://cyberleninka.ru/article/n/vliyanie-klimaticheskih-usloviy-goda-na-urozhaynost-ozimoy-pshenitsy (accessed on 11 January 2025). (In Russian).
  54. Lüttger, A.B.; Feike, T. Development of heat and drought related extreme weather events and their effect on winter wheat yields in Germany. Theor. Appl. Climatol. 2018, 132, 15–29. [Google Scholar] [CrossRef]
  55. Hunt, E.; Femia, F.; Werrell, C.; Christian, J.I.; Otkin, J.A.; Basara, J.; Anderson, M.; White, T.; Hain, C.; Randall, R.; et al. Agricultural and food security impacts from the 2010 Russia flash drought. Weather Clim. Extrem. 2021, 34, 100383. [Google Scholar] [CrossRef]
  56. Kenenbayev, S.; Yessenbayeva, G.; Zhanbyrbayev, Y.; Bekturganov, A.; Dutbayev, Y.; Toktay, H. Influence of Climate Conditions and Biofertilizers on Soybean Yield in Southeastern Kazakhstan. Int. J. Des. Nat. Ecodyn. 2023, 18, 1391–1398. [Google Scholar] [CrossRef]
  57. Glukhovtsev, V.V. Spring barley in the Middle Volga region (selection, agricultural technology, varieties). Samara 2001, 11–12, 72–75. (In Russian) [Google Scholar]
  58. Vas’ko, N.I.; Naumov, A.G.; Solonechny, P.N.; Vazhenina, O.E.; Solonechnaya, O.V.; Zimoglyad, A.V. Dependence of the duration of interphase periods and the yield of spring barley on weather conditions. Bul. Belarusian State Agric. Acad. 2017, 4, 77–81. (In Russian) [Google Scholar]
  59. Bisharev, A.A.; Shevchenko, S.N.; Madyakin, E.V.; Kalyakulina, I.A.; Dyuldina, M.A.; Dvortsova, T.V. The influence of agrometeorological conditions on the yield of spring barley grain in the Middle Volga region. Bul. Samara Sci. Cent. Russ. Acad. Sci. 2018, 20, 667–670. (In Russian) [Google Scholar]
  60. Sharma, B.; Yadav, L.; Shrestha, A.; Shrestha, S.; Subedi, M.; Subedi, S.; Shrestha, J. Drought stress and its management in wheat (Triticum aestivum L.): A review. Agr. Sci. Technol. 2022, 14, 3–14. Available online: https://api.semanticscholar.org/CorpusID:247996037 (accessed on 22 October 2025). [CrossRef]
  61. Morgounov, A.; Gummadov, N.; Belen, S.; Keser, M.; Mursalova, J. Association of digital photo parameters and NDVI with winter wheat grain yield in variable environments. Turk. J. Agric. For. 2014, 38, 624–632. [Google Scholar] [CrossRef]
Figure 1. Distribution map of the average annual temperature in Southern and Southeastern Kazakhstan, 1991–2020.
Crops 05 00076 g001
Figure 2. Distribution map of precipitation in Southern and Southeastern Kazakhstan, 1991–2020.
Crops 05 00076 g002
Figure 3. Average monthly deviations in (a) temperature, °C, and (b) amount of precipitation, mm, from the average long-term values for 2019–2022.
Crops 05 00076 g003
Figure 4. Dynamics of changes in the amount of monthly precipitation during the growing seasons of 2019–2022 (“KazRIAPG” LLP, Almaty region).
Crops 05 00076 g004
Figure 5. Average maximum and minimum air temperatures, average precipitation during the winter wheat growing seasons of 2020–2021 (a) and 2021–2022 (b).
Crops 05 00076 g005aCrops 05 00076 g005b
Figure 6. The effects of the year factor on (a) days to heading (DH); (b) plant height (PH); (c) the vegetation index (NDVI); and (d) yield, 2020–2022.
Crops 05 00076 g006
Table 1. List of winter bread wheat accessions.
Original #NameCountryInternational Nursery
9806KROSHKA/4/VORONA//MILAN/SHA7/3/MV17TCI23IWWYT-IR
9807KROSHKA/GONDVANATCI23IWWYT-IR
9808PATWIN YR15/L 4224 K 12TCI23IWWYT-IR
9809PRL/2*PASTOR/3/KS82W409/SPN//TAM106/TX78V3630TCI23IWWYT-IR
9810KINGBIRD/BILINMIYEN96.7TCI23IWWYT-IR
9811PBW343/HUITES/4/YAR/AE.SQUARROSA (783)//…TCI23IWWYT-IR
9812NIKIFOR/KROSHKATCI23IWWYT-IR
9813BABAX/LR42//BABAX*2/3/KURUKU/…TCI23IWWYT-IR
9814F498U1-1021/BOEMA/3/KS96HW94//…TCI23IWWYT-IR
9815VICTORYA/4/WBLL1/3/TSI/VEE#5//…TCI23IWWYT-IR
9816NEMURA/CRDN//78014.40/3/ATTILA/…MX-TCI23IWWYT-IR
9817TX71A983.4/TX69D4812//PYN/3/VPM/MOS83.11.4.8//…TCI23IWWYT-IR
9818MV22-2000/3/AGRI/NAC//KAUZTCI23IWWYT-IR
9819KROSHKA/4/VORONA//MILAN/SHATCI23IWWYT-IR
9820PATWIN YR15/L 4224 K 12TCI23IWWYT-IR
9823OBRII/DNESTREANCA25//ILICIOVCA/…TCI23IWWYT-IR
9824ZNAKHIDKA/EKIZTCI23IWWYT-IR
9825CROC_1/AE.SQUARROSA (205)//KAUZ/3/LUFER/…TCI23IWWYT-IR
9826WAXWING*2//PBW343*2/KUKUNA/…US-OK-TCI23IWWYT-IR
9827WAXWING*2/KUKUNA//GREER ‘S’/5/HKK/…US-OK-TCI23IWWYT-IR
9828SUNCO/2*PASTOR/3/KS89180B-2-1-1/…US-OK-TCI23IWWYT-IR
9830PFAU/SERI.1B//AMAD/3/KRONSTAD F20094/…TUR-TE23IWWYT-IR
9831DORADE-5/3/SHI#4414/CROW//GK SAGVARI/CA8055TUR-TE23IWWYT-IR
9833KAZAKHSTANSKAYA25/TR.TIMOPHEEVI-1KAZ23IWWYT-IR
9834SUAROGRUS-KRASN23IWWYT-IR
9835BEZOSTAYA 100RUS-KRASN23IWWYT-IR
9836CH-111.15797SWZ23IWWYT-IR
9837ZAPASHNAUKR-KHARK23IWWYT-IR
9838BLAHOUKR-KHER23IWWYT-IR
9839LYMARIVNAUKR23IWWYT-IR
9840GREER/KANMARKUSA-KSU23IWWYT-IR
9841KS031009K-4/KS060142-K-4USA-KSU23IWWYT-IR
9842KS040477K-12/GALLAGHERUSA-KSU23IWWYT-IR
9843KS031009K-4/KS060285-M-1USA-KSU23IWWYT-IR
9844KS050255K-6/KANMARKUSA-KSU23IWWYT-IR
9845YELLOWSTONEUSA-MSU23IWWYT-IR
9846OK14319USA-OKSU23IWWYT-IR
9847OK12D22004-016USA-OKSU23IWWYT-IR
9848STARDUSTUSA-OKSU23IWWYT-IR
9849OVERLAND FHB1-10USA-UNL23IWWYT-IR
9850SY SUNRISEUSA-SYN23IWWYT-IR
9907BONITO-37/MV10-2000/3/SHI#4414/CROWS”//…TCI22IWWYT-SA
9915CBRD/TNMU//MILAN/SHA7/3/AGRI/NAC//ATTILA/…TCI22IWWYT-SA
9922NIKIFOR/KROSHKATCI22IWWYT-SA
9932WHEAR//INQALAB 91*2/TUKURU/3/AP01T2421/…US-OK-TCI22IWWYT-SA
STEKLOVIDNAYA 24 (LOCAL CHECK)KAZ
Table 2. Drought classification by SPI values.
SPI ValuesCategory
2.00 and aboveExtreme moisture
From 1.5 to 1.99Strong moisture data
From 1.00 to 1.49Moderate moisture
From 0.0 to 0.99Mild moisture
From 0.0 to −0.99Mild drought
From −1.00 to −1.49Moderate drought
From −1.5 to −1.99Severe drought
−2.00 and belowExtreme drought
Table 3. Meteorological data for the research years (2019–2022) compared to long-term average values (Almalybak, Almaty Region).
Growing SeasonSep.Oct.Nov.Dec.Jan.Feb.Mar.Apr.MayJun.Jul.Aug.Per Year
Average long-term temperature values, °C16.08.3−0.9−7.8−10.8−8.50.710.416.421.224.122.17.6
Average daily air temperature, °C2019–202018.611.51.2−0.8−2.91.86.414.218.716.524.424.111.1
2020–202116.89.80.2−6.2−5.91.84.112.419.423.126.924.010.5
2021–202220.57.91.11.300.85.816.719.024.326.522.612.2
Average annual precipitation values, mm25.929.130.129.119.821.948.856.561.653.926.621.2424.5
Amount of atm. precipitation, mm2019–202067.244.732.650.116.774.052.7146.773.542.638.143.7686.2
2020–202121.28.926.814.114.152.9117.956.381.620.922.827.2464.7
2021–20221.677.741.314.016.333.9168.646.8145.435.915.18.2568.9
Table 4. Standardized precipitation index (SPI) values for 2019–2022.
Growing SeasonSep.Oct.Nov.Dec.Jan.Feb.Mar.Apr.MayJun.Jul.Aug.
2019–20201.42−0.56−0.61.72−0.431.34−0.650.75−0.270.431.580.35
2020–20210.36−0.38−0.85−0.58−0.810.040.62−0.850.58−0.62−0.18−0.14
2021–2022−1.011.71−0.28−0.59−0.49−1.481.28−1.111.18−1.22−1.2−1.49
Note
Strong moistureModerate moistureMild moistureMild DroughtModerate Drought
Table 5. Hydrothermal coefficients of humidification of G.T. Selyaninov (according to the meteorological station of “KazRIAPG” LLP) for 2019–2022.
Growing SeasonSep.Oct.Nov.Dec.Jan.Feb.Mar.Apr.MayJun.Jul.Aug.
2019–20200.900.801.934.54.93.61.342.481.010.510.40.47
2020–20210.30.171.591.871.692.63.61.011.030.240.20.28
2021–20220.021.21.90.761.653.095.660.681.910.520.20.09
Average per month0.410.721.812.382.753.103.531.391.320.420.270.28
Table 6. The number of heat degree days (HDDs) accumulated during the heading (HD) and maturity (DTM) periods of winter wheat accessions in 2021 and 2022.
Plant Development PhaseHDD, °C/Years
20212022
Heading period12.84.9
Ripening period34.222.6
Table 7. The effects of growing season conditions on agronomic traits of winter wheat accessions, 2019–2022.
Growing SeasonDH, DaysPH, cmNDVIYield, t/ha
2019–2020137.7 ± 0.3696.9 ± 1.090.78 ± 0.0016.4 ± 0.08
2020–202168.2 ± 0.3960.2 ± 0.760.51 ± 0.011.9 ± 0.03
2021–2022132.7 ± 0.3186.9 ± 1.60.81 ± 0.0017.0 ± 0.14
Kruskal–Wallis chi-squared, p-value<0.0001<0.0001<0.0001<0.0001
Table 8. Correlation matrix of the analysis between the significant variables of DH, plant height, NDVI, and yield of winter wheat accessions (2019–2022).
DHPlant HeightNDVIYield
DH10.84 ***0.60 **0.56 **
Plant height0.84 ***10.61 **
NDVI0.60 **0.61 **10.82 ***
Yield0.56 **0.55 **0.82 ***1
Note: *** indicates significance level at p < 0.001; **—p < 0.01.
Table 9. Values of the drought resistance index of agronomic traits of winter wheat.
TraitDegree of Severity of the TraitDrought Tolerance Index (DI)
NS (2020)DS (2021)
DH, days138 ± 0.3668 ± 0.390.50
PH, cm91.8 ± 1.0958 ± 0.760.63
NDVI0.79 ± 00.5 ± 0.010.63
Yield, t/ha6.5 ± 0.081.8 ± 0.030.27
Table 10. Indicators of economically valuable traits in winter wheat accessions distinguished by productivity over 3 years (2020, 2021, and 2022).
NameYield, t/ha% Excess Over StYield, t/ha% Excess Over StYield, t/ha% Excess Over StDays Before HeadingPlant Height, cmNDVI (Heading Phase)
202020212022202020212022202020212022202020212022
KROSHKA/4/VORONA//…6.6 ± 0.3122.21.6 ± 0.13−15.86.5 ± 0.213.2138 ± 172 ± 1132 ± 0.0190 ± 558 ± 2.5265 ± 0.010.74 ± 0.030.41 ± 0.020.74 ± 0.01
KROSHKA/GONDVANA7.1 ± 0.1131.51.6 ± 0.16−15.84.6 ± 0.29−27.0140 ± 0.5872 ± 0.58136 ± 0.0193 ± 3.8251 ± 0.0173 ± 2.520.81 ± 0.020.48 ± 0.030.76 ± 0.01
PATWIN YR15/L 4224 K 125.7 ± 0.435.61.5 ± 0.15−21.15.4 ± 0.06−14.3136 ± 0.5867 ± 0.58133 ± 188 ± 0.0156 ± 0.0173 ± 2.50.79 ± 0.030.53 ± 0.020.76 ± 0.01
PRL/2*PASTOR/3/KS82W409/…6.9 ± 0.3927.81.5 ± 0.11−21.14.9 ± 0.26−22.2138 ± 0.5873 ± 2.65135 ± 0.0195 ± 3.7555 ± 2.575 ± 2.50.78 ± 0.010.52 ± 0.020.78 ± 0.01
KINGBIRD/BILINMIYEN96.75.9 ± 0.19.31.6 ± 0.12−15.85.6 ± 0.25−11.1136 ± 1.1566 ± 1.53133 ± 0.0188 ± 2.8960 ± 570 ± 0.010.76 ± 0.020.46 ± 0.010.77 ± 0.01
PBW343/HUITES/4/YAR/…6.4 ± 0.2218.51.6 ± 0.39−15.85.9 ± 0.09−6.3136 ± 168 ± 0.58131 ± 0.5893 ± 2.8956 ± 573 ± 2.890.78 ± 0.030.45 ± 0.010.78 ± 0.02
NIKIFOR/KROSHKA6.5 ± 0.2820.41.4 ± 0.06−26.37.4 ± 0.3617.5141 ± 0.5872 ± 0.58134 ± 1.1595 ± 2.5261 ± 0.0190 ± 2.890.75 ± 0.020.49 ± 0.020.82 ± 0.01
BABAX/LR42//BABAX*2/…6.3 ± 0.0916.71.7 ± 0.26−10.56.6 ± 0.44.8135 ± 0.0167 ± 1.15132 ± 0.5890 ± 2.8955 ± 575 ± 50.79 ± 0.020.5 ± 0.010.81 ± 0.01
F498U1-1021/BOEMA/3/KS96HW94//…6.2 ± 0.2914.81.7 ± 0.41−10.57 ± 0.0811.1135 ± 0.5868 ± 0.01133 ± 0.5898 ± 2.8958 ± 3.7580 ± 2.890.81 ± 0.040.5 ± 0.030.83 ± 0.03
VICTORYA/4/WBLL1/3/TSI/VEE#5//…7 ± 0.3129.61.9 ± 0.110.06.8 ± 0.177.9137 ± 0.0167 ± 0.58133 ± 0.5893 ± 0.0156 ± 0.0180 ± 0.010.74 ± 0.030.54 ± 0.020.79 ± 0.01
NEMURA/CRDN//78014.40/3/…6 ± 0.0811.11.8 ± 0.38−5.37.5 ± 0.2519.0136 ± 0.5868 ± 0.58131 ± 0.0195 ± 2.563 ± 0.0193 ± 0.010.78 ± 0.020.52 ± 0.020.86 ± 0.03
TX71A983.4/TX69D4812//PYN/3/VPM/…6.5 ± 0.1720.41.4 ± 0.32−26.36.3 ± 0.090.0136 ± 0.0168 ± 0.01132 ± 0.0185 ± 0.0153 ± 0.0168 ± 0.010.79 ± 0.040.52 ± 0.020.79 ± 0.02
MV22-2000/3/AGRI/NAC//KAUZ6.8 ± 0.225.91.8 ± 0.11−5.36.2 ± 0.17−1.6138 ± 0.0168 ± 0.58133 ± 0.5890 ± 2.5260 ± 0.0188 ± 50.77 ± 0.020.44 ± 0.020.81 ± 0.02
KROSHKA/4/VORONA//MILAN/SHA7.5 ± 0.0938.91.9 ± 0.440.06.5 ± 0.293.2139 ± 0.0171 ± 0.58134 ± 0.0197 ± 0.0158 ± 0.0190 ± 50.8 ± 0.020.54 ± 0.020.82 ± 0.01
PATWIN YR15/L 4224 K 126.1 ± 0.1513.01.6 ± 0.39−15.86.1 ± 0.08−3.2136 ± 0.0167 ± 0.58130 ± 0.0190 ± 2.8956 ± 575 ± 0.010.81 ± 0.010.48 ± 0.010.79 ± 0.01
OBRII/DNESTREANCA25//…6.4 ± 0.218.52.1 ± 0.1410.56.6 ± 0.14.8138 ± 0.5866 ± 0.58132 ± 0.5893 ± 2.5263 ± 2.585 ± 2.890.76 ± 0.010.53 ± 0.020.81 ± 0.02
ZNAKHIDKA/EKIZ6.1 ± 0.1113.01.8 ± 0.36−5.35.9 ± 0.2−6.3141 ± 0.5867 ± 0.58134 ± 0.5890 ± 2.8960 ± 0.0180 ± 2.520.82 ± 0.020.52 ± 0.030.83 ± 0.03
CROC_1/AE.SQUARROSA (205)//…5.7 ± 0.15.61.7 ± 0.43−10.56.1 ± 0.12−3.2137 ± 0.0168 ± 0.01132 ± 0.0195 ± 2.8965 ± 2.52100 ± 2.890.75 ± 0.010.5 ± 0.030.8 ± 0.02
WAXWING*2//PBW343*2/…7.1 ± 0.0631.51.9 ± 0.10.07.6 ± 0.0620.6137 ± 0.5867 ± 0.58134 ± 0.5893 ± 560 ± 0.0185 ± 0.010.82 ± 0.030.47 ± 0.020.84 ± 0.02
WAXWING*2/KUKUNA//…6.5 ± 0.0820.41.8 ± 0.45−5.36.5 ± 0.33.2136 ± 0.5867 ± 1132 ± 0.5890 ± 2.8955 ± 2.8975 ± 0.010.81 ± 0.020.54 ± 0.010.82 ± 0.03
SUNCO/2*PASTOR/3/KS89180B-2-1-1/…6.9 ± 0.227.82.1 ± 0.3510.56.1 ± 0.08−3.2138 ± 0.5867 ± 0.58134 ± 0.0185 ± 5.7765 ± 0.0180 ± 2.50.75 ± 0.010.53 ± 0.010.81 ± 0.01
PFAU/SERI.1B//AMAD/3/… 6.8 ± 0.225.91.8 ± 0.09−5.38.1 ± 0.0628.6137 ± 0.5868 ± 0.58134 ± 0.0188 ± 550 ± 2.5273 ± 50.84 ± 0.010.5 ± 0.020.84 ± 0.02
DORADE-5/3/SHI#4414/CROW//…6.6 ± 0.1222.21.6 ± 0.28−15.85.1 ± 0.27−19.0134 ± 067 ± 1.15133 ± 0.0190 ± 0.0153 ± 2.8975 ± 50.79 ± 0.010.44 ± 0.030.76 ± 0.02
KAZAKHSTANSKAYA25/… 5.9 ± 0.319.32.1 ± 0.3110.55.5 ± 0.05−12.7136 ± 0.5864 ± 0.58131 ± 0.0195 ± 2.8965 ± 580 ± 2.890.77 ± 0.010.53 ± 0.030.76 ± 0.02
SUAROG6.6 ± 0.322.22 ± 0.125.33.2 ± 0.36−49.2137 ± 0.0168 ± 1135 ± 0.5895 ± 2.5255 ± 0.0178 ± 50.78 ± 0.010.52 ± 0.020.8 ± 0.02
BEZOSTAYA 1005.6 ± 0.13.72 ± 0.065.34.6 ± 0.1−27.0141 ± 0.5869 ± 1137 ± 185 ± 2.8955 ± 575 ± 0.010.8 ± 0.020.55 ± 0.010.79 ± 0.01
CH-111.157976.3 ± 0.2116.71.6 ± 0.3−15.86.1 ± 0.08−3.2144 ± 0.5874 ± 0.01139 ± 0.5895 ± 2.560 ± 585 ± 2.890.82 ± 0.010.51 ± 0.040.81 ± 0.02
ZAPASHNA5.7 ± 0.345.61.7 ± 0.12−10.56 ± 0.26−4.8137 ± 0.0167 ± 1.15133 ± 1.1583 ± 3.7550 ± 0.0165 ± 50.79 ± 0.020.5 ± 0.020.79 ± 0.03
BLAHO6.3 ± 0.1216.71.8 ± 0.2−5.35.8 ± 0.35−7.9136 ± 0.5865 ± 0.58131 ± 185 ± 2.8957 ± 575 ± 50.8 ± 0.030.48 ± 0.020.79 ± 0.03
LYMARIVNA7 ± 0.129.62.1 ± 0.1510.57.6 ± 0.0620.6136 ± 0.5866 ± 0.58132 ± 0.5893 ± 2.8960 ± 0.0180 ± 2.890.82 ± 0.040.58 ± 0.030.81 ± 0.02
GREER/KANMARK6.9 ± 0.4227.81.8 ± 0.13−5.37.6 ± 0.220.6137 ± 0.5865 ± 0.58131 ± 0.0190 ± 555 ± 0.0175 ± 0.010.72 ± 0.040.52 ± 0.030.8 ± 0.03
KS031009K-4/KS060142-K-46.9 ± 0.1427.81.3 ± 0.21−31.66.3 ± 0.430.0138 ± 0.0167 ± 0.58131 ± 0.5888 ± 2.8955 ± 2.8970 ± 3.750.83 ± 0.020.49 ± 0.020.82 ± 0.01
KS040477K-12/GALLAGHER6.8 ± 0.325.91.7 ± 0.39−10.57.5 ± 0.1419.0138 ± 0.5870 ± 1134 ± 0.0185 ± 553 ± 575 ± 2.890.84 ± 0.020.47 ± 0.020.84 ± 0.02
KS031009K-4/KS060285-M-16.8 ± 0.0625.91.6 ± 0.07−15.86.8 ± 0.067.9136 ± 0.0167 ± 0.01130 ± 0.5890 ± 553 ± 2.570 ± 50.83 ± 0.030.58 ± 0.030.83 ± 0.02
KS050255K-6/KANMARK5.9 ± 0.119.31.6 ± 0.06−15.86 ± 0.15−4.8135 ± 0.5865 ± 0.58130 ± 190 ± 2.5255 ± 575 ± 0.580.79 ± 0.020.43 ± 0.020.77 ± 0.03
YELLOWSTONE5.6 ± 0.173.71.7 ± 0.1−10.55.6 ± 0.07−11.1146 ± 0.5876 ± 0.01138 ± 0.0195 ± 2.8955 ± 2.5290 ± 50.8 ± 0.020.5 ± 0.010.84 ± 0.03
OK143196.9 ± 0.3527.82 ± 0.115.35.8 ± 0.26−7.9139 ± 0.5868 ± 0.01133 ± 1.1593 ± 563 ± 0.0180 ± 0.010.81 ± 0.010.52 ± 0.020.81 ± 0.02
OK12D22004-0166.7 ± 0.0924.12.1 ± 0.110.56.9 ± 0.369.5136 ± 0.0166 ± 0.01130 ± 0.5885 ± 2.555 ± 2.8975 ± 0.010.78 ± 0.020.56 ± 0.010.79 ± 0.02
STARDUST6.1 ± 0.113.01.7 ± 0.2−10.56.1 ± 0.06−3.2134 ± 0.0165 ± 0.01128 ± 0.5895 ± 2.8957 ± 580 ± 2.890.77 ± 0.040.49 ± 0.040.8 ± 0.02
OVERLAND FHB1-107.8 ± 0.444.41.7 ± 0.09−10.57.4 ± 0.1217.5140 ± 0.0171 ± 0.01134 ± 0.58110 ± 2.5267 ± 2.5285 ± 2.890.84 ± 0.010.47 ± 0.020.83 ± 0.03
SY SUNRISE7 ± 0.1129.61.8 ± 0.26−5.36.4 ± 0.311.6137 ± 0.5867 ± 0.01133 ± 0.5885 ± 2.5253 ± 2.8975 ± 2.520.79 ± 0.020.49 ± 0.030.82 ± 0.01
BONITO-37/MV10-2000/3/SHI#4414/…6.4 ± 0.1518.52.5 ± 0.4131.67.1 ± 0.1112.7139 ± 0.5869 ± 0.01133 ± 1118 ± 573 ± 3.75110 ± 0.010.77 ± 0.020.59 ± 0.030.81 ± 0.02
CBRD/TNMU//MILAN/SHA7/3/AGRI/…6 ± 0.211.11.6 ± 0.11−15.86.7 ± 0.126.3142 ± 173 ± 0.01135 ± 0.5895 ± 0.0165 ± 0.01100 ± 0.010.83 ± 0.020.55 ± 0.020.84 ± 0.02
NIKIFOR/KROSHKA6.2 ± 0.114.81.6 ± 0.3−15.86.7 ± 0.276.3139 ± 0.5868 ± 0.58134 ± 0.5890 ± 2.8953 ± 2.8998 ± 50.77 ± 0.020.5 ± 0.020.83 ± 0.03
WHEAR//INQALAB 91*2/TUKURU/…6.4 ± 0.318.52 ± 0.335.36.8 ± 0.117.9136 ± 0.0166 ± 0.58131 ± 0.5888 ± 2.565 ± 585 ± 2.890.71 ± 0.030.45 ± 0.030.75 ± 0.03
STEKLOVIDNAYA 24 (LOCAL CHECK)5.4 ± 0.150.01.9 ± 0.120.06.3 ± 0.360.0139 ± 0.5870 ± 0.01133 ± 0.58120 ± 2.5268 ± 5115 ± 50.76 ± 0.010.54 ± 0.020.79 ± 0.01
Disclaimer/Publisher’s Note: The statements, opinions and data contained in all publications are solely those of the individual author(s) and contributor(s) and not of MDPI and/or the editor(s). MDPI and/or the editor(s) disclaim responsibility for any injury to people or property resulting from any ideas, methods, instructions or products referred to in the content.