Article

Mapping Quantitative Trait Loci (QTLs) for Reproductive Stage Salinity Tolerance in Rice

by
Yamini Deepthi Sugasi
1,2,
Akanksha Srivastava
1,
Jyothi Badri
1,
Manish Pandey
3,
Brajendra Parmar
1,
Arun Kumar Singh
4,
Polavarapu Bilhan Kavi Kishor
2,* and
Ram Tilatoo
1,*
1
Crop Improvement Section, ICAR-Indian Institute of Rice Research, Rajendranagar, Hyderabad 500 030, India
2
Department of Genetics, Osmania University, Hyderabad 500 007, India
3
Centre of Excellence in Genomics, ICRISAT, Patancheru, Hyderabad 502 324, India
4
Limagrain India Pvt Ltd., Secunderabad 500 003, India
*
Authors to whom correspondence should be addressed.
Crops 2024, 4(4), 684-700; https://doi.org/10.3390/crops4040047
Submission received: 12 August 2024 / Revised: 25 November 2024 / Accepted: 3 December 2024 / Published: 11 December 2024

Abstract

Salinity is one of the major abiotic stresses that abate the yield of several crop species including rice. Several studies were conducted to identify quantitative trait loci (QTLs) for traits associated with salinity tolerance, mostly at the seedling stage of crop growth. However, the reproductive stage of development is highly sensitive to salt stress, and hence, better QTLs must be developed. QTLs have been identified in the present study for salt tolerance of the reproductive stage in rice using recombinant inbred lines (RILs). Thirty-day-old rice seedlings of 184 RILs derived from a cross between a salt sensitive RP Bio226 (indica), and a salt-tolerant Jarava (indica), were used to identify QTLs linked to salinity tolerance in moderate (field) and severe (pot) stress conditions. One hundred polymorphic simple sequence repeat (SSR) markers were used to construct a genetic linkage map that covered a 1349.4 cm genome with an average distance of 13.5 cm between loci. Eighteen new QTLs [logarithm of odds (LOD) 2.5 and above] were identified on chromosomes 1, 2, 6, 10, 11, and 12 using composite interval mapping with the phenotypic variation explained by QTL (PVE) as high as >42% with an LOD value of 5.2. qYLSt-12 with an LOD of 2.8 and a phenotypic variance (PV) of 6.4%, flanked by RM27940-RM27971, was identified for yield in moderate stress conditions. The qSTR-2 detected for salinity tolerance on chromosome 2 with 8.9% of the PV is the most significant finding of the present research. No QTL for salinity component traits has been reported in the region of RM110-RM423. The other salinity trait QTLs identified are qSN-11, qSN-12 for Na+ concentration with a total PVE% of 13.9 and qSNK-12.1, qSNK-12.2 for the Na+/K+ ratio showing a total of 26.7% of the PV. The QTLs for yield component traits viz. plant height, panicle number, panicle length, and biomass were also identified in the present study. Previous studies reported QTLs for salinity tolerance in rice on chromosome 1 but none of the QTLs in our study were on qSaltol or nearby position; therefore, Jarava conferred salinity tolerance in RILs due to novel QTLs. Fine mapping of these novel QTLs is suggested and could be helpful to enhance the level of tolerance through marker-assisted selection for the pyramiding of different QTLs in one background.

1. Introduction

Based on 73% of the land mapped so far, top and sub-soil studies indicate that 1257 million hectares of land are being affected by soil salinity [1]. The predominant sources of salinization include rainfall, wet and dry deposition of oceanic salts, and physical or chemical weathering of parent rock material [2]. In secondary salinization, the main source of salinization is irrigation with brackish or saline water and overuse of fertilizers [3]. One of the estimates claims that the annual cost of salt-induced land degradation in irrigated areas culminating in the loss of crop production is as high as USD 27 billion [4]. The amount of salt-affected land is increasing, and will continue to increase, due to unsustainable cultivation practices and climate change. The United Nations Environmental Program (UNEP) noted that nearly 50% of croplands and 20% of agricultural lands are devastated by soil salinity [4,5,6]. Rice is said to be the oldest domesticated grain crop (around 10,000 years) and the most consumed cereal grain. Though rice is grown only in 3.22% of the world’s arable land, it accounts for the third-highest contribution to worldwide production of food, after maize and wheat [7]. Scarcity in fertile productive farmlands forces rice cultivation into less productive areas such as saline, sodic, and drought- and flood-prone areas. A threshold of 4 dSm−1 is generally used to find out the soil salinity. Oryza sativa in general is highly sensitive to salt-stress conditions [8]. Soil salinity around 1.9 dSm−1 reduces yields in rice, and most of the genotypes display diminished grain yield around 3 dSm−1 or 30 mM NaCl stress (Hoang et al. 2016) [9]. Yield losses of rice at the salinity level of ECe 8 dSm−1 were estimated as 27, 46, and 50% in tolerant, moderately tolerant, and sensitive varieties, respectively [9]. In sodic soils at a pH value of 9.8, the yield reduction was estimated up to 25, 37, and 68% in tolerant, moderately tolerant, and sensitive varieties of rice, respectively [9]. Nearly half of the world’s population is dependent on rice as a staple food [10]. Production of rice has increased during the past decade, but at the same time, its consumption has also gone up. Therefore, sustainable production of rice is vital for food security [11]. To increase rice production further for a sustainable future, we should bring the salt-affected lands under cultivation. Accordingly, efforts have been made to overcome salinity stress in rice cultivation. Leaching of salt-affected lands by fresh water is being practiced, and this is one of the ways to reduce the level of salts in the soils [12]. It is also a common practice to add organic matter to retain moisture and to decrease the frequency of irrigation of lands with salinized water. Deep tilling is also avoided in salt-affected areas in order to reduce the detrimental effects of salinization [9,12]. As these techniques are cost and time consuming, farmers pay less attention to such techniques. Accordingly, breeding programs aimed at improving salt tolerance became obligatory because it is cost effective and easy to adopt by farmers [13,14].
The detrimental effects of high salinity on plants can be observed at the whole-plant level as the death of plants and/or decrease in productivity [15,16,17]. In fact, rice experiences salt stress at different developmental stages, such as in the germination, seedling, and reproductive growth stages. However, both the germination and reproductive stages are highly critical for its survival and proper yields [18]. Hence, it is imperative to find ways to understand the molecular and genetic mechanisms of salt tolerance and to develop crop varieties that are tolerant. Depending on the severity of stress, soil salinity brings about multiple changes in the physiology and metabolism leading to inhibition of plant growth and final yields [19,20]. During the initial stages of salt stress, water uptake by the roots is diminished, accumulation of ions such as Na+ increases, and at the same time, loss of water from leaves occurs because of osmotic stress [21]. Thus, the osmotic phase appears as the primary effect of salinity stress. This leads to the production of reactive oxygen species (ROS), ionic imbalance in the cells, and decreased photosynthetic activity due to closure of stomata. Closure of stomata also causes enhanced leaf temperature and inhibits elongation of rice shoots [22]. Most traits of agronomic importance in crops, particularly those related to abiotic stress tolerance, are quantitatively inherited. Salt tolerance is a complex quantitative genetic character controlled by many genes [23]. Major genes along with minor gene complexes have been found to be important for salt tolerance in rice. Quantitative trait loci (QTLs) are genomic regions containing genes controlling these quantitative traits [24]. In addition to the development of DNA-based markers using saturated molecular linkage genetic maps in rice, QTL mapping technology has facilitated the analysis of QTLs [25]. As a result, the investigation of such a complex trait by means of the QTL mapping approach will be of great significance for breeding which is aimed at enhancing the salt tolerance of rice.
Research on QTL mapping for salt tolerance in rice has advanced significantly in the last few years [26]. Most of the studies related to genetics and mapping of QTLs for salinity tolerance have been carried out at the seedling stage of crop growth which may not relate to reproductive-stage tolerance. The QTL qSaltol is associated with salinity tolerance at the seedling stage. It has been identified from the salt-tolerant variety ‘Pokkali’ [27] and is presently being used in breeding programs to develop a variety that has a good level of tolerance at the seedling stage. But one should develop QTLs related to the reproductive stage of rice development which is vital to reduce the yield losses. So far, the QTLs reported for salinity tolerance were mapped from a land race cultivated in saline areas or the improved varieties of indica sub-species [26]. The variety Jarava was developed by introgressing multiple gene(s) of agronomic importance such as salinity tolerance at the reproductive stage, broad spectrum resistance to blast, moderate resistance to brown plant hopper (BPH), white-backed plant hopper (WBPH), and bacterial blight (BB) from wild species of rice Oryza rufipogon. O. rufipogon is an important wild species of rice and a source of genetic diversity. It is a close ancestor of the cultivated rice Oryza sativa. It is being used for improving rice yields and thus for food security [28]. Cultivar RP Bio226 is a Near Isogenic Line (NIL) of elite fine grain variety ‘Samba Mahsuri (BPT 5204)’ with genes for bacterial leaf blight (BLB) resistance [29]. This study aims at identifying reproductive-stage salinity tolerance QTLs in rice which would be of use in breeding programs. In the present study, we identify QTLs for yield and its component traits, with an emphasis on Na+ and K+ concentration and their ratios using 184 RILs derived from a cross between RPBio226 and Jarava rice cultivars.

2. Material and Methods

2.1. Plant Material and Experimental Conditions

The plant material consisted of RILs derived from a cross between Jarava and RP Bio226. Electrical conductivity (EC) is one of the measures used to measure soil salinity caused by sodium chloride and other salts. EC indicates the potential of an aqueous solution to carry an electric current. The electrical conductivity of a saturated soil extract (ECe) is a measure of soil saline condition and generally accounts for the texture of soil. The unit of measurement for EC is deciSiemens per meter (dS/m). Under high saline condition (ECe 9.2–10 dS/m) associated with phosphorous deficiency, iron and aluminum toxicity, and low pH with high sulphate, Jarava produced 2.8 t/ha indicating that along with salinity tolerance it has tolerance to other mineral stresses. Hence, Jarava has been selected for the mapping of QTLs associated with yield under salinity stress. In addition to Jarava, the other parent used for breeding in this study is RP Bio226, also referred to as an improved Samba Mahsuri variety. This is an elite fine grain cultivar with high yields and excellent cooking qualities but is known as highly susceptible to salinity in general [28]. Crosses between RP Bio226 and Jarava were attempted during monsoon season (Kharif). True F1s were selfed, and the F2 was advanced further following single-seed descent. A final set of 184 RILs was identified and used for the evaluation of salt tolerance traits. Salinity stress experiments (field and pot) were taken up while material was evaluated under controlled and saline field conditions. In Kharif, RILs along with parents were evaluated for salinity stress in fields in an augmented design at Ramachandrapuram farm of ICAR-IIRR situated at ICRISAT campus, Patancheru, Hyderabad, India, with an ECe of 8.6–9.2 dSm−1. Thirty-day-old seedlings of each entry were planted in a row of 20 plants with a spacing of 20 cm × 15 cm. NPK fertilizer was applied at the rate of 120:60:60 kg/ha. The other agronomic practices like soil preparation, irrigation when necessary, weeding, the addition of fertilizers, and plant protection measures such as disease and pest management for good crop growth were followed as per the recommendations. In the same year, the cultivars were also evaluated for salinity tolerance in pot experiments. The pots were filled with 12 kg soil with a pH of 8.2 and an ECe of 3.4 dSm−1 saturated with 140 mM salt solution (soil culture) in each pot. Entries were planted with 3 plants per pot in two replications. The ECe and pH were measured at three different growth stages of the crop viz., planting, maximum tillering, and crop maturity. Plant material was evaluated both under saline and field conditions (day temperatures ranging between 30 and 35 °C, 22 to 28 °C night temperatures, and relative humidity ranging from 30% to 70% depending on the month) in a Randomized Block Design (RBD) in two replications. Simultaneously, pot experiments were conducted both in saline and controlled conditions.

2.2. Phenotypic Data Collection and Phenotypic Correlation Analysis

In field experiments, data were collected on 10 randomly selected plants from the middle of the row to avoid border effect, while in pot experiments, data were collected on all plants. In all the experiments, the observations on yield and its related traits such as plant height (PH), panicle number (PN), tiller number (TN), panicle length (PL), biomass (BM), and yield/plant (YL) were recorded at maturity. In the case of the salinity experiments, in addition to the above traits, data on plant mortality at 25 days after planting, the tolerance score at 35 and 65 days after planting, Na+ and K+ concentrations, and the Na+/K+ ratio were recorded after harvesting. In all the experiments, plant height was skewed towards RP Bio226, while all other yield traits were skewed towards Jarava. Correlations between character pairs were computed at p < 0.05 and p < 0.01. Such a correlation alongside path analysis during plant breeding helps us to gain better insight into causes and relationships between different traits. The p ˂ value is represented as a means to present significant findings [30]. The significance of each correlation was determined using t tests with control of the false discovery rate for multiple tests.
r xy = C o v ( x . y ) V ( x ) . V ( y )
where rxy = correlation coefficient between x and y. V(x) = variance of x. V(y) = variance of y.

2.3. DNA Extraction and Genotyping

Fresh leaves of two-week-old seedlings were used for DNA extraction according to the CTAB method [31]. A total of 795 SSR markers distributed uniformly throughout the rice genome were selected and primer sequences were obtained from Gramene (http://www.gramene.org) and were screened to find polymorphism between the parents. The polymorphic SSRs were used for genotyping. Polymerase chain reaction (PCR) conditions were followed as described by Chen et al. [32]. A Biorad C1000TouchTM Thermal Cycler PCR system was used for DNA amplification. The 10 μL PCR reactions contained 1 μL 10× PCR buffer, 0.5 μL dNTPs (2.5 mM), 1 μL each of forward and reverse SSR primers, 0.5 μL Taq polymerase (1 U/μL), 3 μL genomic DNA template (50 ng), and 3 μL of sterile distilled water. PCR was performed with a profile of 94 °C for 5 min, followed by 30 cycles at 94 °C for 30 s, at 55 °C for 30 s, at 72 °C for 1 min, and finally for 7 min at 72 °C for the final extension.

2.4. Genetic Linkage Map Construction and QTL Analysis

The linkage map was constructed using JoinMap version 4.0 using the “Regression mapping algorithm” [33], based on the segregation data of 100 SSR loci. The related genomic distances (cm) were calculated from recombination values using the Kosambi mapping function [34]. A Composite Interval Mapping (CIM) was conducted using Windows QTL Cartographer V 2.5 application [35]. To determine the empirical significance thresholds for declaring a QTL, 1000 permutations were carried out to calculate the logarithm of odds (LOD) thresholds for each trait at p = 0.05 and p = 0.01. Permutation testing (using QTL cartographer) indicated that a ratio LOD score of ≥2.5 is a suitable threshold for these data.

3. Results

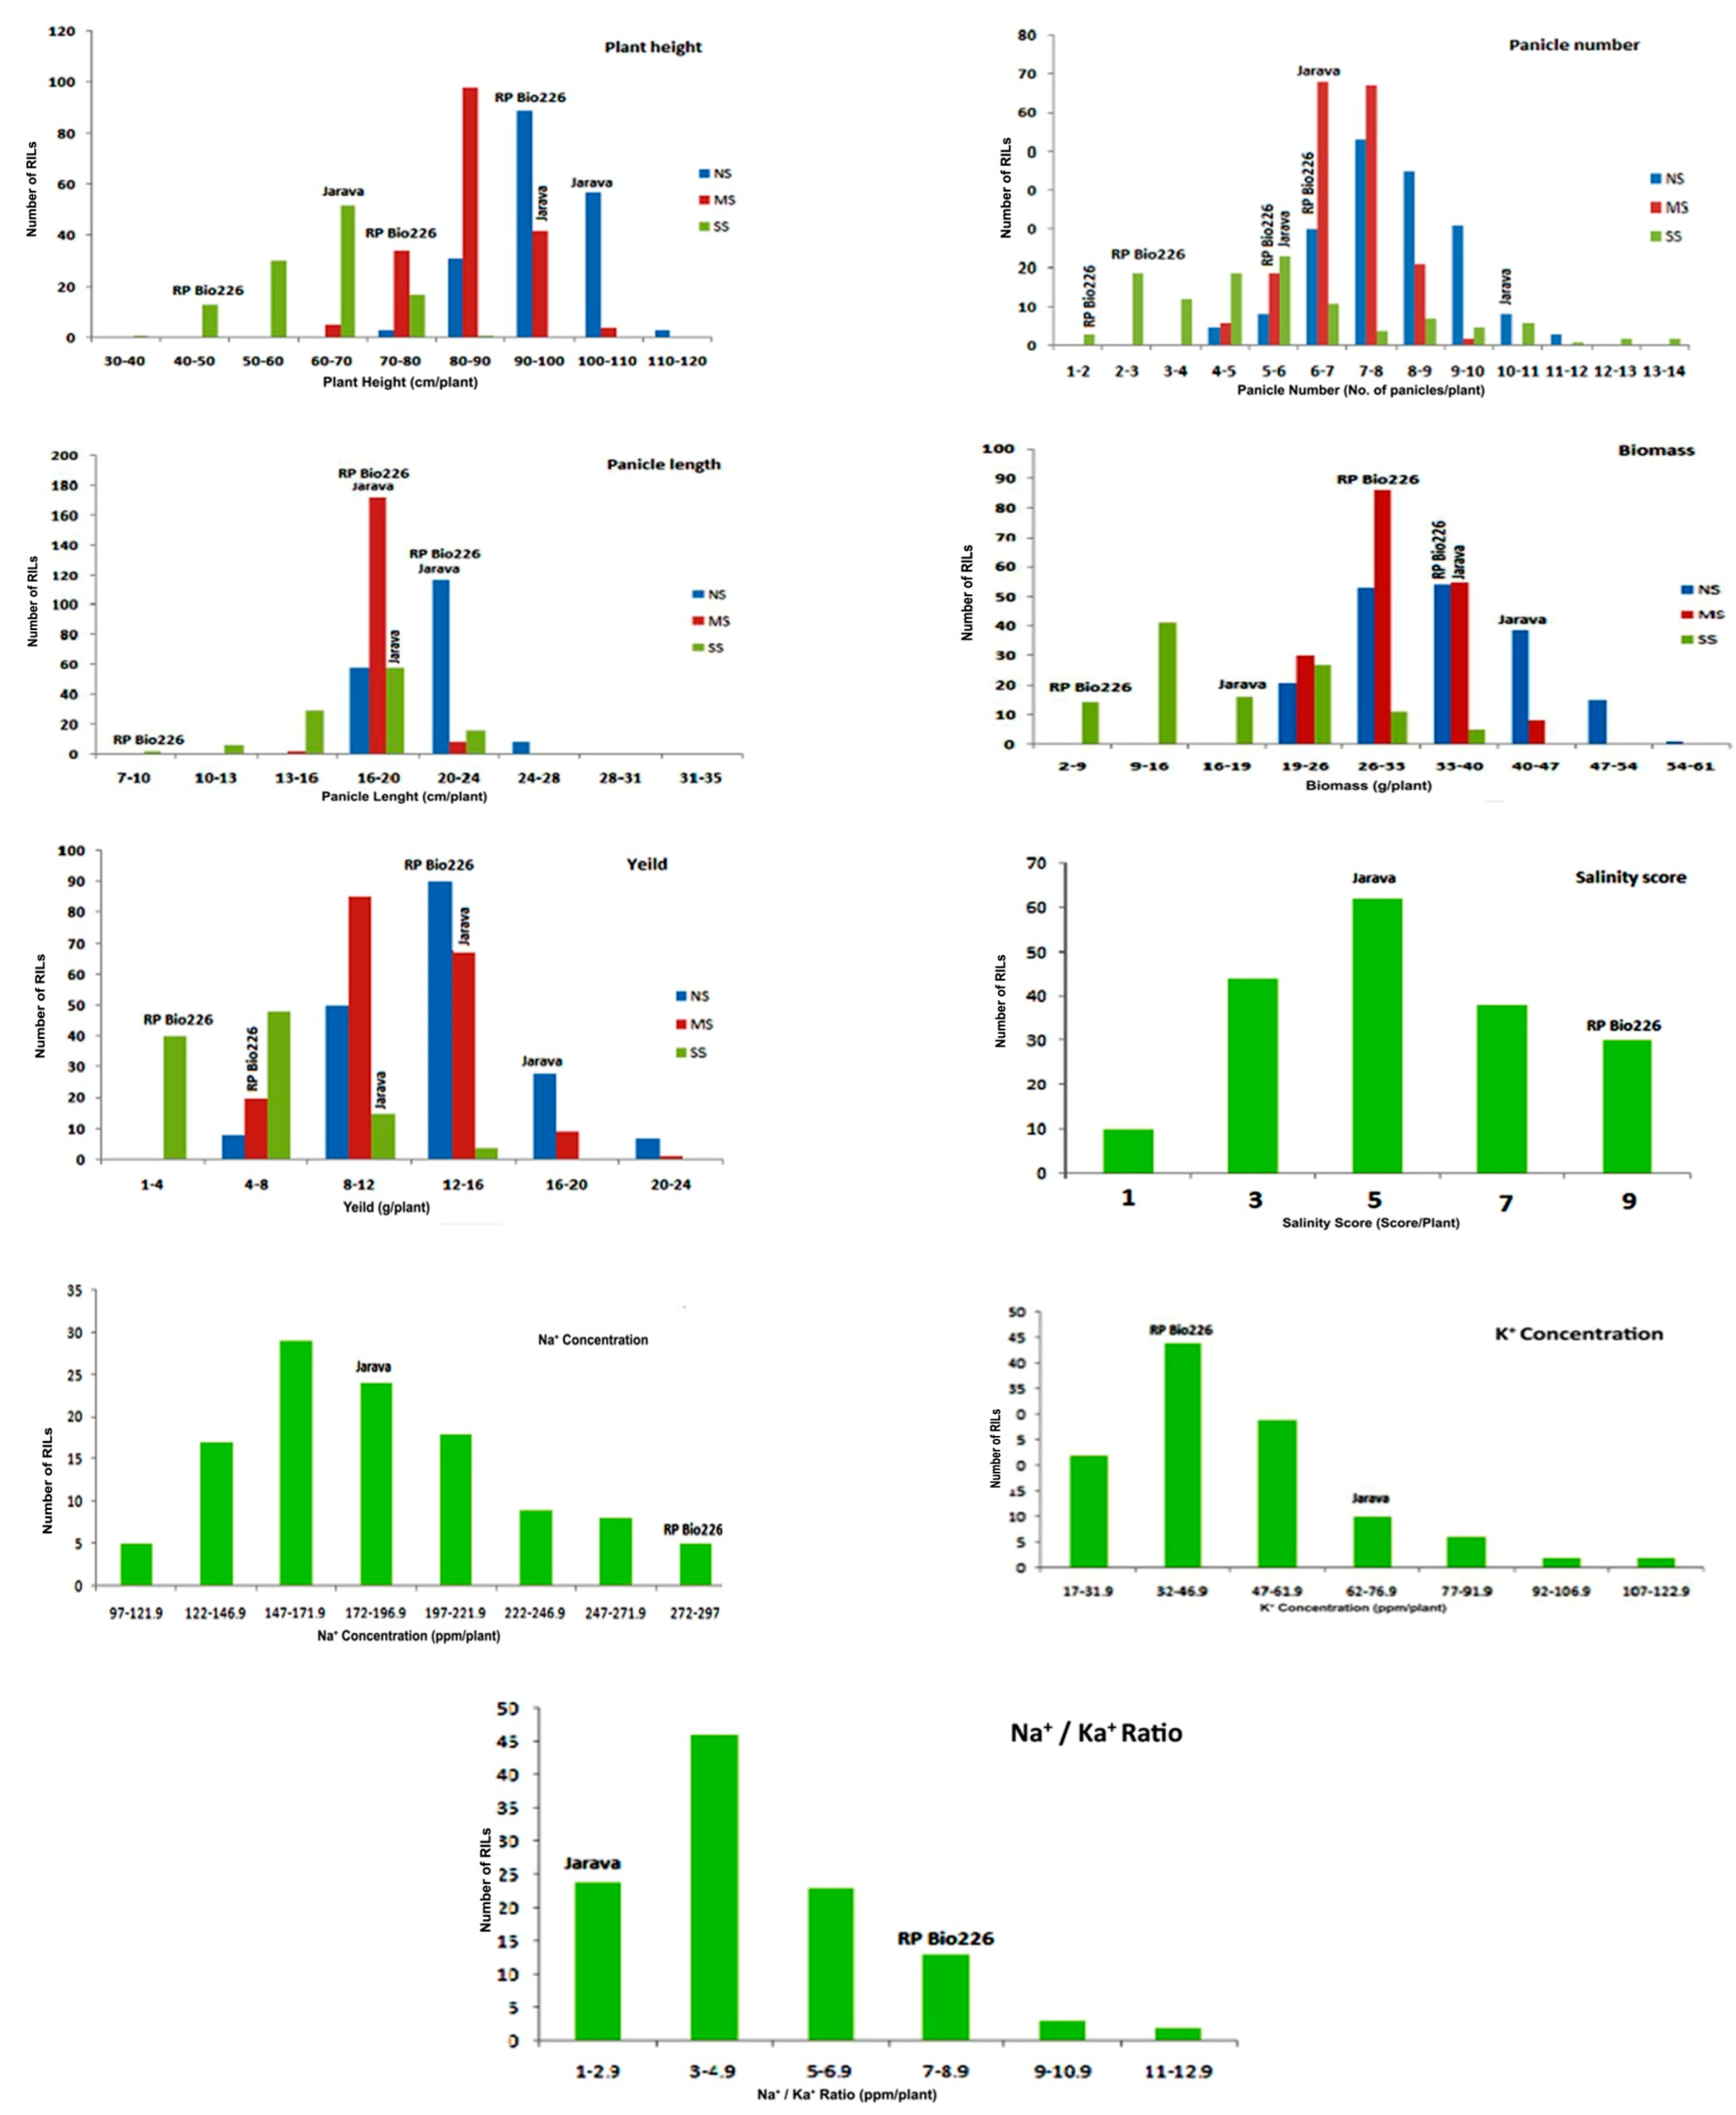
3.1. Phenotypic Variation/Evaluation

The parents and their progenies showed considerable variability in their phenotypic traits (Table 1). Superiority in the trait values were observed in the resistant parent Jarava over the susceptible RP Bio226. The frequency distribution curve of trait values exhibited a normal distribution pattern. Skewness in RILs was observed towards either of the parents and even beyond the parents showing transgressive segregation indicating the quantitative nature of trait inheritance. Except for K+ concentration, all other salinity traits were skewed more towards the susceptible parent (Figure 1). Salt stress led to poor growth followed by mortality in highly susceptible RILs. The salinity score in Jarava, the salt-tolerant species, was 4.5, and the salt susceptibility index (SSI) score in RP Bio226 was 8.5, indicating the salt susceptible nature of RP Bio226 (Table 1). Decrease in the yield values was observed under salinity stress conditions when compared to normal conditions indicating the effect of salinity stress evident by the correlation values of 0.28 ** for yield under normal conditions and 0.19 ** values for yield under saline conditions (* p < 0.05 and ** p < 0.01) (Figure 1). The tolerant parent Jarava displayed a significantly smaller grain yield reduction of 32 and 57% compared to the susceptible parent RP Bio226 which showed a 51 and 90.1% yield reduction under salt-stress conditions applied in the field and pot, respectively. The tolerant parent Jarava exhibited lower salt susceptibility index (SSI) values for all the component yield traits as compared to the sensitive parent RP Bio226 under stress conditions (Table 2).

3.2. Trait Correlation and Linkage Map

Grain yield per plant showed a significant positive correlation with component traits such as plant height, panicle length, and biomass. In the case of salinity component traits, the Na+ concentration, Na+/K+ ratio, and damage score were significantly and negatively correlated with grain yield per plant while the K+ concentration showed significant positive correlation with grain yield (Table 3). Of the 795 SSRs surveyed for polymorphism, 100 SSRs were found polymorphic between the parents, indicating 13.5% polymorphism which ranged from 10.5% on chromosome 12 to 22.1% on chromosome 1. The 100 SSR markers on all the 12 chromosomes accounted to a 1349.4 cm linkage map with an average distance of 13 cm between the markers.

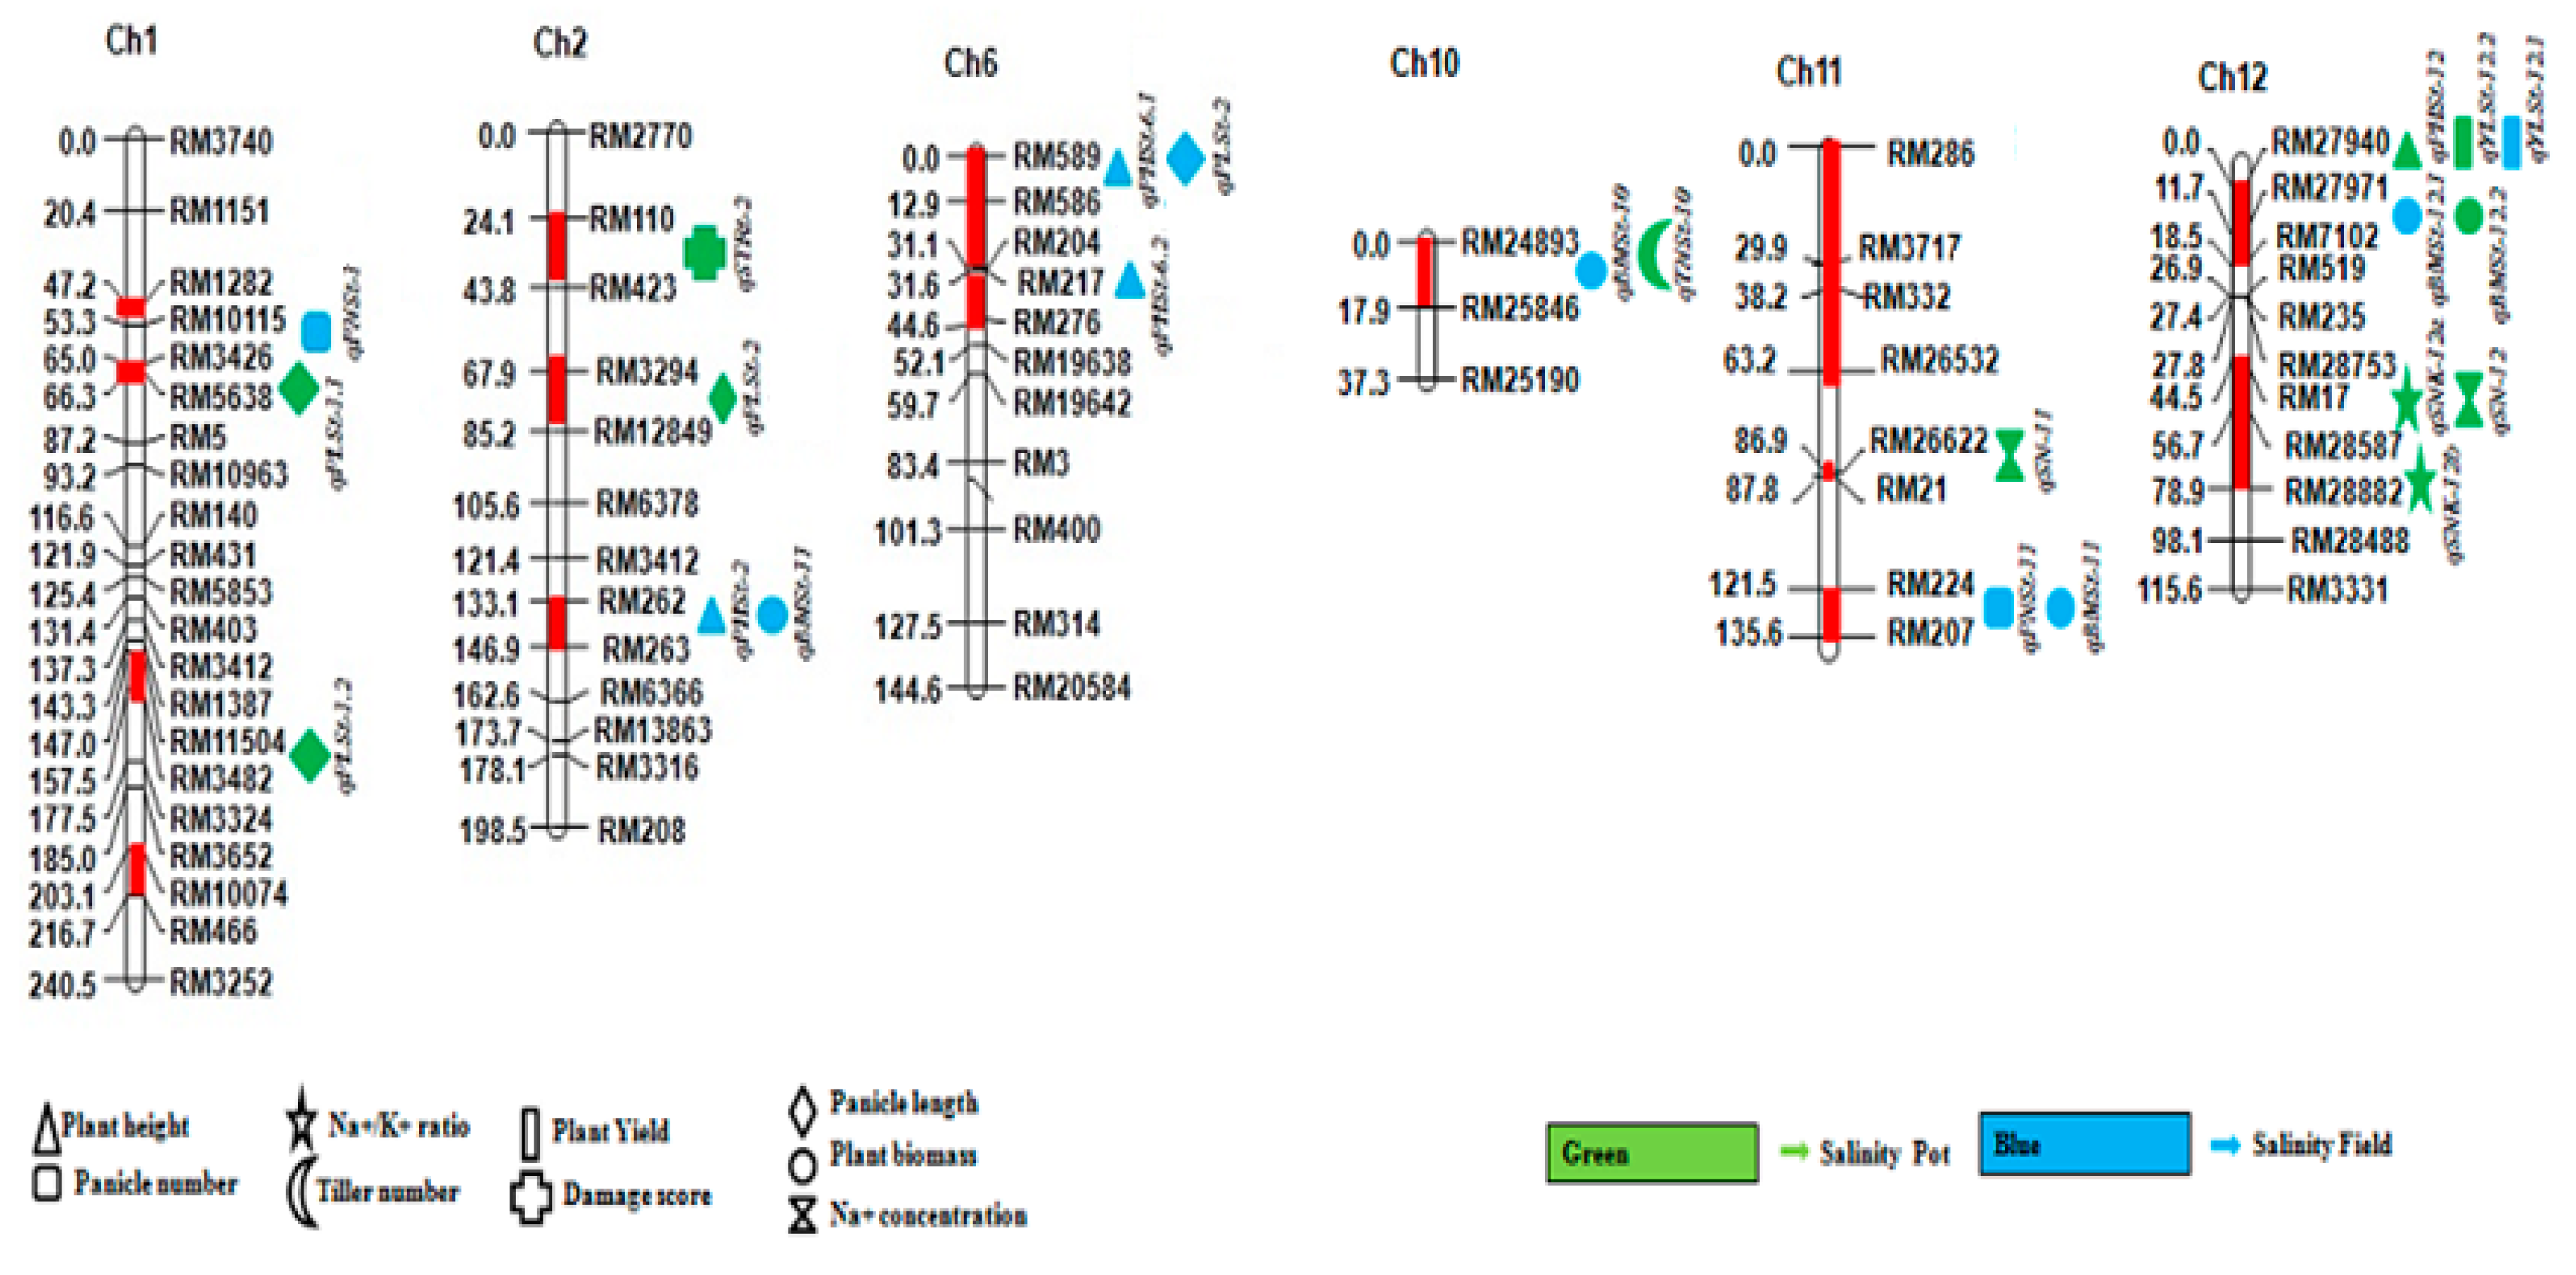
3.3. QTL Mapping of Salt Tolerance-Related Traits (Plant Height, Panicle Number, Panicle Length, Biomass, and Yield)

Among the nine traits assessed for QTLs under salinity stress in both field and pot experiments, a total of 23 QTLs were identified for eight traits of which 17 QTLs were for yield traits under salinity stress and 6 QTLs were for salinity component traits (Table 4 and Table 5). These QTLs are located on chromosomes 1, 2, 5, 10, 11, and 12 (Figure 2). Four QTLs for plant height under salinity stress were detected with an additive effect from both the parents, of which three (qPHSt-2, qPHSt-6.1, and qPHSt-6.2) were from the salinity field and one (qPHSt-12.2) was from the salinity pot experiments. qPHSt-2, present on chromosome 2 at the interval RM262-RM263 is a major QTL and explained 28.1% of the phenotypic variation (PV). qPHSt-6.1 and qPHSt-6.2 were flanked by RM589-RM586 and RM204-RM276, respectively, on chromosome 6 and explained 5.9 and 10.3% of the PV. qPHSt-12.2 on chromosome 12 at the interval RM27940-RM27971 explained 8.0% of the PV. Three QTLs for the trait panicle number under salinity stress, namely qPNSt-1, qPNSt-11 (field), and qPNSt-10 (pot), were detected on chromosomes 1, 11, and 10, respectively, and explained 6.1%, 10.4%, and 7.5% of the PV. qPNSt-10 and qPNSt-11 were flanked by RM24893-RM25846 and RM224-RM207, respectively. The enhancing effect of the QTL was noticed from both the parents. Four QTLs, qPLSt-1.1, qPLSt-1.2, qPLSt-2 (pot), and qPLSt-6 (field), under salinity stress with a negative additive effect were identified for panicle length on chromosomes 1, 2, and 6. The QTLs individually explained about 13.2%, 10.9%, 6.9%, and 6.8% of the PV, respectively, indicating two major and two minor QTLs, qPLSt-1.1 and qPLSt-1.2. While QTL qPLSt-1.1 was flanked by RM3426-RM5638, QTL qPLSt-1.2 was at the interval RM11504-RM3482. Also, qPLSt-2 and qPLSt-6 were flanked by RM3294-RM12849 and RM589-RM586, respectively. An increase in panicle length was associated with Jarava alleles at all these loci. Four QTLs, qBMSt-2, qBMSt-10, qBMSt-11, and qBMSt-12, were detected on chromosomes 2, 10, 11, and 12 in the salinity field experiment for biomass. The QTL qBMSt-2 flanked by RM262-RM263 showed a positive additive affect with 9% Participatory Variety Enhancement (PVE), indicating that the allele was from the cultivar RP Bio226. The QTLs qBMSt-10, qBMSt-11, and qBMSt-12 which showed 10.7%, 9.3%, and 9.9% PVE were from Jarava, flanked by RM24893-RM25846, RM224-RM207, and RM27971-RM7102, respectively. One QTL, qYLSt-12, on chromosome 12 was detected for yield under salinity stress in the field experiment at the interval RM27940-RM27971, with a PV of 6.4% and an allele contribution from Jarava.

3.4. QTL Mapping of Salt Tolerance-Related Biochemical Traits (Na+ Concentration, Na+/K+ Ratio, and Salinity Tolerance)
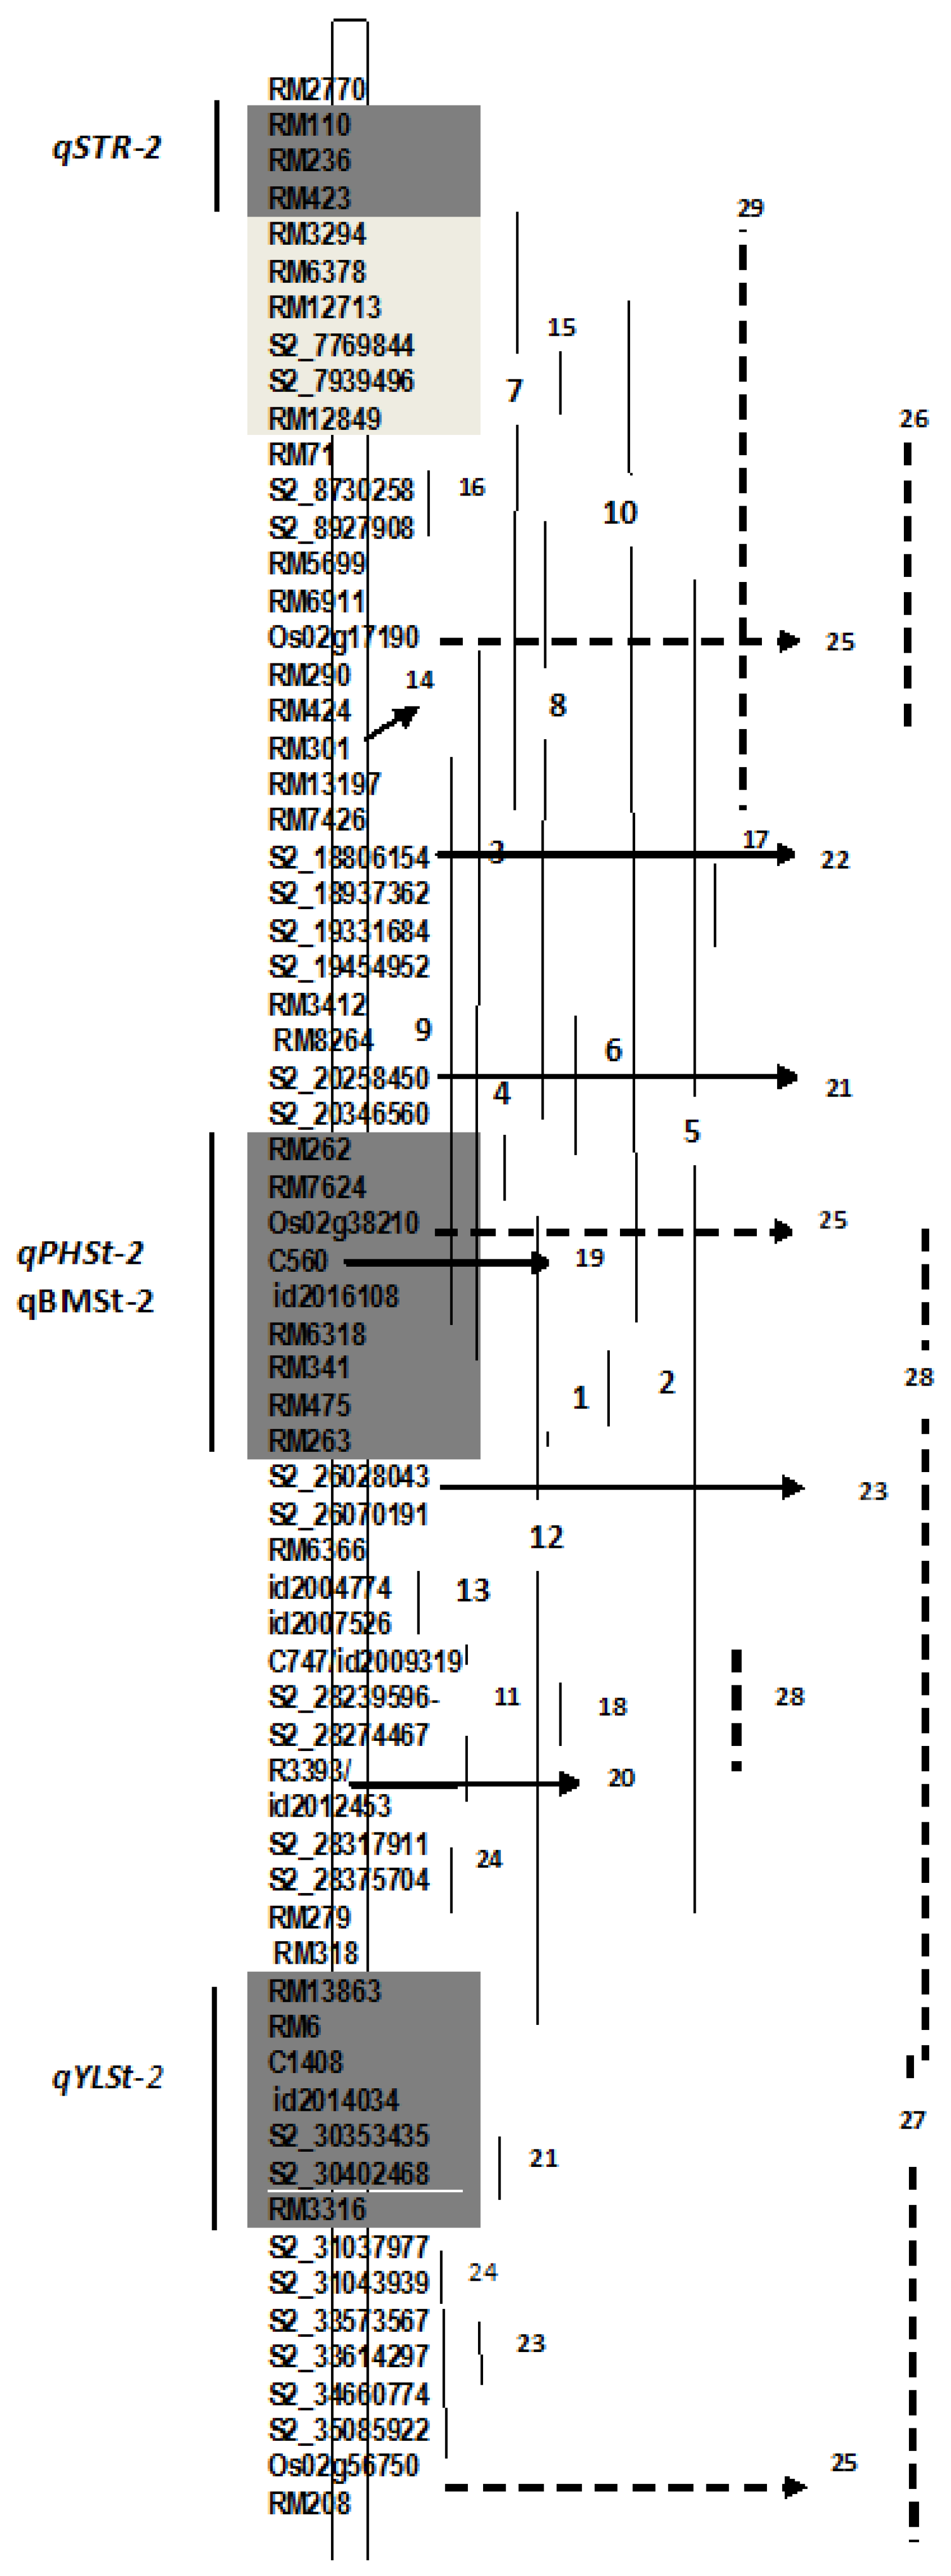
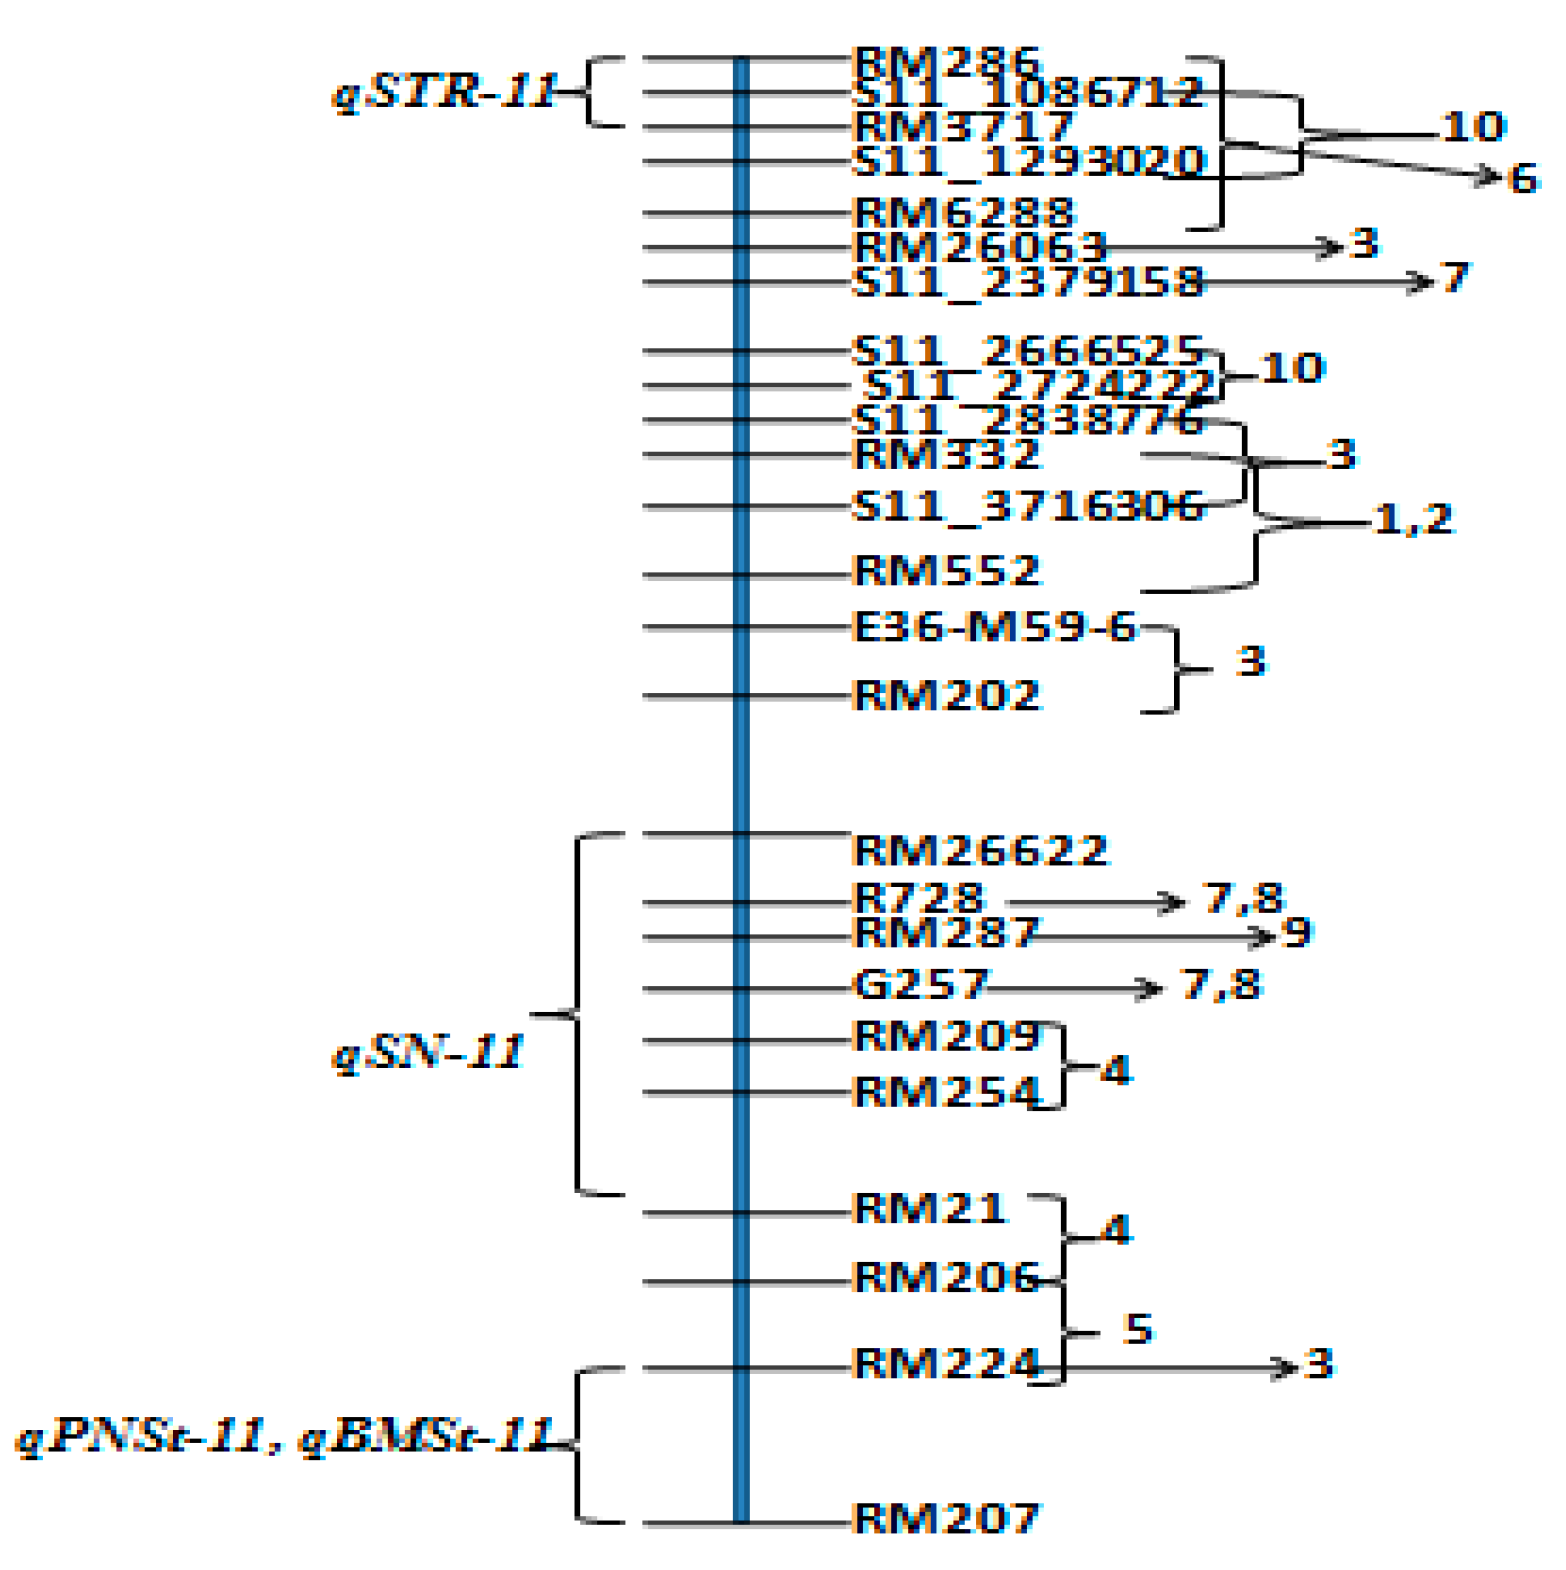
Two QTLs, qSN-11 and qSN-12, for Na+ concentration were detected in the pot experiment on chromosomes 11 and 12, flanked by RM26622-RM21 and RM17-RM28587. These two QTLs showed a positive additive effect with 6.4% and 7.5% PVE, respectively, indicating that the allele was from RP Bio226. Two QTLs, qSNK-12.1 and qSNK-12.2, for Na+/K+ ratio were detected on chromosome 12 in the pot experiment, flanked by RM17-RM28587 and RM28587-RM28882. The two QTLs exhibited a positive additive effect with 15.6% and 11.19% PVE, indicating the major effect of these QTLs, and the allele was contributed from RP Bio226. One QTL, qSTR-2, on chromosome 2 was detected in the pot experiment flanked by RM110-RM423, showing a PVE of 8.9% with an allele of RP Bio226.

3.5. QTL Clusters

Four genomic regions, one each on chromosomes 2, 6, 10, and 11, were found to have more than one QTL at the same marker interval. Two QTLs, qPHSt-2 and qBMSt-2, detected in the field experiment for plant height and biomass traits under salinity stress were found co-located on chromosome 2 at the interval RM262-RM263 with an allele contribution from RP Bio226. Similarly, qPHSt-6.1 and qPLSt-6 were present at the same region on chromosome 6 at the interval RM589-RM586. These QTLs are associated with plant height and panicle length traits under salinity stress in the field experiment. There were two QTL clusters for the pair of traits biomass–panicle number and yield–plant height under salinity stress on chromosomes 11 and 12. These are located at intervals RM24893-RM25846 and RM27940-RM27971, respectively. However, in these two QTL clusters, the QTL for the former trait in the pair was detected in the field experiment, while the latter was detected in pot experiment. Out of the four clusters discussed here, except for the plant height–biomass cluster on chromosome 2, alleles of the remaining three pairs of QTLs were found to be contributed from Jarava. In this study, at the reproductive stage, we identified two QTLs on chromosomes 2 (qSTR-2) and 11 (qSTR-11) for salinity tolerance, together accounting for a PV of 17.8%. In addition, QTLs for Na+ ion concentration (qSN-11 and qSN-12) and Na+/K+ ratio (qSNK-12.1 and qSNK-12.2) have been identified for salinity stress on chromosomes 11 and 12. QTLs reported for component salinity traits at the seedling or reproductive stage on these chromosomes were analyzed and schematically depicted in Figure 3 and Figure 4. Among the many markers, only the RM3412 marker was polymorphic and genotyped, but no QTLs were detected at this locus. The present study detected novel QTLs other than at the Saltol region for reproductive-stage tolerance in rice. The parent Jarava gave 81.66% more yields than RP Bio226 under salinity stress. In the population, there were five RILs with a salinity resistance score of one and with a yield higher than Jarava. All these RILs harbored QTLs for component traits of salinity tolerance either singly or in combination and showed a yield advantage in the range of 9.11–45.4% and 72.7–90% over Jarava and RP Bio226, respectively. Hence, the high yield of the RILs could be attributed to the allele introgression from Jarava. Interestingly, we could identify one RIL among 184 RILs with all the salinity tolerance QTLs and yield QTL, with a score of one and that was superior to Jarava in yield per se (Table 6).

4. Discussion

4.1. QTLs Associated with Salinity Tolerance in Rice

Salt tolerance is a complex, quantitative, genetic characteristic controlled by many genes [23]. The plant response to salinity varies with growth stages, salt concentration, and duration of exposure to salt, ultimately affecting the development of the plant [36]. Salinity during the reproductive stage reduces grain yield much more than the salinity imposed during the vegetative growth stage [26]. The dissection of a complex trait by means of the QTL mapping approach and the utilization of QTLs and genes in subsequent breeding programs will be of great significance for developing cultivars with superior salt-stress tolerance in rice [29]. Analysis of variance revealed significant variation among the RILs for all the traits evaluated both in field and salt-stress experiments indicating the presence of sufficient genetic variation. The percent decrease in the trait value of the component yield traits under salinity stress indicates appropriate selection of parent genotypes [37]. Stress affected the grain yield per plant from 31 to 57% in the resistant parent Jarava while 90% reduction was noticed in the susceptible parent RP Bio226. The population expressed 10 to 46% and 29 to 87% per cent grain yield reduction under field and pot stress conditions, respectively. Grain yield is a complex quantitative trait, greatly affected by environment and seen in cereal crops [38,39]. Hence, selection of superior genotypes based on yield per se is not effective. The association of plant characters and stress indices with yield thus assumes special importance in the formulation of selection criteria for yield [40]. The stress susceptibility index (SSI) has been proposed for identifying genotypes with superior performance under stress as well as non-stress environments [41]. SSI values enabled identification of extreme phenotypes in RILs and suggested the presence of transgressive segregation in the population.
Assessing the association between SSI and various agro-morphological traits through simultaneous evaluation under controlled and uncontrolled field salinity and pot salinity (accurate salinity stress) conditions help in targeted trait selection. The SSI for economic yield has also been used for the evaluation of hexaploid triticale x bread wheat introgression lines for tolerance to low phosphorus and water stresses and was found important for the selection of efficient genotypes [42]. Porch et al. [43] and Ali et al. [44] reported that several genotypes of common beans and rice were superior for heat, sodicity, and salinity stresses based on the stress index and on the consistency of their reactions across environments. Selection of genotypes under normal-, moderate-, and high-sodic conditions should be entirely different as indicated by differentials in the magnitude of correlation in different salt-stress and non-stress conditions in rice [45,46]. Ali et al. [44] have indicated that yield traits in rice such as grains per panicle, spikelet fertility, plant height, productive tillers, and flowering duration were good indicators for selecting salt-tolerant genotypes in comparison with non-stress conditions. Wild rice (O. rufipogon) is known to contain genes for salinity tolerance [47] and has been used as a source of both biotic and abiotic stress-response genes [48,49]. Evaluation of salt tolerance of other wild rice species including O. officinalis and O. coaretata have also been reported [50]. Several major QTLs associated with salt tolerance accounting for a large proportion of the phenotypic variation have been detected using different RILs, doubled haploids (DHs), and F2:3 mapping populations [51,52], and one major QTL was cloned [53]. Reproductive-stage QTLs are vital for plant survival and final yields, more so than the seedling-stage QTLs. Reproductive-stage salinity QTLs are available in rice, but there are relatively few [54]. Previously, 13 QTLs have been mapped on chromosomes 2, 3, 4, 6, 7, 10, and 12 for salt-stress tolerance at the early seedling stage in Oryza sativa [55]. Also, both vegetative- and reproductive-stage QTLs have been developed in the salt-tolerant Indica rice variety CSR27. Some of the QTLs that control Na+, K+, and Cl ion concentrations have been identified [56]. Further, new QTLs for increasing adaptation to salinity stress at the reproductive stage have been identified in rice [26,39,57,58]. Reproductive stage QTLs identified in this investigation appear to be a promising target for future studies. Such QTLs increase our understanding of salt tolerance in rice and help us in marker-assisted selections.

4.2. QTLs for Component Traits of Salinity Tolerance on Chromosome 2

In this study, five QTLs (qSTR-2, qPLSt-2, qPHSt-2, qBMSt-2, and qYLSt-2) have been identified on chromosome 2 for salinity tolerance that contribute to panicle length, plant height, biomass, and yield traits under salinity stress at the reproductive stage. Previously, a total of 47 QTLs have been reported on chromosome 2 for different traits under salinity stress at seedling/reproductive stages. However, the previously reported QTLs are not located in the same region as that of RM110-RM423 that controls the salinity-tolerance QTL (qSTR-2) reported in the present investigation. Hence, qSTR-2 is considered as a novel QTL for salinity tolerance at the reproductive stage. Such QTLs associated with reproductive stage salt tolerance have been identified previously in rice [59,60]. The remaining four QTL regions were found to be overlapping with several of the reported QTLs. The QTL for Na+ content reported by Sabouri et al. [61] covers the complete region of the panicle length QTL (qPLSt-2), while the QTL for Na+ content reported by Leon et al. [62] is located within qPLSt-2. Another QTL for chlorophyll content reported by Thomson et al. [27,63] covers both qPLSt-2 and the QTL cluster of qPHSt-2 and qBMSt-2. QTLs for days to seedling survival and shoot K+ and Na+ concentrations, shoot K+/Na+ ratio, and salt toxicity symptoms [63] are located within this region. Several QTLs for different seedling traits like plant height, root K+ concentration [27,63], shoot Na+ concentration, salinity toxicity symptoms [63], and seedling dry weight [64,65] were found to be overlapping in this region. QTL analysis studies conducted by Goto et al. [66] revealed Na+ removal ability in rice leaf sheaths under salinity using an IR-44595/318 F2 population. Such studies help breeders to evolve varieties with superior salt-stress tolerance. In addition, Os02g38210, the gene for SSI and grain yield at the reproductive stage, is located within this region [40]. Not many QTLs were reported earlier in the same region as qYLSt-2. But QTLs for chlorophyll content [62] and co-located QTLs for grain yield/plant, seed fertility, and 1000 grain weight have been identified for the reproductive stage at the same region [67,68].

4.3. QTLs for Component Traits of Salinity Tolerance on Chromosome 11

In the present study, the QTLs qSTR-11, qSN-11, qPNSt-11, and qBMSt-11 for four traits such as salinity tolerance, Na+ concentration, panicle number, and biomass have been identified, respectively. qPNSt-11 and qBMSt-11 are co-located between RM224 and RM207, while qSTR-11 and qSN-11 are two independent QTLs between RM2856-RM3717 and RM26622 and RM21, respectively, located above the QTL cluster of qPNSt-11 and qBMSt-11. The QTL for shoot Na+ concentration reported by Wang et al. [69] completely covers qSTR-11 and extends even beyond it, while the QTL for chlorophyll content [62] partly overlaps with the qSTR-11 region. Several QTLs reported for different traits such as seed fertility [67], dry shoot and dry root weights [70,71], and fresh shoot weight [72] are within the qSN-11 region. Several QTLs related to salinity stress including shoot fresh and dry weights have been listed by Satasiya et al. [73] in rice. The QTL for grain yield [40] and the QTL for dry root weight [71,74] overlap with region harboring qPNSt-11 and qBMSt-11. Many QTLs for component traits of salinity tolerance at the seedling stage were reported on chromosome 11 but at different locations from the QTLs identified in the present study (Figure 4). QTLs for shoot K+ concentration, shoot K+/Na+ ratio [56,74], standard tolerance ranking [65], salt tolerance [75], salt injury score, chlorophyll content, and dry weight [62] were reported on chromosome 11. QTLs for Na+ and K+ uptake of the shoots and roots controlling the rice salt tolerance have been identified previously [76], indicating the complicated architecture of salinity tolerance in rice.

4.4. QTLs for Component Traits of Salinity Tolerance on Chromosome 12

Two QTLs, qBMSt-12 and qYLSt-12, under field salinity stress and three QTLs, qSN-12, qSNK-12.1, and qSNK-12.2, under salinity stress in the pot experiment were identified on chromosome 12 in the present study. The QTLs qBMSt-12 and qYLSt-12 are adjacent QTLs, while the cluster of qSN-12 and qSNK-12.1 are harbored within qSNK-12.2. QTLs for shoot Na+ concentration, shoot K+/Na+ ratio [66], Na+ concentration, K+/Na+ ratio, shoot fresh weight [77], and Na+ concentration [71] that have been identified previously partly cover qBMSt-12 and qYLSt-12. Three QTL regions for salt toxicity symptoms and days to seedling survival [78] and SSI for grain yield [40] have been found to overlap with qSNK-12.2 as well as with qSN-12 and qSNK-12.1. Several QTLs for salinity tolerance have been mapped previously on different chromosomes in rice [26,56,59]. One of them, i.e., Saltol, has been mapped on chromosome 1, using the RIL population obtained by a cross between Pokkali (salt tolerant) and IR29 (salt sensitive). The Saltol QTL was found to be associated with the Na+/K+ ratio and seedling-stage salinity tolerance [79,80] and accounted for low Na+ absorption, high K+ absorption, and a low Na+-to-K+ ratio in rice shoots under salinity stress [81]. In Pokkali, it has been found that the Saltol QTL explains about 64.3–80.2% of the variability in the shoot Na+/K+ ratio [27,60]. Further, remapping and fine mapping of Saltol has been achieved in other mapping populations [27,81]. The Saltol QTL, having much significance at the seedling stage, may not exhibit tolerance at the reproductive stage too. Hence, the most promising nine SSR markers in and around the Saltol region on chromosome 1 (RM490, RM1287, RM10694, RM8094, RM3412b, RM493, RM10793, RM562, and RM7075) were used for polymorphic studies in the present study for breeding salt tolerance. Salinity in rice causes flowering abortion and spikelet sterility and impairs grain filling and seed set, as well as nutritional quality [3,63,82]. Mapping QTLs at the reproductive stage is particularly crucial since flowering is affected in rice under salt-stress conditions. Therefore, the present study is vital for rice breeding programs aimed at growing rice in salt-affected areas. Marker Assisted Backcross Breeding (MABB) can be exploited to evolve rice lines identical to their recurrent parents with enhanced amelioration to salinity.

5. Conclusions

The flowering and reproductive stage of development are highly sensitive to salinity stress in rice. In the present study, 18 new QTLs for diverse agronomic traits have been identified utilizing RIL populations derived by crossing salt sensitive RP Bio226 and salt-tolerant Jarava lines. The RIL populations were tested for their salt tolerance both in the field and in pot conditions. The QTLs have been located on chromosomes 1, 2, 6, 10, 11, and 12 using composite interval mapping. The RILs harbored QTLs for component traits of salinity tolerance and displayed a yield advantage over the parents. Therefore, this study paves the way for developing salt-tolerant lines with superior yield characters.

Author Contributions

Conceptualization, P.B.K.K. and R.T.; Formal analysis, Y.D.S. and J.B.; Funding acquisition, R.T.; Investigation, Y.D.S.; Software, A.K.S.; Supervision, P.B.K.K. and R.T.; Validation, Y.D.S. and B.P.; Writing—original draft, Y.D.S.; Writing—review and editing, A.S., M.P., P.B.K.K. and R.T. All authors have read and agreed to the published version of the manuscript.

Funding

This work was not supported by any external funding. The authors acknowledge the support and encouragement extended by the Director, ICAR-IIRR, for carrying out the present research work.

Data Availability Statement

Data that support these studies are available in this article and also with the author Y.D.S.

Conflicts of Interest

Arun Kumar Singh was employed by the company Limagrain India Pvt Ltd. The remaining authors declare that the research was conducted in the absence of any commercial or financial relationships that could be construed as a potential conflict of interest.

References

  1. FAO Global Map of Salt Affected Soils Version 1.0. 2021. Available online: https://www.fao.org/soils-portal/data hub/soil-maps-and-databases/global-map-of-salt-affected-soils/en/ (accessed on 20 October 2021).
  2. Hassani, A.; Azapagic, A.; Shokri, N. Global predictions of primary soil salinization under changing climate in the 21st century. Nat. Commun. 2021, 12, 6663. [Google Scholar] [CrossRef] [PubMed]
  3. Amirjani, M.R. Effect of NaCl on some physiological parameters of rice. Eur. J. Biol. Sci. 2010, 3, 6–16. [Google Scholar]
  4. Rengasamy, P. World salinization with emphasis on Australia. J. Exp. Bot. 2006, 57, 1017–1023. [Google Scholar] [CrossRef]
  5. Daliakopoulos, I.N.; Tsanis, I.K.; Koutroulis, A.; Kourgialas, N.N.; Varouchakis, A.E.; Karatzas, G.P.; Ritsema, C.J. The threat of soil salinity: A European scale review. Sci. Total Environ. 2016, 573, 727–739. [Google Scholar] [CrossRef]
  6. Qadir, M.; Quillérou, E.; Nangia, V.; Murtaza, G.; Singh, M.; Thomas, R.; Drechsel, P.; Noble, A. Economics of salt-induced land degradation and restoration. Nat. Res. Forum 2014, 38, 282–295. [Google Scholar] [CrossRef]
  7. Atta, K.; Mondal, S.; Gorai, S.; Singh, A.P.; Kumari, A.; Ghosh, T.; Roy, A.; Hembram, S.; Gaikwad, D.J.; Mondal, S.; et al. Impacts of salinity stress on crop plants: Improving salt tolerance through genetic and molecular dissection. Front. Plant Sci. 2023, 14, 1241736. [Google Scholar] [CrossRef]
  8. Nahar, L.; Aycan, M.; Lopes Hornai, E.M.; Baslam, M.; Mitsui, T. Tolerance with high yield potential is provided by lower Na+ ion accumulation and higher photosynthetic activity in tolerant YNU31-2-4 rice genotype under salinity and multiple heat and salinity stress. Plants 2023, 12, 1910. [Google Scholar] [CrossRef]
  9. Hoang, T.M.L.; Tran, T.N.; Nguyen, T.K.T.; Williams, B.; Wurm, P.; Bellairs, S.; Mundree, S. Improvement of salinity stress tolerance in rice: Challenges and opportunities. Agronomy 2016, 6, 54. [Google Scholar] [CrossRef]
  10. Giri, D.; Dhital, M.; Chaudhary, B.; Pandey, R.; Bastakoti, B.; Shrestha, S. Effect of different nitrogen levels on yield and yield attributes of different rice varieties in DDSR condition at Kanchanpur, Nepal. Arch. Agric. Environ. Sci. 2022, 7, 310–317. [Google Scholar] [CrossRef]
  11. Hashim, N.; Ali, M.M.; Mahadi, M.R.; Abdullah, A.F.; Wayayok, A.; Kassim, M.S.M.; Jamaluddin, A. Smart farming for sustainable rice production: An insight into application, challenge, and future prospect. Rice Sci. 2024, 31, 47–61. [Google Scholar] [CrossRef]
  12. Tarolli, P.; Luo, J.; Park, E.; Barcaccia, G.; Masin, R. Soil salinization in agriculture: Mitigation and adaptation strategies combining nature-based solutions and bioengineering. iScience 2024, 26, 108830. [Google Scholar] [CrossRef] [PubMed]
  13. Qin, H.; Li, Y.; Huang, R. Advances and challenges in the breeding of salt-tolerant rice. Int. J. Mol. Sci. 2020, 21, 8385. [Google Scholar] [CrossRef] [PubMed]
  14. Haque, M.A.; Rafii, M.Y.; Yusoff, M.M.; Ali, N.S.; Yusuff, O.; Datta, D.R.; Anisuzzaman, M.; Ikbal, M.F. Advanced breeding strategies and future perspectives of salinity tolerance in rice. Agronomy 2021, 11, 1631. [Google Scholar] [CrossRef]
  15. Maheshwari, P.; Kiran, B.; Punita, D.L.; Kavi Kishor, P.B. Overexpression of SbAP37 in rice alleviates concurrent imposition of combination stresses and modulates different sets of leaf protein profiles. Plant Cell Rep. 2017, 36, 773–786. [Google Scholar]
  16. Rajasheker, G.; Anil Kumar, S.; Surender Reddy, P.; Sujatha, E.; Divya, K.; Reddy, P.S.; Jalaja, N.; Jawahar, G.; Insaf, Q.M.; Nagaraju, M.; et al. Overexpression of RNA-binding bacterial chaperones in rice lead to stay-green phenotype, improved yield and tolerance to salt and drought stresses. Physiol. Plant. 2021, 173, 1351–1368. [Google Scholar]
  17. Acosta-Motos, J.R.; Ortuño, M.F.; Bernal-Vicente, A.; Diaz-Vivancos, P.; Sanchez-Blanco, M.J.; Hernandez, J.A. Plant responses to salt stress: Adaptive mechanisms. Agronomy 2017, 7, 18. [Google Scholar] [CrossRef]
  18. Ismail, A.M.; Heuer, S.; Thomson, M.J.; Wissuwa, M. Genetic and genomic approaches to develop rice germplasm for problem soils. Plant Mol. Biol. 2007, 65, 547–570. [Google Scholar] [CrossRef]
  19. Gupta, B.; Huang, B. Mechanism of salinity tolerance in plants: Physiological, biochemical, and molecular characterization. Int. J. Genom. 2014, 2014, 701596. [Google Scholar] [CrossRef]
  20. Wani, S.H.; Kumar, V.; Khare, T.; Guddimalli, R.; Parveda, M.; Solymosi, K.; Suprasanna, P.; Kavi Kishor, P.B. Engineering salinity tolerance in plants: Progress and prospects. Planta 2020, 251, 76. [Google Scholar] [CrossRef]
  21. Karumanchi, A.R.; Sudhakar, P.; Krishna Satya, A.; Meghana, K.; Tejaswini, N.; Geethika Gayatri, P.; Kavi Kishor, P.B. Discerning the dynamics of sodium transport in plants crucial for developing crops resilient to salt stress. Curr. Trends Biotechnol. Pharm. 2023, 17, 968–978. [Google Scholar] [CrossRef]
  22. Rajendran, K.; Tester, M.; Roy, S.J. Quantifying the three main components of salinity tolerance in cereals. Plant Cell Environ. 2009, 32, 237–249. [Google Scholar] [CrossRef] [PubMed]
  23. Yuan, J.; Wang, X.; Zhao, Y.; Khan, N.U.; Zhao, Z.; Zhang, Y.; Wen, X.; Tang, F.; Wang, F.; Li, Z. Genetic basis and identification of candidate genes for salt tolerance in rice by GWAS. Sci. Rep. 2020, 10, 9958. [Google Scholar] [CrossRef]
  24. Beerelli, K.; Balakrishnan, D.; Addanki, K.R.; Surapaneni, M.; Rao, V.Y.; Neelamraju, S. Mapping of QTLs for yield traits using F2:3:4 populations derived from two alien introgression lines reveals qTGW8.1 as a consistent QTL for grain weight from Oryza nivara. Front. Plant Sci. 2022, 13, 790221. [Google Scholar] [CrossRef]
  25. Kulkarni, S.R.; Balachandran, S.M.; Ulaganathan, K. Molecular mapping of QTLs for yield related traits in recombinant inbred line (RIL) population derived from the popular rice hybrid KRH-2 and their validation through SNP genotyping. Sci. Rep. 2020, 10, 13695. [Google Scholar] [CrossRef] [PubMed]
  26. Singh, R.K.; Kota, S.; Flowers, T.J. Salt tolerance in rice: Seedling and reproductive stage QTL mapping come of age. Theor. Appl. Genet. 2021, 134, 3495–3533. [Google Scholar] [CrossRef]
  27. Thomson, M.J.; de Ocampo, M.; Egdane, J.; Rahman, M.K.; Sajise, A.G.; Adorada, D.L.; Tuminbang-Raiz, E.; Blumwald, E.; Seraj, Z.I.; Singh, R.K.; et al. Characterizing the Saltol quantitative trait locus for salinity tolerance in rice. Rice 2010, 3, 148–160. [Google Scholar] [CrossRef]
  28. Li, W.; Li, K.; Huang, Y.; Shi, C.; Hu, W.S.; Zhang, Y.; Zhang, Q.J.; Xia, E.H.; Hutang, G.R.; Zhu, X.G.; et al. SMRT sequencing of the Oryza rufipogon genome reveals the genomic basis of rice adaptation. Commun. Biol. 2020, 3, 167. [Google Scholar] [CrossRef]
  29. Tiwari, K.; Tiwari, S.; Kumar, N.; Sinha, S.; Krishnamurthy, S.L.; Singh, R.; Kalia, S.; Singh, N.K.; Rai, V. QTLs and genes for salt stress tolerance: A journey from seed to seed continued. Plants 2024, 13, 1099. [Google Scholar] [CrossRef]
  30. Kumar, P.; Hazarika, M. Application of correlation analysis in conventional plant breeding and genome wide association mapping. Int. J. Curr. Microbiol. Appl. Sci. 2020, 9, 3372–3375. [Google Scholar] [CrossRef]
  31. Saghai-Maroof, M.A.; Soliman, K.M.; Jorgesen, R.A.; Allard, R.W. Ribosomal DNA spacer-length polymorphisms in barley: Mendelian inheritance, chromosomal location and population dynamics. Proc. Natl. Acad. Sci. USA 1984, 81, 8014–8018. [Google Scholar] [CrossRef]
  32. Chen, X.; Temnykh, S.; Xu, Y. Development of a microsatellite framework map providing genome wide coverage in rice (Oryza sativa L.). Theor. Appl. Genet. 1997, 95, 553–567. [Google Scholar] [CrossRef]
  33. Van Ooijen, J.W. JoinMap 5: Software for the Calculation of Genetic Linkage Maps in Experimental Populations; Kyazma, B.V., Ed.; Wageningen Academic: Wageningen, The Netherlands, 2006. [Google Scholar]
  34. Kosambi, D.D. The estimation of map distances from recombination values. Ann. Eugen. 1944, 12, 172–175. [Google Scholar] [CrossRef]
  35. Wang, S.; Basten, C.J.; Zeng, Z.B. Windows QTL Cartographer 2.5. In User Manual; Department of Statistics, North Carolina State University: Raleigh, NC, USA, 2007; pp. 1–87. [Google Scholar]
  36. Joseph, B.; Jini, D.; Sujatha, S. Biological and physiological perspectives of specificity in abiotic salt stress response from various rice plants. Asian J. Agric. Sci. 2010, 2, 99–105. [Google Scholar]
  37. Rajat, P.; Rao, P.V.R.; John, O.; Prasanta, S.K. Genetics of yield component traits under salt stress at flowering stage and selection of salt tolerant pre-breeding lines for rice improvement. Genetica 2022, 150, 273–288. [Google Scholar]
  38. Messmer, R.; Fracheboud, Y.; Banziger, M.; Vargas, M.; Stamp, P.; Ribaut, J.M. Drought stress and tropical maize: QTL-by-environment interactions and stability of QTLs across environments for yield components and secondary traits. Theor. Appl. Genet. 2009, 119, 913–930. [Google Scholar] [CrossRef] [PubMed]
  39. Singh, G.; Khanna, R.; Kaur, R.; Kaur, K.; Kaur, R.; Sharma, N.; Mangat, G.S. Performance under multi-environment trial for quantitative traits of rice (Oryza sativa L.) genotypes in North-West India (Punjab). Ecolog. Genet. Genom. 2023, 28, 100190. [Google Scholar] [CrossRef]
  40. Tiwari, S.S.L.K.; Kumar, V.; Singh, B.; Rao, A.; Mithra, S.V.A. Mapping QTLs for salt tolerance in rice (Oryza sativa L.) by bulked sergeant analysis of recombinant inbred lines using 50K SNP chip. PLoS ONE 2016, 11, e0153610. [Google Scholar] [CrossRef]
  41. Quan, X.; Liang, X.; Li, H.; Xie, C.; He, W.; Qin, Y. Identification and characterization of wheat germplasm for salt tolerance. Plants 2021, 10, 268. [Google Scholar] [CrossRef]
  42. Gautam, R.K.; Sethi, G.S.; Plaha, P. Some useful characters implicated in tolerance to low phosphorus and water stresses in hexaploid triticale × bread wheat derivatives. Cereal Res. Commun. 2000, 28, 117–121. [Google Scholar] [CrossRef]
  43. Porch, T.G. Application of stress indices for heat tolerance screening of common bean. J. Agron. Crop Sci. 2006, 192, 390–394. [Google Scholar] [CrossRef]
  44. Ali, S.; Gautam, R.K.; Mahajan, R.; Krishnamurthy, S.L.; Sharma, S.K.; Singh, R.K.; Ismail, A.M. Stress indices and selectable traits in SALTOL QTL introgressed rice genotypes for reproductive stage tolerance to sodicity and salinity stresses. Field Crops Res. 2013, 154, 65–73. [Google Scholar] [CrossRef]
  45. Sabesan, T.; Suresh, R.; Saravanan, K. Genetic variability and correlation for yield and grain quality characters of rice grown in coastal saline low land of Tamil Nadu. Electron. J. Plant Breed. 2009, 1, 56–59. [Google Scholar]
  46. Chakraborty, S.; Das, P.K.; Guha, B.; Kalyan, K.S.; Barman, B. Quantitative genetic analysis for yield and yield components in boro rice (Oryza sativa L.). J. Nat. Sci. Biol. Med. 2010, 2, 117–120. [Google Scholar] [CrossRef]
  47. Cho, S.K.; Jeung, J.U.; Kang, K.H.; Shim, K.S.; Jung, K.W.; You, M.K.; Ok, S.H.; Chung, Y.S.; Hwang, H.G.; Choi, H.C.; et al. Identification of genes induced in wound-treated wild rice (Oryza minuta). Mol. Cells 2004, 17, 230–236. [Google Scholar] [CrossRef]
  48. Ram, S.G.; Thiruvengadam, V.; Vinod, K.K. Genetic diversity among cultivars, landraces and wild relatives of rice as revealed by microsatellite markers. J. Appl. Genet. 2007, 48, 337–345. [Google Scholar] [CrossRef]
  49. Solis, C.A.; Yong, M.T.; Vinarao, R.; Jena, K.; Holford, P.; Shabala, L.; Zhou, M.; Shabala, S.; Chen, Z.H. Back to the wild: On a quest for donors toward salinity tolerant rice. Front. Plant Sci. 2020, 11, 323. [Google Scholar] [CrossRef] [PubMed]
  50. Majumder, A.L.; Aparajita, D.C.; Lily, G.; Susmita, M.; Sudipta, R. Introgression of a novel salt-tolerant L-myo-inositol 1-phosphate synthase from Porteresia coarctata (Roxb.) Tateoka (PcINO1) confers salt tolerance to evolutionary diverse organisms. FEBS Lett. 2006, 580, 3980–3988. [Google Scholar]
  51. Takehisa, H.; Shimodate, T.; Fukuta, Y.; Ueda, T.; Yano, M.; Yamaya, T.; Kameya, T.; Sato, T. Identification of quantitative trait loci for plant growth of rice in paddy field flooded with salt water. Field Crop Res. 2004, 89, 85–95. [Google Scholar] [CrossRef]
  52. Lee, S.Y.; Ahn, J.H.; Cha, Y.S.; Yun, D.W.; Lee, M.C.; Ko, J.C.; Lee, K.S.; Eun, M.Y. Mapping related to salinity tolerance of rice at the young seedling stage. Plant Breed. 2007, 126, 43–46. [Google Scholar] [CrossRef]
  53. Ren, Z.H.; Gao, J.P.; Li, L.G.; Cai, X.L.; Huang, W.; Chao, D.Y.; Zhu, M.Z.; Wang, Z.Y.; Luan, S.; Lin, H.X. A rice quantitative trait locus for salt tolerance encodes a sodium transporter. Nat. Genet. 2005, 37, 1141–1146. [Google Scholar] [CrossRef]
  54. Bimpong, I.K.; Manneh, B.; Diop, B.; Ghislain, K.; Sow, A.; Amoah, N.K.A.; Gregorio, G.; Singh, R.K.; Ortiz, R.; Wopereis, M. New quantitative trait loci for enhancing adaptation to salinity in rice from Hasawi, a Saudi landrace into three African cultivars at the reproductive stage. Euphytica 2014, 200, 45–60. [Google Scholar] [CrossRef]
  55. Amoah, N.K.A.; Akromah, R.; Kena, A.W.; Manneh, B.; Dieng, I.; Bimpong, I.K. Mapping QTLs for tolerance to salt stress at the early seedling stage in rice (Oryza sativa L.) using a newly identified donor “Madina Koyo”. Euphytica 2020, 216, 156. [Google Scholar] [CrossRef]
  56. Ammar, M.H.M.; Pandit, A.; Singh, R.K.; Sameena, S.; Chauhan, M.S.; Singh, A.K.; Sharma, P.C.; Gaikwad, K.; Sharma, T.R.; Mohapatra, T.; et al. Mapping of QTLs controlling Na+, K+ and CI ion concentrations in salt tolerant Indica rice variety CSR27. J. Plant Biochem. Biotechnol. 2009, 18, 139–150. [Google Scholar] [CrossRef]
  57. Hossain, H.; Rahman, M.A.; Alam, M.S.; Singh, R.K. Mapping of quantitative trait loci associated with reproductive-stage salt tolerance in rice. J. Agron Crop Sci. 2015, 201, 17–31. [Google Scholar] [CrossRef]
  58. Mondal, S.; Septiningsih, E.M.; Singh, R.K.; Thomson, M.J. Mapping QTLs for reproductive stage salinity tolerance in rice using a cross between Hasawi and BRRI dhan28. Int. J. Mol. Sci. 2022, 23, 11376. [Google Scholar] [CrossRef] [PubMed]
  59. Nakhla, W.R.; Sun, W.; Fan, K.; Yang, K.; Zhang, C.; Yu, S. Identification of QTLs for salt tolerance at the germination and seedling stages in rice. Plants 2021, 10, 428. [Google Scholar] [CrossRef]
  60. Gregorio, G.B.; Senadhira, D.; Mendoza, R.D. Screening rice for salinity tolerance. International Rice Research Institute, Manila, Philippines. In IRRI Discussion Paper Series Number 22; IRRI: Los Baños, Philippines, 1997; pp. 1–30. [Google Scholar]
  61. Sabouri, H.; Rezai, A.M.; Moumeni, A.; Kavousi, A.; Katouzi, M.; Sabouri, A. QTLs mapping of physiological traits related to salt tolerance in young rice seedlings. Biol. Plant. 2009, 53, 657–662. [Google Scholar] [CrossRef]
  62. Leon, T.B.; Linscombe, S.; Subudhi, P.K. Molecular dissection of seedling salinity tolerance in rice (Oryza sativa L.) using a high- density GBS-Based SNP linkage map. Rice 2016, 9, 52. [Google Scholar] [CrossRef]
  63. Rodríguez Coca, L.I.; García González, M.T.; Gil Unday, Z.; Jiménez Hernández, J.; Rodríguez Jáuregui, M.M.; Fernández Cancio, Y. Effects of Sodium Salinity on Rice (Oryza sativa L.) Cultivation: A Review. Sustainability 2023, 15, 1804. [Google Scholar] [CrossRef]
  64. Bimpong, I.K.; Manneh, B.; El-Namaky, R.; Diaw, F.; Amoah, N.K.A.; Sanneh, B.; Ghislain, K.; Sow, A.; Singh, R.K.; Gregorio, G.; et al. Mapping QTLs related to salt tolerance in rice at the young seedling stage using 384-plex single nucleotide polymorphism SNP, marker sets. Euphytica 2013, 200, 45–60. [Google Scholar] [CrossRef]
  65. Ghomi, K.; Rabiei, B.; Sabcuri, H.; Sabouri, A. Mapping QTLs for traits related to salinity tolerance at seedling stage of rice (Oryza sativa L.). OMICS J. Inte. Biol. 2013, 17, 242–251. [Google Scholar] [CrossRef] [PubMed]
  66. Goto, I.; Neang, S.; Kuroki, R.; Reyes, V.P.; Doi, K.; Skoulding, N.S.; Taniguchi, M.; Yamauchi, A.; Mitsuya, S. QTL analysis for sodium removal ability in rice leaf sheaths under salinity using an IR-44595/318 F2 population. Front. Plant Sci. 2022, 13, 1002605. [Google Scholar] [CrossRef] [PubMed]
  67. Lu, C.; Jian, Z.; Xiao-biao, P.; Zang, F.; Tian-qing, Z.; Xiu-qing, Z.; Wang, W.; Ali, J.; Xu, J.; Li, Z. Advanced backcross QTL analysis for the whole plant growth duration salt tolerance in rice (Oryza sativa L.). J. Integr. Agric. 2014, 13, 1609–1620. [Google Scholar]
  68. Park, J.R.; Seo, J.; Park, S.; Jin, M.; Jeong, O.Y.; Park, H.S. Identification of potential QTLs related to grain size in rice. Plants 2023, 12, 1766. [Google Scholar] [CrossRef]
  69. Wang, Z.; Cheng, J.; Chen, Z.; Huang, J.; Bao, Y.; Wang, J.; Zhang, H. Identification of QTLs with main, epistatic and QTL × environment interaction effects for salt tolerance in rice seedlings under different salinity conditions. Theor. Appl. Genet. 2012, 125, 807–815. [Google Scholar] [CrossRef]
  70. Masood, S.; Seiji, Y.; Zabta, K.; Shinwari, Z.K.; Anwar, R. Mapping quantitative trait loci (QTLs) for salt tolerance in rice (Oryza Sativa) using RFLPs. Pak. J. Bot. 2004, 36, 825–834. [Google Scholar]
  71. Kim, T.H.; Kim, S.M. Identification of candidate genes for salt tolerance at the seedling stage using integrated genome-wide association study and transcriptome analysis in rice. Plants 2023, 12, 1401. [Google Scholar] [CrossRef] [PubMed]
  72. Javed, M.A.; Huyop, F.Z.; Wagiran, A.; Salleh, F.M. Identification of QTLs for morph-physiological traits related to salinity tolerance at seedling stage in indica rice. Procedia Environ. Sci. 2011, 8, 389–395. [Google Scholar] [CrossRef]
  73. Satasiya, P.; Patel, S.; Patel, R.; Raigar, O.P.; Modha, K.; Parekh, V.; Joshi, H.; Patel, V.; Chaudhary, A.; Sharma, D.; et al. Meta-analysis of identified genomic regions and candidate genes underlying salinity tolerance in rice (Oryza sativa L.). Sci. Rep. 2024, 14, 5730. [Google Scholar]
  74. Zheng, H.; Zhao, H.; Liu, H.; Wang, J.; Zou, D. QTL analysis of Na+ and K+ concentrations in shoots and roots under NaCl stress based on linkage and association analysis in japonica rice. Euphytica 2015, 201, 109–121. [Google Scholar] [CrossRef]
  75. Alam, R.; Rahman, M.S.; Seraj, Z.I.; Thomson, M.J.; Ismail, A.M.; Tumimbang-Raiz, E.; Gregorio, G.B. Investigation of seedling-stage salinity tolerance QTLs using backcross lines derived from Oryza sativa L. Pokkali. Plant Breed. 2011, 130, 430–437. [Google Scholar] [CrossRef]
  76. Lin, H.X.; Zhu, M.Z.; Yano, M.; Gao, J.P.; Liang, Z.W.; Su, W.A.; Hu, X.H.; Ren, Z.H.; Chao, D.Y. QTLs for Na+ and K+ uptake of the shoots and roots controlling rice salt tolerance. Theor. Appl. Genet. 2004, 108, 253–260. [Google Scholar] [CrossRef] [PubMed]
  77. Ul Haq, T.; John, G.B.; Javaid, A.C.; Nasim, A.D.; Katherine, A.; Steele, B.E. Dynamic quantitative trait loci for salt stress components on chromosome 1 of rice. Funct. Plant Biol. 2010, 37, 634–645. [Google Scholar] [CrossRef]
  78. Cheng, L.; Wang, Y.; Meng, L.; Hu, X.; Cui, Y.; Sun, Y.; Zhu, L.; Ali, J.; Xu, J.; Li, Z. Identification of salt-tolerant QTLs with strong genetic background effect using two sets of reciprocal introgression lines in rice. Genome 2011, 55, 45–55. [Google Scholar] [CrossRef]
  79. Bonilla, P.; Dvorak, J.; Mackill, D.; Deal, K.; Gregorio, G. RFLP and SSLP mapping of salinity tolerance genes in chromosome 1 of rice (Oryza sativa L.) using recombinant inbred lines. Philipp. J. Agric. Sci. 2002, 85, 68–76. [Google Scholar]
  80. Chattopadhyay, K.; Nath, D.; Mohanta, R.L.; Bhattacharyya, S.; Marndi, B.C.; Nayak, A.K. Diversity and validation of microsatellite markers in ‘Saltol’ QTL region in contrasting rice genotypes for salt tolerance at the early vegetative stage. Aust. J. Crop Sci. 2014, 8, 356–362. [Google Scholar]
  81. Niones, J.M. Fine Mapping of the Salinity Tolerance Gene on Chromosome 1 of Rice (Oryza sativa L.) Using Near-Isogenic Lines. Master’s Thesis, University of the Philippines, Los Banos, Philippines, 2004; 78p. [Google Scholar]
  82. Khan, M.A.; Abdullah, Z. Salinity-sodicity induced changes in reproductive physiology of rice (Oryza sativa) under dense soil conditions. Environ. Exp. Bot. 2003, 49, 145–157. [Google Scholar] [CrossRef]
Figure 1. The figure depicts phenotypic data related to plant height (cm) on the x-axis; panicle number, panicle length (cm), biomass (g = grams), final yield (g = grams), salinity score, Na+ concentration (parts per million, ppm), K+ concentrations (ppm), and Na+/K+ ratio in RP Bio226 and Jarava varieties grown under saline conditions and recombinant inbred line (RIL) populations are on the y-axis. NS, MS, and SS represent non-saline, moderately saline, and slightly saline, respectively, in the salinity stress field (ECe 9.2–10 ds/m) and pot conditions (ECe 3.4 ds/m). The data represent data for 5 plants in a line and for 3 plants grown in pot conditions.
Crops 04 00047 g001
Figure 2. Linkage maps showing chromosomal locations of 21 QTLs detected for tolerance to salinity for different phenotypic traits in Jarava x RPBio226 RILs.
Crops 04 00047 g002
Figure 3. Map depiction of QTLs for yield and salinity component traits on chromosome 2. 1. Days to seedling survival (QDss2a), shoot K+ concentration (QSkc2), and shoot K+/Na+ (QKna2); 2. Salt toxicity symptoms (QSst2a); 3. Shoot Na+ concentration (QSnc2), salt toxicity symptoms (QSst2b), and days to seedling survival (QDss2b); 4. qSKC-1; 5. qSDW-2; 6. qNa-2a; 7. qNa-2b; 8. qPL-2; 9. qPH 2 and qRKC 2; 10. qCHL 2; 11. qDW 2.1; 12. qDW 2.2; 13. qFW 2.1; 14. qSTS2 15. qNa2.7; 16. qSIS2.8; 17. qSIS2.19; 18. qSIS2.28; 19. K+ concentration and Na+/K+ ratio; 20. Na+/K+ ratio; 21. Chlorophyll content; 22. Shoot length; 23. Root length; 24. Shoot/root ratio; 25. Salt sensitivity index for grain yield; 26. Grain yield/plant and seed fertility; 27. Grain yield/plant, seed fertility, and 1000 grain weight; 28. Tiller number.
Crops 04 00047 g003
Figure 4. Map displaying QTLs for yield and salinity component traits on chromosome 1. 1. Shoot K+ concentration (QSkc11); 2. Shoot K+/Na+ (QKna11); 3. Standard tolerance ranking (QTR 11), salt tolerance (RM224 and RM26063), and salt injury score (qSIS11.2); 4. Seed fertility (qSF 11.5 and qSF 11.6); 5. Grain yield/plant (qGYP 11.7); 6. Shoot Na+ content (qSNC 11); 7. Dry shoot weight (R728 and G257) and dry root weight (qDWT11.2); 8. Dry root weight (G257 and R728); 9. Fresh shoot weight (RM287); 10. Chlorophyll content (qCHL11.1 and qCHL11.2).
Crops 04 00047 g004
Table 1. Mean performance of parents and RILs for different parameters screened for salt tolerance over two years.
Parental LinesRecombinant Inbred Lines
JaravaRPBio226MeanRangeSkewnessKurtosis
CFSPSCFSPSCFSPSCFSPSCFSPSCFSPS
PH10998.568.3795.878.64096.47 ± 6.9572.7 ± 7.6161.16 ± 8.5976.6–12165.2–104.437.5–80.5−0.34−0.01−0.320.190.31−0.01
PN10.26.85.626.75.617.89 ± 1.392.79 ± 1.275.37 ± 2.794.1–11.84.2–9.61–140.050.960.960.27−0.60.64
PL22.42019.3421.116.5920.79 ± 1.7414.37 ± 3.6517.06 ± 3.4116.5–25.315.8–22.48–31.750.04−0.160.27−0.091.472.45
BM42.233.5183526.3535.74 ± 7.6418.83 ± 7.2117.10 ± 7.4019.7–5719.5–46.92–37.50.230.660.62−0.490.510.06
YL19.213.18.1815.17.41.513.33 ± 3.411.44 ± 2.795.32 ± 3.147.9–22.54.3–20.31–160.310.311.02−0.150.291
Na+ 183.5 286.6 185.17 ± 43.28 97.4–296.9 0.53 −0.21
K+ 64.5 37.03 47.81 ± 19.34 17.1–119 1.24 2.01
Na+/K+ 2.89 7.81 4.74 ± 2.33 1.1–12.9 0.99 1.27
Score 4.5 8.25 5.37 ± 2.27 1–9 0.08 −0.81
C: control; FS: salinity stress in field experiment; PS: salinity stress in pot experiment; PH: plant height (cm); PN: panicle number; PL: panicle length (cm); BM: biomass (g); YL: yield (g); Na+: Na+ concentration (ppm); K+: K+ concentration (ppm); Na+/K+ ratio.
Table 2. Salinity susceptibility index.
TraitsParental LinesRecombinant Inbred Lines
JaravaRPBio226MeanRangeSkewnessKurtosis
SSI Plant height0.10.180.99 ± 0.58−0.57–2.25−0.26−0.19
SSI Tiller number0.330.160.83 ± 1.37−5.90–4.06−0.943.03
SSI Panicle number0.320.240.83 ± 1.38−6.33–4.05−1.023.71
SSI Panicle length−0.030.080.96 ± 0.58−0.79–2.53−0.18−0.02
SSI Biomass0.210.250.75 ± 1.64−5.50–4.75−0.51.14
SSI Yield0.240.550.73 ± 1.85−5.33–4.61−0.810.16
Table 3. Phenotypic correlations among salinity components and yield traits.
TraitStressPHTNPNPLBMYLNa+ ConcK+ ConcNa+/K+ ConcScore
TNControl
FS−0.03
PS0.28 **
PNControl0.05
FS−0.030.99
PS0.26 **0.68 **
PLControl0.35 ** 0.1 **
FS0.68 **−0.12−0.11
PS0.45 **0.000.15
BMControl0.4 ** 0.5 **0.21 **
FS0.2 **0.25 **0.26 **0.12
PS0.2 *0.32 **0.160.26 **
YLControl0.29 ** 0.41 **0.140.74 **
FS0.2 **0.10.10.120.67 **
PS0.2 *0.36 **0.24 *0.30 **0.87 **
Na+ concPS−0.16−0.19 *−0.090.05−0.35 **−0.38 **
K+ concPS0.050.31 **0.21 *−0.010.35 **0.41 **−0.34
Na++/K+ concPS−0.09−0.33 **−0.33−0.02−0.50 **−0.57 **0.54−0.67
ScorePS−0.13−0.27 **0.19 *−0.23 *−0.61 **−0.71 **0.36−0.44 **0.68 **1
Significant at * p < 0.05, ** p < 0.01, df = 115.
Table 4. QTLs for yield and its components under salinity stress under saline field conditions.
TraitQTLChrLOD ScoreMarker IntervalAdditive EffectPVE%
PHqPHSt-225.2RM262-RM26342.4528.12
qPHSt-6.162.62RM589-RM586−2.645.93
qPHSt-6.263.41RM204-RM276−2.6410.32
PNqPNSt-112.66RM10115-RM34260.317.56
qPNSt-11112.71RM224-RM207−0.5310.44
PLqPLSt-663.16RM589-RM586−0.496.89
BMqBMSt-222.69RM262-RM2631.819.03
qBMSt-10103.93RM24893-RM25846−4.4910.78
qBMSt-11112.94RM224-RM207−1.769.33
qBMSt-12123.02RM27971-RM7102−1.999.97
SPYLqYLSt-12122.81RM27940-RM27971−0.786.41%
Table 5. QTLs for yield and its components and salinity resistance and components of salinity resistance under salinity stress in pot experiment.
TraitQTLChrLOD ScoreMarker IntervalAdditive EffectPVE%
PHqPHSt-12.2122.5RM27940-RM27971−9.078.07
PNqTNSt-10102.73RM24893-RM25846−0.56.1
PLqPLSt-1.113.93RM3426-RM5638−1.0513.25
qPLSt-1.212.97RM11504-RM3482−0.8610.9
qPLSt-222.5RM3294-RM12849−0.776.97
STqSTR-222.6RM110-RM4230.68.9
qSTR-11112.23RM3717-RM2860.698.9
NCqSN-11112.92RM26622-RM2124.776.49
qSN-12122.8RM17-RM2858726.867.51
NKqSNK-12.1123.53RM17-RM285871.2715.65
qSNK-12.2122.77RM28587-RM288821.0611.19
qYLSt-222.05RM13863-RM33160.725.8
Table 6. High yielding and salinity resistant RILs with identified QTLs.
RILsScoreYield (g)Na+ Conc.K+ Conc.Na+/K+QTL% Inc. Over SP% Inc. Over RP
RP 5899-RIL-52111.5164.684.71.94qSN-12 + qSNK-12.1 + qYLSt-1286.9628.87
RP 5899-RIL-57111154.346.73.30qSN-1186.3625.64
RP 5899-RIL-60115148.248.33.07qSTR-2 + qSN-12 + qSNK-12.1 + qSNK-12.2 + qYLSt-1290.0045.47
RP 5899-RIL-11415.5131.733.23.97qSN-12 + qSNK-12.1 + qSNK-12.272.73−48.73
RP 5899-RIL-1411916888.11.91qSN-11 + qSN-12 + qSNK-12.183.339.11
RP 5899-RIL-142111132.71191.12qSTR-2 + qSN-12 + qSNK-12.186.3625.64
Jarava4.58.18183.564.52.89
RP Bio2268.251.5286.637.037.81
Disclaimer/Publisher’s Note: The statements, opinions and data contained in all publications are solely those of the individual author(s) and contributor(s) and not of MDPI and/or the editor(s). MDPI and/or the editor(s) disclaim responsibility for any injury to people or property resulting from any ideas, methods, instructions or products referred to in the content.

