
Wheat Grain Protein Composition—A Screening Tool to Be Used in Plant Breeding for Improved Tajik Food Security

 ,
,  , ,
, , 
Abstract

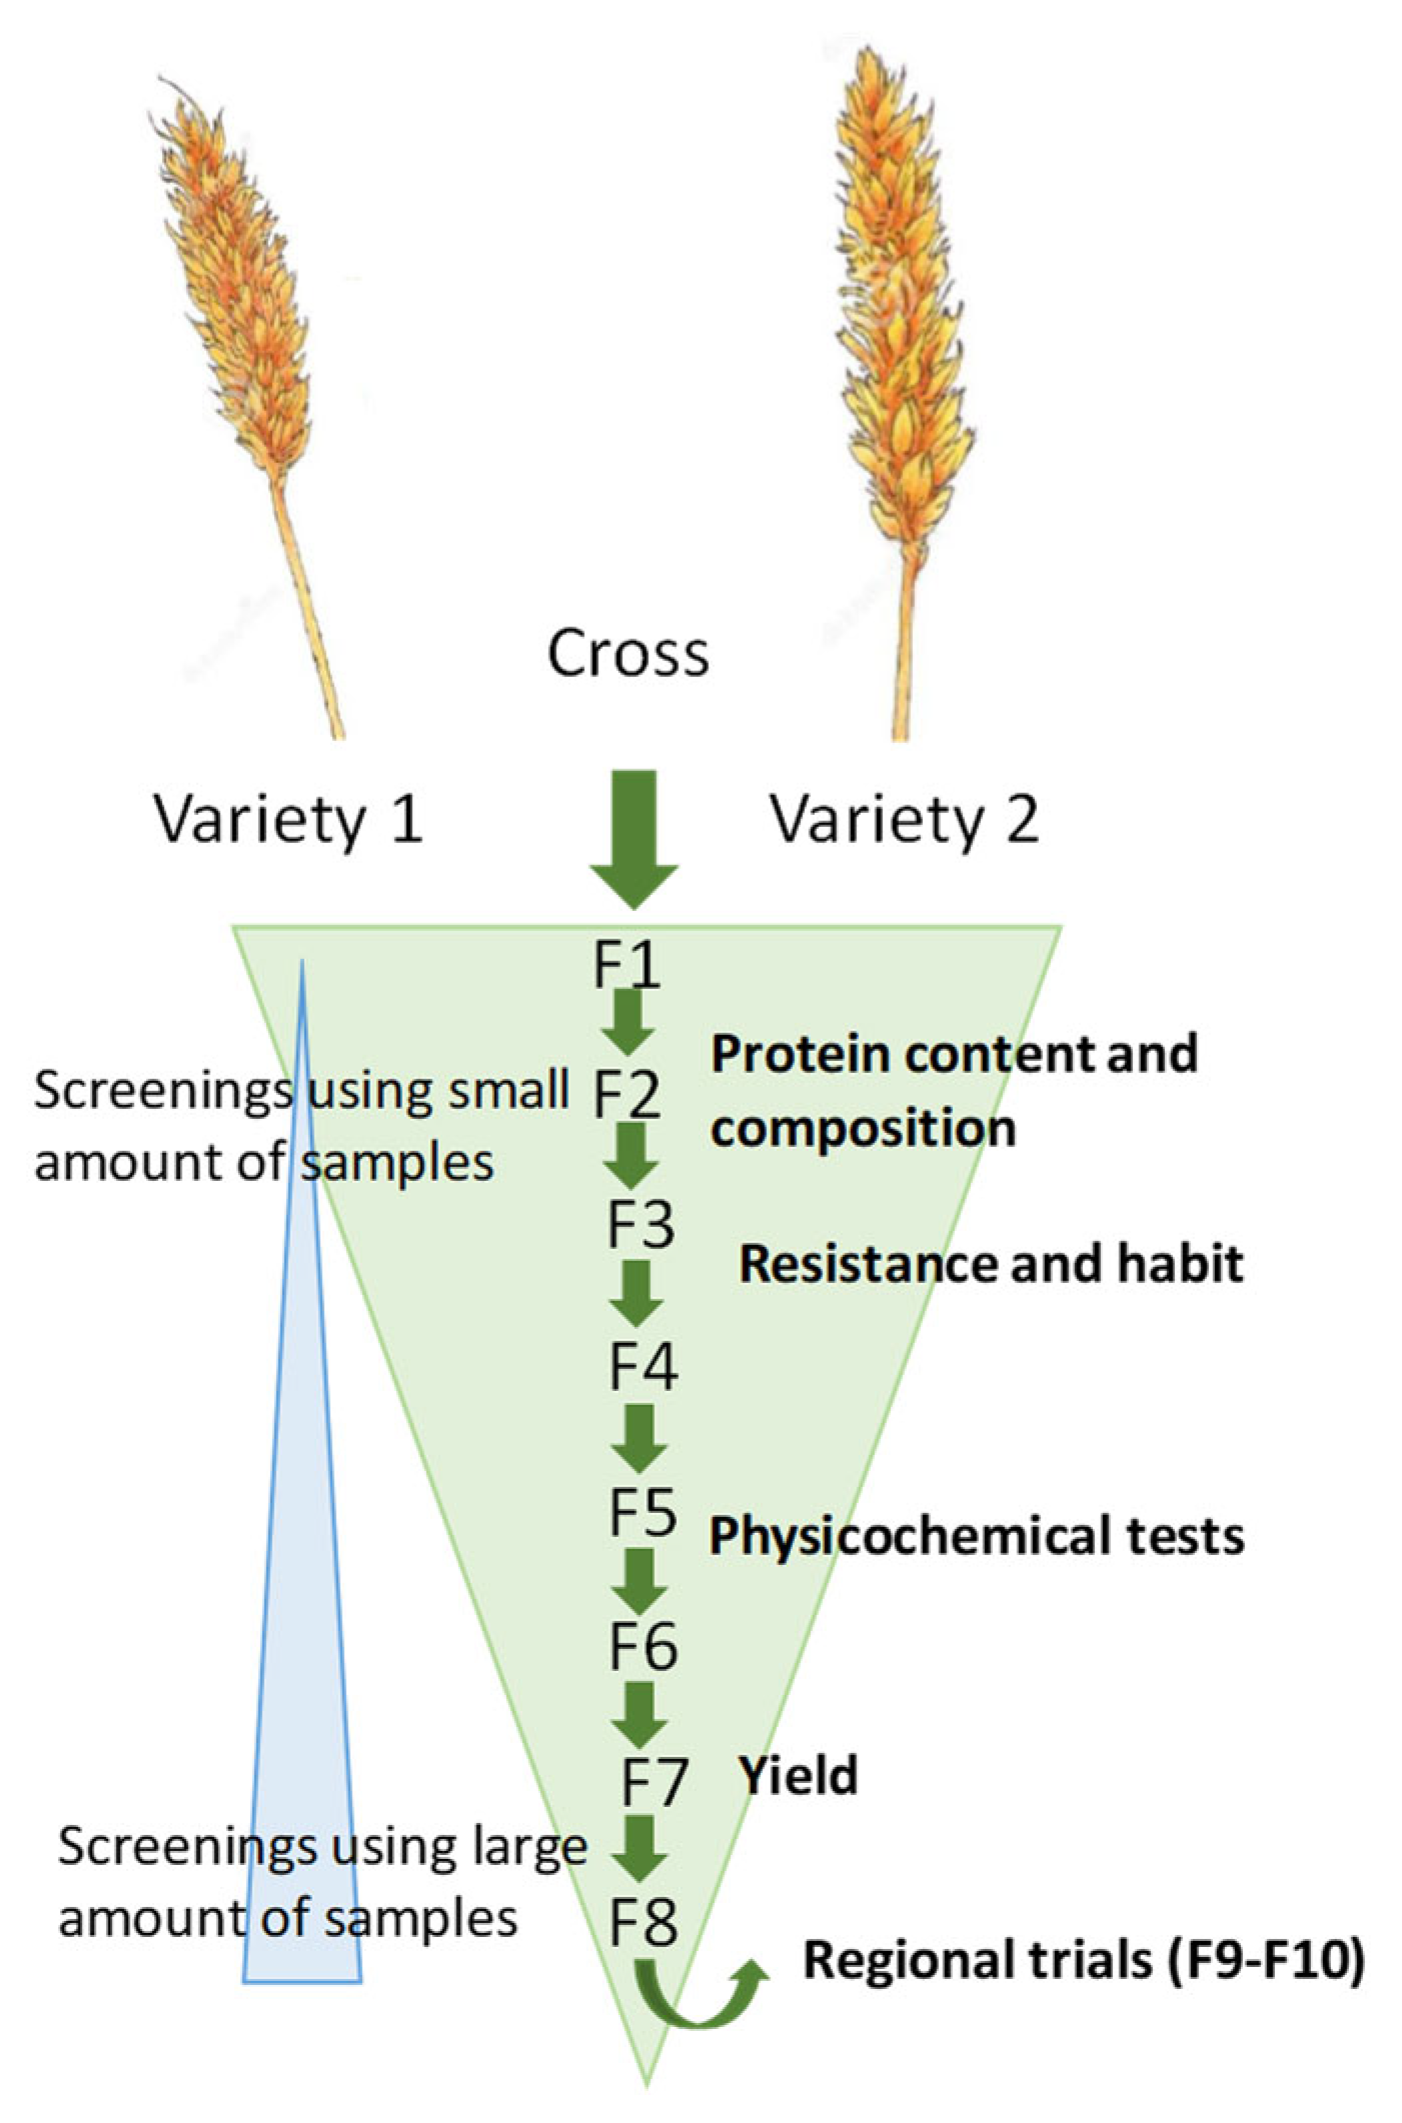
1. Introduction
2. Materials and Methods
2.1. Plant Material
2.2. Experimental Methods
2.2.1. Size-Exclusion High-Performance Liquid Chromatography (SE-HPLC)
2.2.2. Sodium Dodecyl Sulphate Polyacrylamide Gel Electrophoresis (SDS-PAGE)
2.3. Statistical Analyses
3. Results and Discussion
3.1. Plant Breeding to Improve Bread-Making Quality of Tajik Wheat
3.2. Protein Composition as a Breeding Tool for Increased Food Security for the Tajik Population
3.3. Tajik Wheat and Its Protein Composition as an Example of Opportunities for Wheat Breeding to Improve the Baking Quality of Wheat in Developing Countries in the Regions of Central Asia and North Africa
3.4. Wheat Grain Protein Composition as a Screening Tool in Plant Breeding for Improved Baking Quality
4. Conclusions
Supplementary Materials
Author Contributions
Funding
Data Availability Statement
Conflicts of Interest
References
- Poehlman, J.M.; Sleper, D.A. Methods in plant breeding. In Breeding Field Crops; Iowa State University Digital Press: Ames, IA, USA, 1995; pp. 172–174. [Google Scholar]
- Bernardo, R. Essentials of Plant Breeding; Stemma Press: Woodbury, MN, USA, 2014. [Google Scholar]
- Heisey, P.W. Agricultural Research and Development, Agricultural Productivity, and Food Security; Economic Research Service: Washington, DC, USA, 2001. [Google Scholar]
- Johansson, E.; Muneer, F.; Prade, T. Plant Breeding to Mitigate Climate Change—Present Status and Opportunities with an Assessment of Winter Wheat Cultivation in Northern Europe as an Example. Sustainability 2023, 15, 12349. [Google Scholar] [CrossRef]
- De Sousa, T.; Ribeiro, M.; Sabenca, C.; Igrejas, G. The 10,000-year success story of wheat! Foods 2021, 10, 2124. [Google Scholar] [CrossRef] [PubMed]
- Luby, J.J.; Shaw, D.V. Plant breeders’ perspectives on improving yield and quality traits in horticultural food crops. HortScience 2009, 44, 20–22. [Google Scholar] [CrossRef]
- Gaunt, R.E. The relationship between plant disease severity and yield. Annu. Rev. Phytopathol. 1995, 33, 119–144. [Google Scholar] [CrossRef] [PubMed]
- Galanakis, C.M. Trends in Wheat and Bread Making; Academic Press: Cambridge, MA, USA, 2020. [Google Scholar]
- Baardseth, P.; Kvaal, K.; Lea, P.; Ellekjaer, M.R.; Faergestad, E.M. The effects of bread making process and wheat quality on French baguettes. J. Cereal Sci. 2000, 32, 73–87. [Google Scholar] [CrossRef]
- Johansson, E.; Branlard, G.; Cuniberti, M.; Flagella, Z.; Hüsken, A.; Nurit, E.; Peña, R.J.; Sissons, M.; Vazquez, D. Genotypic and environmental effects on wheat technological and nutritional quality. In Wheat Quality for Improving Processing and Human Health; Igrejas, G., Ikeda, T., Guzmán, C., Eds.; Springer: Cham, Switzerland, 2020; pp. 171–204. [Google Scholar]
- Johansson, E.; Malik, A.H.; Hussain, A.; Rasheed, F.; Newson, W.R.; Plivelic, T.; Hedenqvist, M.S.; Gällstedt, M.; Kuktaite, R. Wheat gluten polymer structures: The impact of genotype, environment, and processing on their functionality in various applications. Cereal Chem. 2013, 90, 367–376. [Google Scholar] [CrossRef]
- Helguera, M.; Abugalieva, A.; Battenfield, S.; Békés, F.; Branlard, G.; Cuniberti, M.; Hüsken, A.; Johansson, E.; Morris, C.F.; Nurit, E.; et al. Grain quality in breeding. In Wheat Quality for Improving Processing and Human Health; Igrejas, G., Ikeda, T., Guzmán, C., Eds.; Springer: Cham, Switzerland, 2020; pp. 273–307. [Google Scholar]
- Selga, L.; Johansson, E.; Andersson, R. Prediction models to evaluate baking quality instruments for commercial wheat flour. Cereal Chem. 2024, 101, 681–691. [Google Scholar] [CrossRef]
- De Beer, T. Quality assessment of wheat flour, dough, and bread. In ICC Handbook of 21st Century Cereal Science and Technology; Academic Press: Cambridge, MA, USA, 2023; pp. 225–233. [Google Scholar]
- Baráth, N.; Ungai, D.K.; Kovács, B. Overview of test methods used to classify wheat flour and bread samples. Acta Agrar. Debreceniensis 2023, 2, 27–34. [Google Scholar] [CrossRef]
- Johansson, E.; Henriksson, P.; Svensson, G.; Heneen, W.K. Detection, chromosomal location and evaluation of the functional value of a novel high Mr glutenin subunit found in Swedish wheats. J. Cereal Sci. 1993, 17, 237–245. [Google Scholar] [CrossRef]
- Malik, A.H.; Prieto-Linde, M.L.; Kuktaite, R.; Andersson, A.; Johansson, E. Individual and interactive effects of cultivar maturation time, nitrogen regime and temperature level on accumulation of wheat grain proteins. J. Sci. Food Agric. 2011, 91, 2192–2200. [Google Scholar] [CrossRef]
- Shewry, P.R.; Halford, N.G.; Lafiandra, D. Genetics of wheat gluten proteins. Adv. Genet. 2003, 49, 111–184. [Google Scholar] [PubMed]
- Husenov, B.; Otambekova, M.; Muminjanov, H.; Morgounov, A.; Asaad, S.; Garkava-Gustavsson, L.; Johansson, E. Constraints and perspectives for sustainable wheat production in Tajikistan. Front. Sustain. Food Syst. 2020, 4, 27. [Google Scholar] [CrossRef]
- FAO. Special Report-2020 FAO/WFP Crop and Food Security Assessment Mission (CFSAM) to the Republic of Tajikistan; World Food Programme: Rome, Italy, 2021. [Google Scholar] [CrossRef]
- Muminjanov, H.; Otambekova, M.; Morgounov, A. The history of wheat breeding in Tajikistan. In The World Wheat Book; Lavoisier: Cachan, France, 2015; Volume 3, pp. 283–305. [Google Scholar]
- Husenov, B.; Asaad, S.; Muminjanov, H.; Garkava-Gustavsson, L.; Johansson, E. Sustainable wheat production and food security of domestic wheat in Tajikistan: Implications of seed health and protein quality. Int. J. Environ. Res. Public. Health 2021, 18, 5751. [Google Scholar] [CrossRef] [PubMed]
- Husenov, B.; Aakhkamov, M.; Garkava-Gustavsson, L.; Muminjanov, H.; Johansson, E. Breeding for wheat quality to assure food security of a staple crop: The case study of Tajikistan. Agric. Food Secur. 2015, 4, 1–8. [Google Scholar] [CrossRef]
- Available online: https://blogs.worldbank.org/en/europeandcentralasia/tackling-food-insecurity-tajikistan (accessed on 8 November 2024).
- Gupta, R.B.; Khan, K.; MacRitchie, F. Biochemical basis of flour properties in bread wheat. I. Effects of variation in the quantity and size distribution of polymeric protein. J. Cereal Sci. 1993, 18, 23–41. [Google Scholar] [CrossRef]
- Johansson, E.; Prieto-Linde, M.L.; Gissén, C. Influences of weather, cultivar and fertiliser rate on grain protein polymer accumulation in field-grown winter wheat, and relations to grain water content and falling number. J. Sci. Food Agric. 2008, 88, 2011–2018. [Google Scholar] [CrossRef]
- Payne, P.I.; Holt, L.M.; Thompson, R.D.; Bartels, D.; Harberd, N.P.; Harris, P.A.; Law, C.N. The high-molecular-weight subunits of glutenin: Classical genetics, molecular genetics and the relationship to bread-making quality. In Proceedings of the sixth International Wheat Genetics Symposium/edited by Sadao Sakamoto, Kyoto, Japan, 28 November–3 December 1983; Germ-Plasm Institute, Faculty of Agriculture, Kyoto University: Kyoto, Japan, 1983; pp. 824–834. [Google Scholar]
- Payne, P.I.; Holt, L.M.; Jackson, E.A.; Law, C.N. Wheat storage proteins: Their genetics and their potential for manipulation by plant breeding. Philos. Trans. R. Soc. Lond. B Biol. Sci. 1984, 304, 359–371. [Google Scholar]
- Payne, P.I.; Holt, L.M.; Law, C.N. Structural and genetical studies on the high-molecular-weight subunits of wheat glutenin: Part 1: Allelic variation in subunits amongst varieties of wheat (Triticum aestivum). Theor. Appl. Genet. 1981, 60, 229–236. [Google Scholar] [CrossRef]
- Payne, P.I.; Lawrence, G.J. Catalogue of alleles for the complex gene loci, Glu-A1, Glu-B1, and Glu-D1 which code for high-molecular-weight subunits of glutenin in hexaploid wheat. Cereal Res. Commun. 1983, 11, 29–35. [Google Scholar]
- SAS. SAS® 9.1.2 Qualification Tools User’s Guide; SAS Institute Inc.: Cary, NC, USA, 2004. [Google Scholar]
- Noleppa, S.; Cartsburg, M. The socio-economic and environmental values of plant breeding in the EU and for selected EU member states. In An Ex-Post Evaluation and Ex-Ante Assessment Considering the “Farm to Fork” and “Biodiversity” Strategies; HFFA Research Paper: Berlin, Germany, 2021; 228p. [Google Scholar]
- Mirosavljević, M.; Momčilović, V.; Živančev, D.; Aćin, V.; Jocković, B.; Mikić, S.; Takač, V.; Denčić, S. Genetic improvement of grain yield and bread-making quality of winter wheat over the past 90 years under the Pannonian Plain conditions. Euphytica 2020, 216, 184. [Google Scholar] [CrossRef]
- Sanchez-Garcia, M.; Álvaro, F.; Peremarti, A.; Martín-Sánchez, J.A.; Royo, C. Changes in bread-making quality attributes of bread wheat varieties cultivated in Spain during the 20th century. Eur. J. Agron. 2015, 63, 79–88. [Google Scholar] [CrossRef]
- Veraverbeke, W.S.; Delcour, J.A. Wheat protein composition and properties of wheat glutenin in relation to breadmaking functionality. Crit. Rev. Food Sci. Nutr. 2002, 42, 179–208. [Google Scholar] [CrossRef] [PubMed]
- Jenner, C.F.; Ugalde, T.D.; Aspinall, D. The physiology of starch and protein deposition in the endosperm of wheat. Funct. Plant Biol. 1991, 18, 211–226. [Google Scholar] [CrossRef]
- Loffer, C.M.; Rauch, T.L.; Busch, R.H. Grain and Plant Protein Relationships in Hard Red Spring Wheat. Crop Sci. 1985, 25, 521–524. [Google Scholar] [CrossRef]
- Sharma, A.; Garg, S.; Sheikh, I.; Vyas, P.; Dhaliwal, H.S. Effect of wheat grain protein composition on end-use quality. J. Food Sci. Technol. 2020, 57, 2771–2785. [Google Scholar] [CrossRef]
- Rai, A.; Han, S.S. Recent developments on the contribution of glutenin and puroindoline proteins to improve wheat grain quality. Cereal Chem. 2023, 100, 56–71. [Google Scholar] [CrossRef]
- Ma, W.; Yu, Z.; She, M.; Zhao, Y.; Islam, S. Wheat gluten protein and its impacts on wheat processing quality. Front. Agric. Sci. Eng. 2019, 6, 279. [Google Scholar] [CrossRef]
- Wu, J.; Lu, X.; Yu, Z.; Han, C.; Li, X.; Prodanović, S.; Yan, Y. Effects of glu-1 and glu-3 allelic variations on wheat glutenin macropolymer (GMP) content as revealed by size-exclusion high performance liquid chromatography (SE-HPLC). Genetika 2017, 49, 677–691. [Google Scholar] [CrossRef]
- Meintjés, G.D. The Use of HPLC for Quality Prediction of South African Wheat Cultivars. Ph.D. Thesis, University of the Free State, Bloemfontein, South Africa, 2004. [Google Scholar]
- Payne, P.I.; Corfield, K.G.; Blackman, J.A. Identification of a high-molecular-weight subunit of glutenin whose presence correlates with bread-making quality in wheats of related pedigree. Theor. Appl. Genet. 1979, 55, 153–159. [Google Scholar] [CrossRef]
- Radovanovic, N.; Cloutier, S.; Brown, D.; Humphreys, D.G.; Lukow, O.M. Genetic variance for gluten strength contributed by high molecular weight glutenin proteins. Cereal Chem. 2002, 79, 843–849. [Google Scholar] [CrossRef]
- Luo, C.; Griffin, W.B.; Branlard, G.; McNeil, D.L. Comparison of low-and high molecular-weight wheat glutenin allele effects on flour quality. Theor. Appl. Genet. 2001, 102, 1088–1098. [Google Scholar] [CrossRef]
- DuPont, F.M.; Altenbach, S.B. Molecular and biochemical impacts of environmental factors on wheat grain development and protein synthesis. J. Cereal Sci. 2003, 38, 133–146. [Google Scholar] [CrossRef]
- Johansson, E.; Nielsen, D.; Demuth, H.; Wiberg, C.; Schjødt, C.; Huang, T.; Chen, J.; Jensen, S.; Petersen, J.; Thygesen, P. Identification of Binding Sites on Human Serum Albumin for Somapacitan, a Long-Acting Growth Hormone Derivative. J. Biochem. 2020, 59, 1410–1419. [Google Scholar] [CrossRef] [PubMed]
- Rozbicki, J.; Ceglińska, A.; Gozdowski, D.; Jakubczak, M.; Cacak-Pietrzak, G.; Mądry, W.; Golba, J.; Piechociński, M.; Sobczyński, G.; Studnicki, M.; et al. Influence of the cultivar, environment and management on the grain yield and bread-making quality in winter wheat. J. Cereal Sci. 2015, 61, 126–132. [Google Scholar] [CrossRef]
- Yong, Z.; Zhonghu, H.; Ye, G.; Aimin, Z.; Van Ginkel, M. Effect of environment and genotype on bread-making quality of spring-sown spring wheat cultivars in China. Euphytica 2004, 139, 75–83. [Google Scholar] [CrossRef]
- Borghi, B.; Corbellini, M.; Minoia, C.; Palumbo, M.; Di Fonzo, N.; Perenzin, M. Effects of Mediterranean climate on wheat bread-making quality. Eur. J. Agron. 1997, 6, 145–154. [Google Scholar] [CrossRef]
- Asseng, S.; Martre, P.; Maiorano, A.; Rötter, R.P.; O’Leary, G.J.; Fitzgerald, G.J.; Girousse, C.; Motzo, R.; Giunta, F.; Babar, M.A.; et al. Climate change impact and adaptation for wheat protein. Glob. Change Biol. 2019, 25, 155–173. [Google Scholar] [CrossRef]
- Zahra, N.; Hafeez, M.B.; Wahid, A.; Al Masruri, M.H.; Ullah, A.; Siddique, K.H.; Farooq, M. Impact of climate change on wheat grain composition and quality. J. Sci. Food Agric. 2023, 103, 2745–2751. [Google Scholar] [CrossRef]
- Lan, Y.; Sueciae, A.U.A. Exploring the Genetic Toolbox for Climate-Resilient Spring Wheat; Saint Louis University: St. Louis, MO, USA, 2024. [Google Scholar]
- Johansson, E.; Prieto-Linde, M.L.; Larsson, H. Locally adapted and organically grown landrace and ancient spring cereals—A unique source of minerals in the human diet. Foods 2021, 10, 393. [Google Scholar] [CrossRef]
- Hufnagel, J.; Reckling, M.; Ewert, F. Diverse approaches to crop diversification in agricultural research. A review. Agron. Sustain. Develop. 2020, 40, 14. [Google Scholar] [CrossRef]
- Deogharia, P.C. Diversification of agriculture: A review. J. Econ. Soc. Develop. 2018, 15, 46–59. [Google Scholar]
- Michel, S.; Löschenberger, F.; Ametz, C.; Pachler, B.; Sparry, E.; Bürstmayr, H. Combining grain yield, protein content and protein quality by multi-trait genomic selection in bread wheat. Theor. Appl. Genet. 2019, 132, 2767–2780. [Google Scholar] [CrossRef] [PubMed]
- Chavhan, R.L.; Hinge, V.R.; Wankhade, D.J.; Deshmukh, A.S.; Mahajan, N.; Kadam, U.S. Bioinformatics for Molecular Breeding and Enhanced Crop Performance: Applications and Perspectives. In Bioinformatics for Plant Research and Crop Breeding; Wiley: Hoboken, NJ, USA, 2024; pp. 21–74. [Google Scholar]
- Sun, L.; Lai, M.; Ghouri, F.; Nawaz, M.A.; Ali, F.; Baloch, F.S.; Nadeem, M.A.; Aasim, M.; Shahid, M.Q. Modern Plant Breeding Techniques in Crop Improvement and Genetic Diversity: From Molecular Markers and Gene Editing to Artificial Intelligence—A Critical Review. Plants 2024, 13, 2676. [Google Scholar] [CrossRef]
- Liang, D.; Tang, J.; Pena, R.J.; Singh, R.; He, X.; Shen, X.; Yao, D.; Xia, X.; He, Z. Characterization of CIMMYT bread wheats for high-and low-molecular weight glutenin subunits and other quality-related genes with SDS-PAGE, RP-HPLC and molecular markers. Euphytica 2010, 172, 235–250. [Google Scholar] [CrossRef]
- Rasheed, A.; Xia, X.; Yan, Y.; Appels, R.; Mahmood, T.; He, Z. Wheat seed storage proteins: Advances in molecular genetics, diversity and breeding applications. J. Cereal Sci. 2014, 60, 11–24. [Google Scholar] [CrossRef]
- Koebner, R.M.; Summers, R.W. 21st century wheat breeding: Plot selection or plate detection? Trends Biotechnol. 2003, 21, 59–63. [Google Scholar] [CrossRef]


| Source | DF | TOTE (1014) | TOTU (1014) | %UPP (10−2) | %LargeUPP (10−2) |
|---|---|---|---|---|---|
| Locality | 1 | 91.2 *** | 18.1 *** | 3.78 *** | 3.32 *** |
| Variety | 21 | 3.46 *** | 1.64 *** | 0.57 *** | 1.46 *** |
| Locality ∗ Variety | 21 | 2.92 | 0.85 | 0.28 | 0.46 |
| Error | 88 | 0.23 | 0.08 | 0.02 | 0.11 |
| Hisor Locality | 1.41 a | 6.18 a | 0.58 b | 0.46 b | |
| Isfara Locality | 1.24 b | 5.44 b | 0.61 a | 0.49 a |
| Variety/Line | Hisor Location | Isfara Location | ||||||
|---|---|---|---|---|---|---|---|---|
| TOTE (108) | TOTU (107) | %UPP | %LargeUPP | TOTE (108) | TOTU (107) | %UPP | %LargeUPP | |
| 1. Navruz | 1.34 fgh | 6.09 defg | 45 efg | 56 fgih | 1.05 i | 5.30 ef | 45 k | 50 m |
| 2. Alex | 1.63 a | 6.52 bcde | 4 1ijk | 49 ghi | 1.18 gh | 5.23 efg | 48 ghi | 58 hji |
| 3. Jagger | 1.60 a | 5.05 jk | 41 ijk | 52 fghi | 1.27 ef | 4.99 efgh | 47 ijk | 58 jkl |
| 4. TNMU/Munta | 1.50 b | 6.84 ab | 49 bcd | 62 abc | 1.36 bc | 5.21 efg | 48 efghi | 60 fghi |
| 5. Prinia/Star | 1.37 fgh | 6.61 bcd | 47 cdef | 57 cdef | 1.27 e | 5.29 ef | 48 fghi | 63 cd |
| 6. Shark/F4105W2.1 | 1.40 defg | 5.55 hijk | 45 fgh | 62 abc | 1.31 cd | 5.20 efg | 49 defgh | 65 b |
| 7. Vorona/Kauz/1D13.1/MLT | 1.49 bcd | 5.96 efgh | 44 ghi | 61 abcd | 1.25 e | 4.86 ghi | 48 ghi | 61 defg |
| 8. Tam200/Kauz | 1.41 cdefg | 6.86 ab | 50 bc | 67 a | 1.14 h | 5.36 de | 53 b | 56 c |
| 9. 1D13.1/MLT/TUI | 1.35 efgh | 6.03 efgh | 48 cde | 60 abcd | 1.16 gh | 4.96 fghi | 18 hji | 60 efgh |
| 10. Arilw Pronghorn | 1.38 efg | 5.61 ghi | 42 hij | 52 fghi | 1.16 gh | 5.76 c | 52 bc | 63 cd |
| 11. Eskina-8 | 1.41 cdefg | 4.92 k | 39 kl | 45 i | 1.28 def | 4.61 hij | 48 ghij | 56 kl |
| 12. YN/3NPM/VOS83 | 1.24 ij | 6.70 abc | 54 a | 67 a | 1.06 i | 5.22 efg | 50 cdef | 60 efgh |
| 13. Pastor/3/Vorona/CN079 | 1.28 ij | 6.03 efgh | 46 defg | 59 bsdef | 1.22 fg | 4.29 j | 43 l | 54 l |
| 14. Skauz BV 92 | 1.22 j | 6.27 cdef | 51 ab | 65 ab | 1.42 ab | 6.27 b | 51 bcde | 62 ed |
| 15. Vorona SN079 | 1.42 bcdef | 6.50 bsde | 45 fgh | 53 fgh | 1.46 a | 5.75 c | 46 jk | 57 ijk |
| 16. Soroka | 1.39 efg | 6.55 bcde | 48 cdef | 56 cdefg | 1.34 cd | 6.03 bc | 48 ghi | 59 ghij |
| 17. Otus Toba 97 | 1.44 bcde | 6.53 bc | 46 defg | 55 cdefg | 1.14 h | 4.58 ij | 46 jk | 56 kl |
| 18. Kauz2/Chew//BCN/3Milan | 1.49 bc | 6.88 ab | 46 defg | 58 defg | 1.25 ef | 5.99 bc | 51 bcd | 61 def |
| 19. Chen/Aegilops Squ…/RAV | 1.41 cdefg | 5.23 ijk | 37 l | 45 hi | 1.31 cde | 6.04 bc | 47 ijk | 57 jk |
| 20. CBRD/Kauz | 1.40 efg | 5.33 ijk | 40 jkl | 53 defg | 1.16 gh | 5.76 c | 51 bcd | 65 b |
| 21. Huavun Inia | 1.33 ghi | 6.42 bcdef | 47 cdefg | 60 abcde | 1.30 cd | 5.71 cd | 50 defg | 65 bc |
| 22. CMN82A.1294/2*Kauz// | 1.41 cdefg | 7.12 a | 51 ab | 66 a | 1.17 gh | 7.08 a | 59 a | 72 a |
| # | Variety/Line | HMW-GS from Glu-D1 (SDS-PAGE) | %UPP (SE-HPLC) |
|---|---|---|---|
| 1 | Navruz | 5 + 10/2 + 12 | 45 |
| 2 | Alex | 5 + 10/2 + 12 | 48 |
| 3 | Jagger | 5 + 10/2 + 12 | 47 |
| 4 | TNMU/Munta | 5 + 10/2 + 12/4 + 12 | 48 |
| 5 | Prinia/Star | 5 + 10/2 + 12 | 48 |
| 6 | Shark/F4105W2.1 | 5 + 10/2 + 12 | 49 |
| 7 | Vorona/Kauz//1D13.1/MLT | 5 + 10/2 + 12/4 + 12 | 48 |
| 8 | Tam200/Kauz | 2 + 12 | 53 |
| 9 | 1D13.1/MLT//TUI | 5 + 10/2 + 12 | 48 |
| 10 | Arilw Pronghorn | 5 + 10 | 52 |
| 11 | Eskina-8 | 4 + 12 | 48 |
| 12 | YN/3NPM/VOS83 | 5 + 10 | 50 |
| 13 | Pastor/3/Vorona/CN079 | 5 + 10/2 + 12/4 + 12 | 43 |
| 14 | Skauz BV 92 | 5 + 10/2 + 12 | 51 |
| 15 | Vorona SN079 | 5 + 10/2 + 12/2 + 10 | 46 |
| 16 | Soroca | 2 + 12/5 + 10 | 48 |
| 17 | Otus Toba 97 | 2 + 12/5 + 10 | 46 |
| 18 | Kauz2/Chew//BCN/3Milan | 5 + 10/2 + 12 | 51 |
| 19 | Chen/Aegilops Squarosa/Taus/RCN//3/RAV | 2 + 10/5 + 10/2 + 12 | 47 |
| 20 | CBRD/Kauz | 5 + 10 | 51 |
| 21 | Huavun Inia | 5 + 10/2 + 12 | 50 |
| 22 | CMN82A.1294/2*Kauz// | 5 + 10 | 59 |
Disclaimer/Publisher’s Note: The statements, opinions and data contained in all publications are solely those of the individual author(s) and contributor(s) and not of MDPI and/or the editor(s). MDPI and/or the editor(s) disclaim responsibility for any injury to people or property resulting from any ideas, methods, instructions or products referred to in the content. |
© 2024 by the authors. Licensee MDPI, Basel, Switzerland. This article is an open access article distributed under the terms and conditions of the Creative Commons Attribution (CC BY) license (https://creativecommons.org/licenses/by/4.0/).
Share and Cite
Mahkamov, M.; Husenov, B.; Garkava-Gustavsson, L.; Muminjanov, H.; Kuktaite, R.; Prieto-Linde, M.L.; Johansson, E. Wheat Grain Protein Composition—A Screening Tool to Be Used in Plant Breeding for Improved Tajik Food Security. Crops 2024, 4, 667-683. https://doi.org/10.3390/crops4040046
Mahkamov M, Husenov B, Garkava-Gustavsson L, Muminjanov H, Kuktaite R, Prieto-Linde ML, Johansson E. Wheat Grain Protein Composition—A Screening Tool to Be Used in Plant Breeding for Improved Tajik Food Security. Crops. 2024; 4(4):667-683. https://doi.org/10.3390/crops4040046
Chicago/Turabian StyleMahkamov, Marufqul, Bahromiddin Husenov, Larisa Garkava-Gustavsson, Hafiz Muminjanov, Ramune Kuktaite, Maria Luisa Prieto-Linde, and Eva Johansson. 2024. "Wheat Grain Protein Composition—A Screening Tool to Be Used in Plant Breeding for Improved Tajik Food Security" Crops 4, no. 4: 667-683. https://doi.org/10.3390/crops4040046
APA StyleMahkamov, M., Husenov, B., Garkava-Gustavsson, L., Muminjanov, H., Kuktaite, R., Prieto-Linde, M. L., & Johansson, E. (2024). Wheat Grain Protein Composition—A Screening Tool to Be Used in Plant Breeding for Improved Tajik Food Security. Crops, 4(4), 667-683. https://doi.org/10.3390/crops4040046