1. Introduction
The European Union and other developed nations are at the vanguard of decarbonization pathways to net-zero in 2050, emphasizing the urgency of integrative policy systems and low-carbon mobility transitions. Nonetheless, achieving global carbon neutrality is still dependent on multilateral cooperation, especially from the developing world—Asia accounts for 55.7% of global GHG emissions and obtains 75% of its energy from fossil fuel sources [
1], whereas the EU only obtains 70.8% [
2].
Developing economies—particularly those with entrenched fossil fuel dependencies—face structural and fiscal constraints that impede alignment with carbon neutrality imperatives. These asymmetries yield uneven decarbonization trajectories across regions, further exacerbated by volatile energy prices that elevate transportation costs and widen trade imbalances through escalated crude oil import bills [
3]. Overlooking the indispensable role of these nations risks undermining the feasibility of a truly global net-zero transition.
For example, Pakistan’s acute climate vulnerabilities—intensified by its geographic location—highlight the need for a rapid transition toward sustainable mobility. The transport sector is the third-largest contributor to national GHG emissions after manufacturing, accounting for 22.5–25% of total emissions [
4]. The country recorded a 9.13% annual increase in carbon emissions [
3] while importing crude oil worth nearly USD 30.7 billion [
5], reflecting its dependence on fossil fuels and the urgency of structural reforms. Conversely, Italy exhibited a 26% decrease in CO
2 emissions supported by a renewable energy share reaching 34.4% [
6].
Globally, the transportation sector remains a formidable impediment towards carbon neutrality, accounting for approximately one-quarter of total GHG emissions [
7]. The proliferation of e-commerce and last-mile logistics has intensified urban freight traffic, exacerbating air quality degradation. Road transport, predominantly powered by fossil fuels, accounts for 77.2% of the sector’s energy consumption, whereas renewables contribute a mere 4.6% of total consumption [
8].
Among vehicle classes, light commercial vehicles (LCVs) represent 12% of transport-related emissions and have exhibited a striking 63% annual growth—outpacing both heavy-duty trucks and passenger cars. According to estimates, over 30 million LCVs are currently in operation across Europe, while emissions from this segment increased by 55% in 2022 compared to 1990 [
9].
Electrification of LCVs poses considerable potential for sectoral decarbonization [
10], particularly given their disproportionately high per-ton freight emissions [
7]. Despite this, policy and research efforts have predominantly centered on medium and heavy-duty vehicles [
11], leaving the LCV segment comparatively underexplored [
12]. This gap warrants further techno-economic analysis—especially via Total Cost of Ownership (TCO) metrics—considering that the LCV fleet size is considerably larger than heavy-duty vehicles, and LCVs recently exhibited an unprecedented CAGR of 7.1% driven by surging demand reflected in last-mile, urban, and suburban freight logistics.
The TCO framework has been consistently employed in academic discourse in order to conduct techno-economic evaluations of alternative powertrains. Beyond its relevance in the academic sphere, the TCO has ascended to prominence as a critical decision-making instrument, widely adopted by fleet operators to assess the financial viability of alternative powertrains [
13]. In line with the prevailing TCO methodology, cost estimates for alternative powertrains are typically expressed in EUR/km, benchmarked against their diesel-powered counterparts [
14]. Within the TCO literature, a broad consensus has emerged underscoring the economic and environmental advantages associated with the electrification of freight transportation [
10,
15,
16]. Despite its economic and environmental competitiveness, the market uptake remains slow for electric light commercial vehicles (eLCVs), which is concerning and requires further consideration.
Academic discourse has predominantly framed TCO analysis via comparative assessments; however, the geographical scope of such studies remains largely concentrated in the European Union and North America [
11,
13,
15]. While [
17] extended coverage to selected Latin American economies, scholarly engagement with Asian markets has been uneven—primarily centering on China, India, and ASEAN nations [
1,
18,
19]. A recurring theme across the literature emerged—with the main consideration of such comparative analysis being confined to mature markets with established policy and data infrastructures, or on localized, non-comparative case studies within developing contexts.
This methodological gap underscores the need for cross-regional benchmarking to evaluate the economic viability of alternative powertrains under heterogeneous market conditions. Specifically, it remains critical to understand how macroeconomic fundamentals, fiscal frameworks, and energy pricing regimes shape the cost-competitiveness of eLCVs. The fiscal and institutional asymmetries across regions thus present a quasi-natural experiment to examine the differential impact of taxation, regulatory design, and policy incentives on capital expenditure (CAPEX), operating costs (OPEX), and lifecycle cost structures of eLCVs.
Italy and Pakistan represent two contrasting yet analytically valuable markets for assessing the TCO of eLCVs. In Italy, existing TCO estimations suggest a favorable competitive edge for electric propulsion systems, indicating potential cost parity with diesel alternatives—albeit highly contingent upon specific operational scenarios. While city and box eLCVs show favorable outcomes, panel models often fall short without targeted subsidies [
10]. Pakistan, by contrast, presents significant untapped potential for decarbonizing its freight sector, yet its structural transition is hindered by fossil fuel dependence, limited purchasing power, and persistent energy shortfalls [
3]. These interlinked constraints continue to undermine mitigation efforts and exacerbate the country’s rising transport-related emissions [
20]. Nonetheless, recent Chinese investment and growing interest from global automakers signal momentum in closing the commercial mobility gap. Given the cost-sensitive nature of fleet operators—which typically operate on narrow profit margins—LCV electrification presents a compelling, if underutilized, economic opportunity. Although the National Electric Vehicle Policy (NEVP) outlines ambitious electrification targets to convert 30% of vehicles to electric by 2030, empirical evidence remains sparse [
21].
To date, no study has empirically assessed the cross-national total cost competitiveness of eLCVs under divergent fiscal regimes and operational contexts. This research addresses this gap by offering a comparative TCO analysis between Italy and Pakistan—two markets positioned at opposite ends of the EV policy maturity spectrum. Existing academic discourse often relies on static infrastructure cost assumptions, which can yield compromised TCO estimations [
12,
17,
21]. In contrast, this study advances the literature by explicitly quantifying infrastructure costs through a bottom-up estimation framework, tailored to the specific market and policy conditions of Italy and Pakistan. In addition, the novelty of this work lies in presenting the first empirical TCO analysis for the Pakistani market—a context largely overlooked in the existing scholarly discourse. Furthermore, we rigorously identify and contrast the principal cost determinants across these distinct geographical settings while elucidating the role of fiscal policy instruments in shaping the economic competitiveness of alternative propulsion systems.
This research contributes novel insight into the scalability, economic viability, and policy-sensitivity of eLCV deployment in both developed and emerging market settings. By grounding the analysis in context-specific variables, it aims to generate actionable insights for fleet operators and policymakers via tailored policy recommendations, thereby enabling evidence-based decision-making in line with carbon neutrality and sustainable mobility goals.
This study intends to address the following postulated questions: (i) What are the principal cost components driving the economic feasibility of LCVs in Italy and Pakistan? (ii) How do contextual factors—such as energy prices, taxation, maintenance infrastructure, and regulatory frameworks—affect the TCO, and what is their influence on consumer purchasing behavior in both countries? (iii) What policy interventions can be proposed to enhance the cost-effectiveness of LCVs in Italy and Pakistan, particularly in alignment with sustainable mobility objectives?
Given the paucity of granular market data in Pakistan, this study employs a bottom-up estimation approach to model local cost structures and market conditions primarily from the grey literature. By contrast, the Italian case draws upon more established cost metrics and policy frameworks.
This paper is organized in the following:
Section 2 delineates the TCO methodology and the relevant literature,
Section 3 outlines the main results along with simulation analysis,
Section 4 is dedicated to the comparative outcomes of TCO analysis for both countries, and
Section 5 is dedicated to the conclusion and policy recommendations derived from this study.
2. Total Cost of Ownership Methodology
The Total Cost of Ownership (TCO) framework has been dominantly employed to assess the economic competitiveness of owning, operating, and ultimately disposing of assets. The main focus of this dynamic model is on present and future monetary transactions incurred throughout the lifecycle of an asset [
15].
TCO assessments are inherently context-dependent, with cost competitiveness shaped by region-specific fiscal policies, operational conditions, and annual mileage. Such contextual variability constrains the generalizability of findings and reinforces the need for localized market/region-specific analysis. Prevailing academic discourse has widely recognized the influence of exogenous and regional factors resulting in the diverged ownership costs of a propulsion system [
14].
Nonetheless, there is broad scholarly consensus on the pivotal role of subsidies and policy incentives in expediting cost parity, thus elevating the economic appeal of eLCVs—particularly in the Italian context [
22]. Currently, fleet operators in Italy benefit from a range of financial incentives, although the structure and magnitude of these subsidies vary across regions and administrative jurisdictions. Furthermore, Ref. [
13] estimates heterogeneous cost estimates across various eLCV configurations in nine European countries. Their analysis indicates that eLCVs’ TCO/km is 5% lower than diesel counterparts, with policy incentives further amplifying the cost advantage, reducing the overall TCO by 10%. Similarly, Ref. [
16] emphasizes the pivotal role of subsidies in improving the cost-effectiveness of light and medium commercial vehicles by offsetting the higher upfront capital differential. The study reported favorable cost estimates for Italy, while the Netherlands was estimated with the highest TCO/km.
Ref. [
14] further asserts that eLCVs have already reached cost parity with diesel LCVs (dLCVs) in several European markets, largely due to sustained and targeted subsidization schemes. Furthermore, the dominance of fiscal regimes in cost competitiveness is also highlighted by [
17], who reported that deferred cost parity for eLCVs in Argentina and Brazil primarily attributed by elevated tariffs and import duties. The study suggests that strategically deployed subsidies—particularly those alleviating battery import levies and electricity tariffs—could significantly accelerate parity timelines.
The higher acquisition cost of eLCVs remains the prominent bottleneck for eLCVs relative to their diesel equivalents, while accounting for a cost differential of 15–28% [
7,
15]. However, this elevated CAPEX is offset by lower operating costs, primarily due to the superior energy efficiency of electric powertrains, which also contribute to a 30% reduction in GHG emissions [
23]. Notably, refrigerated eLCVs—a segment often overlooked in the existing literature, exhibit TCO estimates of 0.530 EUR/km, 0.547 EUR/km, and 0.323 EUR/km for box-type, panel, and city configurations, respectively, within the Italian market [
12], although the study reports the cost parity of eLCVs relative to diesel LCVs without taking into account subsidies, mainly stemming from the conservative infrastructure cost assumption.
Conversely, the academic discourse in Pakistan has remained largely disengaged from the strategic application of the TCO framework for powertrain evaluations. While the peer-reviewed literature remains sparse, the grey literature and industry reports—though informative—primarily offer absolute TCO estimates limited to niche segments such as electric buses, passenger sedans, and two- and three-wheelers. Such a narrow analytical scope underscores a critical void in comprehensive, data-driven assessments across the broader spectrum of commercial transportation.
For instance, Ref. [
24] reports that battery electric vehicles (BEVs) exhibit a marginally higher TCO at 0.35 USD/km relative to 0.29 USD/km for conventional counterparts, assuming an annual distance travel (ADT) of 10,000 km. Similarly, Ref. [
25] estimates the per-kilometer cost for BEVs in the sedan segment at 2.8 PKR/km, significantly lower than 7.6 PKR/km for internal combustion engine counterparts. Another study by [
26] reinforces BEV cost competitiveness, with a reported per-kilometer cost of 6.48 PKR/km compared to 6.55 PKR/km for conventional drivetrain alternatives, alongside an overall lifecycle cost differential of approximately 8–10 million PKR.
2.1. Mathematical Framework
Considering the economic competitiveness of LCVs, the TCO metric can broadly be disaggregated in three fundamental costs components [
15]: capital expenditure (CAPEX) incurred at acquisition; operational expenditure (OPEX) during the vehicle’s service life; and the salvage value incurred during the time of disposal of vehicle.
CAPEX includes all of the monetary transactions that incur during the time of acquisition, including the manufacturer’s suggested retail price (MSRP), registration cost (RC), along with any manufacturer discounts offered (MD), charging equipment cost (CEC), and government subsidies (GSUB)—the latter two of which are primarily relevant to alternative powertrains. Specifically, for electric powertrains, CAPEX also incorporates expenditures related to the development and installation of recharging infrastructure, typically not borne by diesel LCVs.
Operational expenditures (OPEX) encompasses a wide spectrum of cost factors incurred during the operational lifespan of LCVs, calculated for a given annual distance travelled (ADT) for a given number of years (
).
Key OPEX components comprise the fuel/electricity cost (FUEL) subject to the powertrain and the pricing dynamics for the given region, road tax (RT), annual circulation tax (ACT), insurance premium (INS), and maintenance cost (MAINT) for the given ADT. Notably, fuel/electricity expenditure varies significantly across regions and according to the refueling/recharging location, operational characteristics, and fleet composition. It can be computed as follows:
where P
FE represents the average regional energy cost, expressed in EUR/liter or EUR/kWh, with the cost per kilowatt-hour (kWh) for eLCVs differing considerably between depot charging or the utilization of public recharging infrastructure; whereas FE
FE reflects the electricity/fuel efficiency of the powertrain during LCV operations within a specific region. It is expressed in liters or kWh per 100 km of the given powertrain. Notably, fuel efficiency can vary considerably based on operating conditions, particularly between urban and suburban environments.
The time value of money is an important consideration in TCO analysis. Since CAPEX, OPEX, and residual value (RV) occur at different points in time, we used the appropriate discount rate for both geographical regions to determine the TCO. The present value of OPEX and the RV was quantified using the following equations:
Therefore, the final TCO/km metric was determined as follows:
The metric of TCO/km was calculated as follows:
2.2. Assumptions
The TCO framework was applied to determine the cost competitiveness of LCVs, focusing on short-haul applications in urban environments for Italy and Pakistan. For analytical coherence, the vehicle selection was filtered based on the gross vehicle weight (GVW) threshold of 3.5 tons. To ensure the robustness and contextual relevance of the TCO estimates, we leveraged bottom-up cost estimation and technical assumptions, predominantly sourced from respective official database consortia. Maxus Delivery-9 was nominated as the reference LCV for the Italian market, while Hyundai Porter H-100 was selected in the context of Pakistan (
Figure 1). The technical attributes of both vehicle models are enumerated in
Table 1.
TCO assessments are inherently sensitive to many factors, including technical configurations, organizational procurement preferences, and brand-specific loyalties. This multifactorial nature, coupled with various uncertainties, can yield divergent estimations [
16]. To mitigate such variability and ensure analytical coherence, we designated the standard manufacturer-specified model variant as our reference baseline.
2.2.1. Cross-Regional Fiscal and Regulatory Determinants
Considering the commercial transportation sector, tax burden manifests in diverse forms and is significantly altered by region-specific fiscal regimes and regulatory environments. These contextual disparities regarding policy tools (value-added taxes (VAT), KIBOR, import duties, and income taxes) lead to considerable variation in cost structures across jurisdictions. Fiscal policy, in particular, functions as a critical exogenous determinant in shaping the adoption trajectory of clean transportation technologies—primarily through strategic incentivization, which significantly enhances economic viability [
7,
17].
2.2.2. Comparative Taxation Structure
In Italy, value-added tax (VAT) is levied as a percentage of the total asset value, typically realized during the time of acquisition. VAT exerts a considerable influence on the cost structure of eLCVs, accounting for approximately 16% of the total capital expenditure. Alleviating this tax burden through fiscal exemptions or reductions could substantially improve the cost competitiveness of eLCVs [
22]. China exhibits a compelling case, offering 17% tax exemption on the MSRP of eLCVs, and thus maximizing economic viability for the market. Nonetheless, in compliance with recent EU reforms, Italian fleet operators are subject to avail substantial tax reliefs; however, regional variabilities in subsidy deployment remain pronounced across the country [
23].
Conversely, Pakistan’s commercial transport sector is subject to a complex taxation framework, comprising various levies such as withholding tax, professional tax, income tax, and interest-based charges linked to the Karachi Interbank Offered Rate (KIBOR), all typically incurred at the point of acquisition. Such layered tax obligations, particularly the elevated KIBOR and percentage-based duties, pose a prominent bottleneck to end-users, often contributing up to 45% of the vehicle’s base price [
24]. The situation is further exacerbated by constrained access to auto-financing, which currently accounts for merely 13% of total vehicle sales in the domestic market, thereby constraining both market scalability and consumer affordability.
Nonetheless, recent legislative reforms have favored electric powertrains by reducing acquisition and registration taxes to just 1%, thereby significantly enhancing their economic appeal for eLCVs [
27].
2.2.3. Tolling Policy
In Pakistan, the current tolling framework is structured around gross vehicle weight, whereas in Italy, toll charges are quantified based on both distance and vehicle weight classification. Introducing toll exemptions or reductions based on a vehicle’s emission class could substantially enhance the cost competitiveness of eLCVs, particularly for suburban and regional logistics applications [
16]. In addition, Ref. [
7] determined that imposing a surcharge of at least 7.5 eurocents per kilometer on diesel LCVs could catalyze the attainment of cost parity for eLCVs. Norway and Switzerland present compelling case studies where electric vehicles are exempt from toll tax.
Although tolling costs were excluded from the TCO estimations to establish a coherent baseline scenario, their inclusion could significantly influence comparative economic outcomes, particularly given the predominantly intra-urban deployment of LCVs.
2.2.4. Acquisition Cost
The prevailing literature has widely reported the higher upfront acquisition cost differential of the two powertrains as the major bottleneck concerning economic competitiveness, irrespective of market differentiation [
15,
24,
28]. Variabilities concerning the CAPEX of LCVs extend beyond base pricing, while encompassing factors like manufacturer discounts and government subsidies.
In Italy, panel eLCVs’ costs are estimated to be five times higher than diesel equivalents [
10], while [
12] reported a twofold MSRP differential for refrigerated eLCVs. Parallel trends are evident in Pakistan, where [
5] reports a price differential ranging from two to seven times in favor of internal combustion vehicles, contingent upon configuration and vehicle class. Ref. [
21] corroborates this pattern, estimating a 50–75% cost premium for electric two-wheelers, while noting a more attenuated differential of approximately 10% for four-wheeled alternatives.
Although both countries provide incentives to foster zero-emission transportation, the implementation of these schemes diverges considerably due to socio-economic and institutional disparities. Whereas in Italy, fleet owners might benefit from retailer-specific discounts, in Pakistan, electric vehicles are subject to minimal import duties, set at a mere 1% [
27], reflecting the country’s reliance on vehicle assembly rather than full-scale manufacturing.
Regional variability plays a vivid role in cost estimations, given the influence of divergent operational conditions. In this study, the Friuli Venezia Giulia region was selected as the representative region for the Italian market, whereas Lahore, located in the Punjab province, serves as the focal case for Pakistan.
The MSRP cost estimates for both powertrains in Italy were sourced directly from OEM websites [
29]. Conversely, in the Pakistani context, due to the aforementioned data limitations, a bottom-up estimation strategy was leveraged to approximate key parameters such as MSRP, fuel efficiency, residual value, and maintenance expenditures for eLCVs. To ensure consistency and avoid market-specific distortions, all subsidies and incentives (retailer discounts and government subsidies) were excluded from the preliminary TCO estimations.
Vehicle registration costs’ estimates were sourced from the following official repositories: the Automobile Club d’Italia (ACI) for Italy and the Excise and Taxation Department for Punjab, Pakistan. In addition, Italy mandates an annual circulation tax that provides favors to low-emission vehicles, whereas Pakistan enforces a weight- and type-based motor vehicle tax regime that remains agnostic to environmental performance.
The applied insurance premium rate for this study was standardized at 2.14% of the MSRP, aligning with prevailing insurance market practices in Italy. Although Pakistani financial institutions typically offer insurance products ranging from 2.50% to 3.50% depending on asset type and financing conditions, a representative flat rate of 2.50% was adopted to maintain analytical consistency (
Table 2).
2.2.5. Fuel Cost
Fuel cost constitutes a pivotal element within the TCO framework, particularly due to its pronounced regional sensitivity in shaping the overall ownership cost structure. These variances are predominantly contingent upon the geographical location and operational context [
1,
16]. While eLCVs demonstrate better performance in dense urban settings characterized by frequent stop-and-go traffic, their diesel counterparts exhibit superior efficiency across long-haul and peri-urban applications, where sustained speed and range are paramount [
14].
In Italy, fossil fuels are subject to substantial taxation, which elevates the pump price, averaging at 1.80 EUR/liter. Such an elevated taxation framework is strategically leveraged by the Italian government to cross-subsidize regional road infrastructure development [
10]. In contrast, Pakistan follows a different subsidy mechanism, wherein fuel pricing is indirectly supported through cross-subsidization within electricity bills [
21]. As a result, the average fuel price in Pakistan is nearly half that of Italy, currently averaging at 0.80 EUR/liter.
In this study, we assumed that 90% of charging and refueling will occur at depots, irrespective of the powertrain type, while the remaining 10% will rely on public infrastructure. To account for energy expenses, the average fuel and electricity prices as of May 2025 were adopted for both countries. Furthermore, energy costs were assumed to remain constant over the vehicle’s useful life, without taking into account the inflation factor. Notably, the fuel cost differential between utilizing private and public infrastructure for refueling/recharging was realized for Italy, although in Pakistan, such distinctions were only evident for electricity cost.
A persistent challenge in fuel cost estimation lies in the discrepancy between manufacturers’ suggested efficiency figures and real-world performance. While less pronounced for the mentioned segment, notable deviations still occur concerning cost estimation [
23]. Moreover, fuel efficiency is highly sensitive to climatic conditions, introducing further variability. Predominantly, diesel powertrains exhibit superior operational robustness across extreme weather scenarios, a trait not yet paralleled by electric alternatives. eLCVs, in contrast, are often susceptible to thermal sensitivity, which adversely impacts driving range and efficiency, particularly under extreme climatic/ambient temperature [
30]. Such operational inefficiencies, coupled with inherent payload constraints, substantially undermine their logistical effectiveness and economic viability [
19].
2.2.6. Maintenance Cost
The estimation of maintenance costs for alternative powertrains in the existing literature is frequently conducted through comparative benchmarking against conventional diesel vehicles. The maintenance cost per kilometer plays a pivotal role in purchase decisions, which is not just categorically scrutinized by fleet operators but also by private owners. A prevailing consensus among the authors emerged regarding the lower maintenance cost of eLCVs, mainly attributed to minimal mechanical components, lubricants, and regenerative braking system [
18,
20,
23]. Quantification of maintenance costs is inherently non-linear and subject to a wide array of factors such as mileage, payload, and operating conditions, not just for eLCVs but also for diesel LCVs [
11]. The prevailing TCO literature predominantly relied on a bottom-up estimation of maintenance cost for eLCVs, while others relied on an absolute value [
12,
28]. Such variabilities are reported due to the lack of a standardized pricing mechanism for such cost estimates.
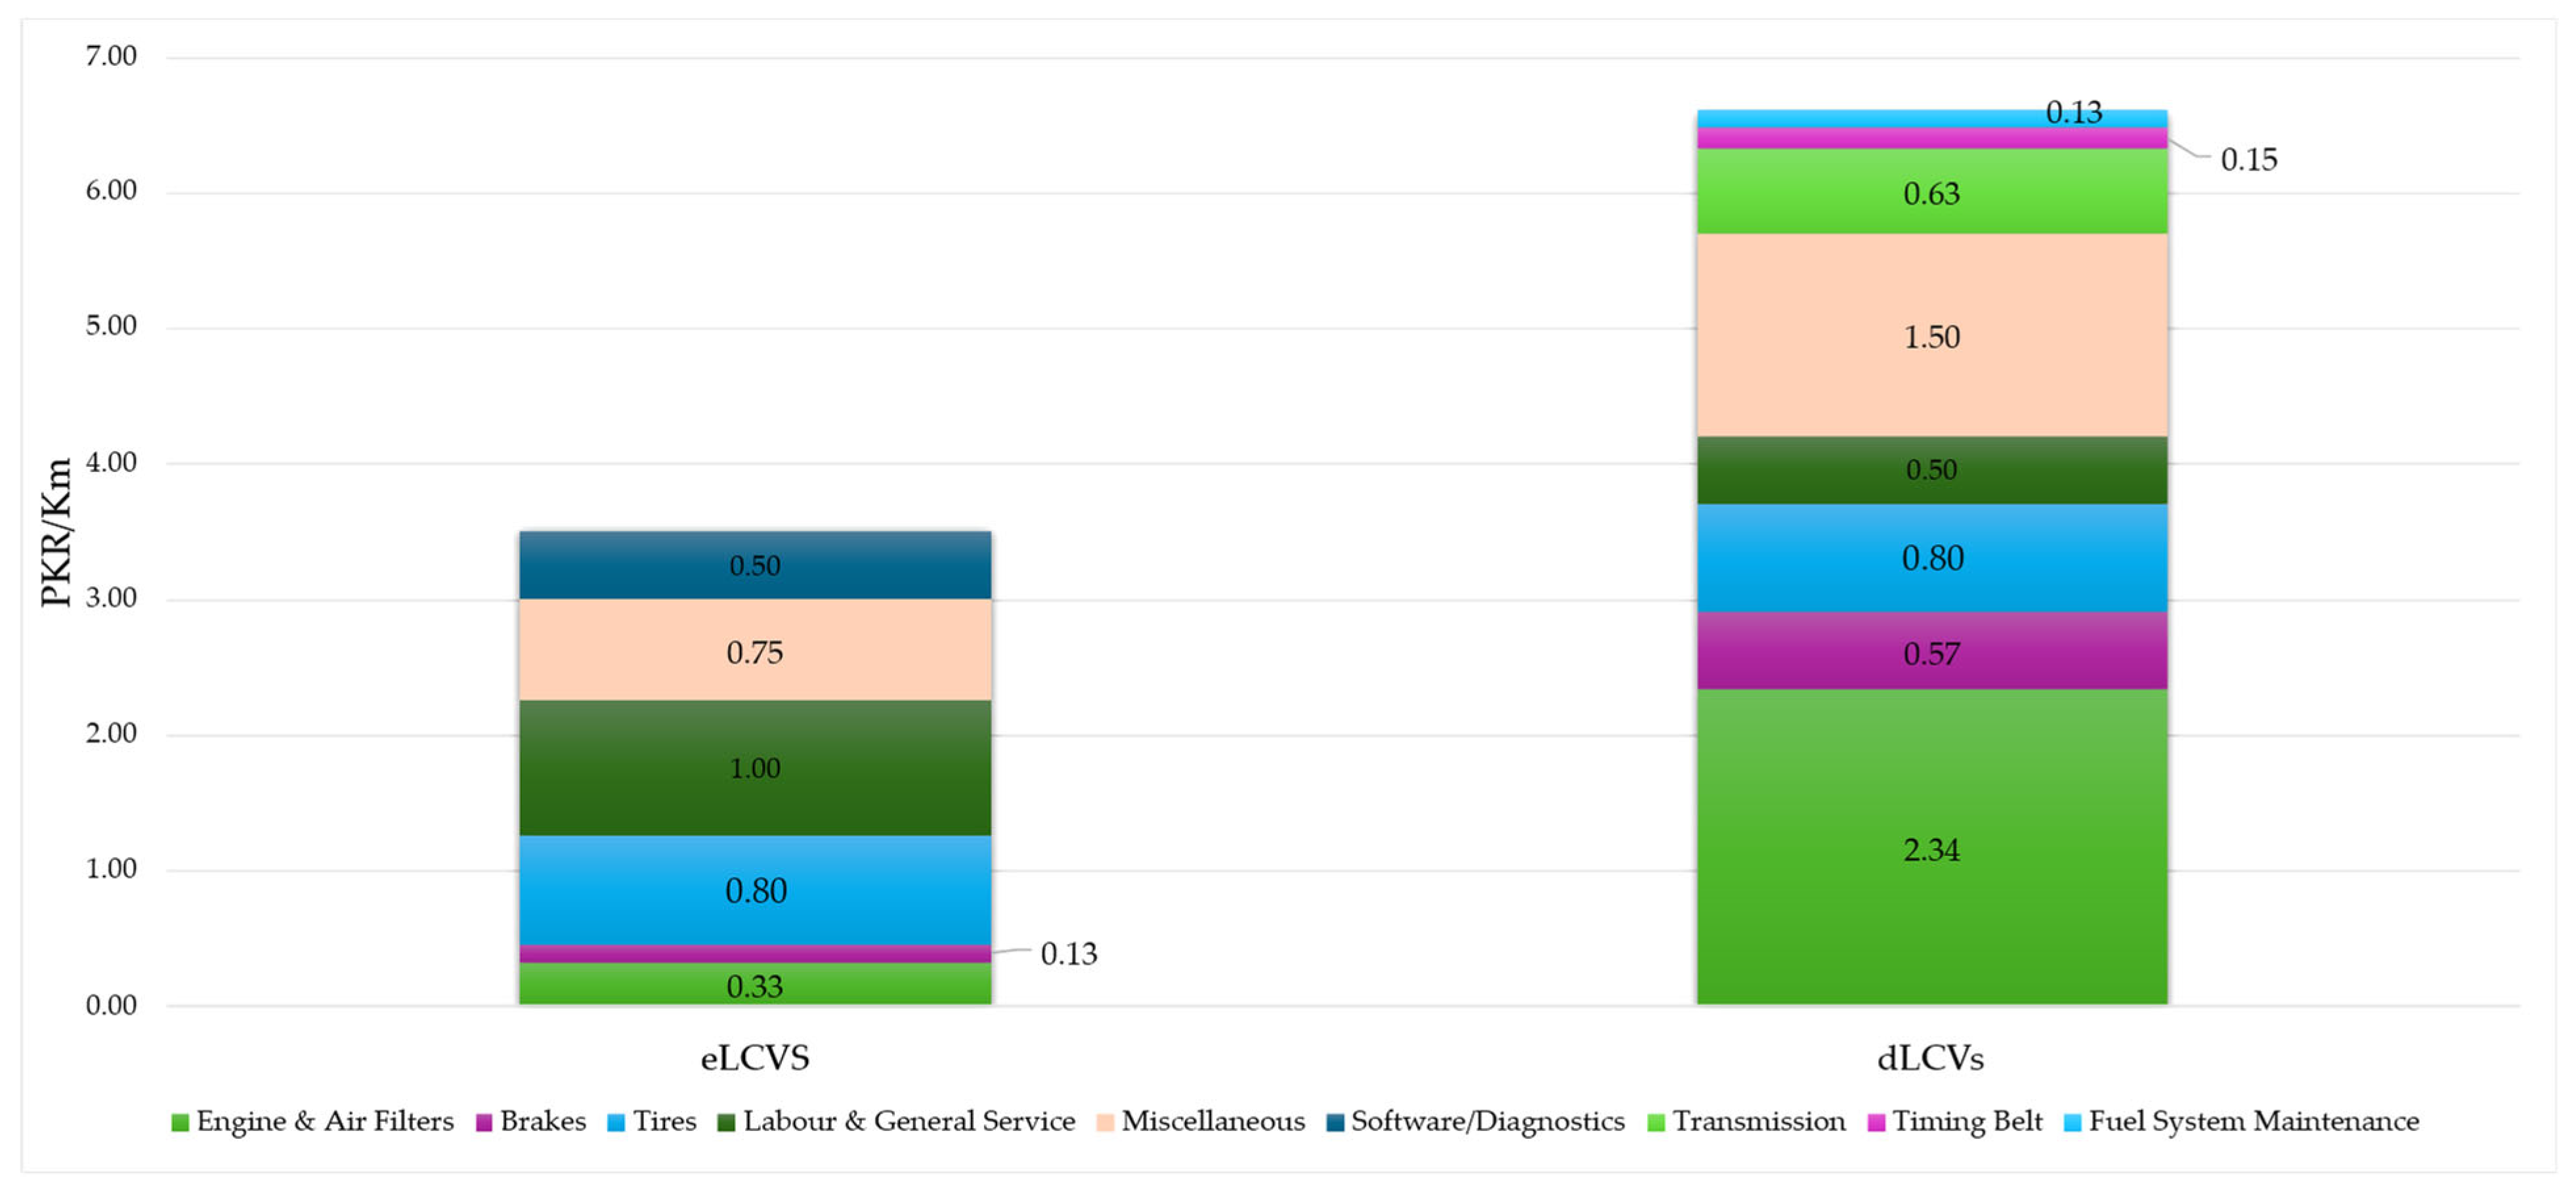
In the context of Pakistan’s automotive sector, such granular estimates remain largely absent, with most analyses presenting OPEX as lump-sum values [
26]. Estimates for maintenance costs were sourced from the prevailing literature and relevant databases, while leveraging bottom-up estimation [
12,
37]. A summary illustration of the cost components (Hyundai Porter H-100 [
37]) is presented in
Figure 2, while detailed cost estimates are presented in
Tables S5 and S6.
2.2.7. Infrastructure Cost
Conventional powertrains benefit from a mature and robust infrastructure base. In contrast, electric vehicles are encumbered by notable constraints, with this challenge being particularly acute in developing countries [
18]. An adequate and reliable charging infrastructure is a fundamental prerequisite for fleet electrification, particularly due to the implicit costs associated with its deployment and maintenance [
23].
In Pakistan, the incipient market penetration of battery-electric propulsion systems underscores the urgent need for a robust charging infrastructure base. Among various challenges, the limited on-road presence of electric vehicles is largely attributable to consumer concerns regarding implicit costs and operational uncertainties—mainly, range anxiety, compromised payload capacity, and extended charging durations, all of which contribute to the perceived inconvenience of eLCV ownership [
5,
24]. These challenges are further exacerbated by technical limitations, particularly the integration of DC fast chargers with the existing installed weak power distribution network [
20].
In contrast, Italian stakeholders encounter a different form of infrastructural constraint: a strategic dilemma regarding optimal fleet size, given that a typical 100 kW fast charger can accommodate only four eLCVs [
12]. Despite growing policy support, fleet operators in Italy remain skeptical of the abrupt electrification of the fleet due to the high upfront cost of fast-charging infrastructure [
16].
To estimate infrastructure costs, bottom-up estimation was leveraged [
14,
34,
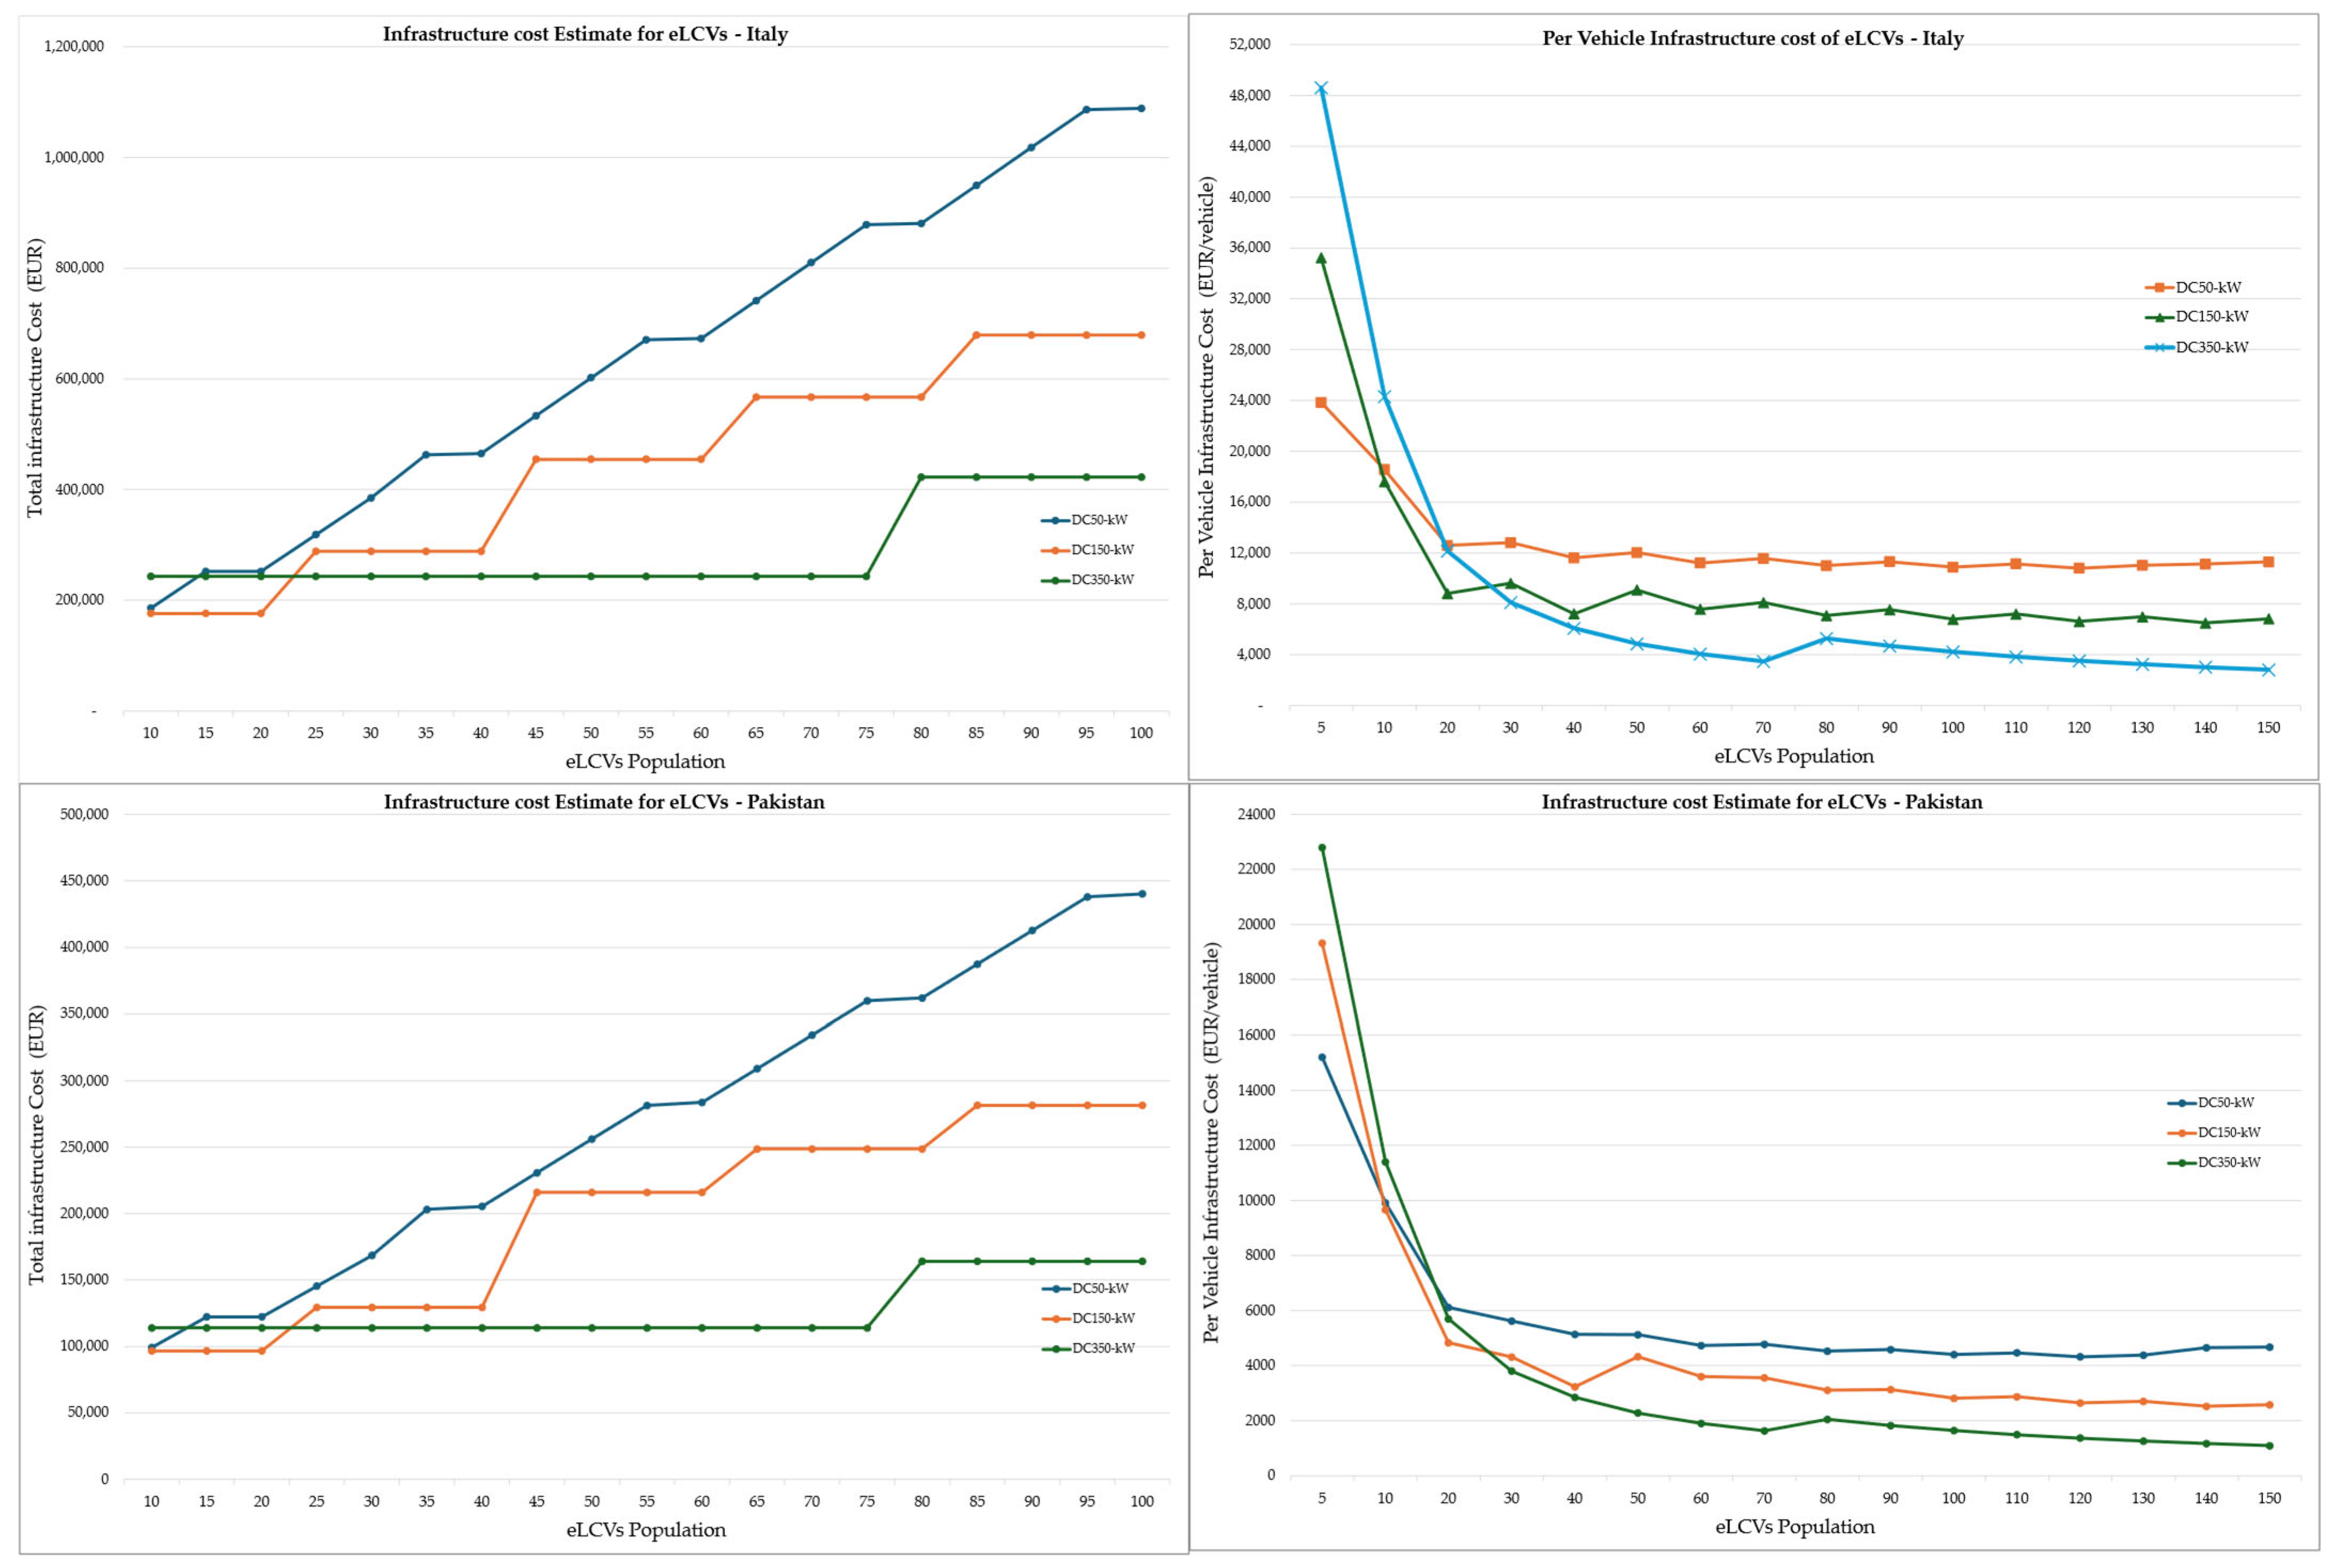
43], assuming that fleet owners will deploy private charging stations at their depots using a DC 150 kW charger configuration. The total capital expenditure for infrastructure deployment was quantified relative to the operational lifespan and distributed proportionally across the fleet size. While the selection of optimal charging units, based on output capacity relative to fleet size, constitutes an optimization problem in its own right, the choice of the aforementioned configuration was principally motivated by its economic feasibility for the given fleet size (
Figure 3). The resulting total infrastructure cost was quantified as EUR 8806 per charging unit for Italy and EUR 4832 for Pakistan, assuming a fleet of 20 eLCVs.
Fundamentally, the charging infrastructure cost is a function of the referenced fleet size, with expenditures varying considerably as fleet size changes. Empirical analysis indicates a linear relationship between fleet size and infrastructure cost. Sensitivity analysis reveals that the DC 150 kW charger represents the most economically viable solution for smaller fleets (10–20 eLCVs), balancing optimal charging output with minimal downtime [
43]. As fleet size expands, however, the DC 350 kW charger emerges as the preferred alternative, particularly for a fleet size exceeding 20 LCVs, due to its superior throughput and operational efficiency. Conversely, the DC 50 kW configuration is deemed the most cost-effective for fleets comprising fewer than five LCVs.
Notably, the infrastructure cost scales linearly with the fleet size relative to the charger type and configuration. Comprehensive infrastructure cost estimates for both case countries are provided in
Table S4.
2.2.8. Residual Value
The quantification of salvage value is inherently non-linear and complex, being subject to multiple endogenous factors including vehicle condition, mileage, brand equity, and market perception for the given powertrain [
11,
28]. Given the nascent market penetration of eLCVs in both Italy and Pakistan, while the vehicles are yet to be retired post useful life, in order to ensure a coherent baseline comparison, a uniform residual value of 15% was applied across both markets.
4. Discussion
An emerging consensus within the scholarly discourse underscores the environmental and economic advantages of electrifying the light commercial segment, particularly within urban logistics and short-haul applications [
15,
28]. Cost parity for electric propulsion systems has been broadly acknowledged in the light-duty vehicle segment, evidently with battery capacities below 100 kWh [
11], and their economic competitiveness in medium- and heavy-duty sectors remains highly dependent on structured subsidy schemes and tailored fiscal incentives [
13].
TCO estimation is intrinsically sensitive to regional and operational contexts, often yielding divergent outcomes [
7,
14]. This cross-country comparative assessment of LCVs in Italy and Pakistan—two nations with markedly different stages of economic development and differing fiscal policy landscapes—underscores the profound influence of regional policy frameworks on cost estimations. Beyond cross-national benchmarking, the analysis also interrogates the key cost drivers underpinning the economic viability of each propulsion system.
The Italian automotive sector is increasingly transitioning toward eLCVs, mainly motivated by increasingly stringent environmental regulations. Across EU, a plethora of corporations have initiated large-scale pilot deployments of eLCVs in urban settings, predominantly for last-mile delivery operations. Conversely, Pakistan, under the strategic framework of the China–Pakistan Economic Corridor (CPEC), has significant untapped potential to decarbonize its freight sector [
47]. As a pivotal trade corridor linking Central Asia and China to global markets, Pakistan’s logistics landscape is poised for transformation, with eLCVs emerging as a viable solution to align economic growth with environmental sustainability.
This comprehensive TCO analysis between Italy and Pakistan highlights the significant influence of regional policy frameworks on cost estimation. Four critical determinants emerged that necessitate rigorous discussion: the acquisition cost, the infrastructure cost, the annual distance travelled (ADT), and fiscal policy regimes.
4.1. TCO—Italy Versus Pakistan
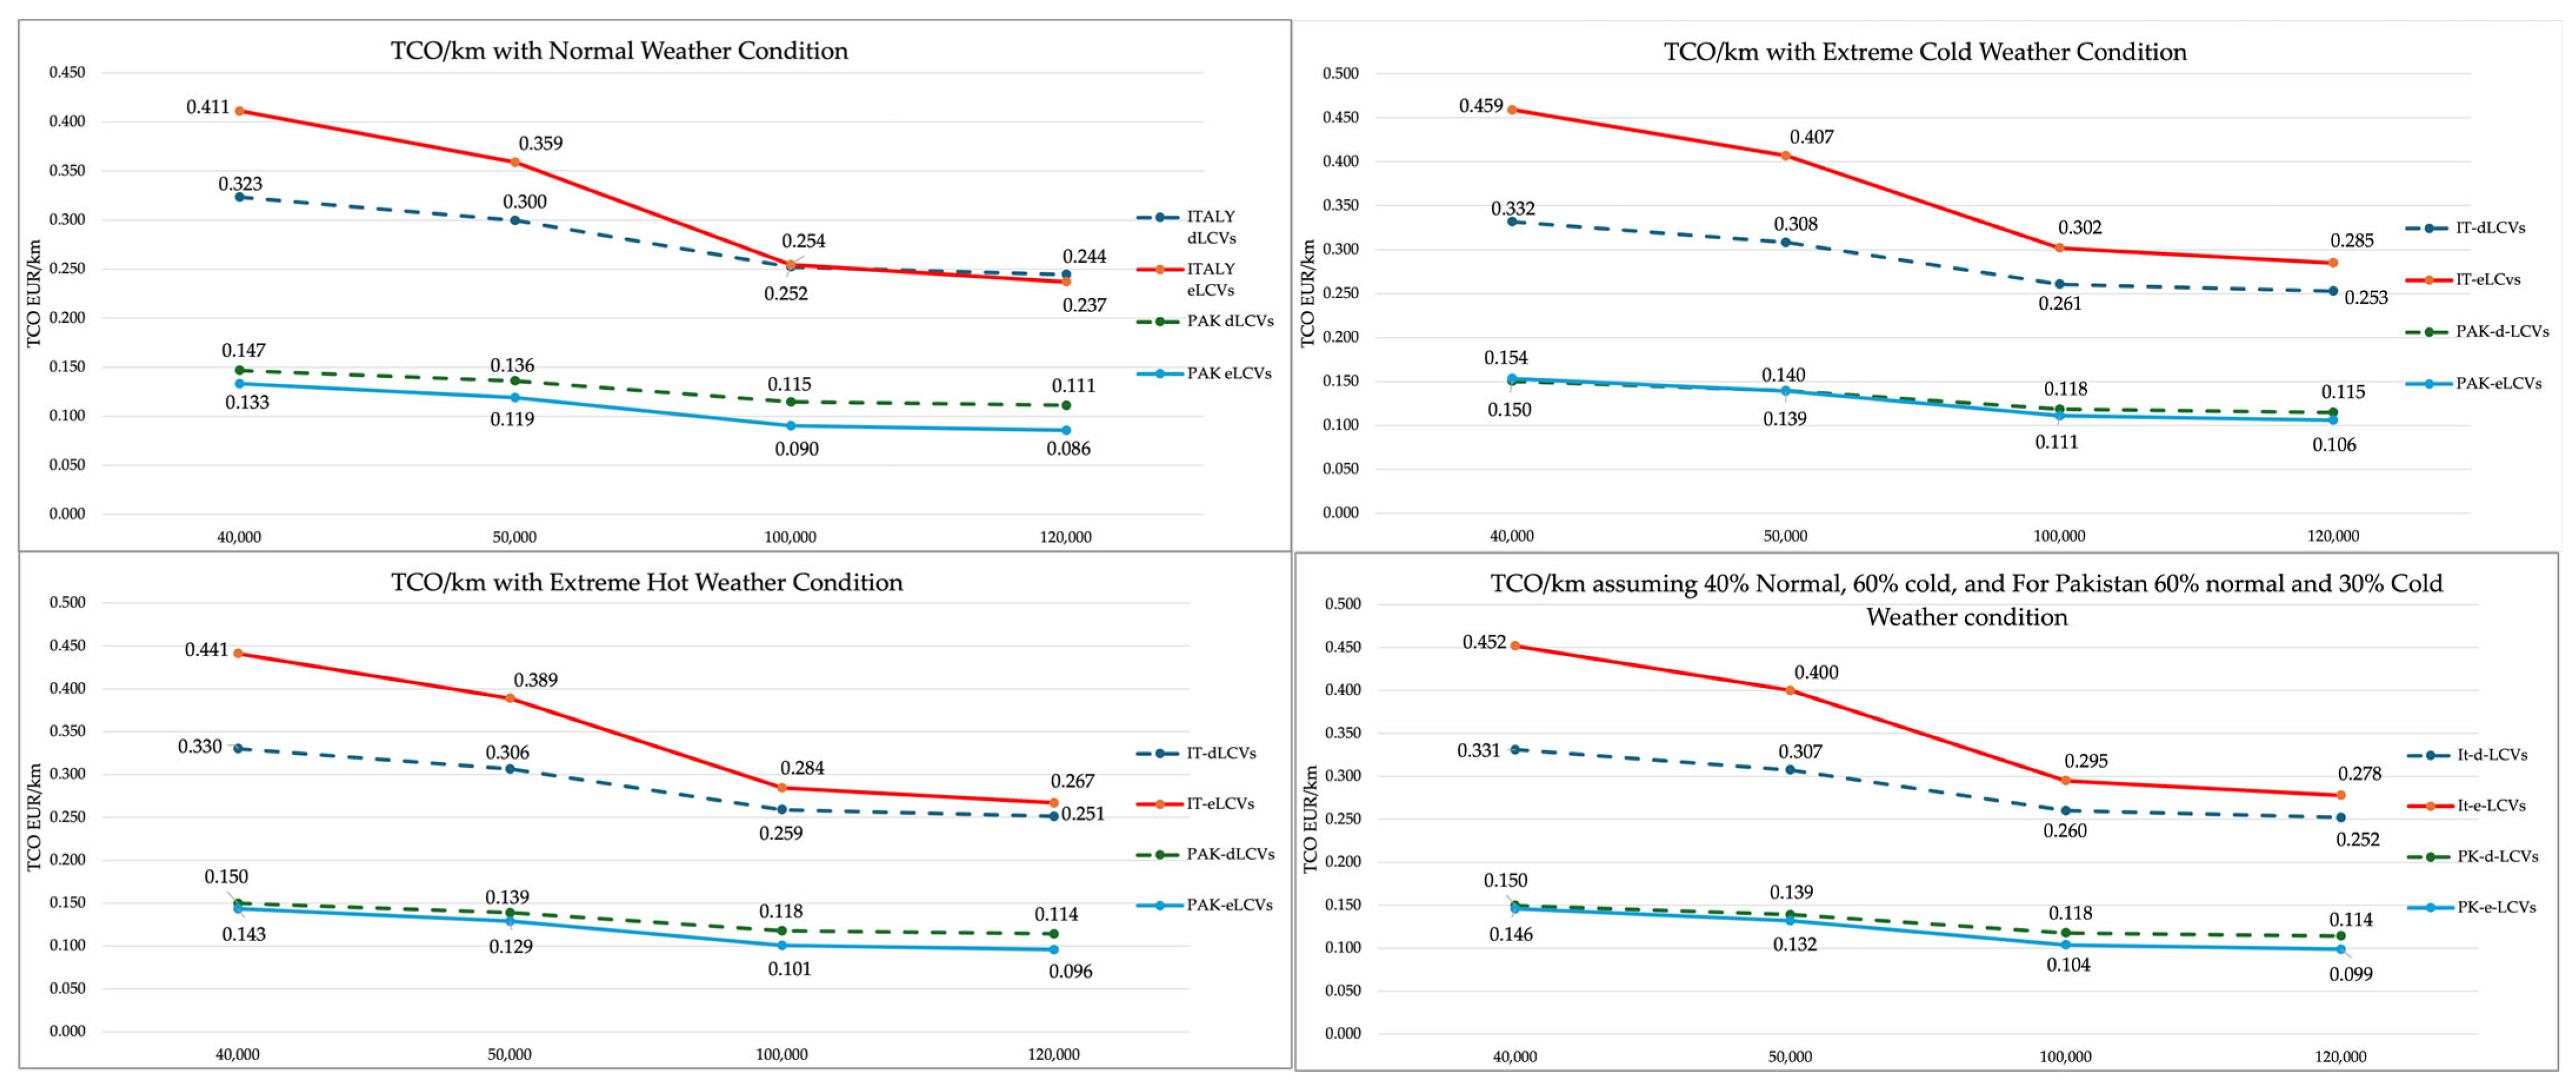
The TCO analysis reveals divergent economic outcomes for eLCVs between the two markets, with results in Italy exhibiting heightened sensitivity to operational scenarios. Under the baseline scenario, the eLCVs in Italy are marginally less competitive relative to diesel counterparts, demonstrating a per-kilometer cost differential of 1.2 times. However, economic inefficiency diminishes with higher annual mileage (100,000 km/year), where the cost of eLCVs declines to 0.254 EUR/km, relative to dLCVs at 0.252 EUR/km. In contrast, Pakistan exhibits a markedly stronger economic appeal for eLCVs. TCO outcomes reveal that eLCVs are not only cost-competitive but are, in fact, approximately 12.50% more cost-efficient than their diesel equivalents. This economic superiority is further amplified to 22% over a higher ADT, reinforcing the strategic viability of electrified fleets in high-utilization contexts.
4.2. Acquisition Cost
The acquisition cost of eLCVs is predominantly dictated by the higher cost of lithium-ion batteries. Globally, the downward trajectory of lithium-ion batteries promises to bolster the economic viability of eLCVs across varying configurations [
5]. Notably, Chinese dominance in lithium-ion battery production accounts for over 65% of global output [
11], while providing a competitive edge to its domestic manufacturers to offer electric vehicles at highly competitive prices, often outpacing their Western counterparts.
The Italian automotive industry is protected via tariffs and faces elevated battery procurement costs, which in turn inflate the upfront price of electric vehicles. This structural disadvantage is clearly reflected in the MSRP of eLCVs in Italy, which averages approximately EUR 82,048, nearly double that of their diesel counterparts, while it constitutes approximately 56% of the cumulative TCO.
Conversely, Pakistan’s deregulated automotive sector, characterized by fragile macroeconomic conditions, limited consumer purchasing power, and a relatively deregulated market, has created a fertile environment for low-cost vehicle proliferation. Over 70% of vehicles sold fall below the EUR 14,000 MSRP threshold [
26]. This dynamic, coupled with regulatory openness, has enabled aggressive entry by Chinese OEMs, intensifying competition and substantially reducing acquisition costs. This is reflected in the CAPEX structure of eLCVs, where capital expenditures account for just 44% of the total TCO/km. Nevertheless, despite comparatively lower acquisition prices than in Italy, the prevailing MSRP bracket remains a considerable bottleneck to mass-market eLCV adoption [
5].
4.3. Nexus of ADT and Threshold MSRP
The higher upfront acquisition cost, compounded with the associated implicit cost of eLCVs, renders dLCVs as an economically compelling alternative for commercial fleet operators. Numerous studies have employed the ADT and operational life span as proxy indicators for assessing the cost competitiveness of given powertrains [
14,
28].
Nevertheless, in Italy, the elevated MSRP cost of eLCVS can be substantially offset by lower annual operating costs, attributed to extended service life and increased ADT. This change, driven by lower OPEX/km, may, under appropriate conditions, shift the economic balance in favor of eLCVs.
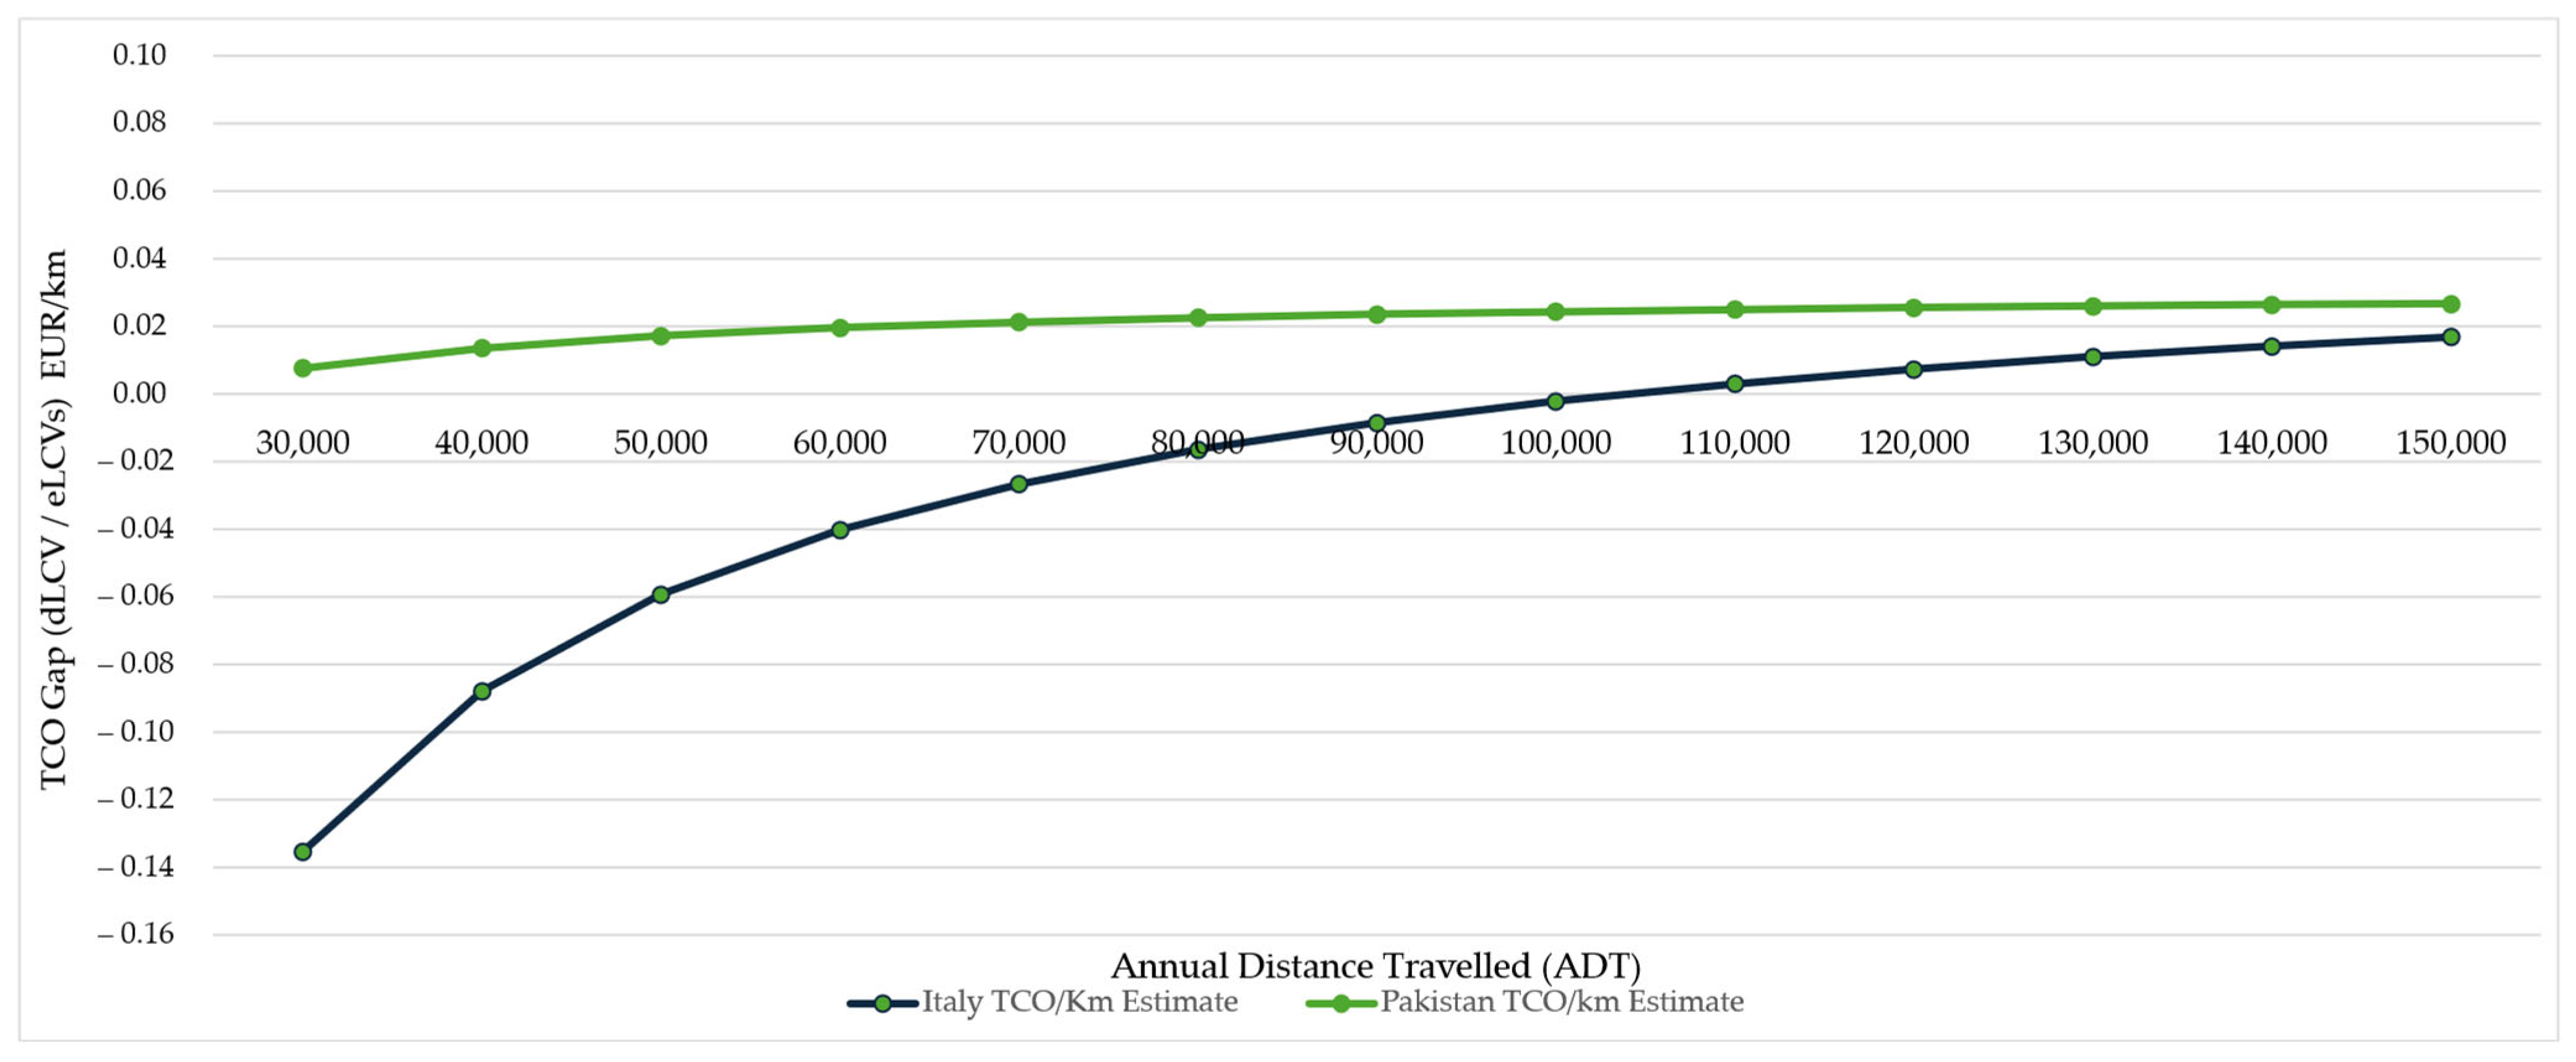
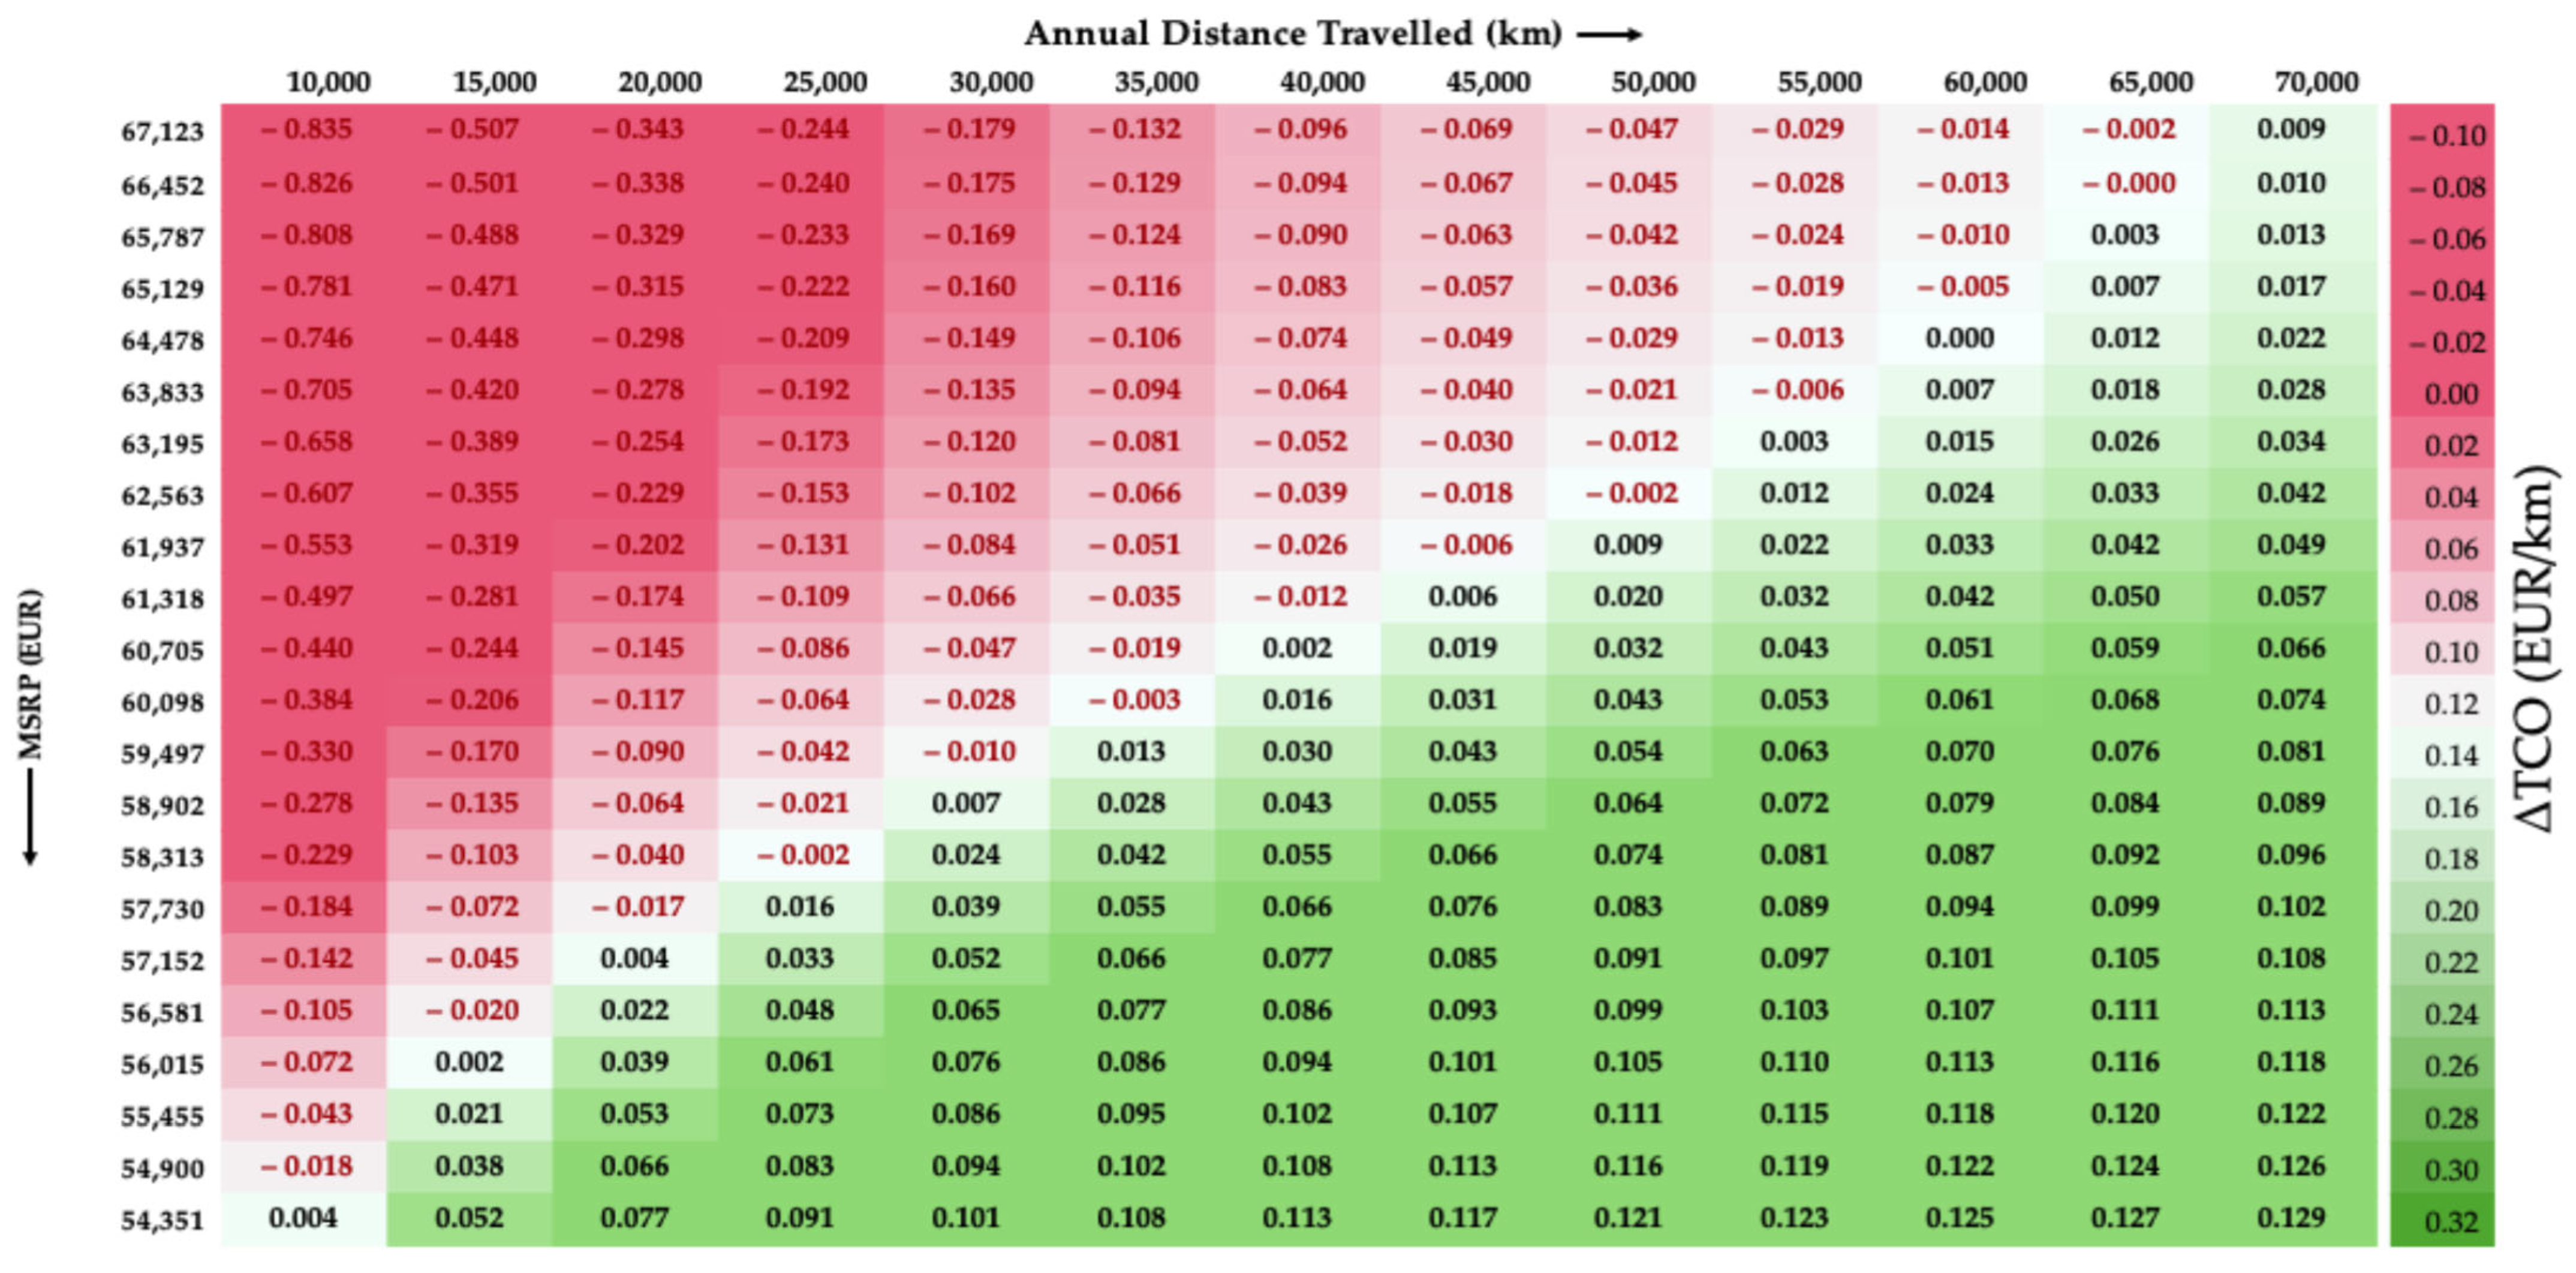
A pivotal consideration in this discourse pertains to quantifying the minimum purchase price at which eLCVs attain cost parity with their diesel counterparts. We systematically addressed this aspect via two-way simulation analysis, delineating the interplay between threshold acquisition price relative to varying ADTs (
Figure 8).
Our results suggest that eLCVs achieve cost parity relative to dLCVs in the Italian market when the acquisition price falls to a threshold value of approximately EUR 61,937, assuming an ADT of 50,000 km. Under a baseline MSRP, however, parity can only be realized with an annual mileage exceeding 65,000 km. Notably, economic viability improves substantially at lower mileage levels, provided the purchase price drops below EUR 58,000. In Pakistan, eLCVs already exhibit cost competitiveness relative to their diesel counterparts. Simulation results show that at an MSRP of EUR 15,200, parity is attained at an ADT as low as 15,000 km. These findings underscore the sensitivity of TCO in price-constrained markets, where even modest CAPEX reductions can significantly enhance the viability of electric powertrains.
4.4. Regional Variabilities in Subsidy and Fiscal Policy
Notably, LCVs are subject to a wide array of fiscal and regulatory policies, considering their urban utilization. This contributes to significant regional variability in economic competitiveness, rendering cost estimations as highly scenario dependent [
13]. In Italy, for instance, eLCVs benefit from a range of subsidies and purchase incentives; however, the extent and structure of these benefits vary considerably by region. Conversely, Pakistan’s subsidy framework lacks this level of regional differentiation, with national-level incentives applied more uniformly.
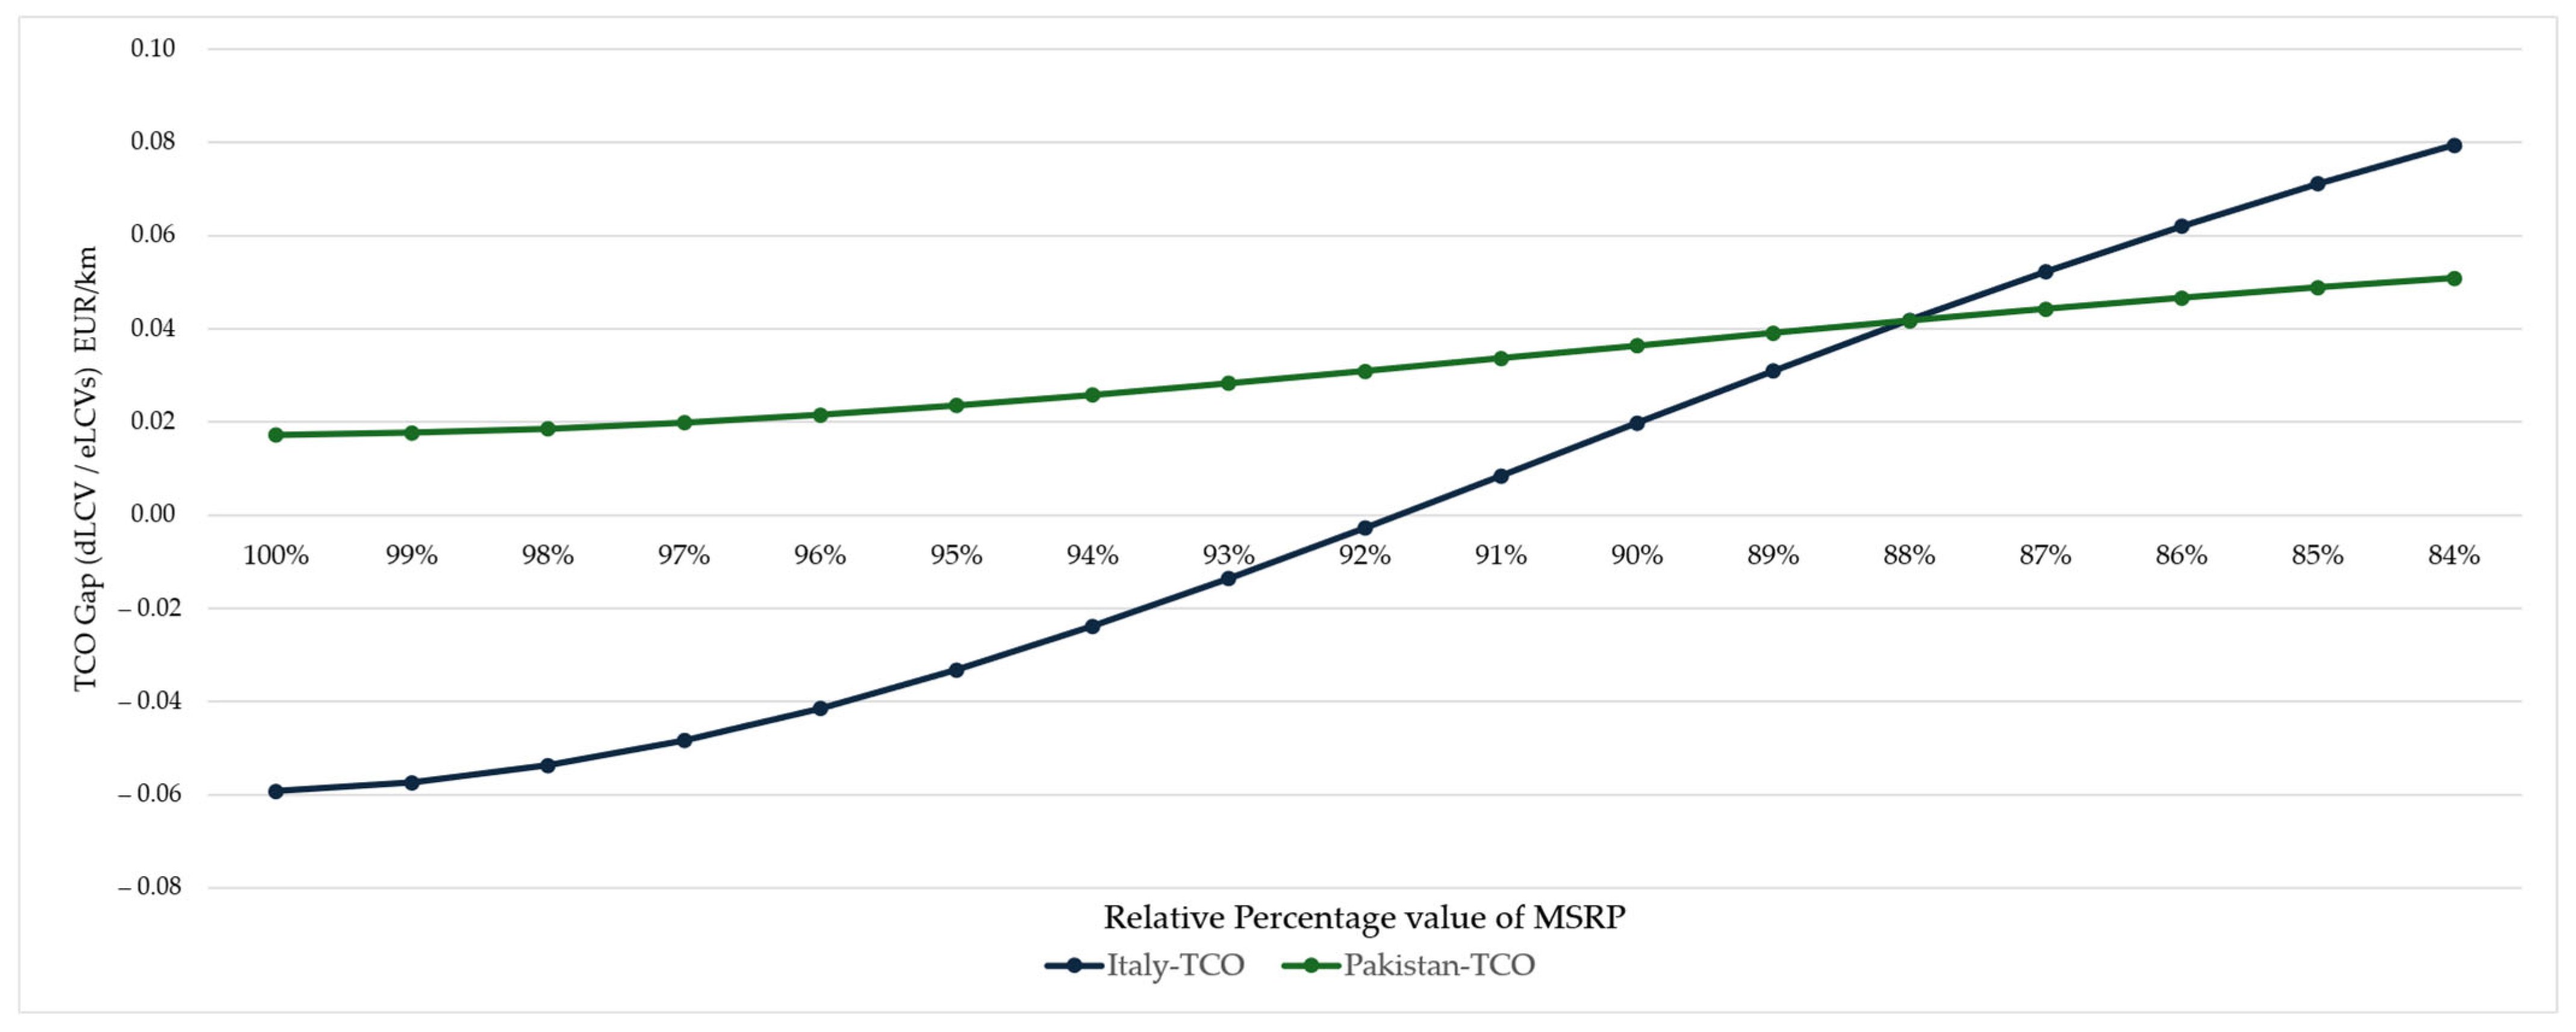
Incentivization via subsidies notably improves cost competitiveness, with a uniform 10% subsidy on the MSRP of eLCVs yielding notable economic appeal, thereby reducing the TCO per kilometer by approximately 4.30% in Italy and 3.17% in Pakistan, expediting the cost parity relative to dLCVs.
These improvements are sufficient to render eLCVs as cost-competitive with their diesel counterparts in both markets. However, to foster sustainable market development, operational incentivization should be prioritized for both countries.
4.5. Energy Tariffs
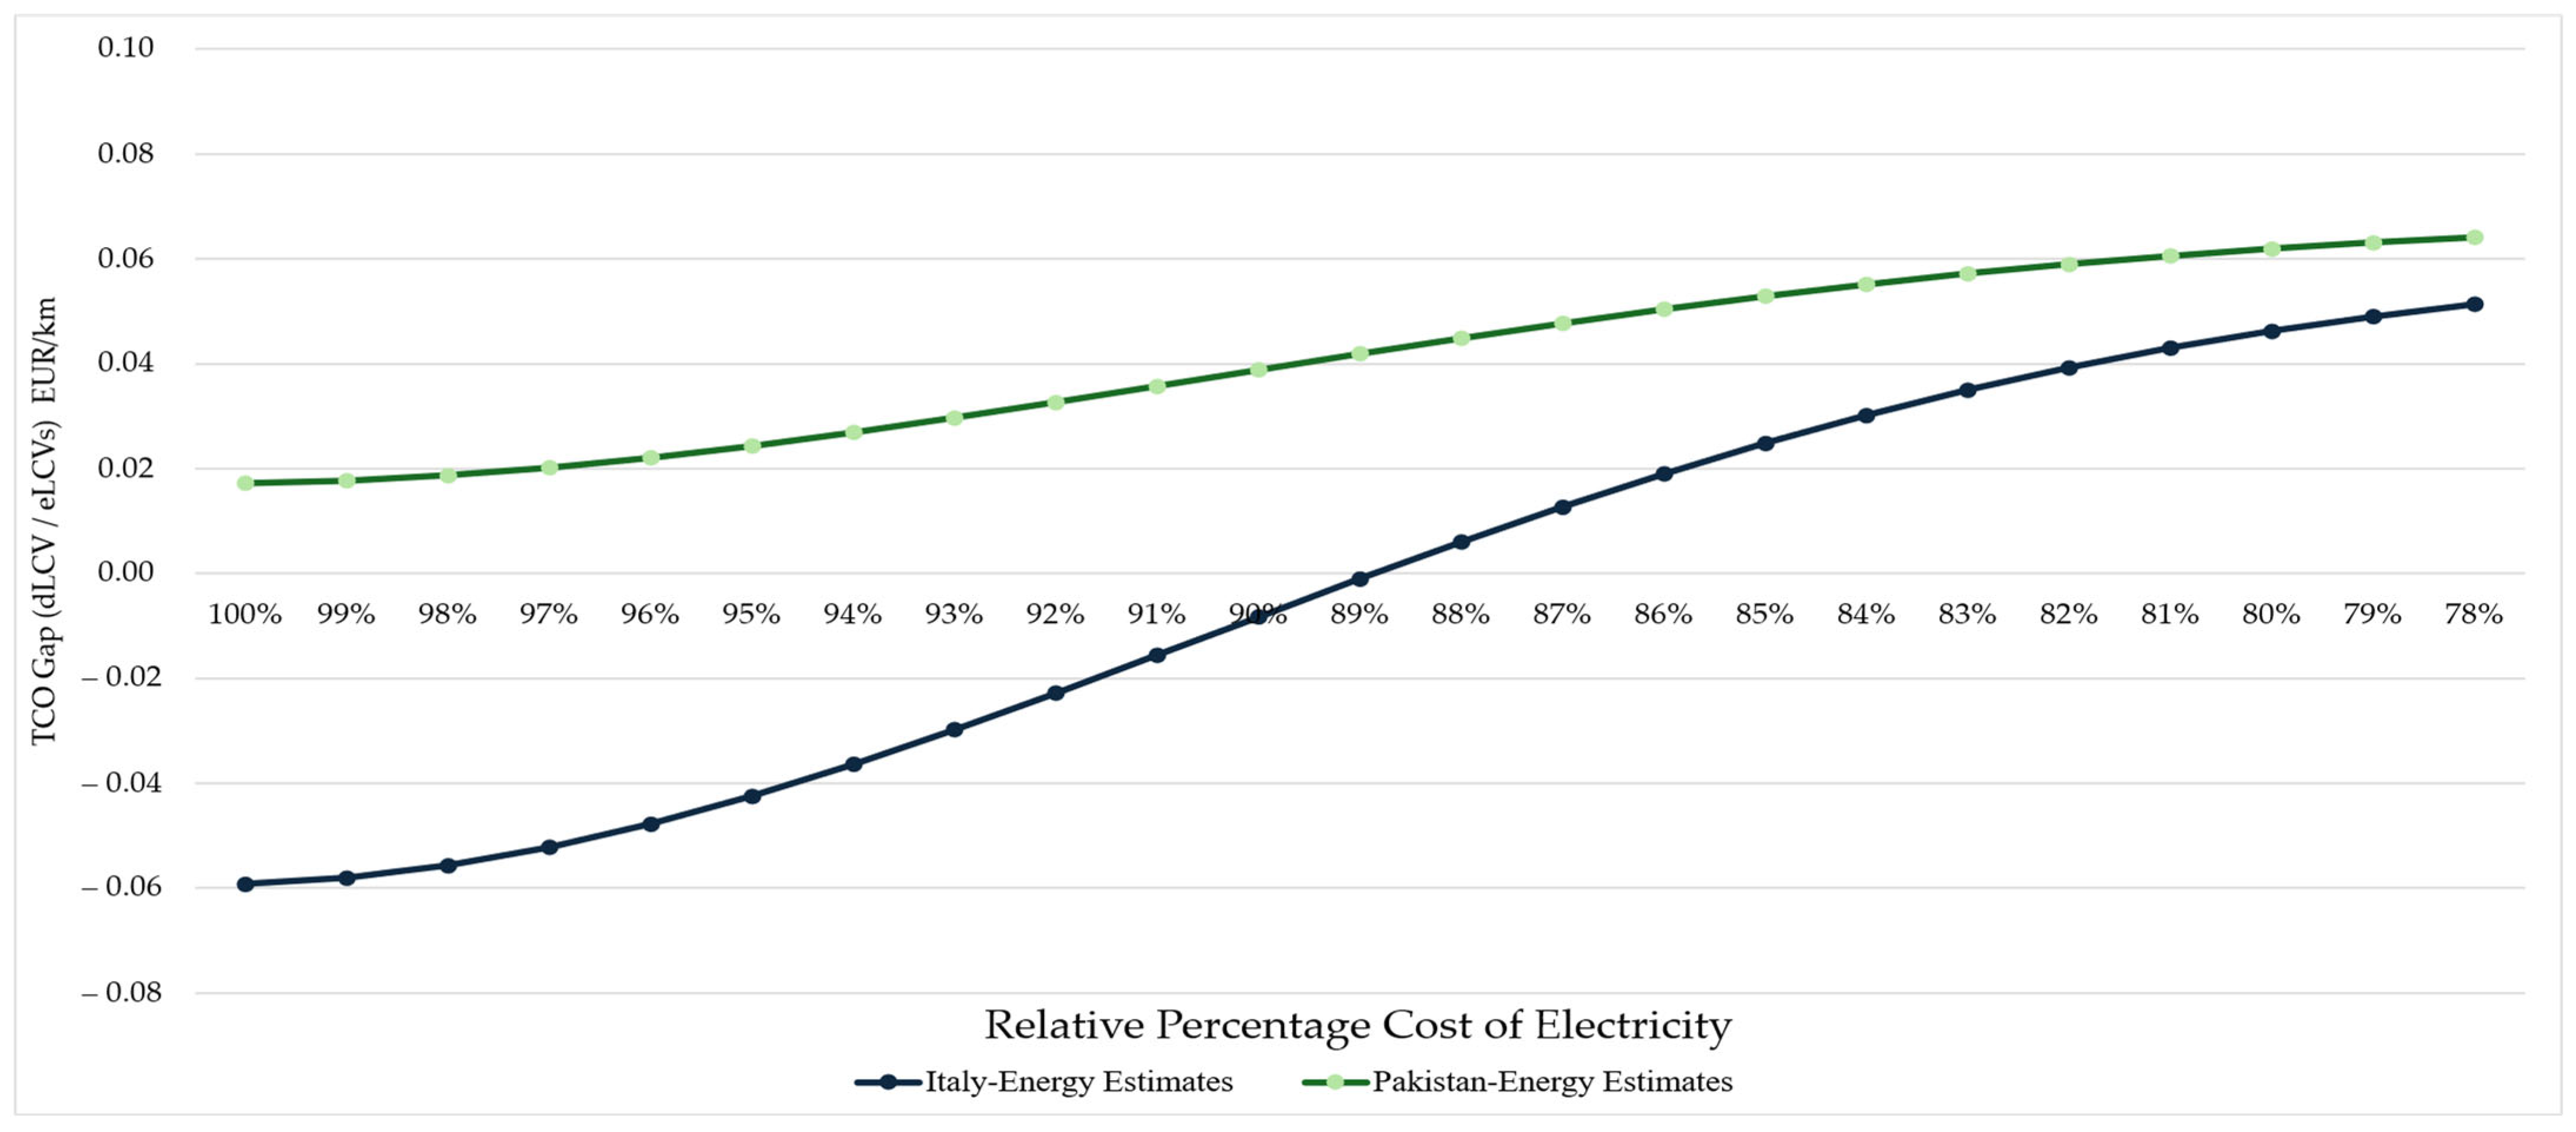
Italy and Pakistan demonstrate significant divergence in their respective energy cost structures. In Italy, fossil fuel taxation (accounting for 53%) serves as a catalytic policy measure that actively incentivizes alternative powertrains. In comparison, Pakistan’s energy taxation framework presents untapped potential to bolster eLCV competitiveness, particularly through the elimination of fuel adjustment charges embedded in electricity bills. Between 2019 and 2024, electricity prices surged by 275% [
48], triggering widespread adoption of solar photovoltaic (PV) systems. This shift underscores the strategic imperative of minimizing energy costs. Despite broader economic and environmental benefits, solar-based recharging enhances economic viability by reducing charging costs by 42.41% (to EUR 0.10/kWh) and lowering grid dependency by nearly 60% [
20].
4.6. Infrastructure Cost
Globally, the development of charging infrastructure is often framed as a classic “chicken-and-egg” dilemma—on one hand, fleet operators remain hesitant to transition in the absence of a robust infrastructure network, while investors refrain from committing due to high upfront capital costs [
49]. Prevailing scholarly discourse reflects an ongoing debate over whether infrastructure costs should be explicitly included in the TCO framework. Their inclusion—or exclusion—substantially influences the perceived economic feasibility of electric fleets. Diesel-powered LCVs currently retain a clear advantage in this regard [
11], benefitting from an extensive and mature network of refueling stations.
According to our TCO estimates, eLCVs are approaching TCO parity relative to dLCVs, even without accounting for subsidies, despite including elevated infrastructure costs. The inclusion and exclusion of such costs considerably dictate the cost competitiveness of eLCVs.
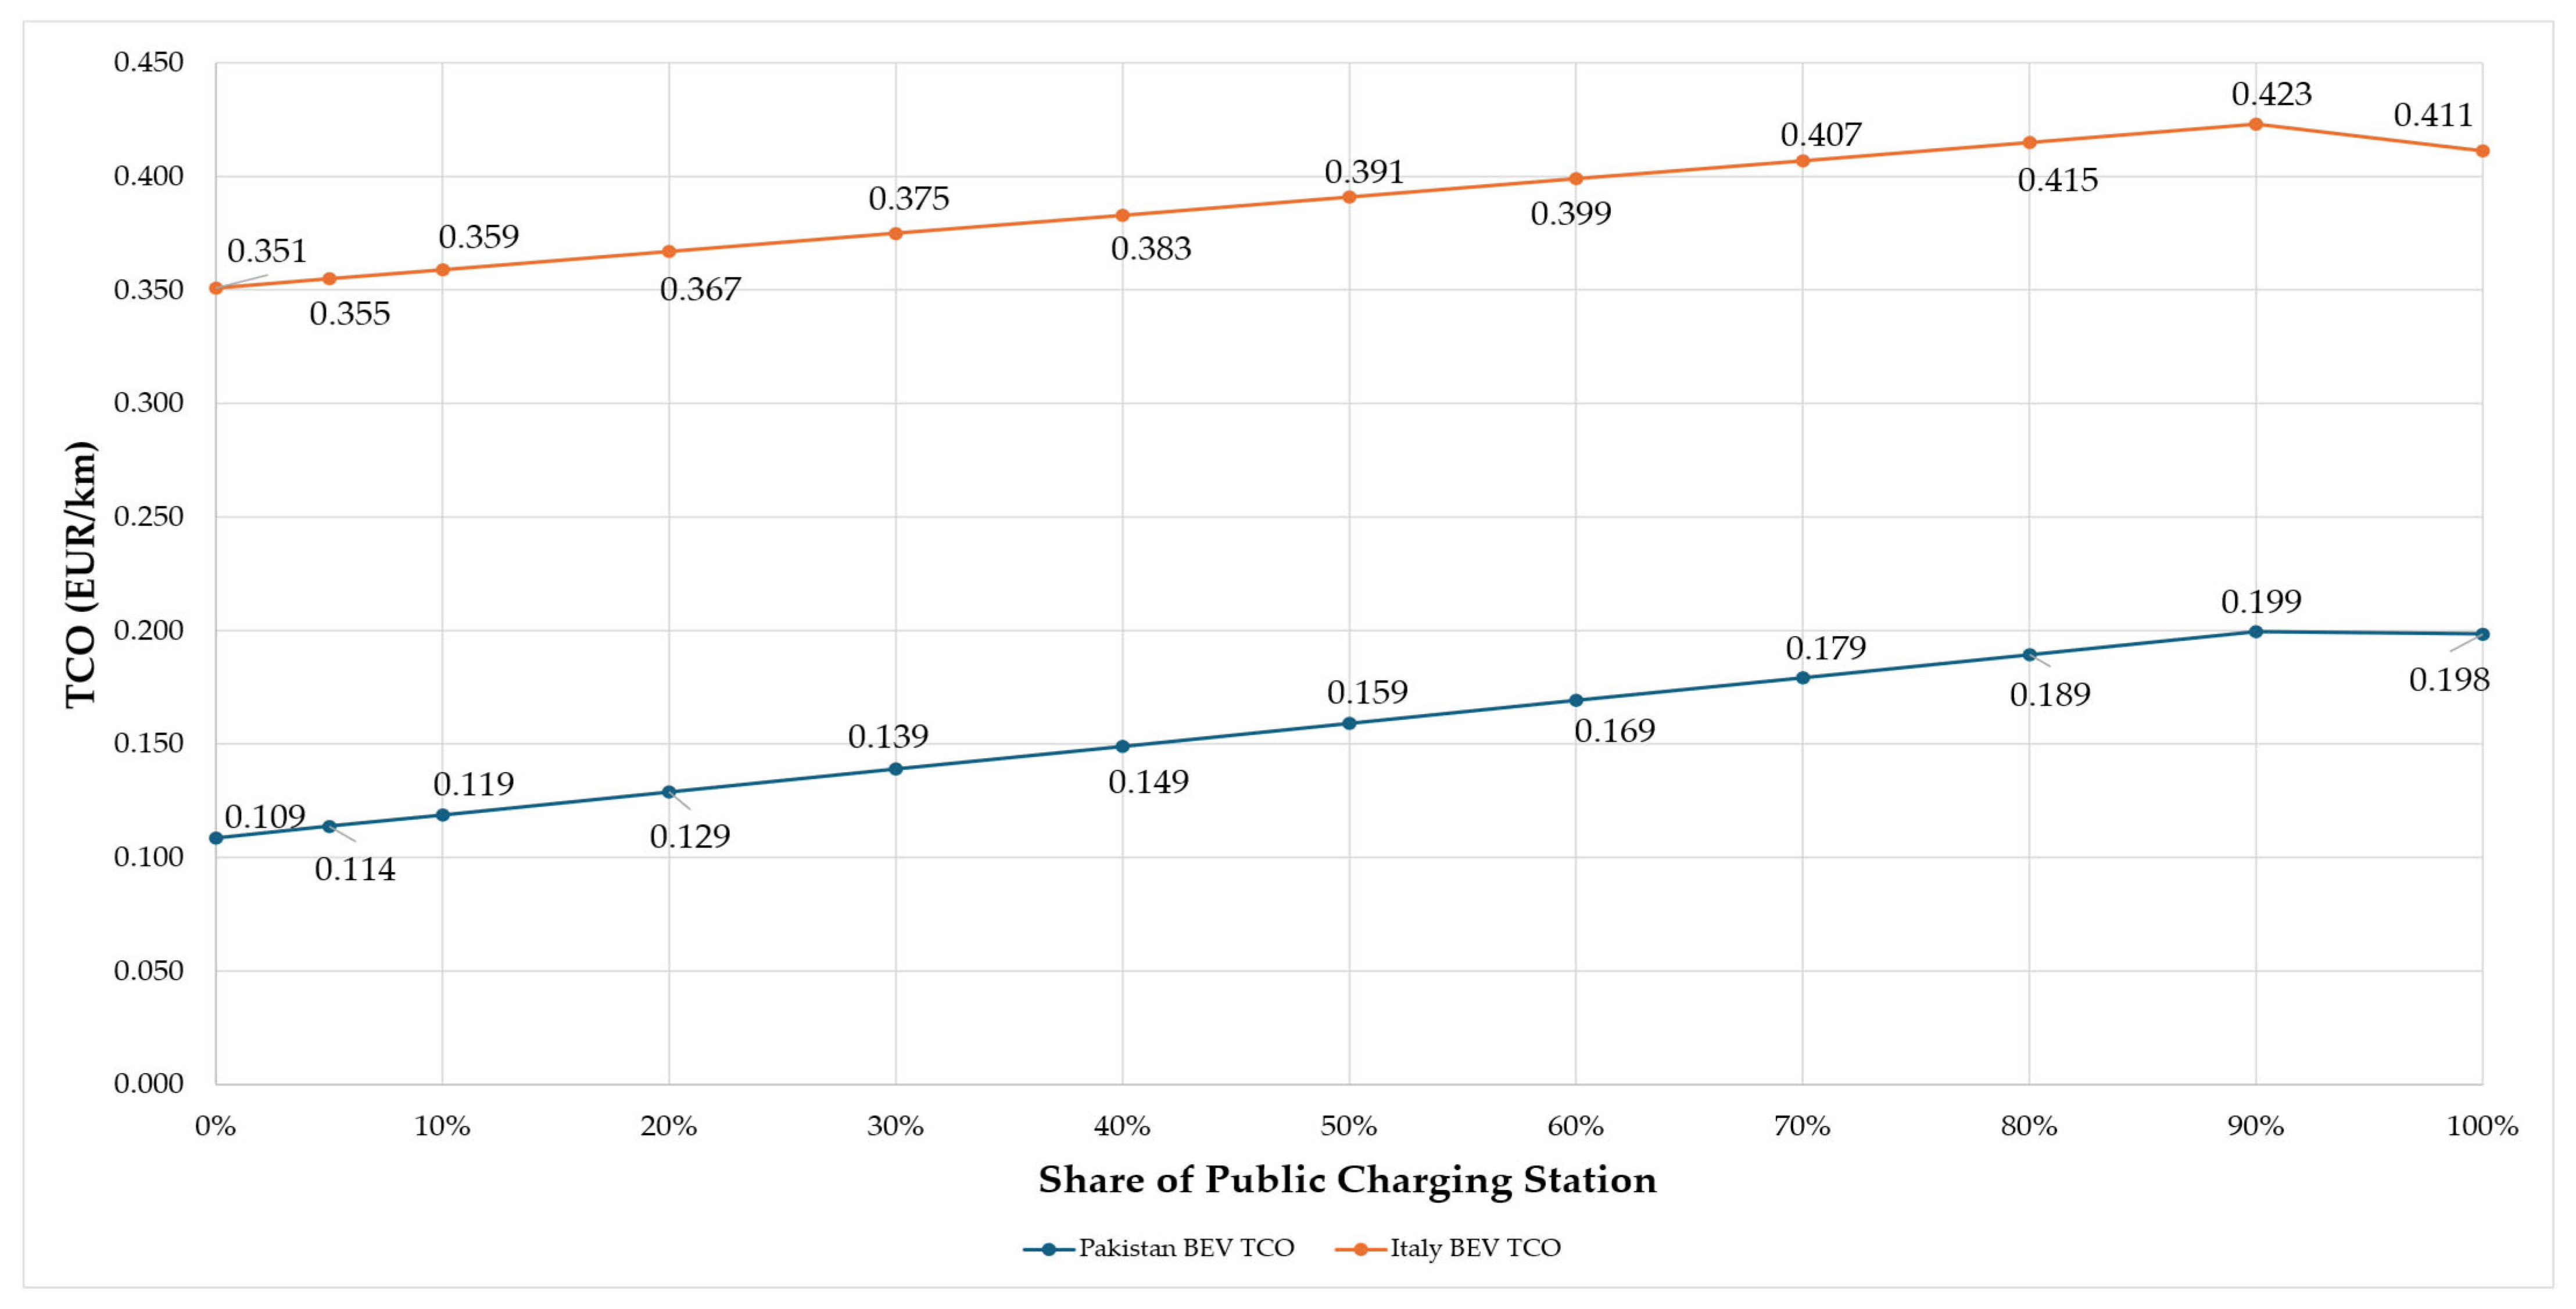
In our analysis, infrastructure costs were calculated specifically for DC (150 kW) charging units, with station sizes determined by output capacity and the time required to fully recharge the fleet. The sensitivity analysis reveals a positive linear relationship between eLCVs’ TCO and the share of public charging infrastructure in both Italy and Pakistan, with a marginal decline at full (100%) public charging penetration due to the elimination of infrastructure costs (
Figure 9).
In Italy, the baseline TCO for eLCVs is estimated at 0.351 EUR/km under a 0% reliance on public charging, assuming depot-based electricity priced at 0.35 EUR/kWh. Across increasing shares of public charging, a positive functional relationship emerges, irrespective of regional differentiation. However, at 100% public charging utilization, the TCO marginally contracts to 0.411 EUR/km due to the modelled exclusion of infrastructure cost allocation when all charging demand is met externally. In Pakistan, a similar pattern is observed, with TCO rising from 0.109 EUR/km to a peak of 0.199 EUR/km before slightly declining to 0.198 EUR/km under the same cost-neutral public charging assumption. While Italy exhibits a higher absolute TCO across all penetration levels due to elevated electricity tariffs and cost structures, Pakistan demonstrates a greater relative sensitivity, with a ~82% increase from baseline to peak compared to ~20% in Italy.
In Italy, infrastructure costs inclusion inflates the eLCV TCO by 6%, whereas its exclusion narrows the cost gap to single-digit margins, emphasizing the need for operational incentives and optimized station planning. In Pakistan, the absence of infrastructure costs from the consumer’s burden improves the TCO by over 10%, underscoring the catalytic impact of public financing or subsidy-backed models in accelerating electric fleet adoption.
5. Conclusions and Policy Recommendations
Italy and Pakistan exhibit markedly different market dynamics and fiscal policy frameworks, thereby necessitating tailored recommendations due to the varying nature of the challenges for both markets.
The strategic role of policymakers is indispensable in enhancing the economic appeal of alternative powertrains. Despite escalating environmental concerns, the transportation sector exhibited substantial inertia towards sustainable transition, adhering to the dogma for its reliance on fossil fuel and highlighting the need for proactive government intervention. The EU’s vehement attitude towards carbon neutrality results in elevated fossil fuel taxes, which are in favor of economic competitiveness for alternative powertrains. In contrast, countries where fossil fuel is subsidized result in deferred cost parity of eLCVS relative to diesel equivalents. Given the catalytic role of government intervention, a strategic dilemma emerges: whether to prioritize the fixed subsidy or operational incentivization [
17]. Importantly, the latter approach warrants sustainable and organic growth.
Since an LCV can be operated by both the fleet operators and by a single owner, the cost competitiveness for both would be considerably different, necessitating tailored policy measures while realizing the essentiality of context-specificity. Arguably, a single owner absorbs the maximum per-unit economic burden, often attributed to a lack of access to scale-driven financial incentives [
11]. The economic viability of electrification of LCVs instead substantially appeals to fleet operators (>20 vehicles/fleet) due to the shared infrastructure and maintenance schedules.
5.1. Policy Recommendation for Pakistan
While Pakistan’s National Electric Vehicle Policy (NEVP) was introduced to accelerate transport electrification, its current scope remains narrowly focused on fiscal regimes, lacking regulatory specificity and operational clarity. These structural gaps leave significant room for arbitrary interpretation and fragmented execution, particularly in the domain of charging infrastructure [
49]. Establishing a standardized, centrally coordinated regulatory framework is imperative to support the seamless deployment of a nationwide charging network and to ensure cross-jurisdictional policy alignment.
One notable implementation gap is the NEVP’s toll tax exemption for eLCVs on national highways: a benefit that, despite being formally endorsed, has yet to be realized in practice. Additionally, electricity tariffs impose over 45% in surplus charges per kWh, posing a major barrier to fleet-wide eLCV adoption. India, despite sharing similar socio-economic conditions, presents a compelling benchmark, having introduced a national tariff policy that sets regional ceilings on energy commissions at 15% [
24].
Targeted reforms driven by operational incentivization could include grid modernization, smart metering at EV charging points, and per-kWh rebates. Localized battery manufacturing, particularly through partnerships with Chinese firms, could further reduce costs and expedite parity, even for medium-and heavy-duty fleets. Given the economic constraints of the region, public–private partnerships offer a viable pathway for deploying fast-charging infrastructure while simultaneously creating entrepreneurial opportunities for venture capitalists [
5,
25].
Nonetheless, investor skepticism remains pronounced due to narrow profit margins and high upfront capital requirements. Finally, enhanced collaboration between state departments and domestic manufacturers could catalyze economies of scale, further accelerating the adoption trajectory of eLCVs in Pakistan.
The automotive sector in Pakistan faces significant structural impediments, primarily stemming from high taxation, where consumers bear a minimum of 45% in total vehicle-related taxes [
24], alongside volatile interest rates and restricted access to auto-financing, which are further constrained by a government-imposed financing cap of PKR 3 million. Compounding these challenges, over 70% of the market comprises 2–3 wheelers [
47], predominantly serving low-income consumers with limited purchasing capacity. Given that electric variants in this segment are two to three times more expensive than their ICE counterparts, affordability remains a critical barrier [
26]. Consequently, a top-down electrification strategy—prioritizing sedans and light commercial vehicles with higher-income consumer bases and a relatively modest 10% MSRP differential—may offer a more pragmatic and scalable pathway for adoption.
Ethiopia’s automotive sector, historically dominated by fossil-fuel-powered vehicles comprising 85% of the national fleet, has contributed significantly to the country’s ballooning oil import bill. In a landmark policy move, the Ethiopian government launched a phased transition in 2022, imposing a comprehensive ban on the import of internal combustion engine (ICE) vehicles—a bold and unprecedented regulatory stance [
50]. Reflecting Pakistan’s similarly low motorization rate of 1–2 vehicles per 100 individuals and parallel demographic characteristics, this decisive action is projected to reduce oil dependency by up to 40% by 2030, underscoring the compelling transformative potential for sustainable mobility in comparable economies.
5.2. Summary of Main Policy Recommendation
- -
Toll Tax: The toll tax exemption for eLCVs, though formally enacted, remains unimplemented. Indirect subsidization of toll tax for eLCVs can substantially elevate the economic appeal for this segment in Pakistan.
- -
Energy Tariff: Pakistan has the highest energy tariff per kilowatt in Asia, nearly equivalent to that of the EU. Concurrently, such elevated tariffs impose surplus charges exceeding 45%, significantly hindering the adoption of alternative powertrains.
- -
Infrastructure and Manufacturing: Grid modernization, the deployment of smart metering at EV charging points, perkWh tariff rebates, and localized battery manufacturing, particularly through strategic partnerships with Chinese firms and local private firms, could serve as a major catalyst for largescale market penetration, ultimately enhancing the economic feasibility of the electrification of the commercial segment.
- -
Financing Constraints: Restrictive autofinancing conditions, compounded by elevated interest rates, present a critical barrier to uptake. Reducing financing costs could substantially improve market accessibility and accelerate eLCV adoption trajectories.
5.3. Policy Recommendation for Italy
Considering the Italian automotive sector, the government’s interventional role is context-specific, based on the unique requirements of an intervention to foster a stable ecosystem towards carbon neutrality. The higher upfront acquisition cost of panel eLCVs in Italy is arguably the most critical factor dictating the overall economic viability of eLCVs relative to diesel equivalents. Such cost disparity mainly stems from elevated VAT and battery costs. Although Italian fleet operators are eligible for financial incentives, these vary profoundly across jurisdictions. Nevertheless, government interventions concerning minimizing the tariffs on the import of lithium-ion batteries can expedite the cost parity of eLCVs [
17]. Furthermore, the downward price trajectory of lithium-ion batteries can substantially bolster economic competitiveness; according to one estimate, the 100 EUR/kWh threshold exhibits promising potential in this regard.
Notably, tax waivers in restricted zones (clean transport zones), parking fees, and tolling tax relief for alternative powertrains considerably enhance their economic appeal by reducing the per-km cost [
22]. In Italy, the decision for fleet operators to opt for zero-emission vehicles is not immediately straightforward, primarily due to the strategic concerns associated with the substantial investment required for installing depot-based recharging stations. Although we adopted a conservative amortized cost estimate for infrastructure to develop a coherent baseline scenario, in reality, the costs can be substantially higher, necessitating subsidization schemes, particularly for fast charging units.
Aggressive carbon taxation on fossil-fuel-powered vehicles would significantly amplify the economic appeal of eLCVs in Italy. However, the practical implementation of such an ambitious fiscal measure faces considerable institutional and structural challenges. Despite this, the country’s phased rollout strategy remains a promising lever for advancing urban freight electrification.
5.4. Summary of Main Policy Recommendation
- -
Elevated MSRP: In Italy, the comparatively high MSRP of eLCVs remains a primary determinant of their TCO competitiveness relative to diesel counterparts. Such cost disparity is further exacerbated by elevated VAT rates (20%). While certain regional jurisdictions extend fiscal incentives to alternative powertrains, prevailing policy emphasis remains skewed towards operational cost relief. To enhance the economic viability of eLCVs, policy frameworks should prioritize capital expenditure incentives, targeting vehicle MSRP, VAT reductions, and charging equipment costs.
- -
Import Tariffs on LithiumIon Batteries: The imposition of import tariffs on lithiumion batteries significantly constrains cost parity attainment in Italy. Strategic tariff reductions could accelerate and expedite cost parity relative to diesel counterparts, leveraging the anticipated EUR 100/kWh battery price threshold as a pivotal benchmark for market competitiveness.
- -
Import Tariff: The impact of import tariffs is particularly pronounced for lithiumion batteries. Indirect incentivization of import tariffs can substantially expedite cost parity with diesel vehicles, capitalizing on the anticipated EUR 100/kWh battery cost threshold as a critical inflection point for competitiveness.
- -
Clean Transport Zones: In alignment with prevailing EU practices, the expansion of fiscal privileges, such as tax waivers, parking fee exemptions, and tolling relief for zeroemission vehicles, within clean transport zones could substantially reduce perkilometer operational expenditures and incentivize adoption [
10].
- -
Strategic Carbon Taxation: A phased introduction of robust carbon taxation on fossil fuelpowered vehicles could substantially enhance the relative economic appeal of eLCVs, reinforcing Italy’s broader carbonneutrality objectives.
5.5. Limitation of the Study
This study underscores several structural limitations in conducting comprehensive TCO assessments, primarily driven by data paucity, particularly in the context of Pakistan. Evidently, the scarcity of critical information persists in areas such as insurance premiums, infrastructure deployment costs, and appropriate quantification of residual value, due to nuanced market penetration. In contrast, for the Italian context, data gaps primarily pertain to depreciation rates and the salvage value of eLCVs. Accordingly, this study adopts a simplified valuation approach, applying a fixed percentage depreciation rate aligned with prevailing practices in the TCO literature, thereby ensuring methodological consistency while acknowledging the inherent uncertainty in long-term asset valuation.
The comparative TCO assessment across distinct powertrain technologies entails substantial methodological challenges and is intrinsically constrained by several limitations. Fuel efficiency is markedly contingent upon operational conditions, with pronounced sensitivity to topographical variations such as inclines and declines. Another significant simplification concerns the cost of electricity, which is inherently dynamic, fluctuating with peak and off-peak tariff structures.
Furthermore, the lack of longitudinal and market-level data for eLCVs operating in urban logistics environments significantly constrains model calibration, which is largely attributed to pilot-phase deployments and niche adoption. Beyond methodological constraints, substantial asymmetry in data availability exists between the two focal case countries: while Italian governmental platforms furnish comprehensive and contemporaneous datasets, Pakistan lacks a centralized and transparent data repository. To mitigate this asymmetry, the present study adopts a bottom-up estimation framework approach for key cost determinants, predominantly drawing upon the grey literature and sectoral industry reports. Meager coverage of the scholarly body with respect to indirect cost vectors, including labor cost, operational time, and other implicit costs, further impedes holistic and robust TCO estimation for eLCVs.
To improve the fidelity of future TCO estimates, it is desirable for future studies to incorporate rigorous quantification of these implicit cost domains alongside a broader synthesis of the financial externalities and return-on-adoption trajectories associated with eLCVs. In this regard, the present study lays a foundational framework and invites the academic community in Pakistan to expand and refine the methodological architecture of TCO analysis for alternative powertrains.

