Abstract
As road transport continues to evolve with advancements in automation and intelligent traffic management, optimizing emergency response operations remains a critical challenge in urban mobility. This study presents an innovative data-driven framework for optimizing fire station placement in Birjand, Iran, integrating transportation efficiency with emergency service accessibility. A binary integer programming model was developed to minimize response time and transportation costs while incorporating real-world constraints. Using dynamic simulations in MATLAB 2019b, the study analyzed existing fire station coverage across seven urban regions, assessing travel efficiency based on an average vehicle speed of 52.5 km/h and a 5 min response threshold. Key findings highlight disparities in emergency service accessibility, with high-demand areas such as R4 and R5 lacking sufficient coverage, while low-demand regions like R6 remain underserved. To address this, a genetic algorithm (GA) with 100 individuals over 20 generations was implemented. Optimizing total penalized response time, calculated as the objective value of GA, is 25.89 min. This value represents the sum of penalized response times across all station-area assignments. A cost–benefit analysis revealed Station 2 as the most efficient investment, achieving a net benefit of 3163 million IRR at a 1% discount rate, outperforming Station 1 (2831 million IRR). Sensitivity analysis confirmed Station 2’s financial advantage across discount rates up to 10%. This research contributes to emerging transportation challenges by bridging emergency response optimization with urban mobility strategies. The proposed decision support system (DSS) integrates adaptive planning, data-driven analytics, and infrastructure investment to enhance resilience and response efficiency in dynamic urban environments.
1. Introduction
Every day, many people are exposed to accidents and natural disasters. In urban life, the likelihood of such incidents is even higher, including fires, electric shocks, and similar emergencies [1]. One of the primary considerations for saving lives is the efficient dispatch of emergency response teams [2]. Today, fire departments are responsible for rescue operations, which typically follow a structured process from incident notification to emergency response: Incident reporting, Assessment of incident severity, Dispatch of emergency vehicles, and Rescue operations [3]. The importance of accelerating fire service management in urban environments to increase sustainability represented in Figure 1C [4] (United States) and Figure 1D (Japan) both show a steady and significant decline in reported fire incidents over time—from over 2000 fires in the U.S. in 1990 to approximately 1300 in 2020, and from 48.1 fire outbreaks in Japan in 2013 to around 35 in 2022. This consistent downward trend suggests the positive impact of long-term investments in fire safety policies, public education campaigns, stricter building codes, and technological improvements such as smoke detectors, automated sprinkler systems, and the use of fire-resistant construction materials. It also reflects the success of data-driven fire prevention strategies and emergency preparedness efforts in both countries, aligning with SDG 11 (Sustainable Cities and Communities) and SDG 13 (Climate Action) by reducing risks to people, property, and the environment. Figure 1A presents the number of fire departments in Germany from 2000 to 2022, which remains relatively stable over time, fluctuating around 42,000–44,000, with a noticeable increase in recent years, reaching over 48,000 in 2022. This uptick may indicate renewed investment in fire service infrastructure, possibly in response to urban expansion or increased awareness of disaster preparedness needs. Maintaining and expanding fire service capacity—especially in urban and peri-urban areas—is essential for ensuring equitable emergency response coverage, faster reaction times, and resilience in the face of climate-related hazards such as heatwaves or wildfires. It also supports sustainable infrastructure goals by reinforcing public safety systems. Figure 1B categorizes structure fires in the U.S. by property type in 2021, showing that one- and two-family homes had the highest number of structure fires (256,500), followed by non-residential structures (125,500). This indicates that residential areas remain highly vulnerable, especially in suburban and low-density housing zones. Targeted fire prevention strategies—such as retrofitting homes, enforcing residential building standards, and enhancing community awareness—are needed to reduce these risks. Preventing residential fires not only protects lives and property but also reduces carbon emissions and toxic pollutants released during fires, supporting environmental sustainability. In the field of traffic management, mathematical models are used to analyze the dispatch process and the sequence of events leading to emergency response [5]. For example, this study presents the design and implementation of an intelligent traffic management system for an isolated intersection using an FPGA-based central unit integrated with an ESP8266 Wi-Fi module to record real-time traffic data and allocate green time across three operational modes—fixed time, sensor-actuated, and remote control via a cloud-based application—demonstrating through simulation its effectiveness in reducing congestion and waiting time while improving traffic throughput and safety [6]. Another study also addresses rapid urban population growth and infrastructure challenges in developing countries by exploring the feasibility of advanced artificial intelligence techniques for automated traffic enforcement to better manage densely populated but poorly regulated cities [7]. Typically, emergency services are contacted via a three-digit emergency number, and response time is a key performance metric [8]. This response time is standardized separately for urban and rural areas, measuring the duration from dispatch to arrival at the scene [9]. Time is the most critical factor in emergency incidents. Under crisis conditions, excessive delays can lead to severe casualties and financial losses [10]. For example, the effects of COVID-19-related social isolation in Argentina are analyzed, showing that decreased urban mobility and vehicular traffic in La Plata can extend pavement service life and allow deferral of road maintenance, with a methodology based on Google activity data that is adaptable to other regions [11]. Another paper used Delay Tolerant Networks (DTNs) to alleviate traffic load in congested or infrastructure-limited environments, comparing DTN routing protocols under realistic mobility scenarios and identifying the epidemic protocol as most effective for dense deployments [12]. Therefore, the strategic location of emergency response centers should ensure minimal travel time to incident sites. A distinctive feature of this research is that, in addition to the simplicity and practical applicability of the proposed model for fire departments, it also aims to achieve cost optimization in emergency response operations and demonstrates promising simulation results for future intelligent traffic applications [13].
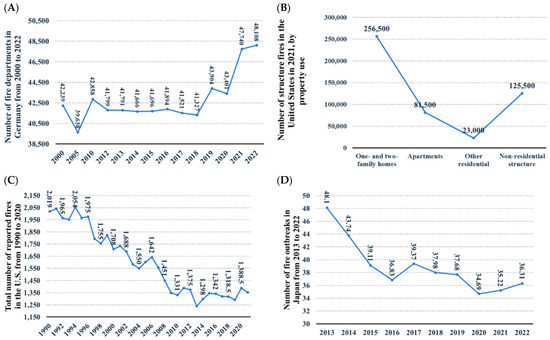
Figure 1.
Fire incidents and fire department statistics across different countries: (A) Number of fire departments in Germany from 2000 to 2022, (B) Number of structure fires in the United States in 2021, by property use, (C) Total number of reported fires in US from 1990 to 2020 and (D) Number of fire outbreaks in Japan from 2013 to 2022.
2. Problem Statement
When developing a location model for fire stations, it is essential to consider various constraints, such as time and available resources. Consequently, the modeling approach should aim for maximum area coverage. In this study, the proposed models are categorized into two types: mandatory coverage and non-mandatory coverage. Mandatory coverage models assume that all service facilities are fully operational, enabling emergency responses to be carried out with 100% of the station’s capacity. Conversely, non-mandatory coverage models account for scenarios where previous demand, resource limitations, simultaneous operations, or equipment failures may impede immediate firefighting or rescue responses. Both models are based on static frameworks that focus on determining optimal locations for emergency stations and the allocation of firefighting vehicles. These approaches align with established methodologies in emergency service facility location planning, such as the Location Set Covering Problem (LSCP) and the Maximal Covering Location Problem (MCLP), which have been widely applied in optimizing fire station placements to ensure adequate coverage under varying operational conditions [14]. However, a dynamic (real-time) model incorporates temporal variability, meaning it considers real-time service provision based on specific situations. A key objective of the dynamic model is optimizing the distance traveled to the emergency site [15]. Several location models have been proposed in the past. Notably, the Maximum Coverage Location Problem (MCLP) model was introduced in 1985 by Austin, Eaton, and colleagues, while the Maximum Expected Coverage Location Problem (MEXCLP) model was proposed in 1987 by Fujiwara and colleagues in Bangkok [16]. Other studies have explored GIS-based approaches for industrial park site selection, integrating fuzzy models, indicator weights, and genetic algorithms with remote sensing techniques. Additionally, specialized location models, such as an innovative method for optimizing super-distribution and distribution centers, have been developed [17]. These models leverage programming techniques using Lingo software (V20) and genetic algorithms to optimize time and maximize service quality. The following are key parameters in the Developed Model [18]: Considering the capacity of firefighting vehicles, Evaluating the coverage of each area by a single fire truck, Balancing supply and demand for emergency services (matching regional needs with available resources), Accounting for the unavailability of firefighting vehicles at all hours of the day, Ensuring 95% demand coverage based on standard response times, Allocating the number of stations based on the number of regions, and Minimizing the response time to the affected area (t). Ideally, each area should be covered by a single station.
3. Mathematical Modeling
In this study, a location-allocation model for fire stations is formulated as a binary integer programming problem (akin to a Boolean logic model). This model involves assigning n fire stations to m designated regions within the city of Birjand. Currently, Birjand has five fire stations covering a vast number of neighborhoods, yet the city’s resources are limited. Given these constraints, we analyze two key parameters: First, identifying areas where new fire stations should be established. Second, determining locations that lack fire stations and must be covered by existing ones. The objective of this model is to minimize the total response time to fire incidents, assuming that, on average, a fire occurs in each designated area. The decision variables in this optimization problem are binary (0–1) and fall into two main categories to represent the placement of fire stations (Equation (1)).
The second set of variables indicates which neighborhood without a station is covered by each covered neighborhood (Equation (1)).
Modeling limitations (Equations (3) and (4)):
The combination constraint shows the dependence of on , so we have (Equation (5)): Each active station can serve a maximum of 5 regions, from area 1 to 7, defined as:
4. Economic Model Analysis
Optimizing transportation efficiency in this approach not only enhances emergency response times but also reduces transportation costs and vehicle depreciation. The problem can be formulated as follows: The fire department operates m emergency response stations that conduct n rescue operations per week across the city. The transportation cost from fire station i to region j is denoted as , while the capacity of fire trucks at station i is represented by ai. The goal is to determine the amount of emergency transportation, , from station i to region j, where
i ∈ L = {1, 2, 3, 4, 5}: set of station location;
j ∈A = {1, 2, 3, 4, 5, 6, 7}: set of regions.
To achieve this, a cost minimization model is developed using the simplex method to optimize transportation expenses (Equation (6)). The total transportation cost from station i to region j is calculated based on two key parameters: fuel consumption and vehicle depreciation.
5. Data Preparation for Firefighting Emergency Response Location Model
To effectively utilize the firefighting emergency response location model, specific data and information must be collected from multiple sources. These include demand levels in different areas—reflecting the frequency and distribution of emergency incidents—response times, which measure the duration for emergency vehicles to reach incident sites, and the service unavailability rate, indicating the percentage of cases where emergency services were not deployed due to vehicle malfunction or excessive demand. Relevant data were obtained from two primary sources: the Fire Department and the Urban Transportation and Traffic Organization. The Urban Transportation and Traffic Organization provides data categorized according to traffic zones, encompassing traffic flow and congestion patterns. In contrast, the Fire Department organizes its data based on the distribution of its fire stations, reflecting operational jurisdictions. Because these spatial classifications differ, direct aggregation of the datasets was not possible. To reconcile this, we mapped traffic zones to fire station service areas using geographic overlap and proximity analysis. Data were then proportionally allocated through area-weighted averaging, allowing consistent integration of traffic and emergency response information within the model. While various methods such as linear regression analysis can be employed to link socio-economic factors to regional demand levels, such approaches are beyond the scope of this study which focuses primarily on the application of the proposed mathematical model for resource allocation.
In the studied city, there are five fire stations, each operating an average of three fire trucks. Figure 2 illustrates the distribution of fire stations, their respective coverage areas, and regional demand patterns. Figure 3 shows the comparison of the facilities of Birjand city stations according to Table 1.
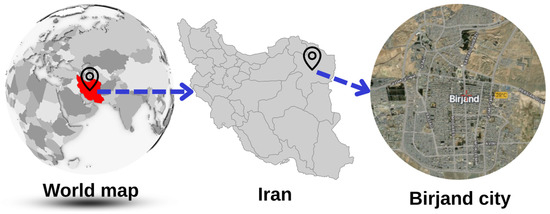
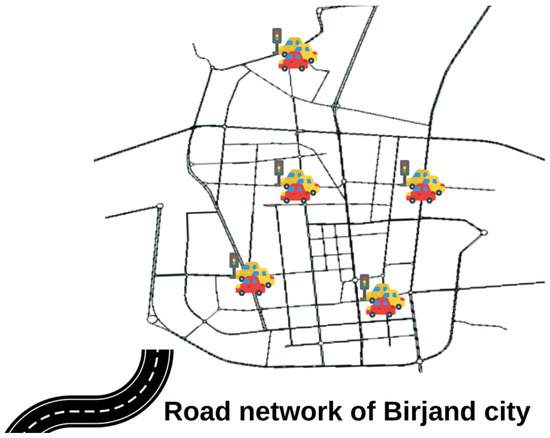
Figure 2.
Division of Birjand’s fire zones.
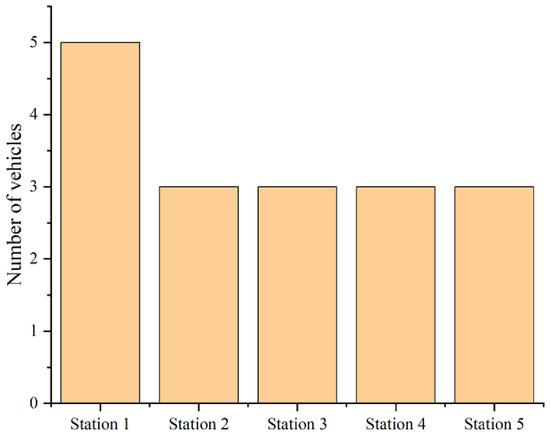
Figure 3.
Comparison of the facilities of Birjand city stations.

Table 1.
Comparison of facilities of Birjand city stations.
Based on reports provided by the Birjand Fire Department, the weekly demand for emergency response has been recorded over a randomly selected period from 1 November 2013, to 7 November 2013. The data is presented in Figure 4.
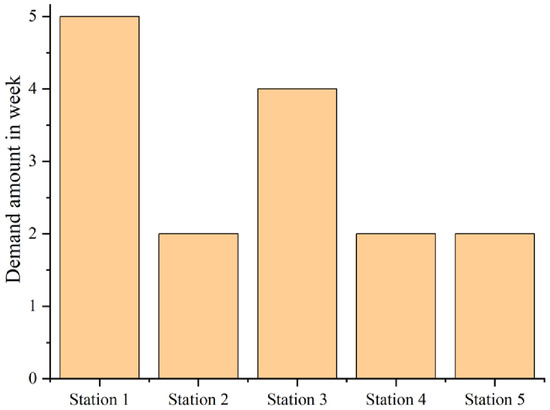
Figure 4.
Comparison of public demand for firefighting over one week.
To analyze temporal concentration parameters over the specified one-week period, the demand time intervals have been categorized into the following three time slots, as presented in Figure 5.
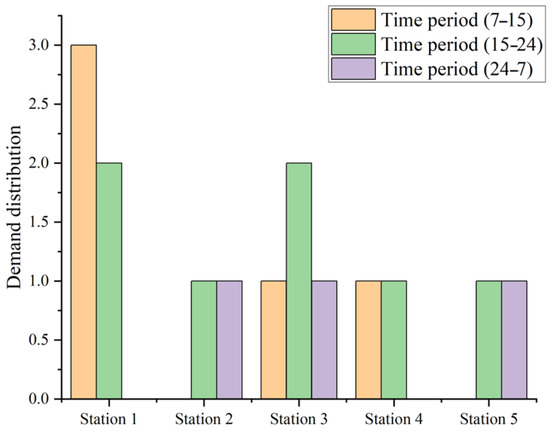
Figure 5.
Comparison of demand distribution in three time slots.
Although no instances of service unavailability due to vehicle malfunction or parallel operations were recorded in Birjand over a seven-year period, we recognize that such performance is uncommon across broader urban fleet systems. Therefore, to enhance the robustness and generalizability of our model, we introduce a small positive unavailability rate (k) in our analysis to reflect potential downtimes consistent with industry norms. The service unavailability rate is defined by the following equation (Equation (7)) [19]:
where
n = Number of fire trucks;
t = Duration of the sample period;
T = Total time of unavailability during the period.
6. Average Coverage Time
The coverage time refers to the time required for fire trucks to reach the incident site. It varies based on population density and urban layout. In Birjand, based on geospatial distribution and protective zones of fire stations, the average coverage time is between 3 and 5 min.
A review of historical incident data from the Birjand Fire Department found that all recorded response times fell within standard limits. However, it is important to note that two new urban developments—Mehrshahr and the Administrative Site—have not yet been fully operational.
The proposed fire station location model assumes these two new areas will become fully functional and experience significant population concentration. In this scenario, the existing five fire stations may face resource constraints. To analyze this resource allocation problem, the Simplex method is applied using GAMS software (V47) to determine the optimal fire station placement in Birjand under these constraints. The proposed fire station location model is as follows (Equation (8)):
Using the following model, the generalized fire station location model can be formulated to determine the optimal placement of m stations in n districts (where m ≤ n) in order to minimize the total service time. The objective is to reduce the cumulative service time (), which represents the response time from station i to district j. The model can be rewritten as follows (Equation (9)):
To address the problem effectively, it is first necessary to determine the coverage timetable and the cost table based on the specified parameters. These tables are then analyzed using two separate Simplex optimizations [20]. Considering average speed variations under both light and heavy traffic conditions, the following Table 2 has been generated based on statistical analysis, simulations, and calculations:

Table 2.
Average speed of fire truck types with traffic conditions in the target area.
Figure 6 presents the travel time matrix , where each element represents the estimated travel time from station i to area j, based on GIS-derived routing under typical traffic conditions. This matrix is a fundamental input to the service assignment model, as it quantifies the accessibility of each area from potential station locations. As illustrated in the Figure, Station 2 exhibits the highest travel time to Area 6 among all station-area pairs. This suggests that assigning Area 6 to Station 2 may lead to delays in emergency response, highlighting a potential inefficiency in direct service coverage. Such disparities in travel times are critical to consider when optimizing station placement and resource allocation, as they directly influence the overall responsiveness and equity of the emergency service system. The travel times in the Figure are expressed in minutes and were computed using real-world road network data, factoring in average traffic conditions. The color-coded bars represent the seven different areas served, allowing for a visual comparison of each station’s reachability across all service regions.
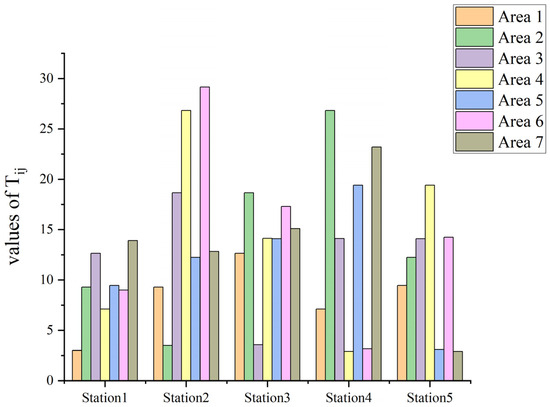
Figure 6.
Time cost matrix values representing the estimated response time (in minutes) from Station i to Area j based on traffic-adjusted GIS routing. The x-axis lists candidate station locations (Stations 1–5), and the y-axis indicates travel times to Areas 1–7 (color-coded in the legend). These values were used as input parameters in the optimization model.
Figure 7 provides a detailed representation of the transportation costs associated with light vehicles across various stations under typical traffic conditions. The data clearly indicate that Station 2 incurs the highest transportation cost when traveling to Area 6, highlighting a significant cost disparity compared to other station-area combinations. Conversely, the transportation costs to Area 4 from Station 4 and to Area 7 from Station 5 are among the lowest observed in the analysis. This contrast suggests that certain station-area routes are considerably more cost-efficient, potentially due to factors such as shorter distances, better road conditions, or less congestion.
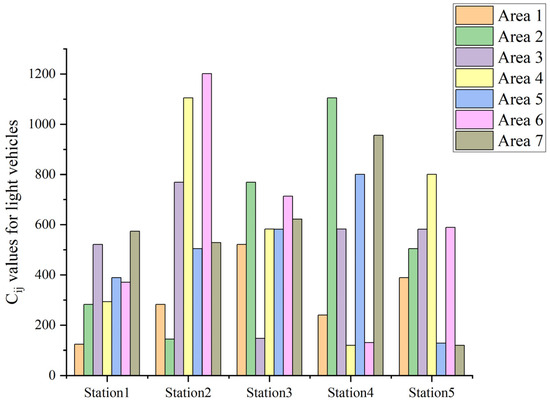
Figure 7.
The transportation cost (Cij) values (million IRR) for light vehicles across five different stations, with each station further divided into seven areas. The bars are color-coded to differentiate areas, allowing easy comparison of values. The y-axis spans from 0 to 1200, providing a quantitative representation of the Cij values. This visualization facilitates an understanding of spatial variations across different locations.
Figure 8 presents the transportation costs for heavy vehicles across the same set of stations under typical traffic conditions. The results closely mirror those observed for light vehicles in Figure 7. Specifically, Station 2 again shows the highest transportation cost to Area 6, indicating a consistent cost burden for this route regardless of vehicle type. In contrast, the lowest transportation costs for heavy vehicles are recorded for the routes from Station 4 to Area 4 and from Station 5 to Area 7. This consistency across vehicle categories underscores the influence of spatial and traffic-related factors on transportation efficiency and cost structure.
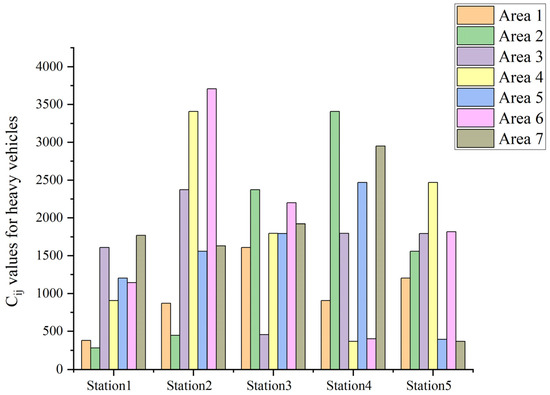
Figure 8.
The transportation cost (Cij) values (million IRR) for heavy vehicles across five stations, labeled Station1 through Station5. Each station contains seven bars, representing distinct areas (Area 1 to Area 7), with each area color-coded to enable quick visual comparison. The y-axis ranges from 0 to 4000, providing a numerical representation of the Cij values.
By solving the first Simplex model, valuable insights can be gained from a managerial perspective, particularly regarding key decision-making parameters such as optimal station locations, economic efficiency, and minimization of response time delays. The first Simplex solution indicates that, The Administrative Site should be covered by Station 5, among its two neighboring stations (Stations 2 and 5), and The Mehrshahr area should be covered by Station 4, among its two neighboring stations (Stations 4 and 5). The second Simplex model, focusing on cost optimization, determines the maximum travel distance required for light and heavy firefighting vehicles to minimize total operational costs. These results provide a strategic framework for optimizing fire station placement and resource allocation, ensuring effective emergency response while keeping costs at an optimal level.
7. Dynamic Traffic-Based Response Time Simulation
The primary objective of this MATLAB (2019b) program is to simulate and visualize the response time of fire stations to various regions under different traffic conditions and vehicle types (all codes are available in the public GitHub respiratory at: https://github.com/Reezaam/FT_Paper accessed on 10 August 2025). By calculating travel times based on distance and speed variations due to traffic (light, average, and heavy) and vehicle class (heavy and light vehicles), the program generates comparative heatmaps that help in evaluating the operational readiness and efficiency of each station. This simulation can assist decision-makers in emergency response planning, resource allocation, and optimize the deployment of firefighting units. The numerical hypothesis of the simulation is that response time (T) is directly proportional to distance (D) and inversely proportional to vehicle speed (V), where speed varies by traffic condition and vehicle type. Mathematically, this is expressed as (Equation (10)):
with V in km/min, where
T = D/V
D is the distance matrix (km);
V is traffic- and vehicle-dependent speed (km/h ÷ 60).
This relationship quantifies how traffic impacts emergency response efficiency.
Figure 9a–f presents a series of heatmaps that illustrate the simulated response times (in minutes) from five fire stations (S1 to S5) to seven regions (R1 to R7) under varying traffic conditions and for two types of vehicles: heavy and light. Each subplot corresponds to a unique combination of vehicle type and traffic scenario—light, average, and heavy—providing a comprehensive view of how these factors influence emergency response efficiency. Figure 9a–c show the response times for heavy vehicles. In Figure 9a, under light traffic, response times are the longest overall, especially toward distant regions such as R6 and R5. Times range from approximately 3 to over 11 min, highlighting that although traffic is light, heavy vehicles inherently move slower, making travel times relatively high. In Figure 9b, with average traffic, speeds improve, reducing the upper limit of response times to around 8 min. In Figure 9c, during heavy traffic, although traffic rule exemptions (such as exceeding speed limits and bypassing red lights) can significantly reduce emergency response times—by up to approximately 14 min—and systems like Emergency Vehicle Priority (EVP) help vehicles navigate traffic more efficiently [21,22,23], these measures are designed to mitigate the effects of congestion rather than benefit from it. In fact, traffic congestion remains a significant obstacle to timely emergency responses. Figure 9d–f represent response times for light vehicles. Figure 9d under light traffic shows quicker responses than heavy vehicles, with times mostly between 3 and 9 min. In Figure 9e, during average traffic, response times further improve due to higher operational speeds, clustering between 2 and 7 min. Figure 9f, under heavy traffic, displays the fastest overall responses among all scenarios, with most times between 2 and 6 min, indicating the advantage of lighter, more maneuverable vehicles in congested conditions. Overall, the heatmaps visually confirm the simulation hypothesis: as vehicle speed increases (whether due to vehicle type or favorable traffic), response times decrease, enhancing emergency responsiveness. The results emphasize the critical influence of traffic dynamics and vehicle selection on urban emergency service performance.
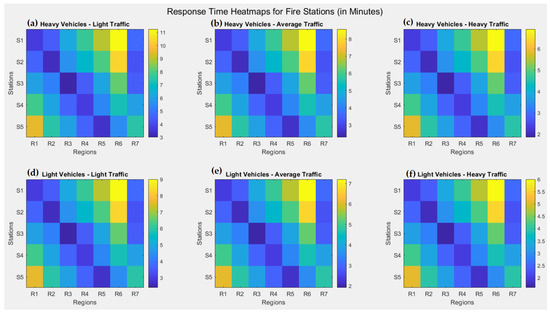
Figure 9.
Heatmaps of fire station response times (in minutes) from stations S1–S5 to regions R1–R7 under varying traffic conditions and vehicle types: (a–c) heavy vehicles; and (d–f) light vehicles in light, average, and heavy traffic, respectively.
The composite illustration in Figure 10a–k presents a comprehensive simulation-based analysis of response times for emergency and general vehicles under varying traffic densities, highlighting traffic engineering principles relevant to urban emergency planning. In Figure 10a, the speed-density relationship derived from Greenshields’ theory [24] is plotted, showing a clear inverse relationship: as traffic density increases, average speed decreases. Emergency vehicles, however, consistently maintain higher speeds than general traffic, especially under moderate (average) traffic conditions. This relative advantage is quantified in Figure 10b, where emergency vehicles outperform general vehicles by the largest margin under average traffic—approximately 25%—due to legal privileges (e.g., sirens, red-light passage, and traffic prioritization protocols). This benefit diminishes in light traffic (where all vehicles move fast) and also slightly narrows under heavy congestion. The core of the Figure (Figure 10c–h) consists of heatmaps showing simulated response times (in minutes) from five fire stations (S1–S5) to seven regions (R1–R7) for both emergency and general vehicles across light, average, and heavy traffic conditions. Figure 10c–e represent emergency vehicles, while Figure 10f–h show general vehicle response times. Notably, under heavy traffic (Figure 10e,h), response times increase significantly, yet emergency vehicles still manage shorter times due to their traffic priority status. For instance, emergency times to R6 from S2 rise to 10.3 min (Figure 10e), while general traffic under the same conditions exceeds 11 min (Figure 10h). Conversely, under light traffic (Figure 10c,f), all response times are reduced, reflecting optimal mobility conditions, with emergency vehicles outperforming general traffic across all regions. Supporting analyses in Figure 10i–k reinforce these insights. Figure 10i correlates average response time with traffic density for both vehicle categories, confirming that emergency vehicles retain a lower response time trajectory despite rising density. Figure 10j assesses each station’s average performance under different traffic conditions, with Station 1 consistently showing the fastest responses. Figure 10k presents the best response times by region, revealing disparities such as R6 experiencing significantly higher times, particularly under heavy traffic. The accompanying summary reaffirms key traffic engineering takeaways: emergency vehicles retain speed advantages due to protocol exemptions, yet mobility declines under heavy congestion—a trend aligned with empirical traffic behavior and Greenshields’ model. Thus, the simulation does not claim that emergency vehicles travel fastest under heavy traffic, but rather that their comparative advantage is preserved or slightly enhanced due to their ability to bypass restrictions faced by general vehicles.
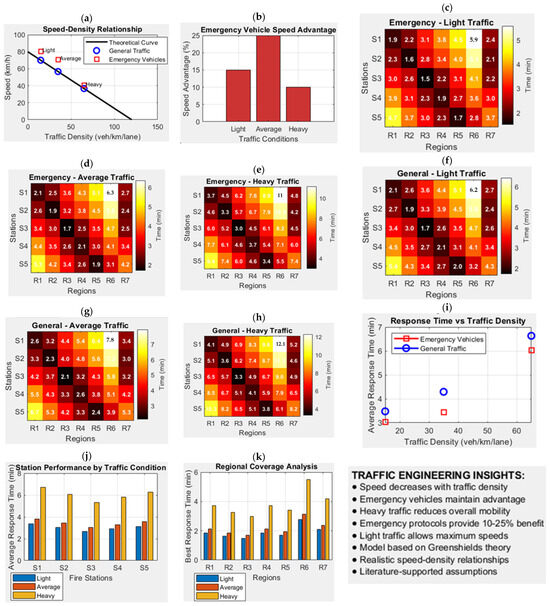
Figure 10.
Fire station response simulation: (a) Greenshields’ speed-density curve, (b) emergency speed advantage, (c–e) emergency response heatmaps, (f–h) general traffic heatmaps, (i) response time vs. density, (j) station, and (k) regional performance.
8. Heatmap Visualization of Demand and Coverage
In this section of the present research, a MATLAB 2019b simulation is conducted to evaluate emergency response coverage in Birjand. Using fixed average speed (52.5 km/h) and regional distance data, response times from five stations to seven regions are calculated. Based on a one-week demand window and a 5 min response threshold, the model visualizes demand distribution and coverage efficiency through heatmaps to support strategic fire station placement.
In the following section, Figure 11a,b provides an insightful comparison between the weekly emergency demand and the corresponding coverage efficiency for each of the seven studied regions. As observed in Figure 11a, Region R4 records the highest weekly emergency demand with 40 incidents, followed by R2 (35), R5 (30), and R7 (28). Conversely, Region R6 shows the lowest demand with only 15 calls. Notably, R3 and R1 also show significant demand levels at 25 and 20, respectively. However, when juxtaposed with coverage efficiency in Figure 11b, a critical disparity emerges. Although R4 and R5 are among the highest in demand, their coverage efficiency is only moderate, with each being accessible by just three stations within the acceptable 5 min threshold. R6, while having the lowest demand, suffers from the poorest coverage—only one station can reach it in time, indicating a potential service gap that may compromise life-saving interventions. On the other hand, R3, despite having a moderate demand of 25 calls, enjoys the highest coverage with five stations responding within the time limit, possibly indicating redundancy or inefficient resource allocation. Similarly, R7, with high demand, benefits from strong coverage (four stations), while R1, with moderate demand, is covered by only three. These inconsistencies reflect a suboptimal alignment between demand and coverage efficiency. The data suggest an urgent need for strategic reallocation or expansion of station coverage, particularly in high-demand yet under-covered zones like R4 and R5, and critically underserved areas like R6. Beyond technical efficiency, the spatial distribution of fire station coverage raises important ethical and equity concerns. While Region R6 recorded the lowest emergency call volume (15 calls) during the evaluation period, it also suffered from the most limited coverage, with only one station able to respond within the acceptable 5 min threshold. This makes R6 the most underserved area in the network, posing a critical risk to life-saving interventions in the event of an emergency. Although emergency response planning often prioritizes high-demand zones to maximize efficiency, doing so without considering baseline access equity can lead to systemic service gaps. Low demand in R6 may reflect factors such as underreporting, lack of trust in public services, or demographic characteristics (e.g., older populations or low-income households) that reduce emergency call rates—not necessarily a lower need for timely intervention. The presence of only one responding station thus reflects not just a service shortfall, but a potential structural inequity in public resource allocation. In contrast, Region R3—with a moderate demand of 25 calls—is covered by five stations, indicating possible redundancy or inefficiency in resource deployment. Such imbalances highlight the importance of not only matching resources to demand but also ensuring that every region meets a minimum standard of emergency access, regardless of call volume. To address this, a more equity-aware planning framework is needed—one that balances efficiency with spatial justice. This may involve adjusting coverage thresholds to guarantee baseline response times across all regions, particularly for structurally underserved areas like R6. While this could result in slightly lower efficiency metrics system-wide, it enhances the fairness and ethical legitimacy of the emergency services network, aligning with principles of universal access and public safety as a civic right. This expanded analysis emphasizes that fire station siting is not merely a logistical problem, but also a question of social responsibility. Future planning tools should therefore integrate equity indicators alongside demand and coverage efficiency, ensuring that vulnerable communities are not left behind in infrastructure decisions.
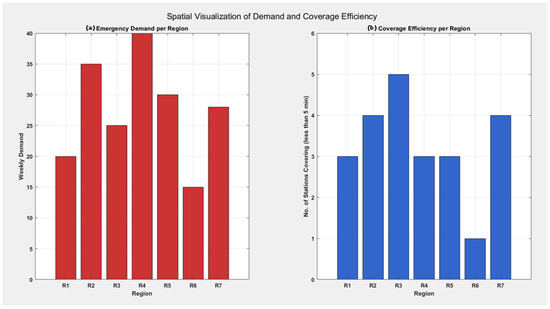
Figure 11.
Comparison of weekly emergency demand per region (a) emergency demand per region and (b) coverage efficiency per region within 5 min.
The simulation reveals a mismatch between demand and coverage. Despite R4 and R5 showing high emergency demand, they lack sufficient station coverage (3 each), while R6, with lowest demand, has critically poor coverage (1). R3, moderately demanded, is over-covered (5), indicating inefficiencies needing strategic reallocation. To support a more holistic emergency planning approach, several practical interventions can be considered for structurally underserved regions such as R6. First, adopting an equity-weighted station allocation model—which prioritizes regions not solely based on call volume but also on social vulnerability indicators (e.g., income levels, population age structure, and healthcare access)—can help redress systemic service gaps. Additionally, mobile or satellite response units could be deployed in low-demand but high-risk zones to ensure baseline coverage without requiring full station infrastructure. Policymakers might also explore dynamic coverage strategies, such as real-time vehicle repositioning during peak periods, to flexibly enhance responsiveness in underserved areas. Lastly, integrating community engagement efforts in R6 to improve reporting and trust in emergency services may help address underreporting and ensure more accurate demand estimation. These interventions would not only enhance system equity but also uphold public safety as a universal right.
9. Multi-Scenario Optimization Using Genetic Algorithms
The MATLAB 2019b code is designed to simulate and optimize the dynamic allocation of five existing fire stations to seven urban regions in Birjand, aiming to minimize total emergency response time. It implements a binary genetic algorithm (GA) to solve a location-allocation problem under varying conditions of accessibility and vehicle readiness. Core assumptions include fixed average vehicle speed (52.5 km/h), with real-time disruptions modeled through a dynamic penalty matrix reflecting road issues and station-specific operational challenges. Each station-region pair has a base response time, modified by random penalties to simulate uncertainties such as traffic or equipment issues. The optimization ensures each region is covered by at least one station, reflecting the model’s non-mandatory coverage philosophy, aligned with real urban conditions. The simulation assumes proportionality between response time, distance, and inverse of speed, following T = D/V. Visual outputs, including assignment matrices and fitness distributions, provide insights into strategic station deployment and highlight inefficiencies. This model supports decision-making in urban emergency planning by introducing flexibility and stochastic elements often overlooked in static models and aligns with the dynamic coverage framework outlined in the manuscript’s methodology. The model considers the sets of stations S = {S1, S2, S3, S4, S5} and regions R = {R1, R2, R3, R4, R5, R6, R7}, forming a binary decision matrix of size 5 × 7, resulting in 35 variables. Each variable represents whether a specific station is assigned to serve a particular region. The model utilizes a distance matrix D, derived from the manuscript, to calculate a base response time matrix by dividing each distance value by the fixed average vehicle speed of 52.5 km/h (equivalent to 0.875 km/min). To reflect real-world complexities, a dynamic penalty matrix is applied: S1→R6 is subject to a random penalty factor between 1 and 5 due to assumed road conditions, while station S5 faces randomized penalties across all regions due to potential vehicle malfunctions. Additionally, a small random noise (0.1 × rand) is added to introduce variability and avoid deterministic bias. The penalized response time, defined as the cost matrix, is computed by multiplying the base response time by the penalty factors. The objective function minimizes the total penalized response time across all assignments. Constraints ensure that each region is covered by at least one station. The GA parameters include a population size of 100, a maximum of 20 generations, and a binary configuration for all variables. The model assumes a zero vehicle unavailability rate, based on historical service records, and considers that regions may be covered by multiple stations while prioritizing minimum cost. Overall, this simulation integrates both static geographic data and dynamic operational scenarios, offering a realistic, adaptive framework for strategic fire station deployment aligned with the city’s emergency response planning needs.
The outputs of the MATLAB-based GA simulation reflect the convergence behavior and solution diversity in the dynamic fire station allocation model for Birjand. These simulation provide valuable insights into the optimization process under the constraints and assumptions embedded in the program. Figure 12a illustrates the evolution of the best and mean penalty values across 20 generations. The best penalty value—representing the minimum total penalized response time achieved in each generation—begins around 65 and progressively improves, reaching 25.8857 by the final generation. Simultaneously, the mean penalty value across the population decreases steadily from above 120 to 33.1797, indicating a general improvement in the population’s overall fitness. This decline reflects the GA’s capacity to efficiently explore and exploit the solution space through mechanisms such as selection, crossover, and mutation. The narrowing gap between the best and mean values by later generations suggests successful convergence toward an optimal or near-optimal solution. Importantly, this behavior signifies that the GA avoided premature convergence and maintained diversity long enough to achieve meaningful optimization. Figure 12b shows the penalty values of each individual in the final generation. The values range from approximately 25 to 45, with a dense clustering between 30 and 40. This distribution highlights a relatively homogeneous population, indicating that most individuals in the final generation are of acceptable quality and relatively close to the optimal solution. However, the presence of a few individuals with lower penalty values (near 25) underscores the stochastic strength of the algorithm in retaining high-performing solutions while exploring neighboring configurations.
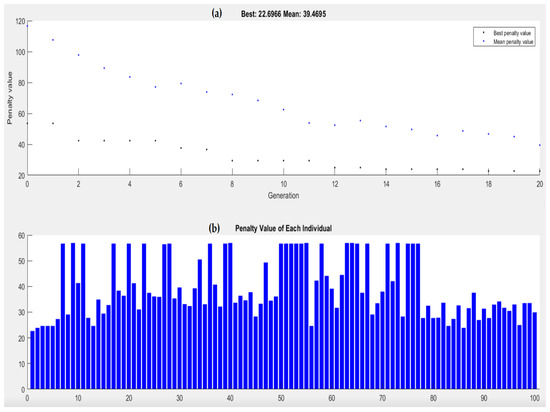
Figure 12.
The outcomes of GA model based on (a) convergence of the GA and mean penalty values over 20 generations; and (b) distribution of penalty values among 100 individuals in the final generation.
Figure 13 illustrates the fitness score distribution of the final population in the GA model, representing the total penalized response time (cost) in minutes for each individual solution. The histogram reveals that the majority of individuals—approximately 38% of the population—are clustered around the 32 min mark, indicating that this value is the most common optimized outcome achieved through evolutionary iterations. A narrower grouping between 30 and 34 min reflects a focused convergence toward optimal solutions, while a few outliers extend to higher cost values up to 41 min and lower values down to 25.9 min, showcasing retained diversity in the final generation.
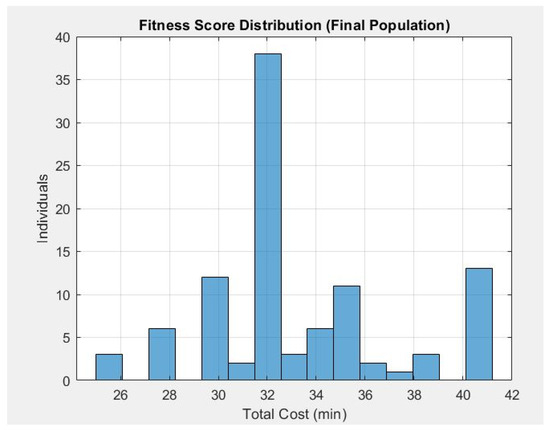
Figure 13.
The results of fitness score distribution through the GA model in final population.
This distribution pattern indicates that while the GA successfully concentrated its search around a highly efficient cost zone, it also preserved exploration capabilities by maintaining individuals with both lower and higher costs. The presence of elite individuals with near-minimum cost values (e.g., below 28 min) confirms the effectiveness of the selection and crossover strategies used. Meanwhile, the small peaks at the tails of the distribution suggest opportunities for further refinement or hybridization with local search methods. Overall, the Figure validates the algorithm’s success in generating a balanced final population with a high concentration of near-optimal solutions while avoiding premature convergence. Figure 14 presents the final station-to-region assignment matrix derived from the Genetic Algorithm (GA) model, optimized under dynamic and smart penalty conditions. The matrix is a binary heatmap where rows represent fire stations (S1–S5) and columns represent regions (R1–R7), with cells showing a value of 1 indicating that a station is assigned to cover the corresponding region.
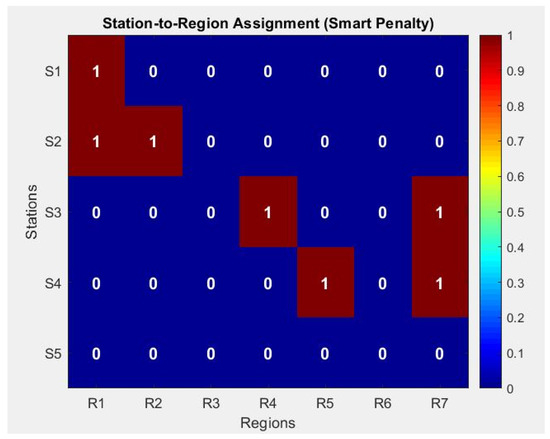
Figure 14.
Final station-to-region assignment matrix using smart penalties, showing optimal coverage with minimized response time and strategic redundancy.
From the Figure, it is evident that:
- S1 is assigned to R1;
- S2 covers both R1 and R2;
- S3 serves R4 and R7;
- S4 is responsible for R5 and R7;
- S5 is not assigned to any region in the final configuration.
This allocation reflects the model’s capacity to balance efficiency and flexibility under stochastic penalty influences. Notably, R1 is covered by two stations (S1 and S2), which may be a strategic redundancy due to its proximity or high-risk profile. Similarly, R7 is jointly covered by S3 and S4, possibly compensating for limited accessibility or higher traffic penalties in that corridor.
Critically, the absence of S5 from any assignment highlights how dynamic penalties (e.g., high unreliability modeled through vehicle issues) can deprioritize a resource despite its availability. This demonstrates the algorithm’s sensitivity to operational quality, not just spatial proximity. Overall, the GA has produced a sparse yet effective assignment strategy, ensuring minimum total response time while integrating smart penalty logic to simulate real-world constraints.
Figure 15a–c examines general performance patterns across fire stations and scenarios. Figure 15a plots the response time trends of all five stations across operational scenarios. The trend reveals that response times increase significantly under Severe Weather and Multiple Incidents, with the fastest responses during Emergency Alert. Notably, S3 maintains relatively lower response times throughout. Figure 15b is a service coverage distribution pie chart, illustrating how overall coverage is distributed among scenarios; Emergency Alert and Normal Operations account for the largest slices, confirming the system’s relative strength under controlled or prioritized conditions. Figure 15c shows the average service efficiency by scenario, with Emergency Alert again achieving the highest efficiency index, and Multiple Incidents showing the lowest, aligning with previous insights about system strain under complex emergencies. Figure 15d–f delves into regional and station-specific quality and variability. Figure 15d presents a heatmap of regional service quality, where R5 consistently scores highest across all scenarios, especially under Emergency Alert (score = 1.47), while R6 and R7 perform poorly throughout. Figure 15e uses a boxplot to illustrate the station workload distribution, showing that S3 and S4 handle higher workloads with more variation, while S2 is relatively underloaded. Figure 15f quantifies performance variability via the coefficient of variation for each station. S1 exhibits the highest variability, suggesting inconsistent delivery, while S5 is the most stable. Figure 15g–j highlights scenario-specific normalized performance metrics across four key aspects: average response, maximum response, coverage, and efficiency. Figure 15g shows that under Normal Operations, the system scores high on average response and coverage. Figure 15h (for Peak Hours) shows modest scores across all metrics, with a notable drop in efficiency. In Figure 15i (Emergency Alert), all metrics are elevated, especially response times and coverage, reinforcing this scenario as the most effective. Finally, Figure 15j demonstrates severe performance degradation during Severe Weather, where all metrics sharply decline, highlighting systemic vulnerability under environmental stress. These comparisons solidify the critical role of scenario context in shaping both strategic planning and real-time resource allocation.
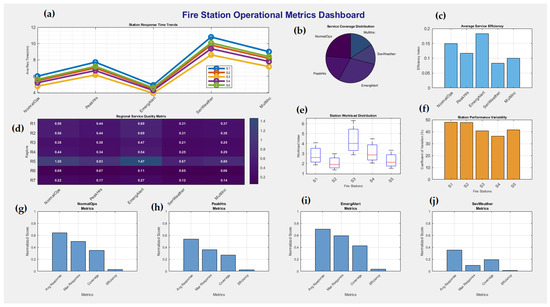
Figure 15.
The outcomes of system-wide trends: (a) response time, (b) coverage share, (c) efficiency, (d) service quality, (e) workload, (f) variability, and (g–j) scenario-based performance metrics.
Figure 16a–e presents the response time matrices (in minutes) for each operational scenario. In Figure 16a (Normal Operations), response times range between 3.1 and 6.3 min, with relatively balanced coverage across all stations and regions. In contrast, Figure 16b (Peak Hours) shows increased delays, particularly in responses from S5 and S4 to regions R6 and R5, reflecting traffic congestion effects. Figure 16c (Emergency Alert) improves response speed due to prioritization, as visible from reduced values such as 2.2 and 2.8 min, highlighting the system’s capacity for rapid mobilization. However, Figure 16d (Severe Weather) shows significant delays (values exceeding 10 min) across most routes, pointing to the vulnerability of emergency access during extreme weather. Figure 16e (Multiple Incidents) exhibits the highest response times overall, confirming service strain during concurrent emergencies. Figure 16f–j visualize system and regional inputs affecting service performance. Figure 16f shows the average response time by scenario, confirming that Emergency Alert delivers the fastest mean response (~5.1 min), while Multiple Incidents stretches it beyond 8 min. Figure 16g correlates station capacity with total service coverage under normal conditions, revealing that stations with higher capacities (e.g., S3) are associated with broader service reach. Regional contextual data follows: Figure 16h shows population density, with R5 and R1 having the highest concentrations, and Figure 16i confirms R5 experiences the most daily emergency calls. Figure 16j maps regional risk levels, with R2 and R1 being the most hazardous zones (risk levels 5 and 4), which are critical targets for resource prioritization. The remaining subplots analyze service coverage and efficiency. Figure 16k–o display coverage indices under each scenario. During Normal Operations (k) and Emergency Alert (m), several stations reach high coverage (>1.0), especially in R5, R1, and R3. This trend diminishes significantly under Severe Weather (n) and Multiple Incidents (o), with coverage shrinking and becoming more spatially concentrated. Figure 16p–s represent efficiency maps, which account for risk-adjusted service. Efficiency is maximized under Emergency Alert (q), indicating effective deployment where risk is highest. By contrast, Severe Weather (r) and Multiple Incidents (s) show fragmented and low-efficiency patterns, reinforcing the need for robust emergency strategies under compound risk conditions.
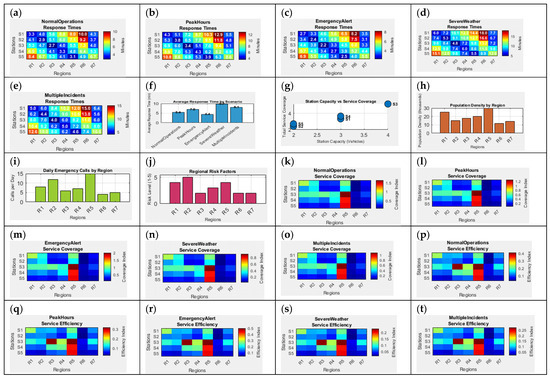
Figure 16.
The outcomes of fire station performance across scenarios, (a–e) response times, (f–j) influencing factors, (k–o) service coverage, and (p–t) efficiency, highlighting operational impacts of risk, demand, and resource capacity.
From a meta-critical perspective, the results demonstrate the robustness and adaptability of the GA in solving real-world urban response optimization problems. The improvement of over 60% in average response penalty from initial to final generations confirms that the algorithm is not only functional but also effective under the model’s assumptions (e.g., randomized penalties, binary assignments, and mandatory coverage constraints). Additionally, the slight variance in final fitness values implies a healthy balance between exploration and exploitation, crucial in dynamic models where solution landscapes are nonlinear and rugged. These outputs validate the model’s applicability for strategic planning, highlighting zones of inefficiency and offering a framework for future enhancement using hybrid metaheuristics or real-time data integration.
Figure 17 presents a comprehensive sensitivity analysis of GA parameter tuning for optimizing emergency response strategies in urban environments. Figure 17a, the Fitness Sensitivity Heatmap, visualizes the influence of key GA and system-level parameters—Population Size (PopSize), Maximum Generation (MaxGen), Mutation Rate (MutRate), Crossover Fraction (CrossFrac), Speed, Traffic, and Penalty—on fitness values (cost). The color gradient from yellow to deep red shows that PopSize and Speed exhibit the strongest influence on fitness, followed by Traffic and Penalty, while MaxGen and CrossFrac demonstrate moderate effects. This heatmap establishes the groundwork for identifying the most impactful parameters in reducing GA-based optimization costs. Figure 17b shows the Computational Time Distribution, where Penalty, Traffic, and Speed contribute substantially to computational load, while MaxGen and PopSize account for a smaller share. This distribution aids in prioritizing parameters during optimization, especially when balancing solution quality against runtime. Complementing this, Figure 17c quantifies the Average Generations to Convergence for each parameter variation. The bars indicate marginal variation across parameters, with Speed and PopSize requiring slightly more generations to achieve convergence, suggesting their dominant role in exploration. Figure 17d–j detail individual sensitivity curves for each parameter. In Figure 17d, PopSize shows an inverse relationship with cost—larger populations reduce fitness cost significantly, stabilizing around 21.77 at a size of 300. This aligns with the statistical result (Coefficient of Variation (CV) = 22.7%) and confirms PopSize as a highly sensitive tuning parameter. Figure 17e illustrates MaxGen’s parabolic influence on cost, where both low and high values are suboptimal, and the best performance (22.58) occurs around 50 generations, consistent with its minimal coefficient of variation (CV = 3.5%). Figure 17f for MutRate reveals a rising cost curve, indicating that higher mutation rates degrade performance, with 0.1 yielding optimal performance (cost = 22.51) and moderate variability (CV = 9.4%). Crossover Fraction, in Figure 17g, exhibits a U-shaped curve, with the best fitness (22.68) at a mid-range value of 0.6, supporting a balanced trade-off between exploration and exploitation. The low CV (8.6%) confirms stability. Figure 17h,i depict the impact of Speed and Traffic, respectively, reflecting real-world dynamics. Higher vehicle speed (1.5 units) results in the lowest cost (15.96), indicating that vehicular mobility dramatically enhances response efficiency. The high CV of 43.0% underscores its sensitivity. Traffic, however, reveals a more complex curve, with the minimum cost (24.22) achieved at a value of 3, denoting an optimal trade-off between congestion modeling and realism. Its CV (11.1%) supports moderate sensitivity. Figure 17j highlights Penalty’s strong positive correlation with cost, revealing that higher penalties sharply deteriorate fitness. Its negligible robustness score further emphasizes its volatility. Figure 17k, a Multi-Metric Sensitivity Radar, triangulates Fitness Range, Time Range, and Generation Range for each parameter. PopSize, Speed, and Penalty exhibit the widest radar spread, confirming their critical role in shaping both solution quality and runtime dynamics. In contrast, MaxGen and CrossFrac show moderate sensitivity, while MutRate maintains low cross-metric volatility. Figure 17l, Parameter Robustness, quantifies how consistently each parameter yields stable results. PopSize and Speed have the highest robustness scores, indicating reliability across multiple runs. Conversely, Penalty and Traffic exhibit the lowest robustness, affirming their susceptibility to external disturbances or model assumptions. These findings are essential for practitioners aiming to design resilient optimization models. Finally, Figure 17m presents Optimization Efficiency as the reciprocal of cost-to-time ratios. PopSize and Speed stand out again, offering the highest efficiency, suggesting these parameters yield significant performance gains with minimal computational overhead. MutRate and CrossFrac show moderate efficiency, while Traffic and Penalty lag due to their adverse impact on cost and computational complexity.
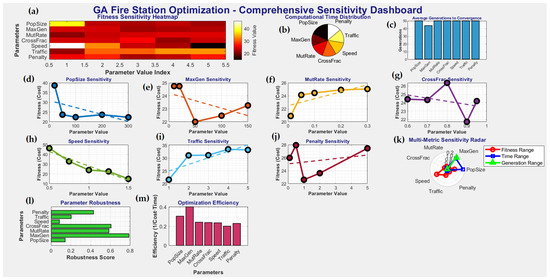
Figure 17.
Sensitivity analysis of GA parameter tuning: (a) fitness heatmap; (b) computational time distribution; (c) average generations to convergence; (d–j) fitness response to PopSize, MaxGen, MutRate, CrossFrac, Speed, Traffic, and Penalty; (k) multi-metric radar; (l) parameter robustness; and (m) optimization efficiency.
Figure 18a–c focuses on comparative station-level performance diagnostics. Figure 18a presents normalized scores for each fire station across three dimensions—response time, coverage, and efficiency. Station S3 consistently outperforms others across all metrics, while S2 and S5 lag behind, particularly in efficiency. Figure 18b highlights capacity utilization, where all stations operate above a 1.0 ratio, indicating high demand relative to capacity, with S5 reaching the highest utilization (1.36). This suggests that S5, despite weaker efficiency, is heavily burdened. Figure 18c uses a boxplot to reveal the distribution of response times across scenarios. S3 and S4 show compact interquartile ranges and fewer outliers, indicating stable and predictable performance, whereas S2 shows more variability and outliers extending above 15 min. Figure 18d–f transitions toward cumulative performance trends and variability. Figure 18d presents the average station coverage, with S3 again leading, followed by S4 and S1. This metric reinforces the results in Figure 18a, where S3’s service span is broad and consistent. Figure 18e shows scenario-wise efficiency trends for each station. Most stations reach their peak under the Emergency Alert condition, especially S3, which exhibits a sharp spike above 0.27 in efficiency. Efficiency generally dips during Severe Weather, highlighting system-wide vulnerability. This dynamic plot clearly shows that scenario context dramatically alters performance profiles. Figure 18f offers insights into load variability, expressed as the coefficient of variation across all service scenarios. All five stations exhibit relatively high and similar variability (~30%), indicating fluctuating operational stress. Finally, the station ranking panel on the right (within f) synthesizes overall performance scores: S3 ranks first with a perfect score (1.000), followed by S4 and S1. S2, despite its higher utilization, ranks last, reflecting suboptimal efficiency and less consistent response.
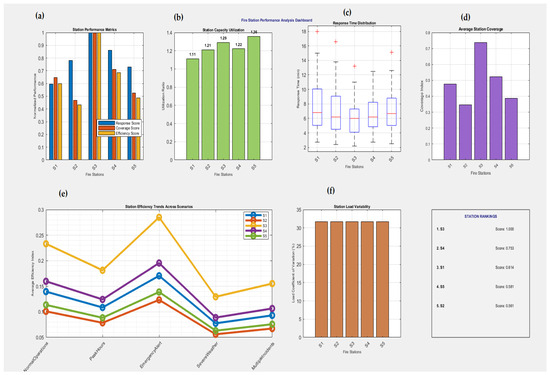
Figure 18.
The comparison of station-level performance: (a) normalized scores, (b) capacity utilization, (c) response time variability, (d) average coverage, (e) efficiency trends by scenario, and (f) load variability with final station rankings.
Figure 19 emphasizes the disparity between regional demand and actual fire service delivery. While R5 is well-served compared to other regions, its exceptionally high population and call volume still outpace supply, generating the largest gap. Conversely, regions like R6 and R7, though lower in demand, show poor scores due to sparse coverage and long response times. This set of analytics reinforces the importance of aligning service deployment with multidimensional risk, population, and demand indicators. Figure 19a–c evaluates regional service quality under various operational scenarios. In Figure 19a, regional service scores are shown across all five scenarios. Region R5 clearly outperforms others, especially during Emergency Alert and Normal Operations, while R6 and R7 receive consistently low scores under all conditions, indicating persistent service challenges. Figure 19b presents a scatter plot of population density versus service score, color-coded by emergency call frequency. R5 emerges as a high-density, high-score outlier, while R6 and R7 are low on both population and service quality, despite having lower call loads. Figure 19c links regional risk level to average response time. High-risk regions (R1 and R2) show elevated response times, indicating potential service gaps, while lower-risk zones maintain faster responses. Figure 19d–f provides deeper insight into coverage, priority, and gaps. In Figure 19d, service coverage is compared across three key scenarios—Normal, Emergency, and Severe Weather. R5 consistently receives the highest coverage in all conditions, while R6 and R7 receive minimal support. Figure 19e visualizes regional priority factors (population, call frequency, risk) as a heatmap. R2 and R5 are hotspots across multiple dimensions, particularly in risk and call frequency, justifying targeted resource allocation. Figure 19f highlights regional service gaps by comparing demand with service provision. R5 and R4 exceed the critical threshold, indicating they require urgent intervention. The panel also includes a performance summary ranking, where most regions are marked “Good” except R5, flagged as “Needs Attention,” consistent with its high demand yet strained coverage.
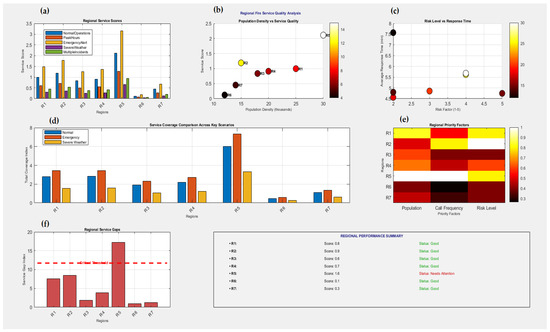
Figure 19.
Regional analysis: (a) service scores, (b) population vs. service quality, (c) risk vs. response time, (d) coverage, (e) priority heatmap, and (f) service gaps and performance summary.
10. Cost–Benefit Analysis Tool for Proposed Stations
Through this section of research, this MATLAB 2019b program is designed to perform a Cost–Benefit Analysis (CBA) for two proposed fire stations over a 20-year evaluation period. The program calculates the Net Present Value (NPV) of anticipated annual savings from reduced fuel usage, maintenance, and personnel costs, and compares them against the initial setup costs for each station. A sensitivity analysis is conducted by varying the discount rate between 1% and 10% to assess the robustness of the investment under different economic scenarios. Results are visualized through an enhanced plot showing how net benefits respond to discount rate changes.
The following assumptions are applied based on the attached study:
- Fixed project lifetime of 20 years for both stations.
- Constant annual savings in fuel, maintenance, and personnel throughout the evaluation period.
- Setup costs are treated as one-time upfront investments.
- Discount rates are assumed to vary linearly from 1% to 10% to capture economic uncertainties.
- No escalation or inflation is considered in cost or savings values.
- No residual value or terminal benefits are included at the end of the period.
This tool supports urban planning decisions by quantifying the financial viability of establishing new fire stations. Figure 20 illustrates the results of the cost–benefit analysis (CBA) conducted for two proposed fire stations over a 20-year evaluation horizon, considering a range of discount rates from 1% to 10%. The Figure demonstrates how the net benefit (in million IRR) for each station varies with the discount rate, providing a comprehensive sensitivity analysis to support strategic decision-making under financial uncertainty. From the graph, Station 2 consistently yields higher net benefits than Station 1 across the entire discount rate spectrum. At the lowest discount rate (1%), the net benefit peaks at 3163 million IRR for Station 2 and 2831 million IRR for Station 1. This reflects the stronger financial performance of Station 2, attributed to its higher annual savings in fuel, maintenance, and personnel costs. As the discount rate increases, the present value of future savings diminishes, leading to a progressive decline in net benefits for both stations. At a 10% discount rate, the benefits for both converge closely, highlighting reduced economic attractiveness in high-risk or inflationary scenarios. The meta-analysis embedded in this evaluation is grounded in systematically varying a core economic parameter—the discount rate—and observing its impact on project viability. This approach enables the comparison of multiple investment alternatives under identical assumptions, ensuring robust and data-driven insights. The pattern observed confirms the inherent time-value-of-money principle: future cost savings are more valuable when discounted at lower rates, reinforcing the importance of economic stability for long-term public infrastructure investments. Critically, the analysis assumes constant annual savings and does not account for escalation in operational costs, inflation, or changes in service demand over time. Additionally, the absence of residual value or external socio-economic benefits (e.g., improved emergency response times or community safety enhancements) means the net benefit values presented are conservative. Real-world impacts may thus be more favorable than those modeled.
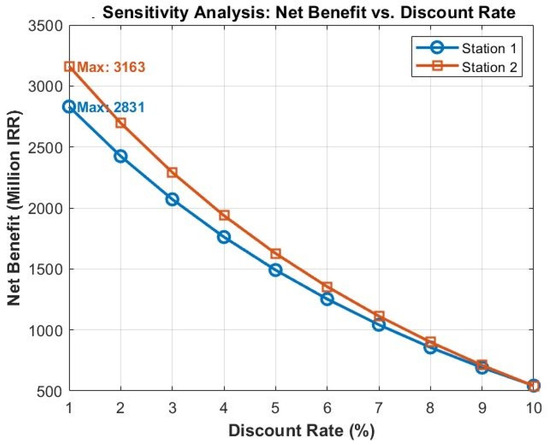
Figure 20.
Cost–benefit analysis outcomes with meta-analysis and critical assessment.
While the cost–benefit analysis (CBA) provides a structured evaluation of the proposed fire stations over a 20-year period, several assumptions were made to simplify the model, which may lead to underestimation of long-term impacts. First, the analysis assumes constant annual savings in fuel, maintenance, and personnel, without accounting for potential fluctuations due to inflation, changes in operational efficiency, or evolving service needs. In reality, both costs and savings are likely to vary over time. Second, the model does not incorporate inflation or escalation factors, treating all costs and savings in nominal terms. This simplification may overstate the present value of setup costs and understate the long-term benefits, particularly in contexts where operating costs rise with time. Third, the CBA excludes residual value or terminal benefits at the end of the 20-year horizon. Infrastructure such as fire stations typically remains functional beyond its initial evaluation period, meaning that potential future savings or reuse value is not captured. Additionally, the model does not include externalities such as reductions in fire-related property damage, improved emergency response times, or enhanced public safety outcomes. These intangible benefits can significantly contribute to the broader societal value of emergency infrastructure but are not reflected in the current analysis. Although a sensitivity analysis was conducted using discount rates ranging from 1% to 10% to capture economic uncertainty, this alone does not account for the above limitations. Future work could improve the robustness of the CBA by incorporating dynamic cost modeling, inflation indexing, residual asset value, and a monetization of broader social and environmental benefits.
Figure 21a–e presents a comprehensive economic assessment of two proposed fire stations—FS-Alpha (Urban) and FS-Beta (Suburban)—using the Professional Fire Station Cost–Benefit Analysis System (v2.0). Figure 21a shows the Net Present Value (NPV) comparison, where FS-Beta achieves a higher NPV (3143 M IRR) than FS-Alpha (3125 M IRR), indicating superior financial return. The risk-return profile in Figure 21b places FS-Beta as the optimal performer with higher expected return and slightly higher risk, while FS-Alpha offers a conservative alternative. The sensitivity tornado chart in Figure 21c highlights that discount rate changes have the greatest negative impact on FS-Alpha’s viability, followed by inflation and population growth, stressing the need for macroeconomic resilience in planning. In Figure 21d, cumulative cash flow trends reveal that both stations surpass the break-even point within the 12th year, with FS-Beta achieving it slightly earlier. Monte Carlo analysis in Figure 21e reinforces FS-Beta’s advantage, showing narrower uncertainty bands and a higher probability of positive NPV. The KPI dashboard confirms FS-Beta as the top investment choice, with a total portfolio NPV of 6268 M IRR, 174.1% ROI, and 25-year analysis span. These insights are grounded in a robust simulation framework that integrates inflation volatility, service demand growth, and utilization decay, ensuring dynamic, risk-aware financial planning for critical infrastructure investments.
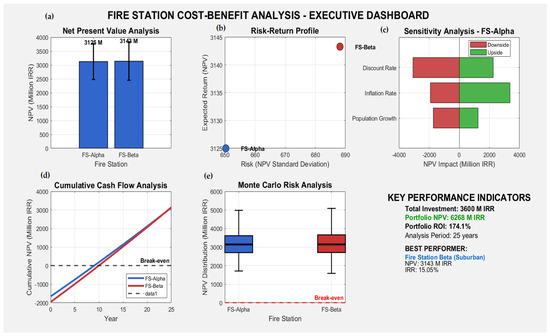
Figure 21.
Illustration of economic evaluation of FS-Alpha and FS-Beta: (a) NPV analysis, (b) risk-return profile, (c) sensitivity, (d) cumulative cash flow, and (e) Monte Carlo risk; FS-Beta outperforms in all metrics.
In terms of decision-making systems, these outcomes serve as a foundational input for multi-criteria decision analysis (MCDA) and decision support systems (DSS) used by municipal planners and public safety authorities. Such systems often integrate quantitative economic assessments like CBA with qualitative indicators (e.g., accessibility, community feedback, environmental impact). The graphical output enhances interpretability for stakeholders, enabling intuitive comparison and justification of resource allocation. Overall, the role of CBA as a vital component within broader decision-making architectures, especially in public infrastructure planning where both fiscal discipline and service quality are paramount. By offering a transparent and adaptable evaluation framework, the evidence-based planning and the prioritization of projects with the highest socio-economic return. While Yao et al. (2019) [25] introduced a robust bi-objective model balancing spatial access and service coverage, their approach remains largely static and GIS-based, lacking temporal variability and economic feasibility assessment. In contrast, our study advances the field by incorporating dynamic traffic-based simulations, genetic algorithms, and a cost–benefit framework. This not only reflects real-time operational complexities—like traffic fluctuations and station reliability—but also enables financially informed decisions. Unlike Yao’s reliance on Pareto optimization alone, our integrated decision support system aligns strategic planning with both urban growth and resource constraints, offering a more adaptable and application-ready model.
Wang et al. (2021) [26] utilized multi-source geospatial data and network analysis to optimize fire station siting in Beijing, emphasizing POI-based fire risk mapping and multi-scenario traffic conditions. However, their approach remains primarily GIS-driven with static optimization goals and limited operational flexibility. In contrast, our study integrates dynamic traffic simulations, genetic algorithms, and cost–benefit analysis, enabling real-time adaptability and financial justification. Unlike Wang’s model, which assumes uniform station performance, ours accounts for station-specific penalties and operational uncertainties, offering a more robust and decision-ready urban emergency planning tool. Awad et al. (2024) [27] advanced fire station planning by integrating precise travel time calculations—factoring in traffic lights, intersections, and congestion—using AHP and SAW within ArcGIS. Their method improved the realism of service coverage in Sleman District, revealing that traditional default speed assumptions significantly overestimate service areas. However, their model remains static and deterministic, relying on predefined weights and lacking adaptive mechanisms. In contrast, our study moves beyond fixed-weight models by incorporating dynamic traffic-based simulations, stochastic genetic algorithms, and cost–benefit analysis, capturing real-time variability, uncertainty, and economic feasibility. Unlike Awad’s method, our model reflects operational disruptions and financial constraints, offering a more comprehensive and decision-oriented approach to fire station optimization in rapidly urbanizing contexts. Savsar (2014) [28] addressed the fire station location problem by incorporating physical obstacles and obstacle-overcoming points, such as highways and restricted crossings, which delay emergency response in metropolitan areas. This approach adds realism to traditional facility location models by acknowledging urban infrastructure challenges. However, the study remains case-specific and focuses mainly on geometric modeling, lacking integration of variable traffic dynamics, stochastic optimization, or economic evaluation. In contrast, our study offers a more comprehensive and adaptive framework by combining dynamic traffic-based simulation, genetic algorithm optimization, and cost–benefit analysis. While Savsar emphasizes static structural barriers, our model captures temporal variability, operational uncertainties, and financial feasibility, offering a scalable, data-driven decision support tool for urban fire station planning under real-world constraints. Likewise, Aktaş (2013) [29] developed a GIS-based decision support system using set-covering and maximal-covering models to assist the Istanbul Metropolitan Municipality in planning new fire station locations based on fire incident data. While effective in improving five-minute coverage from 58.6% to 85.9%, the approach relies on static spatial models, pre-defined thresholds, and assumes consistent traffic and infrastructure conditions, offering limited flexibility to adapt in real time. In contrast, our study builds on and surpasses this foundation by introducing dynamic traffic-based simulation, genetic algorithm optimization, and cost–benefit analysis. Rather than relying solely on historical incidents and fixed models, our system reflects real-time urban dynamics, accounts for economic feasibility, and handles operational uncertainties. This enables more adaptive, future-oriented planning compared to Aktaş’s scenario-based yet static framework. From another aspect, Chen et al. (2023) [30] proposed a POI-based method for optimizing urban fire station locations using ArcGIS, convex hull geometry, and the LA model (MFM and MCM), focusing on maximizing POI coverage and minimizing overlap. Their model is spatially comprehensive and achieves high coverage (94%) in Zhengzhou’s Zhongyuan District but is built on static assumptions, predefined travel times, and lacks a real-time adaptability component. In contrast, our study enhances spatial modeling by incorporating dynamic traffic-based simulations, stochastic genetic algorithms, and economic assessment, enabling real-time decision-making under urban variability. Unlike Chen’s deterministic, GIS-bound method, our approach offers scenario flexibility, evaluates station reliability, and accounts for financial feasibility, making it more suitable for adaptive emergency planning in complex urban networks. Huang et al. (2023) [31] developed a GIS-based optimization framework for fire station layout in CZ city, employing classic location models (Set Covering, Maximal Coverage, and P-Center) to maximize coverage and reduce response times within a 4 min limit. Their model integrates socio-geographic data and conducts sensitivity analysis but is primarily built on static GIS structures and predefined constraints. Our study builds upon and advances this approach by incorporating dynamic traffic-based simulations, stochastic genetic algorithms, and a comprehensive cost–benefit assessment. While Huang et al. emphasize theoretical spatial coverage and response time, our model simulates real-time traffic disruptions, evaluates station reliability, and integrates financial feasibility, offering a more adaptive and operationally realistic solution. Unlike Huang’s model, which focuses on structural layout refinement, ours enables dynamic, scenario-driven decision-making under uncertainty—providing superior readiness for evolving urban fire risks.
Table 3 presents a comparative analysis of key existing studies on fire station optimization and the proposed methodology introduced in this research. The comparison highlights six core dimensions: optimization technique, traffic dynamics integration, economic evaluation, GIS utilization, and model adaptability. Most prior studies (e.g., Yao et al. [25], Aktaş et al. [29]) rely on static optimization frameworks such as set-covering or spatial accessibility models, without incorporating real-time traffic variability or operational uncertainties. Others, like Awad et al. [27] and Wang et al. [26], enhanced spatial accuracy using GIS but still operate under fixed assumptions or simplified scenarios. In contrast, the proposed approach integrates dynamic traffic-based simulations, a genetic algorithm (GA) for location-allocation optimization, and a cost–benefit analysis (CBA) to evaluate economic feasibility. This combination addresses operational realism, temporal variability, and financial justification simultaneously. Furthermore, the model includes a smart penalty structure to simulate real-world disruptions (e.g., congestion, vehicle malfunction), enhancing adaptability and decision support capabilities. This table underscores the novelty and comprehensiveness of the proposed framework, which not only improves upon spatial and temporal modeling but also introduces financial and stochastic dimensions rarely addressed in previous research. The approach offers a more flexible, responsive, and robust tool for urban emergency planning under real-world constraints.

Table 3.
Comparative analysis of existing fire station optimization models and the proposed approach.
Due to the limited availability of high-resolution GIS datasets for the city of Birjand, particularly in terms of updated road networks, administrative boundaries, and real-time traffic data, a full spatial analysis using conventional GIS platforms (e.g., ArcGIS, QGIS) could not be implemented. Many GIS layers were either outdated, unavailable, or inconsistent across municipal sources, making direct integration with optimization models unreliable. To address this challenge, we adopted an alternative approach by generating schematic zone maps and distance matrices manually, using verified spatial references provided by the Birjand Fire Department and Urban Transportation Organization. These data were then processed through MATLAB to simulate spatial interactions—such as travel time, coverage efficiency, and demand concentration—under varying traffic conditions. Although not GIS-based in the traditional sense, this method provided a reliable spatial abstraction of the city’s emergency response landscape and allowed for dynamic modeling under real-world constraints. Future work will seek to integrate high-fidelity GIS data, where available, to complement and refine the simulation-based framework presented here.
11. Conclusions
This study presents a multifaceted, decision-driven framework for optimizing fire station deployment in urban settings, integrating mathematical modeling, simulation, and cost–benefit analysis. Through a meticulously constructed binary integer programming model and dynamic simulation protocols in MATLAB 2019b, the research demonstrates a robust methodology capable of addressing real-world constraints such as resource limitations, traffic dynamics, and urban expansion. A two-phase Simplex optimization clarified the most economically efficient coverage strategy, while the GA, with a 100-member population over 20 generations, minimized penalized response time to an impressive 25.89 min. Furthermore, a dynamic heatmap-based visualization of traffic scenarios validated the model’s predictive power and operational realism. Critically, meta-analytic insights from CBA revealed that Station 2 outperformed Station 1 with a maximum net benefit of 3163 million IRR at a 1% discount rate, establishing a clear economic justification under variable discounting conditions. Sensitivity analysis reinforced these findings, showcasing the model’s resilience across high-risk financial scenarios. Meta-analysis across demand, response, and coverage dimensions highlighted systematic inefficiencies—such as the under-servicing of high-demand regions (R4, R5) and redundancy in moderate-demand zones (R3)—underscoring the urgency for strategic reallocation. Professionally, this framework advances discipline by aligning static and dynamic optimization with empirical urban planning, enabling real-time adaptability and fiscal accountability. It contributes not only to replicable urban response models but also to DSS architecture that integrates quantitative rigor with operational insight. By fusing simulation, optimization, and economic assessment, the study equips urban policymakers with a strategic toolkit that is both analytically sound and policy-relevant—positioning it as a reference standard for infrastructure planning in rapidly evolving cities.
Author Contributions
Conceptualization: F.M. and R.Y.K.; methodology: M.G. and R.Y.K.; software: F.M. and M.G.; writing—original draft preparation: F.M., A.A. (Amirhossein Ahmadi) and R.M.; validation: R.M. and A.A. (Andres Annuk); formal analysis: M.G. and A.A. (Amirhossein Ahmadi); writing—review and editing: R.M. and A.A. (Andres Annuk); visualization: R.Y.K. and M.G.; supervision, R.Y.K. and A.A. (Andres Annuk). All authors have read and agreed to the published version of the manuscript.
Funding
This research received no external funding.
Institutional Review Board Statement
Not applicable.
Informed Consent Statement
Not applicable.
Data Availability Statement
The data that support the findings of this study are available upon request from the corresponding author.
Acknowledgments
The authors gratefully acknowledge the support of the Estonian University of Life Sciences, Institute of Forestry and Engineering, Chair of Energy Application Engineering. This research was made possible through the Energy Efficiency and Renewable Energy Research Infrastructure project, funded by the Estonian Research Council under Grant TARISTU24-TK12.
Conflicts of Interest
The authors declare no conflicts of interest.
References
- Nazif, S.; MMKhoie, M.; Eslamian, S. Urban Disaster Management and Resilience. In Handbook of Disaster Risk Reduction for Raesilience; Eslamian, S., Eslamian, F., Eds.; Springer International Publishing: Berlin/Heidelberg, Germany, 2021; pp. 157–185. [Google Scholar] [CrossRef]
- Mitsakis, E.; Stamos, I.; Grau, J.M.S.; Aifadopoulou, G. Optimal allocation of emergency response services for managing disasters. Disaster Prev. Manag. 2014, 23, 329–342. [Google Scholar] [CrossRef]
- Perr, R.W.; Lindell, M.K. Preparedness for Emergency Response: Guidelines for the Emergency Planning Process. Disasters 2003, 27, 336–350. [Google Scholar] [CrossRef] [PubMed]
- Statista-The Statistics Portal. Statista. Available online: https://www.statista.com/ (accessed on 4 April 2025).
- National Research University Higher School of Economics; Kravtsova, M.V. The formulation of the economic and mathematical model of serving system on the example of public transport bus traffic management. Digit. Econ. Innov. 2018, 2, 11–16. [Google Scholar] [CrossRef]
- Opoku, D.; Kommey, B. FPGA-Based Intelligent Traffic Controller with Remote Operation Mode. Int. J. Innov. Technol. Interdiscip. Sci. 2020, 3, 490–500. [Google Scholar] [CrossRef]
- Saha, S. Automated Traffic Law Enforcement System: A Feasibility Study for the Congested Cities of Developing Countries. Int. J. Innov. Technol. Interdiscip. Sci. 2020, 3, 346–363. [Google Scholar] [CrossRef]
- Feng, Y.; Cui, S. A review of emergency response in disasters: Present and future perspectives. Nat. Hazards 2021, 105, 1109–1138. [Google Scholar] [CrossRef]
- Alruwaili, A.; Alanazy, A.R.M. Prehospital Time Interval for Urban and Rural Emergency Medical Services: A Systematic Literature Review. Healthcare 2022, 10, 2391. [Google Scholar] [CrossRef]
- Blum, J.R.; Eichhorn, A.; Smith, S.; Sterle-Contala, M.; Cooperstock, J.R. Real-time emergency response: Improved management of real-time information during crisis situations. J. Multimodal User Interfaces 2014, 8, 161–173. [Google Scholar] [CrossRef]
- Rivera, J.J.; Zapata-Ferrero, I. COVID-19: Traffic Restrictions Incidence on the Service Life of Pavements in La Plata City of Argentina. Int. J. Innov. Technol. Interdiscip. Sci. 2020, 3, 550–559. [Google Scholar] [CrossRef]
- Spaho, E. Comparing Different DTN Routing Protocols in a Dense Deployment Scenario with Realistic Mobility Trace. Int. J. Innov. Technol. Interdiscip. Sci. 2019, 2, 290–296. [Google Scholar] [CrossRef]
- Minh, V.T.; Moezzi, R.; Dhoska, K. Design of Control System for Self-Driving Vehicles. Int. J. Innov. Technol. Interdiscip. Sci. 2022, 6, 1081–1099. [Google Scholar] [CrossRef]
- He, Q.; Xue, L.; Yang, Y.; Ding, P.; Liu, M. Research on Chinese Fire Station Optimal Location Model Based on Fire Risk Statistics: Case Study in Shanghai. Appl. Sci. 2024, 14, 2052. [Google Scholar] [CrossRef]
- Smith, D.M. A Theoretical Framework for Geographical Studies of Industrial Location. Econ. Geogr. 1966, 42, 95–113. [Google Scholar] [CrossRef]
- Sial, R.A.; Chaudhary, M.F.; Abbas, S.T.; Latif, M.I.; Khan, A.G. Quality of effluents from Hattar Industrial Estate. J. Zhejiang Univ. Sci. B 2006, 7, 974–980. [Google Scholar] [CrossRef] [PubMed]
- Nuhu, S.K.; Manan, Z.A.; Alwi, S.R.W.; Reba, M.N.M. Roles of geospatial technology in eco-industrial park site selection: State–of–the-art review. J. Clean. Prod. 2021, 309, 127361. [Google Scholar] [CrossRef]
- Şener, B.; Süzen, M.L.; Doyuran, V. Landfill site selection by using geographic information systems. Environ. Geol. 2006, 49, 376–388. [Google Scholar] [CrossRef]
- Casas, J.; Perarnau, J.; Torday, A. The need to combine different traffic modelling levels for effectively tackling large-scale projects adding a hybrid meso/micro approach. Procedia Soc. Behav. Sci. 2011, 20, 251–262. [Google Scholar] [CrossRef]
- Pamučar, D.; Vasin, L.; Atanasković, P.; Miličić, M. Planning the City Logistics Terminal Location by Applying the Green p -Median Model and Type-2 Neurofuzzy Network. Comput. Intell. Neurosci. 2016, 2016, 6972818. [Google Scholar] [CrossRef]
- Brent, D.; Beland, L.-P. Traffic congestion, transportation policies, and the performance of first responders. J. Environ. Econ. Manag. 2020, 103, 102339. [Google Scholar] [CrossRef]
- Khan, A.; Ullah, F.; Kaleem, Z.; Rahman, S.U.; Anwar, H.; Cho, Y.-Z. EVP-STC: Emergency Vehicle Priority and Self-Organising Traffic Control at Intersections Using Internet-of-Things Platform. IEEE Access 2018, 6, 68242–68254. [Google Scholar] [CrossRef]
- Rehn, M.; Davies, G.; Smith, P.; Lockey, D. Emergency versus standard response: Time efficacy of London’s Air Ambulance rapid response vehicle. Emerg. Med. J. 2017, 34, 806–809. [Google Scholar] [CrossRef] [PubMed]
- Hao, M.-J.; Hsieh, B.-Y. Greenshields Model-Based Fuzzy System for Predicting Traffic Congestion on Highways. IEEE Access 2024, 12, 115868–115882. [Google Scholar] [CrossRef]
- Yao, J.; Zhang, X.; Murray, A.T. Location optimization of urban fire stations: Access and service coverage. Comput. Environ. Urban Syst. 2019, 73, 184–190. [Google Scholar] [CrossRef]
- Wang, W.; Xu, Z.; Sun, D.; Lan, T. Spatial Optimization of Mega-City Fire Stations Based on Multi-Source Geospatial Data: A Case Study in Beijing. ISPRS Int. J. Geo Inf. 2021, 10, 282. [Google Scholar] [CrossRef]
- Awad, A.M.M.; Wikantika, K.; Ali, H.; Abujayyab, S.K.M.; Hashempour, J. Optimization of new fire department location using an improved GIS algorithm for firefighters travel time estimation. Int. J. Emerg. Serv. 2024, 13, 80–97. [Google Scholar] [CrossRef]
- Savsar, M. Fire station location analysis in a metropolitan area. Int. J. Ind. Syst. Eng. 2014, 16, 365–381. [Google Scholar] [CrossRef]
- Aktaş, E.; Özaydın, Ö.; Bozkaya, B.; Ülengin, F.; Önsel, Ş. Optimizing Fire Station Locations for the Istanbul Metropolitan Municipality. Interfaces 2013, 43, 240–255. [Google Scholar] [CrossRef]
- Chen, M.; Wang, K.; Yuan, Y.; Yang, C. A POIs Based Method for Location Optimization of Urban Fire Station: A Case Study in Zhengzhou City. Fire 2023, 6, 58. [Google Scholar] [CrossRef]
- Huang, A.-C.; Huang, C.-F.; Shu, C.-M. A Case Study for an Assessment of Fire Station Selection in the Central Urban Area. Safety 2023, 9, 84. [Google Scholar] [CrossRef]
Disclaimer/Publisher’s Note: The statements, opinions and data contained in all publications are solely those of the individual author(s) and contributor(s) and not of MDPI and/or the editor(s). MDPI and/or the editor(s) disclaim responsibility for any injury to people or property resulting from any ideas, methods, instructions or products referred to in the content. |
© 2025 by the authors. Licensee MDPI, Basel, Switzerland. This article is an open access article distributed under the terms and conditions of the Creative Commons Attribution (CC BY) license (https://creativecommons.org/licenses/by/4.0/).