1. Introduction
Transportation is fundamental to everyday life, functioning as a critical mechanism for human mobility, goods distribution, and economic advancement. However, contemporary transportation systems demonstrate significant dependence on fossil fuel consumption, contributing substantially to environmental degradation, atmospheric pollution, and climatic alterations [
1,
2,
3]. This paradigm has generated increased awareness regarding the necessity for innovative transport solutions that minimize adverse environmental impacts while optimizing operational efficiency, accessibility, and social equity. The United Nations (UN), comprising 193 member states, adopted the 2030 Agenda for Sustainable Development in 2015, outlining 17 goals [
4,
5]. Among them, SDG 11 emphasizes the creation of inclusive, safe, resilient, and sustainable urban environments [
6]. This comprehensive objective encompasses the advancement of sustainable transportation systems, addressing the mobility requirements of vulnerable demographics, implementing effective pollution management strategies, and establishing accessible green environmental spaces [
7]. It should therefore respond to the requirements of all population groups, including school-aged children.
In this context, the choice of student transport modes under diverse weather conditions has become an important research topic, necessitating insightful studies of the everyday travel behavior and overall transport systems of the study area. Understanding individuals’ patterns and choices regarding transportation and commuting is crucial for effective transportation planning and sustainable development. Such research involves factors such as weather conditions, mode of transportation, travel distance, cost, travel time, frequency, and even purpose. The mode choice for school travel is crucial as it is influenced by students’ overall travel behavior and transportation patterns. Understanding the factors that affect mode choice for school trips is essential for developing policies and initiatives that promote safe, efficient, and sustainable school travel. Research has identified various factors influencing this decision-making process, including proximity to school, availability and accessibility of transportation options, travel time, cost considerations, safety concerns, and environmental factors [
8,
9,
10]. For example, the availability of dedicated school buses or public transit options significantly impacts students’ mode choices, with convenience and reliability, along with distance and travel time, playing crucial roles. Additionally, individual and household characteristics, such as the presence of a personal vehicle, can influence mode choice decisions [
11]. Understanding these preferences and behaviors can inform transportation planning and policymaking, leading to the creation of safer and more efficient school transportation systems. By promoting sustainable modes of transportation, such as walking, cycling, or using public transit, policymakers can reduce traffic congestion, promote physical activity, and improve air quality around schools [
12,
13,
14].
This research focuses on Chiang Rai province, a border city located in northern Thailand, which offers a unique and compelling context for examining school travel behavior due to its distinctive geographic, environmental, and socio-transport characteristics. Unlike Thailand’s capital or economically dominant urban centers, Chiang Rai represents a secondary city with evolving urbanization patterns, limited public transportation infrastructure, and high dependence on informal and private transport modes, particularly motorcycles. These characteristics render it an ideal setting to investigate the complexities of school trip mode choice, especially under environmentally adverse conditions. Chiang Rai frequently experiences adverse environmental conditions, including seasonal haze from agricultural burning (PM2.5) and heavy rainfall during the monsoon season, which significantly disrupt travel reliability and safety. These environmental stressors, combined with a lack of resilient mobility infrastructure, create a highly relevant context for analyzing behavioral shifts in school travel under normal and adverse conditions. Additionally, several extra-large secondary schools within the urban core provide access to a diverse and sizable student population, enabling a robust statistical analysis of mode choice patterns. By selecting the Chiang Rai urban area in Chiang Rai province as the study area, this research not only addresses a critical knowledge gap in transport behavior literature related to climatically vulnerable and infrastructure-constrained regions but also generates insights with broader applicability to similarly situated secondary cities across Southeast Asia.
2. Literature Review
2.1. Travel Behavior Under Adverse Conditions
Adverse environmental conditions are increasingly recognized as a key factor in determining travel behavior, particularly as cities around the world face mounting challenges from climate variability and extreme weather events. Environmental disruptions, including both short-term weather anomalies and chronic atmospheric stressors, can have significant implications for daily mobility patterns, mode choice, and transport system performance [
15]. These effects are especially pronounced in contexts where infrastructure resilience is limited and modal alternatives are constrained, such as in low- and middle-income countries (LMICs) and secondary cities [
16]. Adverse weather conditions are commonly defined in the transport literature as environmental phenomena that deviate from normal climatic expectations and hinder travel safety, efficiency, and comfort. These conditions include, but are not limited to, heavy rainfall, strong winds, fog, snow, extreme temperatures, and reduced visibility [
17]. More recently, air pollution, particularly elevated concentrations of fine particulate matter, has been increasingly recognized within this category due to its atmospheric nature and direct impact on mobility decisions [
18]. While traditionally excluded from meteorological classifications, air pollution shares key behavioral characteristics with adverse weather, such as reducing the desirability of active travel modes and increasing the perceived risk of exposure for vulnerable users [
19]. As such, adverse weather is best understood not only through physical metrics but also in terms of its social and behavioral consequences on the transportation system [
20].
Empirical research has consistently demonstrated that adverse weather influences a wide range of travel behaviors. Rain and snow have been shown to reduce the use of active modes such as walking and cycling, particularly when protective infrastructure is lacking or when users perceive elevated risk [
21]. Wind and extreme temperatures can similarly discourage outdoor travel or prompt shifts to more enclosed modes [
22]. In urban settings, poor weather conditions are also associated with longer travel times, increased congestion, and decreased service reliability for public transport [
23]. These outcomes often lead to behavioral adaptations such as rescheduling trips, modifying routes, or switching modes. Importantly, these adjustments are not equally accessible to all travelers [
24]. Individuals with access to private vehicles or flexible schedules may adapt more easily, whereas others, especially students, the elderly, or low-income commuters, may face disproportionate disruptions and exposure [
25].
School travel offers a particularly relevant lens through which to examine the impact of adverse weather, as students typically have fixed schedules and may rely on modes that are highly sensitive to environmental variability, such as walking or motorcycles [
26]. Where formal school transport services are unavailable, many students remain dependent on informal or unsafe travel arrangements, amplifying their vulnerability during environmental disturbances. Despite growing awareness of these dynamics, there remains a paucity of research focusing on how adverse weather affects school travel behavior in peripheral urban areas and developing regions [
27]. Most existing studies are situated in high-income metropolitan contexts, with limited attention given to high-school students in secondary cities who face distinctive infrastructural and environmental vulnerabilities. This study fills this gap by jointly examining the travel behavior of high-school students under normal and adverse weather conditions in Chiang Rai, a secondary city in northern Thailand. In doing so, it contributes to a more nuanced understanding of climate-sensitive mobility and highlights the need for resilient and equitable transport planning in vulnerable urban settings.
2.2. Commuting to School
Parents’ choices of school travel modes are primarily influenced by considerations of convenience and safety, with behavioral costs and time constraints playing pivotal roles in their decision-making process [
28]. The observed trend of a sharp increase in driving children to school since 1969, juxtaposed with a decline in walking, highlights the evolving dynamics of school commuting habits, where high school students’ reliance on driving has declined due to various factors, while school trips continue to represent a significant portion of American children’s travel [
29]. Moreover, gender disparities emerge, with males exhibiting a higher likelihood of walking and biking to school compared to females, a trend exacerbated by stronger parental mobility restrictions on females which consequently impact travel behavior [
30]. Further delineating factors influencing school transport mode choices, Dias et al. [
31] revealed the impact of gender, age, income, school type, and distance, with male students exhibiting preferences for public buses, walking, and private vehicles, while older students were found to be more inclined toward walking and school buses. Additionally, their study highlighted preferences among national or provincial school students for school buses over private vehicles, with distance to school significantly affecting all school transport modes. Addressing factors influencing car use, Zhang et al. [
32] emphasized the impact of car ownership, the quality of the walking environment, and rush hour dynamics, alongside preferences for walking among students in core zones and increased public transit usage with proximity to stations. Furthermore, Minh Ngoc et al. [
33] emphasized the significance of factors such as location, gender, age, and population density in school traffic crashes, which are particularly prevalent in urban areas and among females in Can Tho, Vietnam, necessitating a redesign of the road infrastructure for motorcycle users’ safety. Lastly, Li et al. [
34] elucidated the prevalence of active school travel among primary students in Shenzhen, attributing it to high-intensity land development and the significant influence of built environment factors on children’s choice of transportation.
2.3. Travel Mode Preferences
Parental attitudes play a crucial role in influencing younger teens’ mode choices for transportation, with socioeconomic and demographic variables being statistically less significant. Attitudinal variables are essential predictors of mode choice. In densely populated areas, walking and bicycling are more prevalent. Crime adversely affects public transit choices for younger teens [
35]. In Abbottabad, Pakistan, there are notable gender-based differences in mode choice preferences and travel characteristics for educational trips. Girls tend to prefer family cars and have more negative views regarding public transport compared to boys, who are more inclined toward using motorcycles, public transport, and ride-hailing services [
36]. Research in Mexico City highlighted transport-related inequalities among older adults, particularly concerning income class, gender, and access to public transportation. That study stressed the importance of understanding transport-related exclusion in the Global South and among different societal groups, providing insights applicable to other global cities [
37]. A shift in mode choice for school trips has been observed, with a decline in active modes of transport leading to health issues, environmental concerns, congestion, and safety risks due to increased vehicle use. This underscores the need to understand factors influencing mode choice and accompaniment decisions for school trips [
38]. Tourist transport mode choices at destinations are significantly influenced by travel time, cost, party composition, trip purpose, fitness level, knowledge about long-distance travel, mobility options at the destination, and weather conditions. Tourists show inelasticity to travel cost changes, prioritizing transit service quality over price [
39]. Residential preferences strongly impact travel behavior, even in homogeneous neighborhoods, leading to differences in daily mode use. Inner-city neighborhoods encourage even car-preferring households to use alternative modes of transport. Urban planning policies should adapt to the needs and preferences of future residents to attract a diverse population, as new inner-city areas tend to draw residents from other inner-city locations rather than suburban areas [
40]. In the context of Thailand, several studies have explored mode choice selection in both urban and regional settings. Arreeras et al. [
41] conducted a study on factors affecting mode selection in terms of accessing railway stations in Nakhon Ratchasima, emphasizing the critical role of private vehicle availability, travel convenience, and trip purpose in shaping access mode decisions among intercity rail users. Their findings highlighted how proximity, infrastructure quality, and personal mobility resources significantly influence modal selection, particularly in semi-urban and peri-urban environments, paralleling the patterns observed among school commuters in border cities such as Chiang Rai. Complementing this, Chansuk et al. [
42] utilized exploratory and confirmatory factor analysis to evaluate behavioral shifts in the wake of COVID-19, focusing on domestic tourism in Thailand. Their study demonstrated how latent variables such as health concerns, perceived risk, and accessibility influence travel choices, reinforcing the value of multi-dimensional analytical approaches in efforts to understand evolving mobility behaviors. These studies emphasized the methodological and contextual relevance of using quantitative tools such as MNL and factor analysis to record nuanced transport decisions. Previous studies on school commuting and travel mode choice perspectives are represented in
Table 1.
3. Methodology
3.1. Study Area
Chiang Rai Province in northern Thailand is a diverse region encompassing urban, suburban, and rural areas. The study area is Chiang Rai district, which is an urban area of Chiang Rai Province, one of the 18 most populous districts in Chiang Rai Province, with an area of 1216 km
2 and a total population of 125,340 people out of 785,252 people in Chiang Rai Province in total [
53]. The Chiang Rai urban area provides a unique and intriguing context to understand transportation mode choices and decision-making processes among students and their parents or guardians concerning mode selection for school trips. This study presents a range of transportation options for school trips, including active transport, motorcycles, school buses, and private vehicles. The mode choice study’s focus was on “extra-large” schools in the Chiang Rai urban area. This setting was chosen to shed light on the factors influencing transportation decisions for school trips in this specific geographic context, exploring the significance of various attributes such as travel distance, travel time, cost considerations, safety perceptions, convenience, and environmental concerns.
3.2. Sample and Data Collection
The target population for this study comprised senior high school students enrolled in extra-large schools within the Chiang Rai urban area. In the Thai education system, school sizes are officially classified into four categories: small, medium, large, and extra-large, based on student enrollment numbers. An extra-large school is defined as having more than 1680 students [
54]. Based on this criterion, six schools qualified and were selected for inclusion in the study [
55]. The distribution of the senior high school population and the corresponding sample size across these schools is presented in
Table 2. The required sample size was calculated using Taro Yamane’s formula [
56], as shown in Equation (1), with margin of error
e set at 0.05. The calculation was based on the total senior high school student population across the six identified schools, yielding a minimum required sample size of 380 students.
where
N represents the population size,
n denotes the sample size, and
e is the margin of error. Data collection was carried out through on-site surveys administered directly within each selected school. A random sampling technique was employed to select senior high school students, and responses were recorded using paper-based survey forms. Ultimately, a total of 472 valid responses were collected, exceeding the minimum sample size requirement and thereby enhancing the robustness of the dataset. Any questionnaires with incomplete or missing information were removed during the data cleaning process to ensure statistical reliability. The data collection was conducted from January to February 2024, during the regular academic term, which coincided with typical seasonal weather variations including haze and occasional rainfall events in the Chiang Rai region.
3.3. Instrument Design
The questionnaire was developed to investigate the mode choice behavior of senior high school students for commuting to school, along with the factors influencing transportation mode selection. The instrument was designed based on an extensive review of relevant literature and adapted from associated research to ensure construct validity. To accommodate the diverse nationalities of participants, the questionnaire was prepared in both Thai and English languages. The questionnaire was developed in English and translated into Thai using a forward–backward translation method to ensure conceptual accuracy. Discrepancies were resolved through expert review. A pilot test with 30 students was conducted to assess clarity, resulting in minor revisions before full implementation. Ethical approval for the study was obtained from the Mae Fah Luang University Ethics Committee on Human Research. The questionnaire comprised two primary sections. The first section collected respondent demographic characteristics, including gender, age, grade level, weekly pocket money, parents’ employment status, monthly household income, number of family members, household car ownership, household motorcycle ownership, number of people commuting to school together, type of current residence, and proximity to public transportation points. The second section focused on travel behavior and travel characteristics related to travel distance, access time, and waiting time; these data were obtained through self-reported responses using predefined categorical intervals. Household vehicle ownership (car and motorcycle) was recorded as binary variables. While geospatial data collection was not implemented, self-reporting allowed for practical and context-relevant measurement within the school setting
In this study, respondents were asked to identify their predominant mode of school travel under two distinct environmental scenarios, i.e., normal weather and adverse weather conditions, from a set of four discrete alternatives: active transport, motorcycle, school bus, and private vehicle. Each participant selected a single, most frequently used mode per condition, consistent with discrete choice modeling conventions, thereby enabling robust Multinomial Logit (MNL) estimation. The questionnaire was designed to capture context-sensitive behavioral shifts, with adverse weather being defined as periods characterized by either heavy rainfall or elevated PM2.5 haze levels, both of which are recurrent in Chiang Rai’s monsoon and agricultural burning seasons. Rather than relying on specific meteorological events, the survey invited students to reflect on their usual mode choices under such conditions, based on lived experience and perception. This approach ensured consistency in survey administration while allowing for a comparative assessment of travel behavior under climatologically relevant stressors.
3.4. Multinomial Logit Model (MNL)
In this study, the Multinomial Logit Model (MNL) was employed to investigate the determinants influencing individuals’ mode choice behavior [
57,
58]. The MNL framework assumed that each traveler would select the alternative that offered the highest utility among a finite set of discrete travel modes [
59], while this study evaluated four primary travel modes: active transport, motorcycle, school bus, and private vehicle. The MNL assumed that each alternative
i had an associated utility
which consisted of a systematic (observable) component
and a random (unobservable) component
, decomposed into two components, as represented in Equation (2):
The systematic component
was typically modeled as a linear function of observed attributes of the alternative and characteristics of the decision-maker (Equation (3)):
where
β is a vector of parameters to be estimated and
is a vector of explanatory variables concerning the utility associated with a particular travel mode. Assuming the error terms
were independently and identically distributed with a Gumbel distribution led to the closed-form choice probability expression (Equation (4)):
where
is the probability that individual
n selects alternative
i among
J available modes. This formulation offered significant computational simplicity and allowed for straightforward estimations using maximum likelihood techniques. While the MNL model assumes independence of irrelevant alternatives (IIA), it offers straightforward interpretability and is suitable for modeling school travel behavior in exploratory contexts. It enabled the quantification of how socio-demographic factors (e.g., income, vehicle ownership) and trip attributes (e.g., travel time, travel cost) systematically influenced the probability of selecting each mode. Moreover, it facilitated the estimation of elasticities and marginal effects, providing critical insights for transport policy and infrastructure planning [
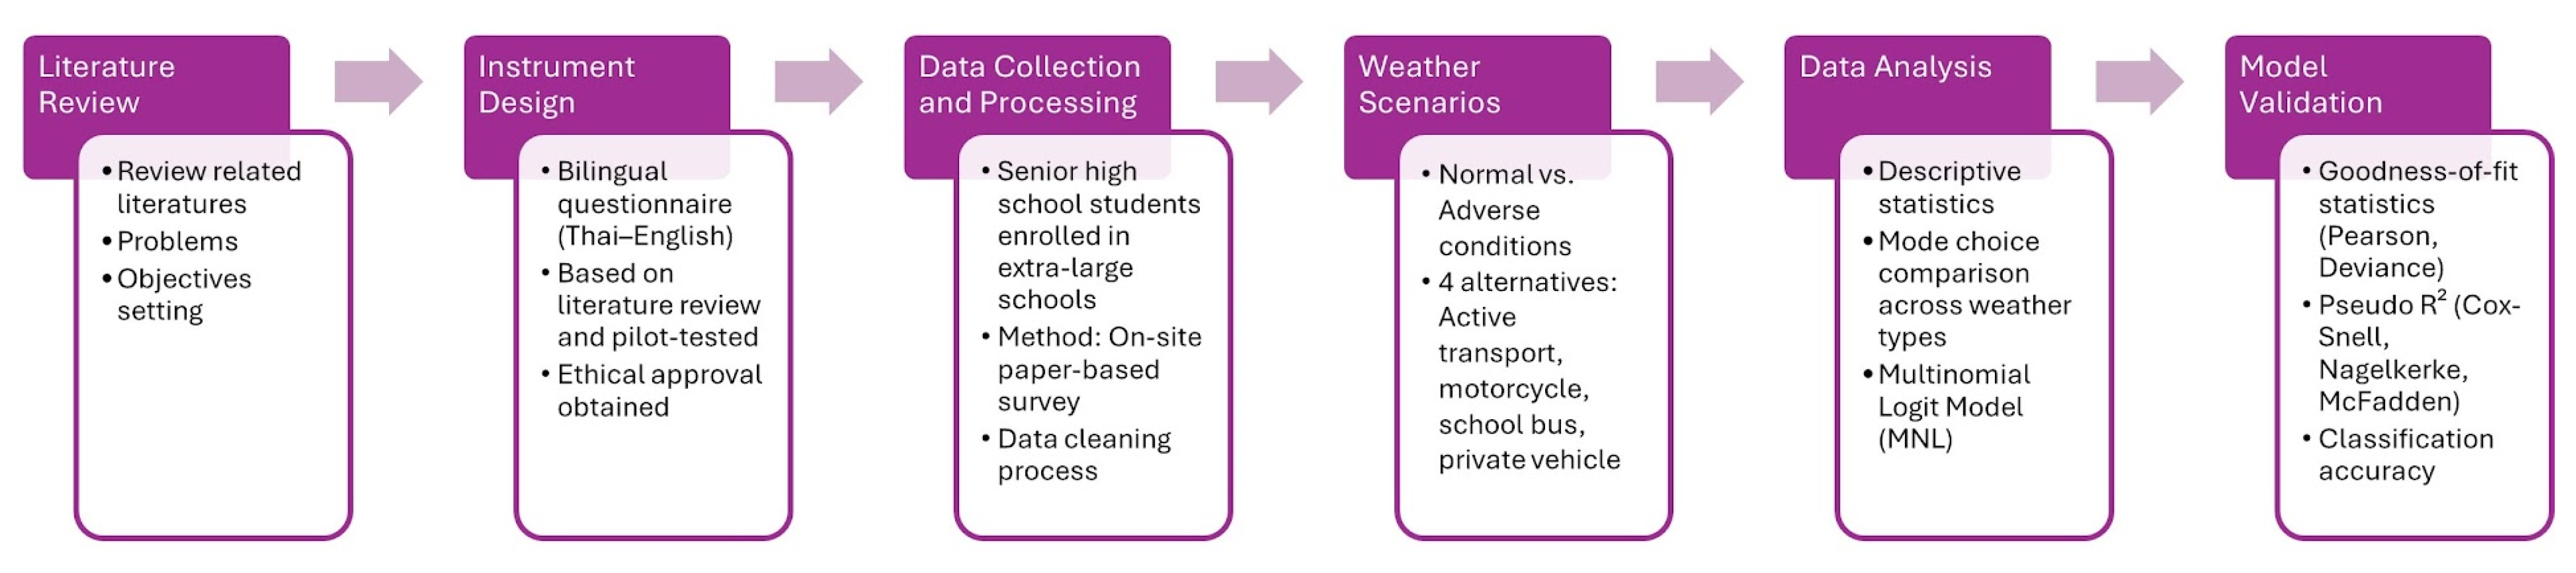
59]. The overall research framework guiding this analytical process is presented in
Figure 1.
4. Results
4.1. Sample Characteristics
The demographic profiles of the 472 respondents in
Table 3 revealed key insights into their socio-economic backgrounds, which were likely to influence their travel behavior. The sample was predominantly female (70.3%), with students mostly aged between 16 and 18 years, reflecting the typical age range for senior high school levels. The distribution across grades was relatively balanced, with a slight concentration in Grade 10 (39.8%), suggesting that younger students were more represented in the survey. In terms of economic factors, nearly half of the students reported receiving less than 500 THB (14 USD) in weekly pocket money, highlighting potential financial constraints that could impact transportation choices. Interestingly, despite the modest pocket money, a significant proportion of students came from households where both parents were employed (87.7% for both mothers and fathers), indicating dual-income families. However, household incomes varied considerably, with almost half of the earnings being below 30,000 THB (857 USD) monthly, suggesting economic diversity within the sample. Household composition and vehicle ownership further reflected socioeconomic conditions. Most families consisted of 3–4 members, which may have influenced the shared transportation dynamics. High rates of motorcycle ownership (94.5%) and substantial car ownership (85%) indicated strong access to private vehicles, potentially reducing reliance on public transportation. Additionally, most students resided in urban areas (62.1%), which likely offered greater access to diverse transportation modes compared to their suburban counterparts (37.9%). Collectively, these demographic and socio-economic factors provided a nuanced understanding of the respondents, offering a foundational context for analyzing travel behavior and mode choice decisions in subsequent sections of the study.
4.2. Mode Choice Preference Under Weather Conditions
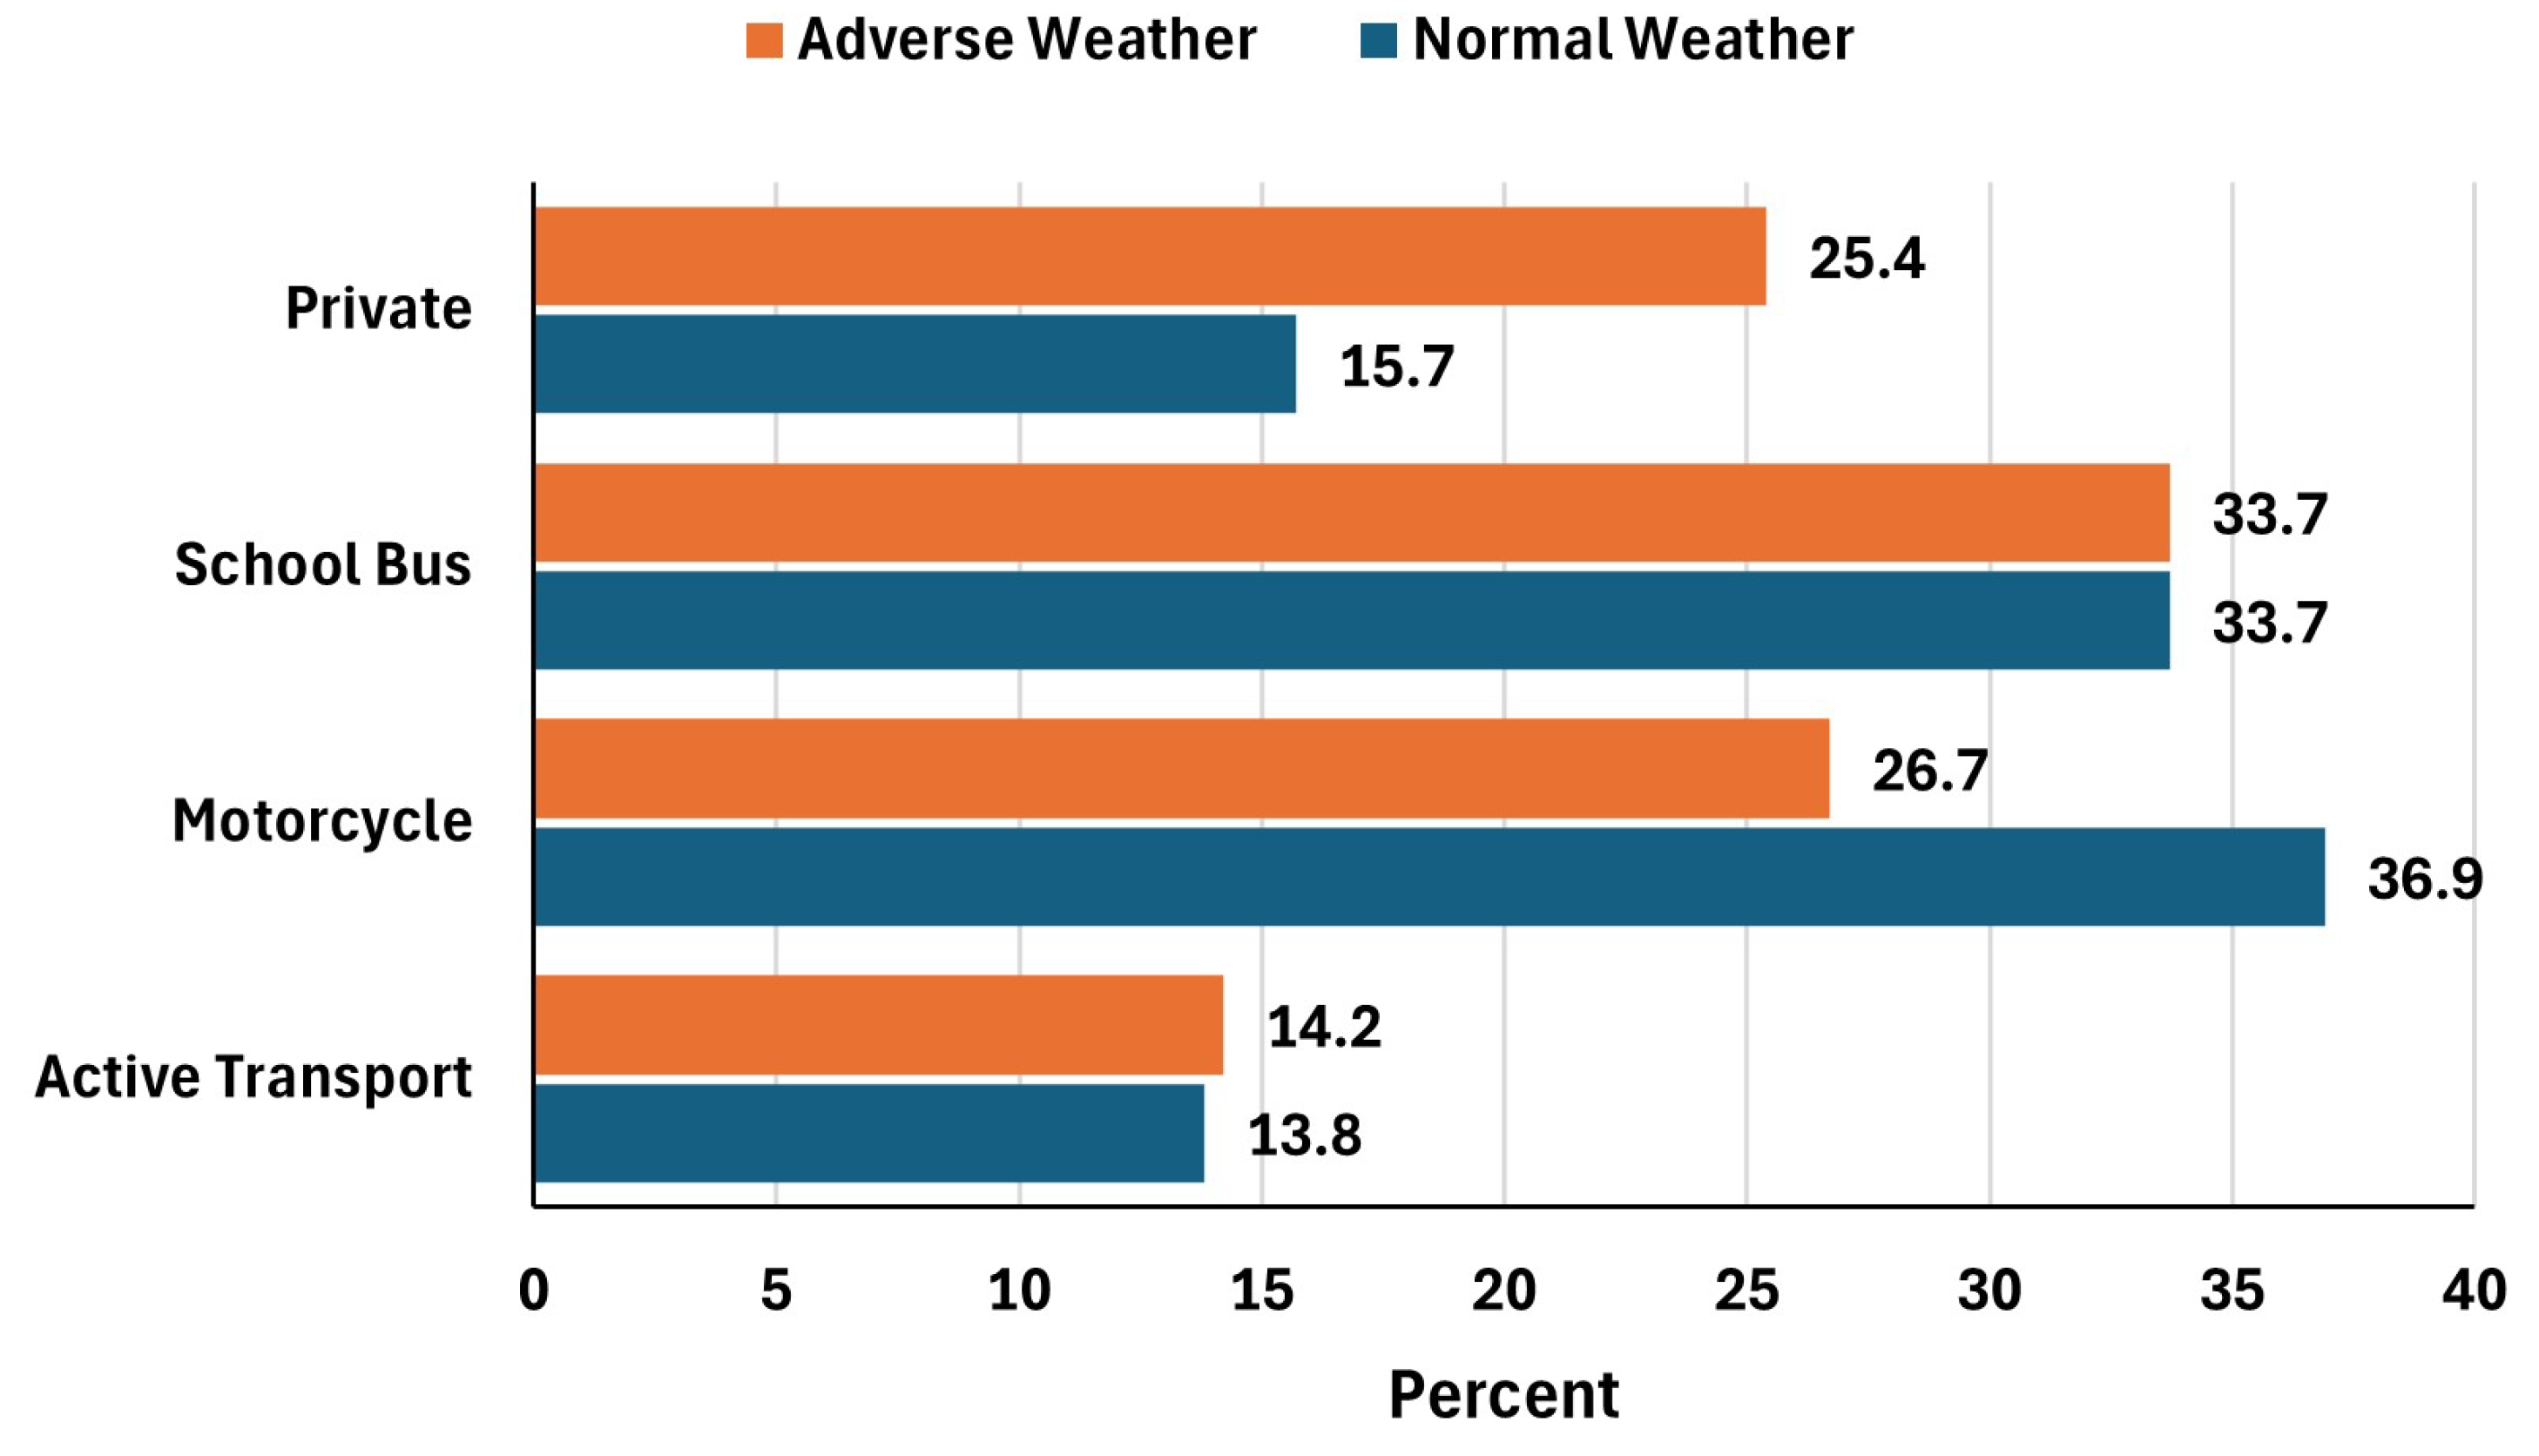
The analysis of travel mode preferences revealed notable shifts due to weather variability, as represented in
Figure 2. Under normal conditions, motorcycle usage dominated at 36.9%, reflecting the popularity of two-wheeled transport for short- to mid-distance school trips. However, this proportion significantly decreased to 26.7% during adverse weather, indicating sensitivity to safety and comfort risks. School bus usage remained stable at 33.7% across both conditions, highlighting its resilience and reliability. Active transport slightly increased from 13.8% to 14.2%, likely representing students living within close proximity to school who continued to walk despite unfavorable weather. Conversely, private vehicle use rose substantially from 15.7% to 25.4% under adverse conditions, suggesting that families with private car access switched to safer travel options. These shifts emphasized the critical role of structured transport services and the inequities in modal flexibility during environmental disruptions.
4.3. Monthly Travel Cost Analysis
The analysis of monthly travel costs in
Figure 3 shows that the majority of students incurred low expenses, with 29.9% spending less than 100 THB (3 USD) under normal weather, rising slightly to 31.4% during adverse weather. Mid-range spenders 101–500 THB (3–14 USD) decreased from 20.3% to 18.4%, suggesting possible travel consolidation or mode shifts to maintain affordability. Costs in the 501–1000 THB (14–29 USD) and 1001–1500 THB (29–43 USD) ranges remained stable, indicating resilience among students using structured or private transport. Only 3.6% of students consistently spent over 1500 THB (43 USD) monthly, reflecting long-distance or premium transport reliance. Overall, while most students’ travel expenses were stable, adverse weather slightly increased cost burdens for moderate spenders, highlighting the need for affordable and weather-resilient school transport options.
4.4. Trip Characteristics of Normal and Adverse Weather Conditions
4.4.1. Travel Time from Residence to Nearest Pick-Up Point
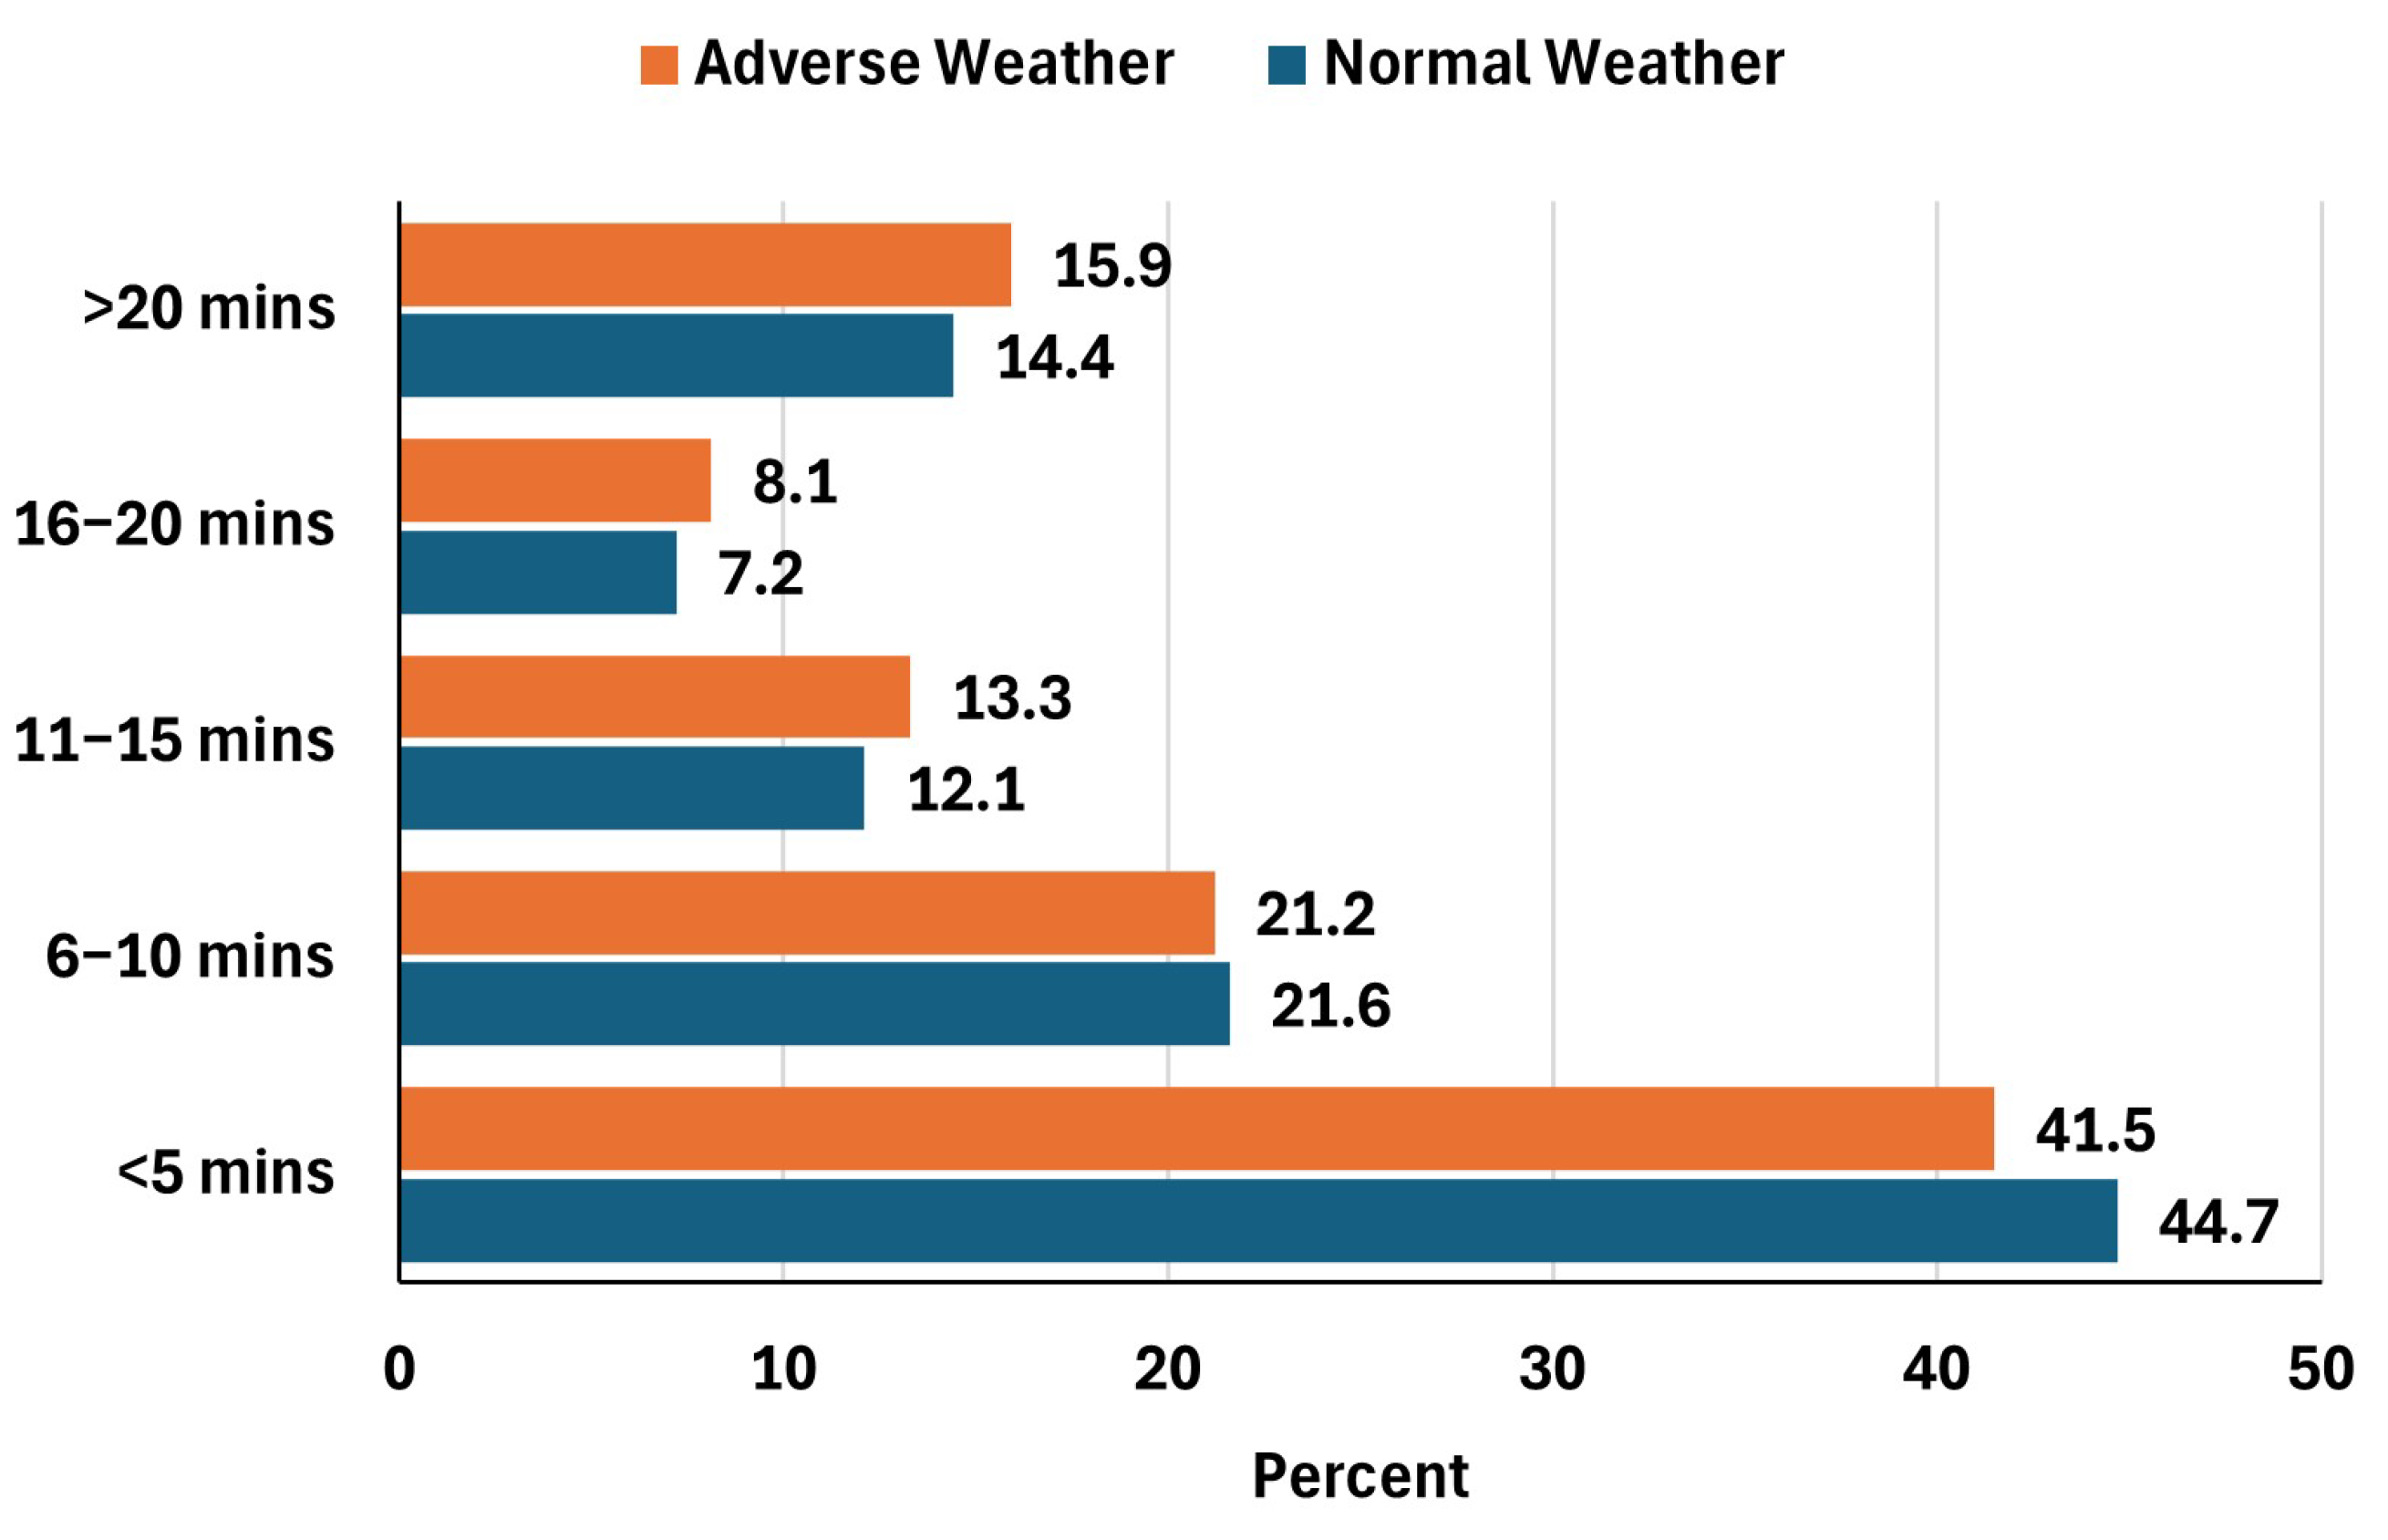
Our analysis of travel times from students’ residences to the nearest pick-up points under normal and adverse weather conditions is illustrated in
Figure 4. Under normal weather, 44.7% of students reached the pick-up point within five minutes, indicating a high level of spatial accessibility. However, during adverse weather, this proportion decreased slightly to 41.5%, suggesting that inclement conditions may have either impeded direct access or encouraged students to seek safer, although more distant, boarding points. The proportion of students requiring 6–10 min remained relatively stable (21.6% to 21.2%), highlighting resilience in moderate accessibility ranges. Notably, the share of students requiring longer travel times (11–15 min, 16–20 min, and >20 min) increased across all categories during adverse conditions. Particularly, the proportion of students traveling more than 20 min rose from 14.4% to 15.9%, reflecting weather-induced spatial displacement.
These findings highlight latent vulnerabilities in school transport accessibility, emphasizing the need for enhanced first-mile infrastructure and adaptive transport services during adverse environmental events.
4.4.2. Waiting Time Pick-Up Point
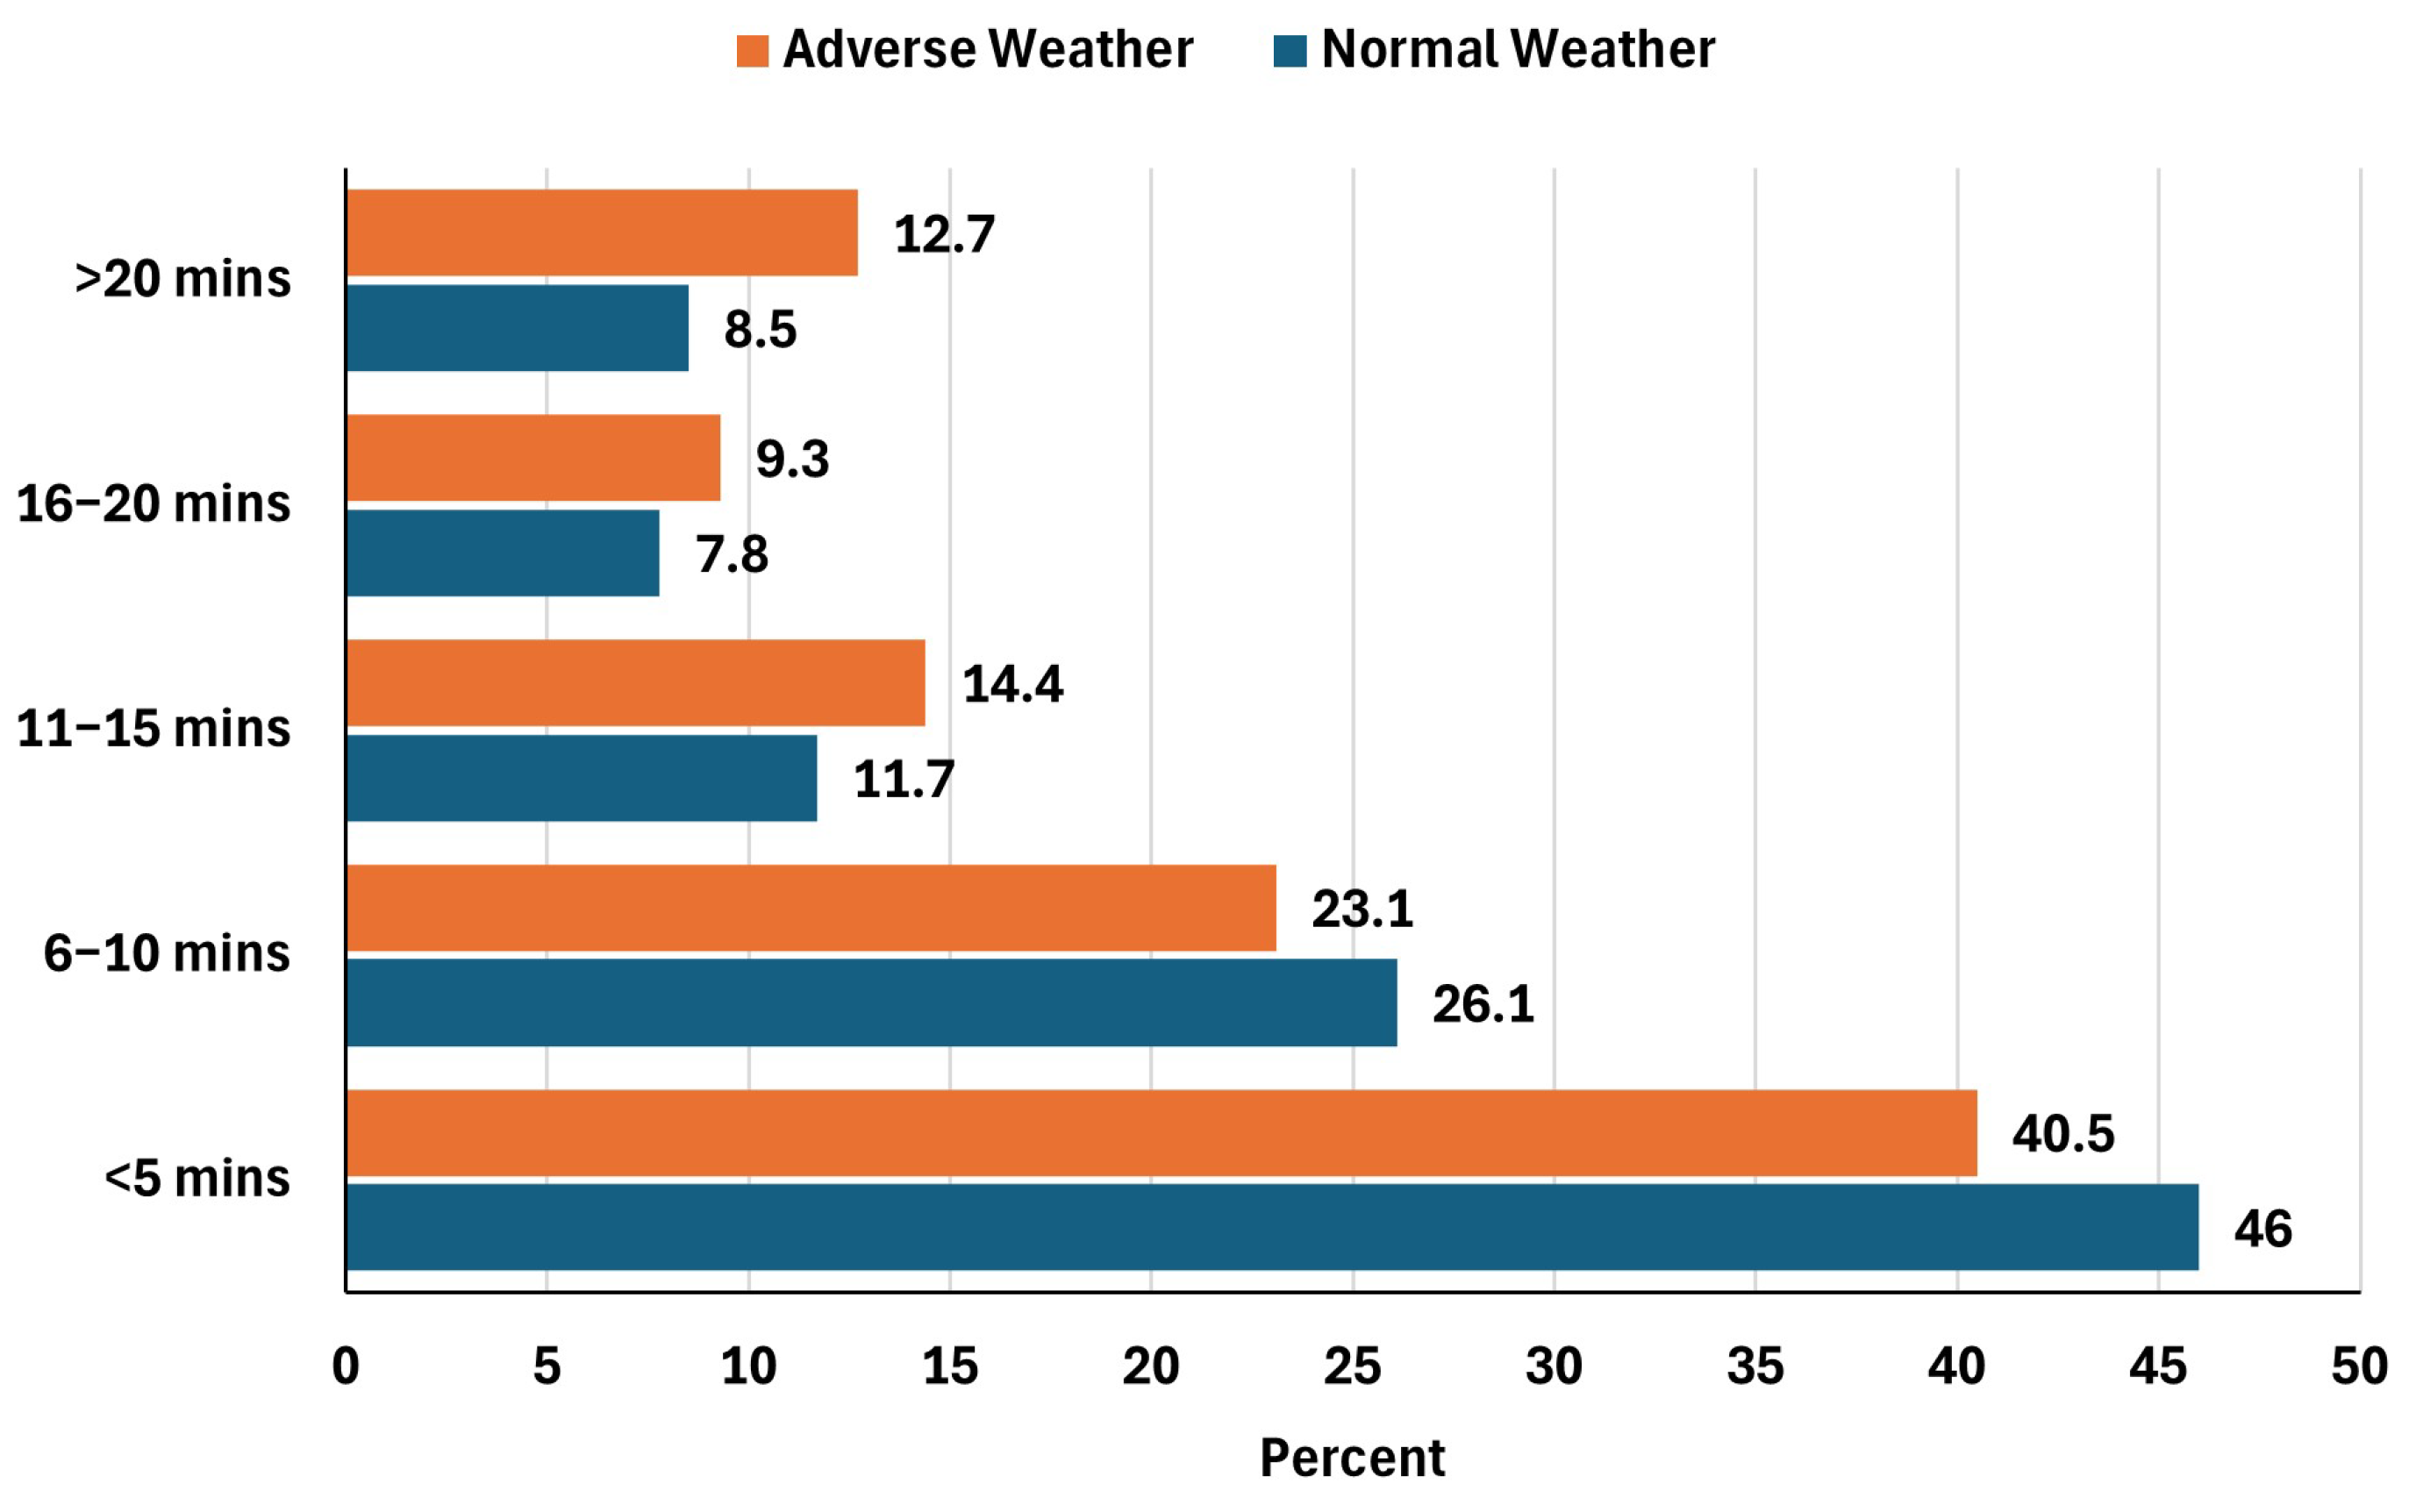
Figure 5 presents the distribution of waiting times for the bus at pick-up points under normal and adverse weather conditions. Under normal weather, 46% of students waited less than five minutes, indicating high operational efficiency and punctuality of the transport system. However, during adverse weather, this proportion dropped to 40.5%, highlighting weather-induced service disruptions. Similarly, the share of students waiting 6–10 min declined from 26.1% to 23.1%. In contrast, longer waiting times increased across all categories. Notably, the proportion of students waiting more than 20 min rose from 8.5% to 12.7%, representing a substantial 50% relative increase. Additionally, the proportion waiting 11–15 min and 16–20 min also rose, reflecting systemic delays caused by adverse environmental conditions, such as traffic congestion, reduced vehicle speed, or route adjustments. These findings suggest that inclement weather significantly deteriorates transport service reliability, underscoring the need for adaptive scheduling and infrastructure improvements to enhance resilience in student commuting patterns.
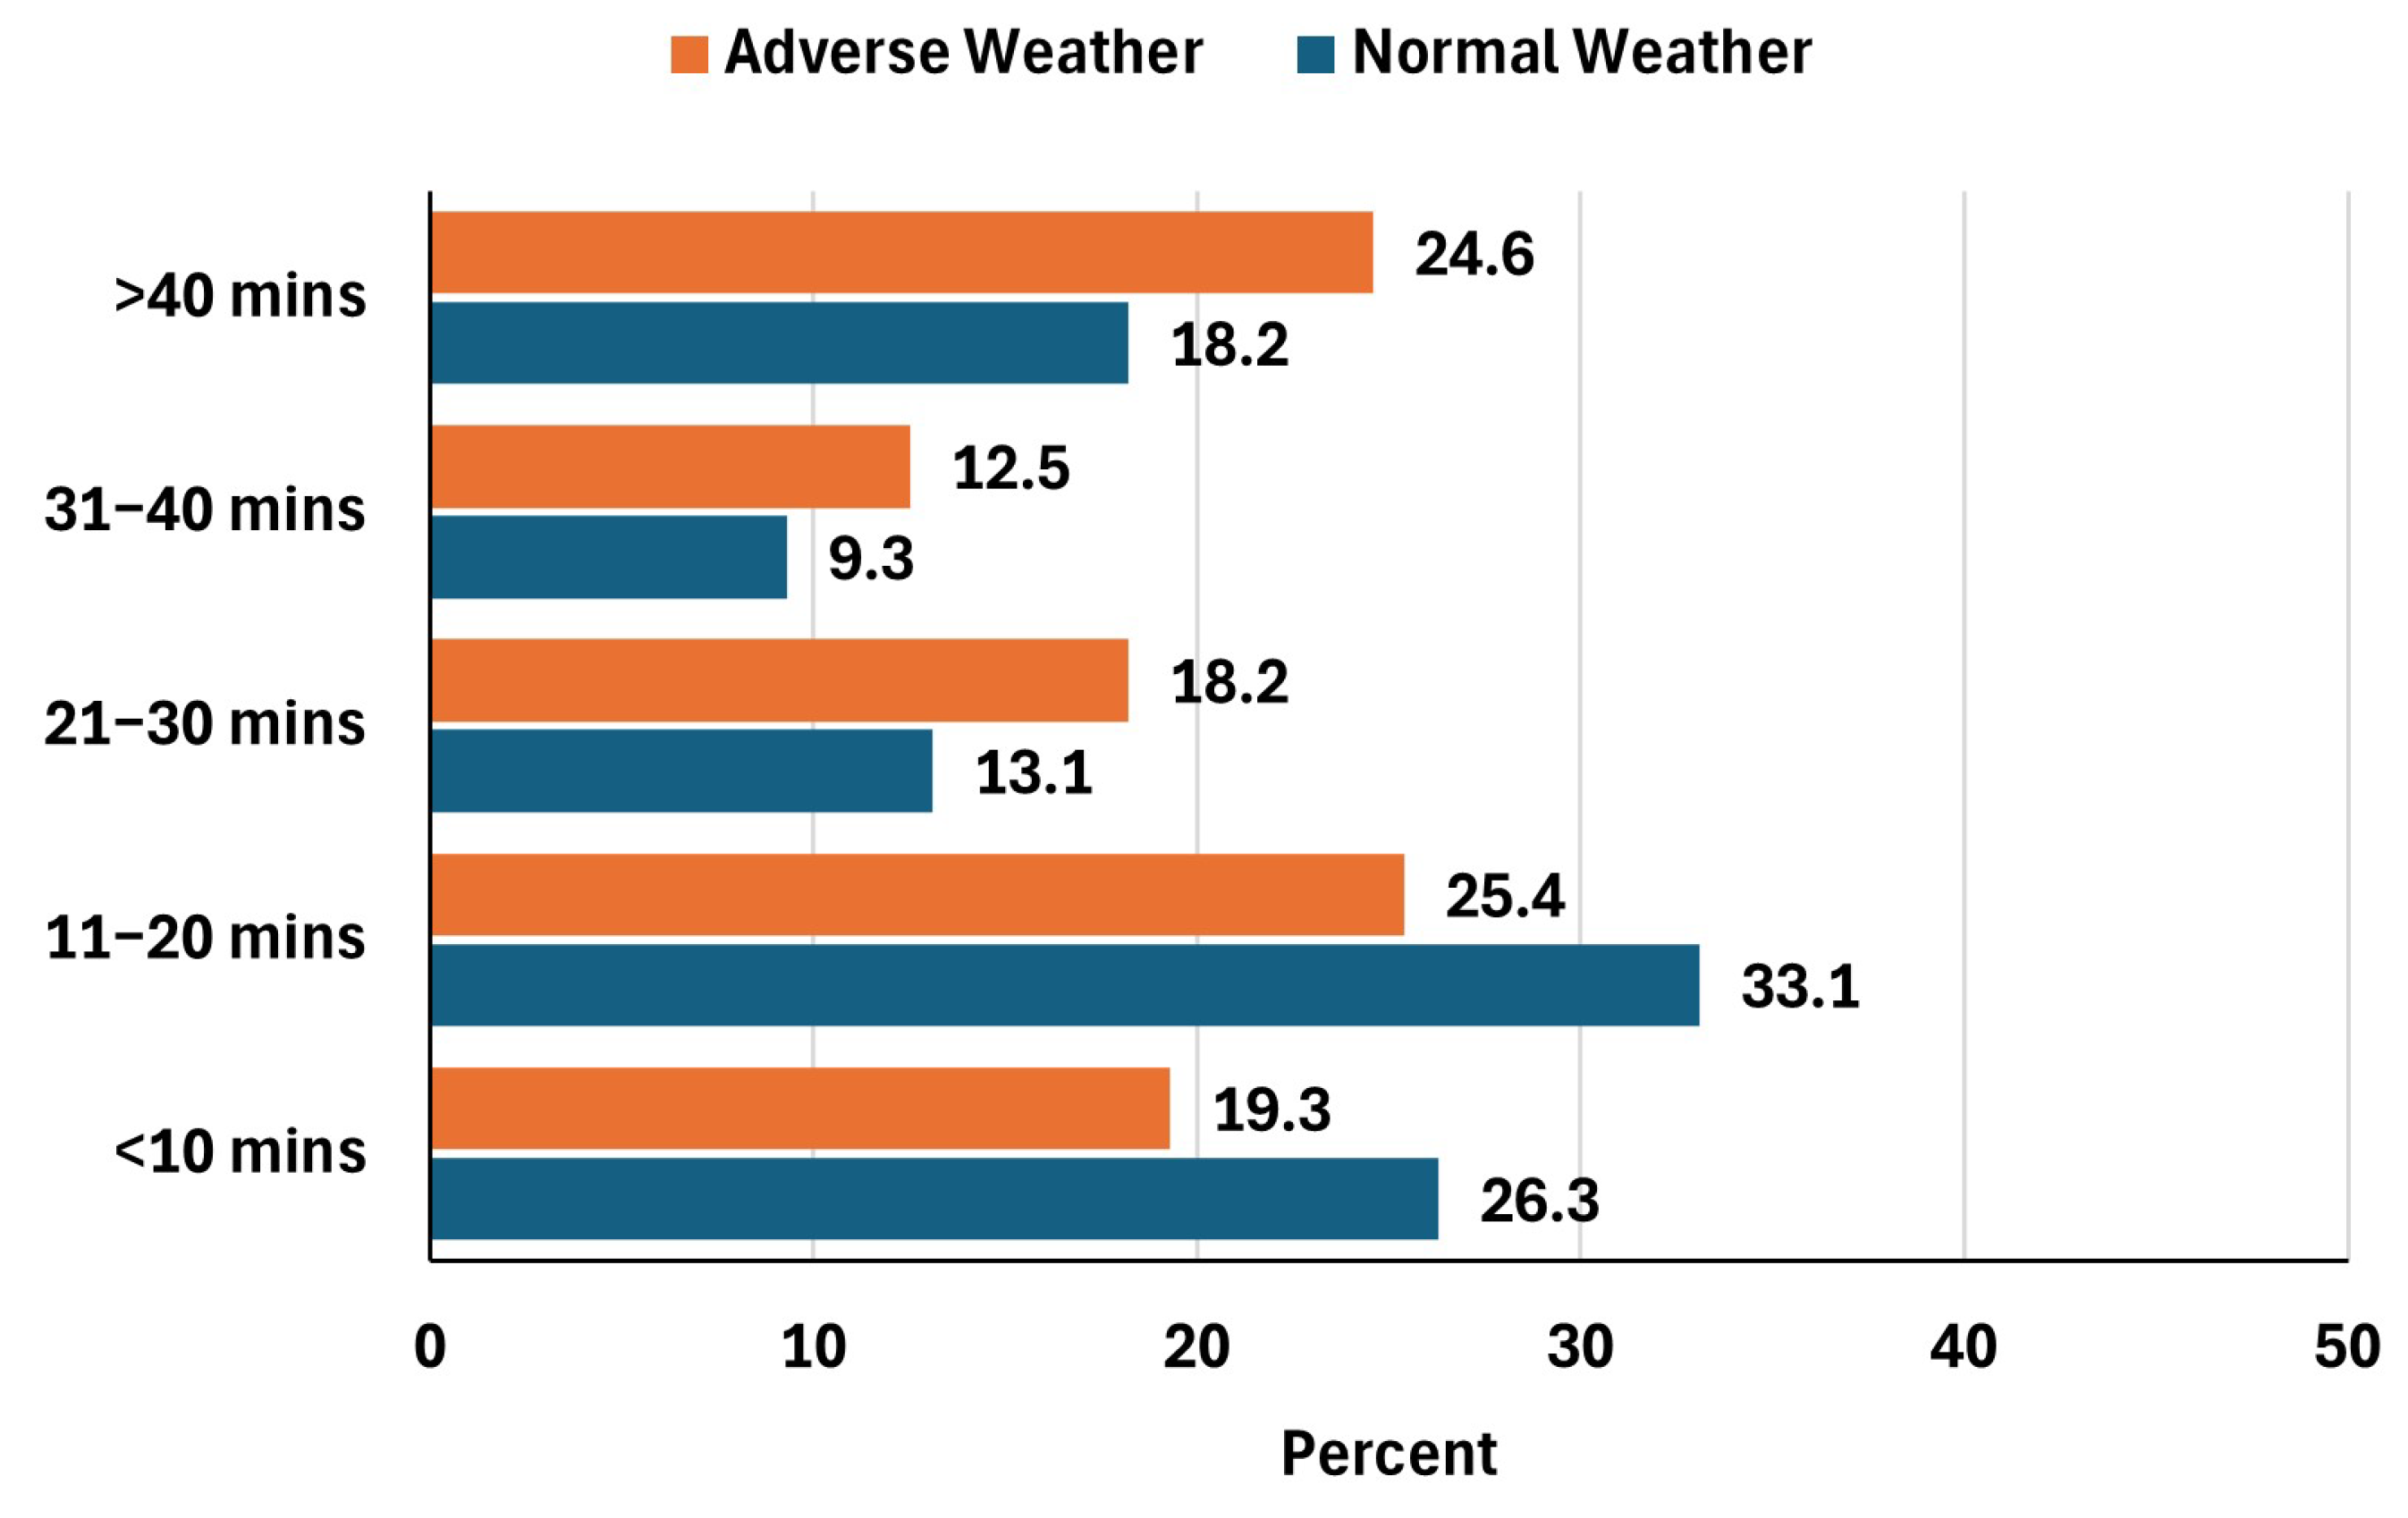
4.4.3. Travel Time to School
Total travel time to school under different weather conditions, as illustrated in
Figure 6, revealed that under normal weather conditions, a substantial proportion of students (59.4%) experienced relatively short commutes, with 26.3% traveling less than 10 min and 33.1% between 11–20 min. This suggested that, under typical circumstances, most school journeys were efficient, likely supported by stable transport modes and reliable scheduling. However, when weather conditions deteriorated, the proportion of students traveling under 20 min dropped significantly to 44.7%, a reduction of nearly 15 percentage points. This reduction signaled delays and increased inefficiencies in travel systems, potentially due to traffic congestion, reduced vehicle speeds, and changes in modal choice (e.g., avoidance of motorcycles or active transport). Interestingly, the percentage of students traveling between 21–30 min and beyond increased under adverse weather. The 21–30 min category rose from 13.1% to 18.2%, while those traveling more than 40 min palpably increased from 18.2% to 24.6%. These changes in travel time length indicated a systematic expansion of travel time to school in the face of environmental constraints, which may reflect rerouting, a shift in travel mode to slower but safer alternatives (e.g., from motorcycle to school bus), or increased waiting times for public or private transportation.
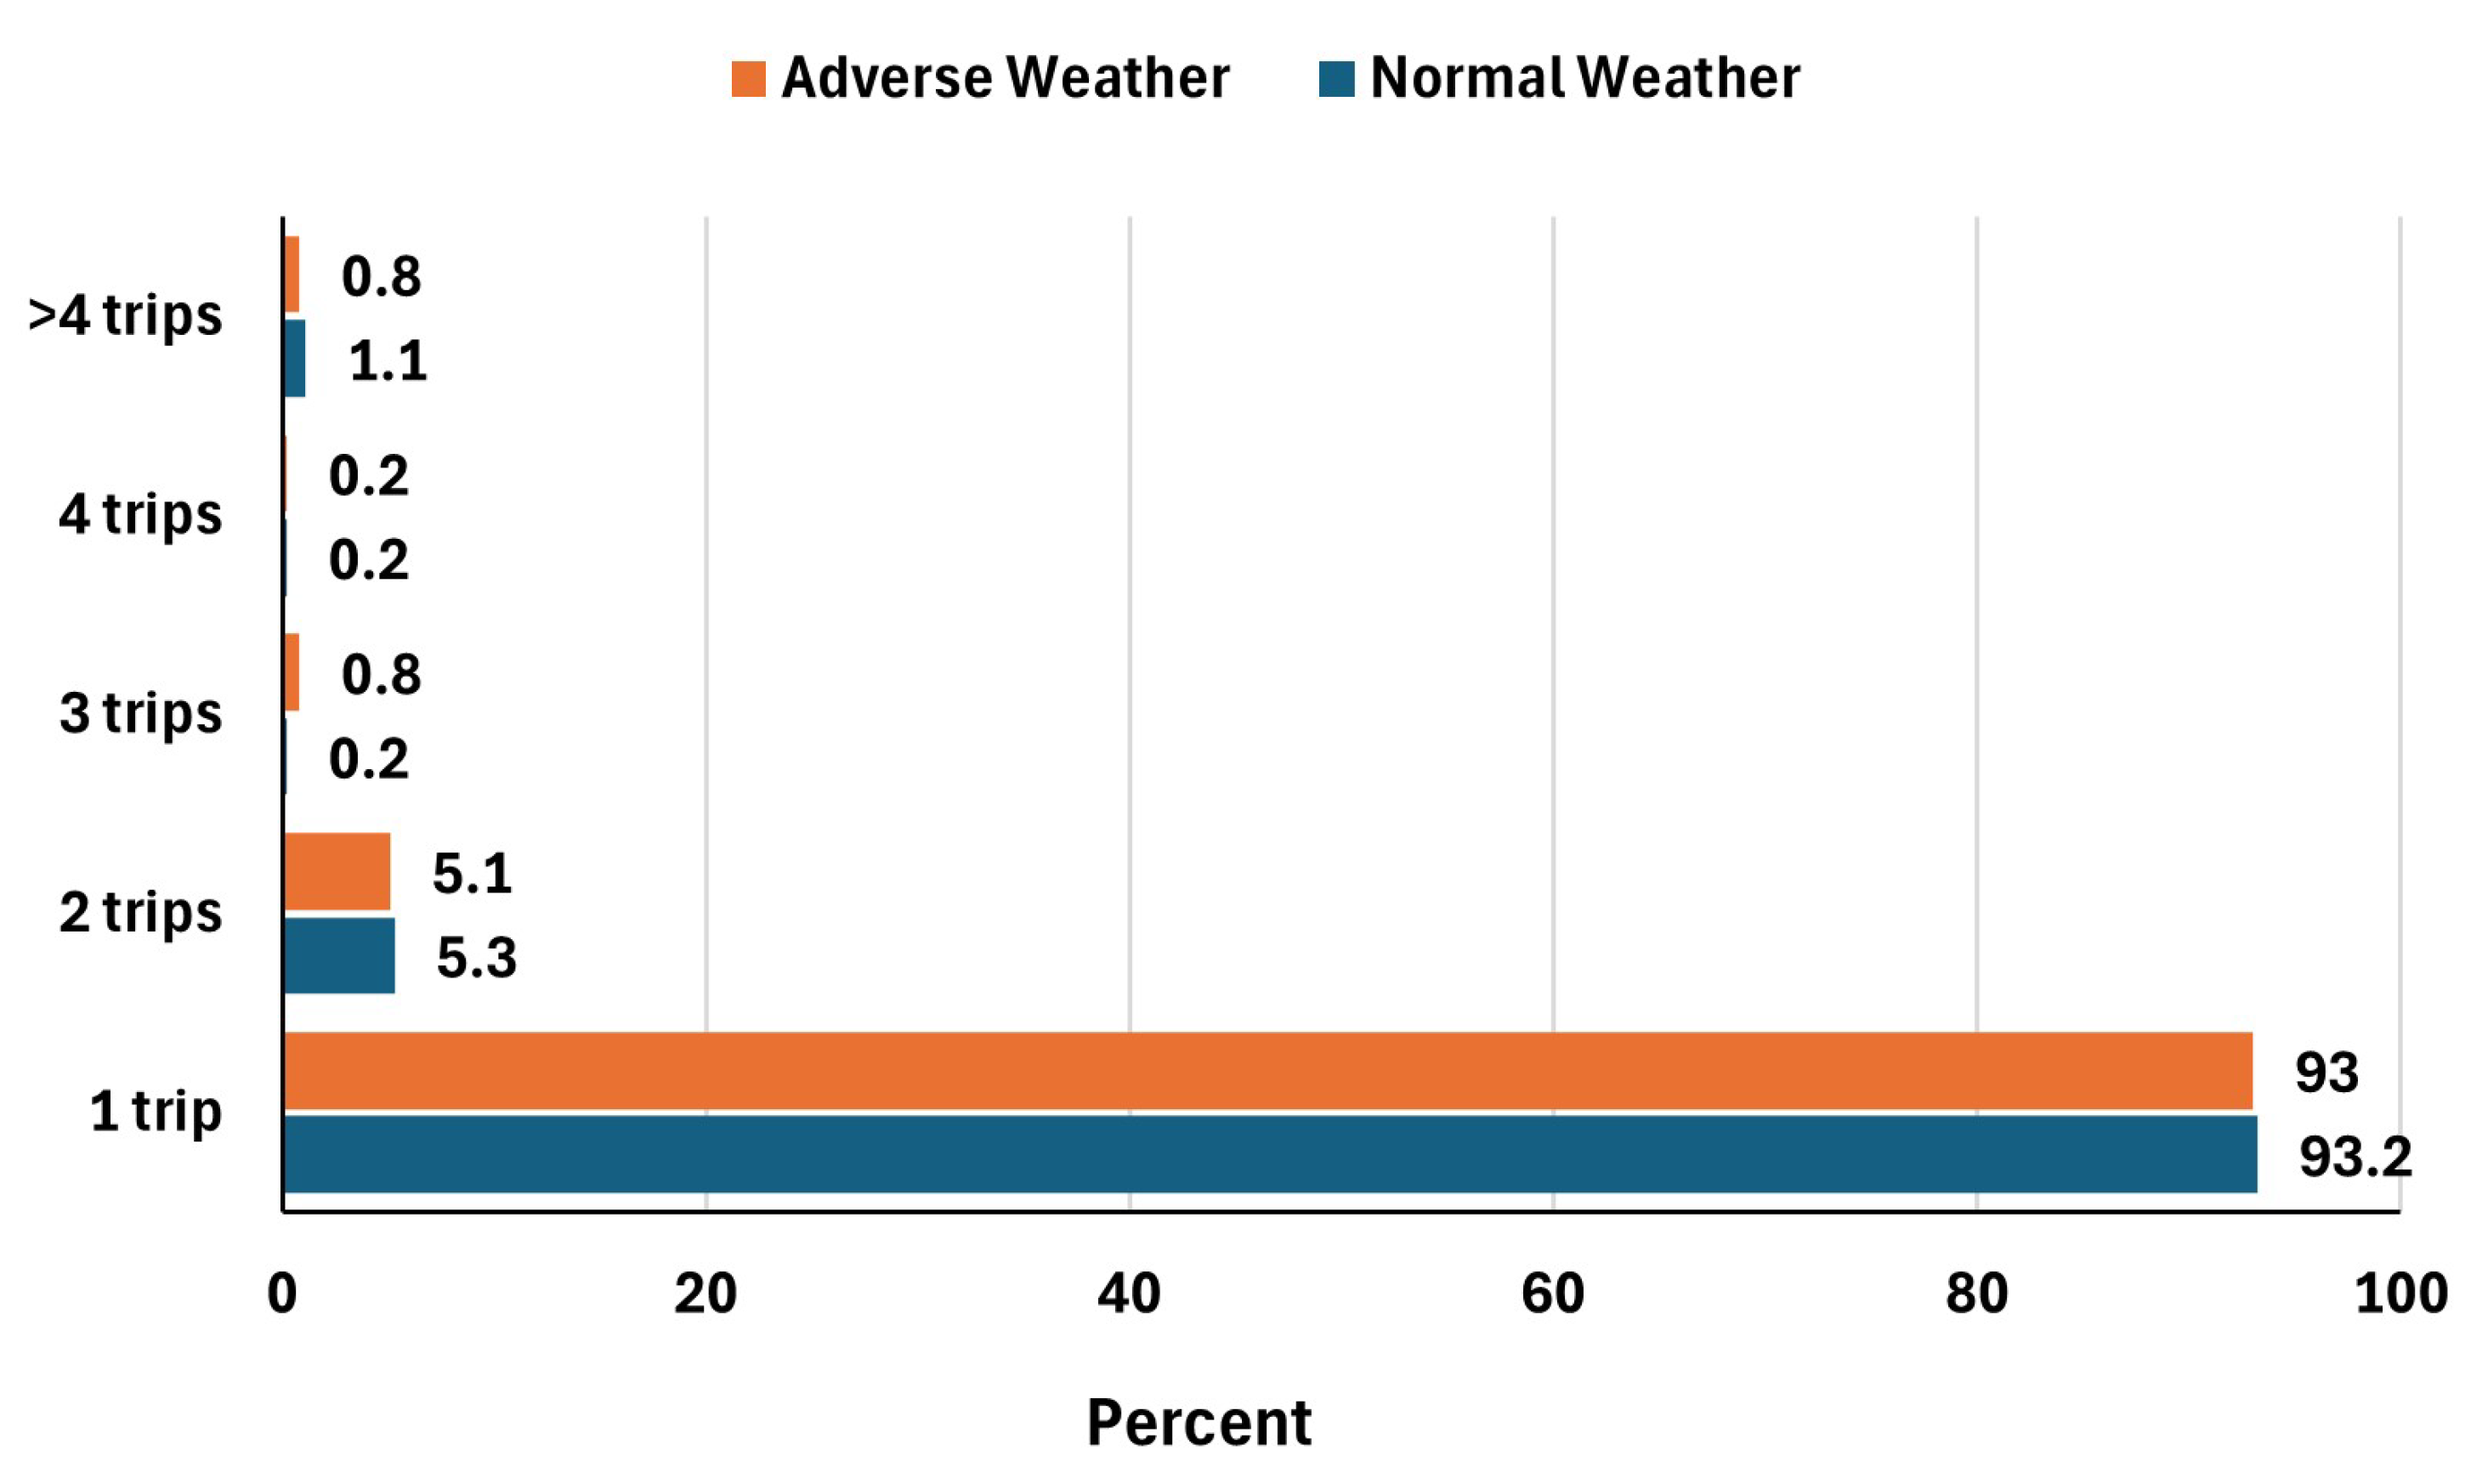
4.4.4. Transfers During the Trip to School
Data concerning transfers to school per trip under different weather conditions, as shown in
Figure 7, offer a nuanced understanding of student mobility efficiency with environmental variability. Under normal weather conditions, 93.2% of students required only one trip, suggesting a largely direct or streamlined school travel pattern that benefited from coherent route planning, accessible transit infrastructure, or widespread private mobility solutions. The fact that this figure marginally declined to 93.0% under adverse weather implied a high degree of structural resilience in the transport system to school. However, more telling were the subtle shifts in the higher-frequency transfer categories. The share of students requiring three trips increased significantly from 0.2% in normal conditions to 0.8% in adverse weather, a fourfold rise. Though the absolute numbers remained low, this relative surge reflected a potential vulnerability in transport continuity for a specific subset of the student population. That may indicate service disruptions, route changes due to weather conditions, or reduced service frequencies, necessitating additional modal transitions. In the context of student well-being and punctuality, even small increments in trip complexity can introduce psychological fatigue, temporal uncertainty, and reduced accessibility. Transfers involving four trips or more, while uncommon, exhibited a mild contraction under adverse weather, i.e., from 1.1% to 0.8%. This could suggest two contrasting behavioral or systemic adaptations: either a withdrawal from such burdensome travel during adverse conditions, possibly through school absenteeism or alternative remote arrangements, or a substitution effect, where longer, segmented commutes were replaced by more consolidated or private travel modes in response to inclement weather challenges. Furthermore, the marginal decline in two-trip journeys (from 5.3% to 5.1%) may signal a minor optimization or reconfiguration of routes during adverse conditions, potentially aided by parental intervention, dynamic routing policies, or informal carpool networks. While this change was statistically slight, it could reflect broader strategies aimed at minimizing multimodality in favor of reliability.
4.5. Model Validity
4.5.1. Normal Weather Conditions
Table 4 presents the model fitting statistics and diagnostic measures for the Multinomial Logit (MNL) model under normal weather conditions. The model demonstrates strong explanatory capabilities, as evidenced by a substantial likelihood ratio chi-square value (
= 620.966, df = 36,
p < 0.001), indicating that the final model significantly outperformed the null (intercept-only) model. The goodness-of-fit statistics revealed mixed but interpretable results: while the Pearson chi-square test suggested a significant misfit (
p < 0.001), the deviance statistic was non-significant (
p = 1.000), implying an acceptable model fit when overdispersion was not a major concern. Pseudo R-square measures further supported the model’s robustness, with the Cox and Snell (0.732), Nagelkerke (0.791), and McFadden (0.507) values all exceeding commonly accepted thresholds, particularly McFadden’s
, which surpassed 0.4; this is rare for discrete choice models and indicated excellent explanatory strength [
59,
60,
61]. The model classification accuracy (72.7%) also substantiated the model’s predictive reliability, especially for school bus and motorcycle users. These results validate the suitability of the MNL approach for analyzing school travel mode choice behavior under stable environmental conditions and offer a strong foundation for comparative analyses against adverse weather scenarios.
Table 5 details the results of likelihood ratio tests assessing the significance of individual variables influencing travel mode choice under normal weather conditions. All examined variables demonstrated statistically significant effects (
p < 0.05 or
p < 0.01), affirming their importance in shaping mode selection. Among the socio-demographic factors, grade level (
= 15.102,
p = 0.002) and household monthly income (
= 16.056,
p = 0.001) are noteworthy, reflecting how academic progression and economic resources critically impact transport autonomy and modal flexibility. Family structure variables, including family member count (
= 25.367,
p < 0.001), further underscore the role of household logistics in school commuting. Vehicle ownership variables—both car (
= 14.531,
p = 0.002) and motorcycle (
= 32.040,
p < 0.001)—exerted particularly strong influences, highlighting mobility resource disparities. Spatial-temporal trip attributes, such as travel distance (
= 45.525,
p < 0.001), waiting time at pick-up points (
= 11.597,
p = 0.009), and overall travel cost (
= 13.007,
p = 0.005), significantly explained mode preference variance, confirming the multidimensional nature of school commuting behavior. These findings collectively validate the integrated socio-demographic, economic, and spatial framework applied in the modeling, offering policy-relevant insights for designing interventions that promote equitable and sustainable school transport systems. To ensure the robustness of the estimated parameters, multicollinearity diagnostics were conducted using the Variance Inflation Factor (VIF). All variables included in the model exhibited VIF values below 2.5, indicating no critical multicollinearity issues [
62].
4.5.2. Adverse Weather Conditions
Table 6 presents the model fitting criteria, goodness-of-fit tests, and pseudo R-square values for the Multinomial Logit (MNL) model applied to school commuting mode choice under adverse weather conditions. The model fitting statistics indicated robust performance. The Final Model achieved a −2 Log Likelihood value of 766.138, significantly lower than the Intercept-Only model (1269.107), with a substantial chi-square difference of 502.968 (
p < 0.001), confirming that the inclusion of explanatory variables meaningfully improved model fit over the null model. The goodness-of-fit assessment revealed a Pearson chi-square value of 1996.565 (df = 1374,
p < 0.001), indicating a statistically significant departure from perfect fit. However, the Deviance statistic (766.138, df = 1374,
p = 1.000) suggested an excellent fit between the model and the observed data, as a high
p-value reflects no significant deviation. This pattern aligns with the expectation for MNL models, where Deviance is often prioritized over Pearson chi-square in assessing fit quality, particularly in cases with categorical data and large sample sizes.
Regarding pseudo R-square metrics, the Cox and Snell value was 0.655, the Nagelkerke value was 0.703, and McFadden’s R-square was 0.396. These values suggest moderate to strong explanatory power, especially McFadden’s
, which exceeded the 0.2–0.4 benchmark commonly accepted for discrete choice models [
59,
60,
61]. Collectively, these results confirm that the model captured a substantial portion of the variance in mode choice behavior under adverse conditions. Furthermore, the relatively high Nagelkerke R
2 indicated strong predictability, reinforcing the model’s suitability for informing policy interventions targeting resilient student mobility strategies during environmental disruptions.
Table 7 presents the likelihood ratio tests for variables affecting school commuting mode choice under adverse weather conditions. The results highlight that several socio-demographic and travel-related factors significantly influenced students’ modal preferences when weather deteriorated. Household car ownership (
= 33.250,
p < 0.001) and the number of people traveling to school (
= 91.939,
p < 0.001) emerged as the most statistically powerful determinants, underscoring the critical role of private mobility resources and travel group composition in adapting to environmental constraints. Travel distance (
= 40.825,
p < 0.001) and total travel time (
= 41.425,
p < 0.001) also exhibited strong effects, indicating that longer journeys exacerbate vulnerability during adverse conditions, possibly encouraging shifts toward safer or more enclosed modes such as private vehicles or school buses. Interestingly, age (
= 14.362,
p = 0.002) and parents’ working status (
= 9.997,
p = 0.019) became significant under adverse conditions, suggesting that older students and dual-income families are more adaptive in modifying their travel behavior. Variables related to spatial access, such as travel time to the nearest pick-up point and waiting time at pick-up points, also showed significance, reflecting operational disruptions and heightened travel uncertainty in inclement weather. Collectively, these findings reinforce that adverse weather amplifies existing transport inequities and infrastructural vulnerabilities.
Building upon the robust model fitting results and the significance of key determinants identified in the likelihood testing, the subsequent analysis delves deeper into the specific behavioral influences that drive school travel mode choices under varying environmental conditions. The multinomial logit regression models provide granular insights into how individual, household, and spatial factors interact to shape mobility preferences among high school students. By comparing estimated coefficients across normal and adverse weather scenarios, the study captures the dynamic nature of school commuting behavior, uncovering both stable predictors and context-sensitive adaptations. The next section presents a detailed interpretation of the multinomial regression outputs, highlighting how weather variability accentuates existing transport inequalities and shifts modal dependencies. These findings serve as a foundation for proposing targeted policy interventions aimed at enhancing the resilience, safety, and inclusivity of school transport systems, particularly in climatically vulnerable urban areas such as Chiang Rai.
4.6. Multinomial Logit Model
4.6.1. Normal Weather Condition
Table 8 presents the Multinomial Logit (MNL) coefficients for three alternatives—active transport, motorcycle, and school bus, relative to the reference category, i.e., private car. All standard errors were robust; Wald
indicated joint significance (
p < 0.001). Pseudo-
= 0.507 and an overall hit-rate of 72.7% confirm excellent explanatory power for a behavioral model. Notably, household car ownership exhibited a remarkably strong positive association across all modes, particularly for active transport (
β = 3.09, Odds = 21.96) and school bus use (
β = 2.84, Odds = 17.12). This suggested that households with car access possessed greater flexibility in facilitating modal options beyond private cars, possibly due to greater household mobility resources or differential parental decision-making for school commutes. Conversely, household motorcycle ownership was associated negatively with motorcycle use, an unexpected outcome that may reflect preference for private cars where motorcycle access existed but was deprioritized in favorable weather.
Travel distance was a consistent negative predictor for active transport (β = −1.94, Odds = 0.14) and motorcycles (β = −0.53, Odds = 0.59), aligning with existing literature stating that longer distances diminish the feasibility of non-motorized travel and increase dependence on mechanized transport. Additionally, family size positively influenced school bus selection, reflecting logistical efficiencies when multiple children traveled to the same institution. Importantly, current residence (urban/suburban) significantly influenced active transport (β = 2.20, Odds = 9.04) and school bus choice (β = 1.01, Odds = 2.75), suggesting spatial disparities in mode availability and infrastructural access. Meanwhile, travel time to pick-up points and waiting times also emerged as critical behavioral determinants, particularly impacting the decision between private and public modes. These results reinforce the multi-dimensional interplay between household attributes, spatial accessibility, and travel behavior under stable environmental conditions.
4.6.2. Adverse Weather Conditions
Table 9 presents the Multinomial Logit (MNL) regression results analyzing factors influencing school commuting mode choice during adverse weather conditions, using private vehicle use as the baseline category. The model elucidates how socio-demographic attributes, household mobility resources, and spatial-temporal variables differentially affect students’ travel decisions under environmental stress, offering critical insights into climate-sensitive mobility patterns. Household car ownership emerged as the most powerful predictor across all alternative modes active transport, motorcycle, and school bus with exceptionally high odds ratios (Odds > 22). This result confirms that private vehicle access substantially enhances modal flexibility, serving as a vital buffer against environmental disruptions. In particular, students from car-owning households were significantly more capable of substituting to safer or more resilient modes, aligning with established literature that underscores car ownership as a key enabler of adaptive travel behavior under adverse conditions.
Conversely, household motorcycle ownership exerted a strong negative influence on motorcycle mode choice (β = −3.66, Odds = 0.03), substantially deterring two-wheeled vehicle use during inclement weather. This finding reflects heightened risk perception among students and guardians regarding motorcycle safety in hazardous environmental contexts, reinforcing safety concerns commonly associated with motorcycle commuting, especially in rain or haze conditions prevalent in Chiang Rai. Spatial factors also displayed critical behavioral effects. Travel distance significantly decreased the likelihood of choosing active transport (β = −1.29, Odds = 0.28) and motorcycle usage (β = −0.22, Odds = 0.81), indicating that greater distances exacerbate the limitations of exposed or informal travel modes during adverse weather. Moreover, travel time to the nearest pick-up point and waiting time at the pick-up point negatively affected active transport choices, illustrating increased discomfort and reliability concerns as decisive factors discouraging exposure to inclement conditions. Socio-demographic variables further revealed context-sensitive behavioral adaptations. Age was positively associated with motorcycle use (β = 0.59, Odds = 1.81), suggesting that older students possess greater autonomy and willingness to maintain independent travel despite weather adversities. Meanwhile, parents’ working status became significant for school bus choice (β = 1.04, Odds = 2.84), indicating that students from dual-income households may prefer structured, supervised transport services when parental logistical support is constrained during work hours.
Current residence, whether urban or suburban, significantly influences mode selection. Urban students exhibited a substantially higher likelihood of choosing active transport (β = 1.96, Odds = 7.13) and school bus (β = 1.81, Odds = 6.13) relative to their suburban counterparts, highlighting spatial inequities in infrastructure access and service availability. This result emphasizes the critical role of urban form and density in supporting climate-resilient student mobility. Moreover, temporal dynamics are crucial. Longer travel times to school during adverse weather further discouraged motorcycle use (β = −0.39, Odds = 0.68) but increased reliance on structured transport modes like the school bus (β = 0.76, Odds = 2.13). These findings suggest that adverse conditions systematically exacerbate time inefficiencies in less resilient transport options, motivating a shift toward organized services despite potential cost or scheduling inconveniences.
Table 10 presents a comparison of significant factors influencing school travel behavior under normal and adverse weather conditions, revealing notable differences. Under normal weather conditions, factors such as gender, monthly household income, family size, private vehicle ownership (both car and motorcycle), the number of people traveling to school, current residence, total distance to school, travel time to the nearest pick-up point, waiting time for the bus, total travel time, and total travel expenses significantly affected travel behavior. In contrast, under adverse weather conditions, age and father’s working status emerged as significant factors, alongside household income, family size, vehicle ownership, number of people traveling to school, current residence, total distance to school, travel time to the pick-up point, waiting time for the bus, and total travel time. This indicated that while several factors consistently influenced travel behavior across weather conditions, adverse weather introduced additional socio-demographic determinants such as age and parental employment status, reflecting the adaptability of travel behavior to changing environmental conditions.
4.7. Model Classification and Accuracy
The classification in normal and adverse weather conditions in
Table 11 demonstrates varying levels of prediction accuracy across different travel modes. Under normal weather conditions, the model showed the highest classification accuracy for school bus users (83.0%), followed by motorcycle users (77.6%) and active transport users (64.6%), with the lowest accuracy observed for private vehicle users (45.9%). In adverse weather conditions, school bus users continued to exhibit the highest classification accuracy (79.2%), while active transport and motorcycle users showed moderate accuracy levels (64.2% and 67.5%, respectively), and private vehicle users displayed improved accuracy (58.3%) compared to normal weather. The overall classification accuracy decreased slightly from 72.7% in normal weather to 68.6% in adverse weather, indicating that weather conditions may have influenced the model’s predictive performance, particularly for private vehicle usage. This suggests that adverse weather introduces additional variability in travel behavior, affecting the consistency of mode choice predictions.
5. Discussion
This study provides critical insights into the dynamics of school commuting mode choices among senior high school students in Chiang Rai, Thailand, under both normal and adverse weather conditions. By employing a Multinomial Logit (MNL) modeling approach, the research reveals how socio-demographic characteristics, household mobility resources, spatial factors, and travel-related attributes collectively influence mode selection, and how these relationships shift when environmental conditions deteriorate.
Under normal weather conditions, the findings highlight the predominant reliance on motorcycles and the significant role of household vehicle ownership in facilitating diverse mobility choices. Car ownership, in particular, was found to substantially enhance flexibility in selecting non-private vehicle modes such as active transport and school bus usage. This outcome aligns with prior research indicating that households with greater mobility resources can better tailor mode choice decisions to optimize convenience, safety, and cost-efficiency. Furthermore, shorter travel distances, urban residence, and lower travel costs significantly encourage the adoption of active and shared transport modes. These results reinforce the established understanding that proximity to school and favorable built environment characteristics are key enablers of sustainable commuting behaviors.
Conversely, during adverse weather conditions, the analysis illustrated a distinct behavioral adaptation among students and their households. Private vehicle usage notably increased, reflecting a risk-averse response to environmental stressors. Motorcycle usage declined sharply, corroborating concerns about the safety vulnerabilities of two-wheeled travel under inclement conditions. The role of household car ownership became even more pronounced, underscoring how access to resilient mobility options acts as a crucial buffer against external disruptions. These findings are consistent with studies that emphasize the magnified role of private vehicles in contexts of climatic uncertainty and inadequate public transport resilience.
Spatial factors, particularly travel distance and travel time to pick-up points, exerted stronger effects under adverse conditions. The MNL results indicate that under adverse weather, a one-minute decrease in travel time to the nearest pick-up point increased the odds of choosing the school bus by approximately 1.43 times (β = −0.35, p < 0.01). Furthermore, students from households with car ownership were 22.96 times more likely to opt for the school bus during adverse weather, underscoring how mobility resources influence adaptive modal shifts. These findings suggest that improving first-mile connectivity such as safe walkways or feeder services could facilitate a measurable shift from motorcycle use to safer, enclosed travel modes during inclement conditions. While school buses maintained consistent usage (~33.7%) across weather scenarios, indicating relative stability, their share remained moderate. Thus, while buses offers a more resilient alternative than motorcycles during adverse weather, their capacity constraints and limited coverage must be addressed before promoting them as a universally viable solution.
Socio-demographic attributes also exhibited context-dependent influences. Age emerged as a significant predictor under adverse weather, with older students demonstrating greater independence in motorcycle use despite environmental risks. Meanwhile, parents’ working status influenced school bus reliance, suggesting that dual-income households are more likely to prefer structured, reliable transport options when parental support for school commuting is constrained. This socio-economic mediation of mode choice underlines the broader theme of transport disadvantage during adverse conditions, a concern increasingly recognized in transport equity research.
This study contributes to the transport literature by emphasizing that school commuting behaviors are not static but highly responsive to environmental variability. Moreover, it demonstrates that environmental disruptions disproportionately impact students lacking access to resilient mobility resources, amplifying underlying socio-economic and spatial inequalities. The findings advocate for urgent policy interventions aimed at enhancing transport system resilience, particularly by improving first- and last-mile connectivity, expanding access to reliable school transport services, and ensuring safe infrastructure for vulnerable road users. These insights are particularly relevant for secondary cities like Chiang Rai, where rapid urbanization and limited public transport systems expose systemic vulnerabilities that may be exacerbated by climate change and environmental instability.
6. Conclusions
This study examined the factors influencing school commuting mode choice among senior high school students in Chiang Rai, Thailand, under both normal and adverse weather conditions. Utilizing a Multinomial Logit (MNL) modeling approach, the research elucidates how socio-demographic attributes, household vehicle ownership, spatial factors, and travel-related characteristics collectively shape students’ transport decisions, and how these determinants dynamically adjust in response to environmental variability. The results demonstrate that car ownership significantly enhances modal flexibility, serving as a key enabler of adaptive commuting behavior during adverse weather. In contrast, motorcycle reliance declines sharply under inclement conditions, reflecting heightened risk sensitivity. Spatial factors such as travel distance and access time to pick-up points were also found to critically influence mode shifts, particularly amplifying transport inequities between urban and suburban students. Socio-economic variables, including parental working status and household income, emerged as important contextual factors mediating travel choices, especially during environmental disruptions. These findings advance the current understanding of climate-sensitive travel behavior in secondary cities, a domain traditionally underrepresented in transport research dominated by metropolitan case studies. By highlighting the interplay between mobility resource availability, spatial accessibility, and socio-environmental vulnerability, this study offers critical insights into the structural barriers to resilient and equitable school transport systems in rapidly urbanizing regions.
The policy implications are clear: enhancing school transport resilience requires investments in inclusive and accessible mobility infrastructure, particularly first-mile connectivity improvements, the expansion of reliable school bus services, and safer environments for active transport. Such interventions are essential not only for improving the safety and efficiency of school travel but also for promoting broader goals of social equity, urban resilience, and sustainable development. In conclusion, this research underscores the necessity for transport policies that are sensitive to environmental variability and socio-spatial disparities, particularly in Chiang Rai and other similarly vulnerable secondary cities. Future research should extend these findings by incorporating longitudinal data to capture behavioral adaptations over time and by exploring integrated modeling approaches that account for multimodal trip chains and heterogeneous user preferences under varying climatic scenarios. By doing so, transport planning can be better informed to foster inclusive, resilient, and sustainable mobility systems for all urban residents.
7. Limitations and Future Work
This study has several limitations. First, the use of cross-sectional, self-reported survey data may have introduced recall bias, suggesting that future research should consider longitudinal or real-time tracking methods. Second, the focus on senior high school students from extra-large urban schools limited generalizability; broader samples covering younger students and suburban or rural areas are recommended. Third, adverse weather was treated as a single category without distinguishing between specific environmental stressors, which future research could disaggregate. Lastly, supply-side factors such as service quality or parental interventions were not examined and merit deeper investigation. Expanding methodological approaches and interdisciplinary collaborations will be essential to enrich understanding and develop more resilient and inclusive school transport systems. Additionally, adverse weather was measured based on respondent-reported behavioral recall rather than linked to real-time meteorological data, which may have introduced perception-based variability. Additionally, this study used a standard MNL model, which assumed IIA; although widely used, this model may not have captured unobserved heterogeneity. Future studies should consider integrating meteorological monitoring to more precisely align travel behavior with specific weather episodes and adopt Mixed Logit or Nested Logit approaches for improved behavioral fidelity respectively.


