Article

Analysis of Route-Way Dynamics in Urban Traffic Congestion of Enugu, Nigeria

by
Gladys Ogochukwu Chukwurah
1,
Francis Ogochukwu Okeke
2,3,
Matthew Ogorchukwu Isimah
4,*,
Rosemary Nnaemeka-Okeke
2,
Ebere Donatus Okonta
5,
Foluso Charles Awe
6,
Augustine Enechojo Idoko
7,
Shuang Guo
8 and
Chioma Angela Okeke
9
1
Department of Urban and Regional Planning, University of Nigeria, Enugu 401105, Nigeria
2
Department of Architecture, University of Nigeria, Enugu 401105, Nigeria
3
School of Engineering, Technology and Design, Canterbury Christ Church University, Canterbury CT1 1QU, UK
4
Department of Geography, University of Nigeria, Nsukka 410105, Nigeria
5
School of Computing, Engineering and Digital Technologies, Teesside University, Middlesbrough TS1 3BA, UK
6
Department of Architecture, Federal University Oye-Ekiti, Oye-Ekiti 371104, Nigeria
7
Department of Architecture, State University of Medical and Applied Sciences Igbo-eno, Enugu 400001, Nigeria
8
Christ Church Business School, Canterbury Christ Church University, Canterbury CT1 1QU, UK
9
GSL Education Kent, Canterbury CT2 7FG, UK
*
Author to whom correspondence should be addressed.
Future Transp. 2025, 5(2), 71; https://doi.org/10.3390/futuretransp5020071
Submission received: 12 March 2025 / Revised: 13 May 2025 / Accepted: 19 May 2025 / Published: 4 June 2025

Abstract

Urban traffic congestion poses significant challenges to sustainable development in rapidly growing cities. This study examines the spatiotemporal dynamics of traffic congestion in Enugu, Nigeria, a representative mid-sized sub-Saharan city, through a comprehensive analysis of volumetric traffic flows along three major distributors: Abakpa, Nike, and Trans-Ekulu Road. The research employed direct observation and vehicle counts, conducting a week-long traffic census during peak morning (7:30–9:30 AM) and evening (4:00–8:00 PM) periods. Data was analyzed using peak hour factor (PHF), mean plots, and chi-square tests. The results reveal a daily mean of 2334 vehicles/h. Abakpa/Nike Road demonstrated the highest traffic volumes (mean = 809.2 vehicles/h) and most concentrated peak flows (PHF = 0.79), while Trans-Ekulu Road exhibited lower, more uniformly distributed volumes (mean = 719.4 vehicles/h, PHF = 0.93). Evening peaks (6:00–8:00 PM) consistently surpassed morning volumes, with Abakpa/Nike Road reaching 974 vehicles/hour during the evening rush compared to 620 vehicles/hour in the mornings. Chi-square analysis (χ2 = 55.5, df = 8) confirmed statistically significant differences in flow distribution among the routes. The complete absence of Monday traffic due to regional “sit-at-home” orders created a distinctive weekly pattern, with Tuesdays experiencing disproportionate congestion as the de facto first workday. Non-linear relationships between volume increases and congestion severity were observed, where modest volume changes produced amplified system-wide effects. Spatial analysis revealed that evening congestion disparities between distributors (14.9%) significantly exceeded morning differences (8.9%), indicating uneven network utilization. These findings illuminate how socio-political factors, activity patterns, and complex network dynamics shape urban mobility in rapidly developing contexts. This study offers empirical evidence supporting targeted interventions, including Tuesday-specific traffic management, evening-focused congestion mitigation strategies, and corridor-specific infrastructure improvements to enhance mobility in this representative mid-sized sub-Saharan city.

1. Introduction

Transportation fundamentally shapes quality of life by supporting economic activities and daily operations across society. As indicators of economic development and technological advancement, cities particularly depend on effective mobility systems for commerce, connectivity, and growth [1]. Efficient freight movement through intermodal networks underpins economic vitality, while transportation infrastructure impacts environmental sustainability and national prosperity [2]. Through these interconnected functions, transport systems serve as essential arteries that enable social participation, economic exchange, and environmental interactions within modern communities [3]. According to Okeke et al. [4], the widespread adoption of vehicular transportation in many sub-Saharan cities has greatly facilitated human mobility, leading to a significant increase in travel, migration, and other forms of population movement. The transportation of goods and services within urban areas has been made possible by the use of roads, which serve as critical conduits for urban commerce. In the global south, and Enugu city in particular, road transportation stands as the most effective mode of travel, facilitated largely by automotive vehicles [5]. Evidence in the literature suggests a notable trend of increasing population gravitating towards urban areas, especially capital cities [6,7]. This urban migration correlates with a surge in vehicular traffic, driven by the need to transport goods, services, and people. However, alongside this urbanization and heightened mobility, there emerges a pressing issue of the marked rise in traffic congestion experienced across numerous urban centers.
Traffic is considered as the circulation, flow, and volume of vehicles moving along a route within a geographical setting, influenced by numerous factors [8]. Several scholars have put in decades of research efforts to understand traffic congestion as a critical component in evaluating the growth of urban transport systems, specifically in terms of sustainability. The studies of Okeke et al. [9] have demonstrated that land use and transportation are mutually dependent. However, the escalating rate of traffic congestion in city centers is a grave cause for concern. This critical issue has a far-reaching effect on the economic, social, and environmental fabrics of urban areas. It impacts the efficiency of transportation, leading to delays and reduced productivity as well as increased fuel consumption and emissions, which contribute to environmental degradation and poor air quality. However, the movement of goods from the hinterlands and services into urban areas and reverse, made possible by road transportation, contributes to increases in economic activities, rapid development, and employment opportunities in the transport sector [10]. Consequently, the current insecurity challenges in the hinterlands and other parts of rural communities have led to the massive influx of people in urban areas [11]. All these factors result in severe and regular traffic congestion in many cities.
As traffic congestion is a pervasive challenge in rapidly urbanizing cities globally, Almeida et al. [12] highlights the potential of leveraging existing smart city infrastructure and vehicle tracking data to quantify traffic dynamics cost-effectively. Wei et al. [13] offered a detailed framework for mapping hourly congestion delays, categorizing congestion clusters in Chinese cities, and analyzing built environment impacts using AutoNavi data. The research of Huang and Loo [14] presents a comprehensive methodology to map the relative emphasis on sustainability dimensions in congestion and demonstrates the value of text-mining news archives to decipher societal attitudes and policy agendas related to urban transport challenges. Innovatively, Noor et al. [15] triangulated multiple traffic indices with road-user perceptions and geospatial analysis to diagnose the severity, spatiotemporal patterns, and underlying drivers of gridlock in the major commercial hubs of Khulna, Bangladesh. This fine-grained, mixed-methods approach offers an insightful template for evidence-based congestion assessment and mitigation prioritization in data-scarce developing city contexts. Furthermore, Rouky et al. [16] provide a unique spatiotemporal analysis of congestion patterns in Casablanca, Morocco, using real-time big data from the Waze navigation API. Literature evidence shows minimal discussion of smart technologies in sub-Saharan cities’ traffic congestion and contrasts with the rising tech-solutionist discourse observed in Asian and Western cities, sampled in the highlighted studies above, potentially indicating a more pragmatic, infrastructure-oriented mobility agenda amidst the cities’ acute car dependence. This big data-driven approach offers an innovative alternative to traditional traffic sensing methods for evidence-based transportation planning in resource-constrained contexts. However, situating study area traffic woes within this emerging research direction is not yet practicable because of limited technological and socio-political factors.
In Nigeria, traffic congestion is a continuous daily event, especially in large cities [17]. Developing cities, including Enugu metropolis, are tilting towards fragility with dysfunctional urban infrastructure and exhibiting traffic congestion almost throughout the day [18]. Many residents face extended travel times—frequently exceeding two hours for what should be relatively short journeys to destinations such as workplaces, educational institutions, healthcare facilities, and commercial centers. This persistent congestion has gradually reshaped social expectations around punctuality, with traffic delays increasingly accepted as valid justification for tardiness at professional engagements and social gatherings, reflecting an unfortunate normalization of inefficient urban mobility patterns. The deteriorating transportation conditions highlight the urgent need for evidence-based interventions that address both infrastructure deficiencies and demand management approaches tailored to Enugu’s specific urban context; anecdotal evidence reveals that most of the major roads within the metropolis, particularly in the Abakpa, Nike, Old-Park, and Trans-Ekulu areas, among others, are economic corridors that hold heavy traffic for nearly fifteen hours of the day. Though studies have been performed by some scholars [4,9,19,20] on traffic congestion, with insightful findings and efforts also made by past administrations by rehabilitating most of the route-ways in Enugu city, but they have yielded little or no significant change. If the administration has been unable to tackle the issue of route-way improvement without an appreciable decrease in the rate of traffic congestion in Enugu, it therefore means that some germane issues are yet to be addressed [20]. This is because the solution to traffic congestion in Nigerian cities, including Enugu, probably lies in verifiable proper transportation planning management and future forecasting. Hence, the transportation issue relates to accurate real-time statistics, analysis, and planning, which should proceed with the action of subsequent administrations. The variability of congestion patterns even at the intra-city level highlights the risks of generalization and need for evidence-based planning that incorporates exogenous factors affecting urban mobility along with traditional supply–demand levers for mitigation. As the city of Enugu faces complex, interconnected challenges managing post-COVID mobility amidst stretched budgets and accelerating climate risks, hyperlocal research illuminating the when, where, and why behind traffic flows will grow in policy value.
Therefore, understanding the pattern of volumetric traffic congestion along the route-ways in Enugu city is essential due to the need to meet the mobility demand arising from rapid urbanization and population growth in the study area. Any measure adopted to solve the problem of traffic congestion may still not yield any expected result if this phase is ignored. This study, therefore, examines the traffic situation in Enugu’s urban areas. The research objectives include the following. (i) To theoretically relate Enugu’s traffic situation to some transportation models. (ii) To examine the volumetric and traffic flow rate. (iii) To ascertain the peak period of traffic congestion and commuters’ waiting time in Enugu. The hypothesis postulated (Ho) is as follows: there is no significant difference in the volumetric traffic flow among the various route-ways. Although this study has a limitation in terms of the durations of observation, it can also serve as a basic foundation for more elaborate future research, because by conducting analyses of traffic volume and flow rates along major route-ways, policymakers and transportation planners can gain valuable insights into the specific needs and challenges of the region, enabling them to develop evidence-based interventions tailored to the local context.

2. Literature Review

Recent studies underscore the power of knowledge discovery from new big data sources to characterize urban traffic conditions. Almeida et al. [12] presents a comprehensive framework to map speed, traffic flow, road occupancy and congestion clusters with segment-level granularity by mining bus GPS timestamps and OpenStreetMap attributes. Applying k-means and DBSCAN algorithms to Aveiro’s bus fleet, they identify three congestion severity levels and demonstrate the reproducibility of mobility insights, even with sparser vehicle coverage. These promising findings build on Vidović et al.’s [21] correlation of telecom data with urban trip patterns and Pagani and Stead’s [22] estimation of traffic metrics from car-sharing services. Wei et al. [13] utilized real-time big data from the AutoNavi navigation platform to conduct a novel spatiotemporal analysis of congestion patterns across 77 large Chinese cities. By collecting hourly congestion delay index (CDI) data for a month and applying hierarchical clustering, they identified four distinct city clusters exhibiting varying congestion severity levels and peak period timings. The study also investigated the impact of urban form factors like population size, road infrastructure, and public transit provision on congestion outcomes. Furthermore, by combining measures of road segment congestion index, active road performance index, level of service, and speed performance index obtained from detailed traffic observations made throughout peak hours and functional zones in Khulna, Bangladesh, Noor et al. [15] presented a comprehensive methodology to assess the severity of CBD congestion. Mapping outcomes to road-user perceptions and geospatial analysis, they pinpoint major arterial bottlenecks, temporal fluctuations, and proximate causes like unregulated street vending, on-street parking, and pedestrian conflicts—yielding a holistic picture of gridlock mechanics. These findings resonate with Agyapong and Ojo’s [23] identification of physical road constraints and complex modal conflicts as key congestion triggers in Accra, Ghana, and Chakrabartty and Gupta’s [24] valuation of congestion costs in Kolkata, India. Huang and Loo [14] innovatively harnessed big data from local news media across 12 major metropolitan areas in Asia, Oceania, Europe, and North America to conduct a novel thematic content analysis of congestion discourses. By mining over 40,000 congestion-related articles published from 2009 to 2018 and applying natural language processing techniques, they uncovered dominant sustainability framings, mitigation priorities, and sentiment trends shaping public perceptions. This media-based approach offers a scalable, real-time complement to conventional traffic sensing methods for gauging societal concerns and policy directions in diverse urban contexts. Rouky et al. [16] extended their research by focusing on intra-city zonal variations and land use effects in the understudied North African context by collecting hourly travel time index data for 440 road segments over a week and applying clustering algorithms. They detected four distinct levels of congestion severity across 22 communes. Their study also investigated the impact of land use factors like residential density, industrial zones, parks, and transit stations on congestion using Naive Bayes classifiers [16]. Such studies signal a shift from traditional sensor-based traffic monitoring to repurposing passive mobility datasets as cost-effective probes of network performance. Chao [25] analyzed the situation of traffic congestion in China using successful experiences of easing traffic congestion in foreign countries. The study focused on the influences and roots of traffic congestion in cities. His study proposes some measures which are proper for China to solve their problems related to traffic congestion.
In Nigeria, traffic congestion is one of the major challenges to mobility that results in low productivity and the loss of man hours, thus affecting the overall wellbeing of residents [26]. Nigeria faces extreme traffic congestion in such a way that vehicles travel at speeds of about 3–5 km/h, especially during workdays and rush hours like the morning and evening hours. Traffic congestion leads to increased pollution of the air with fumes from vehicles and increased travel times, leading to delays and the loss of investment opportunities. Irunokhai et al. [27] analyzed traffic congestion with particular reference to Sango T Junction in Ibadan, Oyo State. The total number of vehicles and the specific waiting time for a periodic hour were documented during peak and off-peak traffic periods. The data obtained were analyzed using means plots, the t-test, and analyses of variance. The results of the analysis revealed that the peak period of traffic was in the morning, but the average waiting time for road users in the evening was higher compared to the morning period. They also showed that traffic flow did not have much of a significant difference between its peak and off-peak period. Ukpata and Etika [28] investigated traffic congestion in Nigerian cities. Their research participants comprised experts in transportation planning and design, as well as engineers of other disciplines, students, commuters, and drivers. Cities such as Lagos, Port Harcourt, and Abuja were identified as major cities affected by traffic congestion. Also, the problems of intra-urban traffic in Lagos, Nigeria, have been studied by Bashiru and Waziri [29]. The study found that 57% of commuters and motorists spent between 30 and 60 min on the road due to traffic congestion, and the worst traffic congestion occurred on Mondays. The problem of traffic congestion at road intersections in Ilorin Nigeria was examined by Aderamo and Atomode [30]. The study found that traffic wardens and parking problems are the greatest causes of traffic congestion at road intersections in Ilorin. Their study highlights the fundamental theory of traffic flow to underscore the importance of traffic flow characteristics such as flow, density, and velocity to the planning, design, and operation of urban roads in Nigeria. Uwadiegwu’s [20] study focuses on the factors responsible for traffic congestion in Nigeria, using Mayor Bus Stop and Coal Camp along Agbani Road in Enugu city as case studies. A total of 20 variables, organized into four factors, such as physical, technical, land use, and human factors, were suspected to be the causes of traffic congestion.
However, efforts were made by past administrations to rehabilitate most of the routes, but there was no significant change. Since past administrations have tackled the issue of route-way improvement without an appreciable decrease in the rate of traffic congestion in Enugu, this now creates research and policy gap. The solution to traffic congestion in Nigerian cities, including Enugu, probably lies in proper transportation planning and management, which should proceed with the action of subsequent administrations. A significant phase in the planning processes is the exhaustive empirical examination of volumetric road traffic analysis along the route-ways in Enugu. If this phase is omitted, any adopted solution strategy is likely not to yield an expected or desired result. Recently, Irunokhai et al. [27] studied these critical issues but focused on Western Nigeria, with reference to Sango T Junction in Ibadan, Oyo State. The findings of their study are significant, but insufficient to motivate any structural or policy changes that will improve the traffic situation in Enugu city, since its findings cannot be directly applied to Enugu’s distinct urban context. This is a major research gap that the present study aims to address by analyzing the volumetric road traffic situation in Nigeria with reference to Enugu city.

2.1. Theoretical Framework

Traffic congestion is a complex phenomenon that requires a comprehensive understanding of the underlying factors contributing to its formation and the potential strategies for its mitigation. This study draws upon four key theories and frameworks to contextualize the findings on spatiotemporal traffic dynamics in Enugu, Nigeria, within broader scholarly transportation debates: Traditional Four-Step Transport Modeling, Activity-Based Travel Behavior Theory, Mobility Transition Theory, and Complexity Theory. These theoretical lenses provide valuable insights into the root causes, dynamics, and potential solutions to traffic congestion in rapidly urbanizing cities like Enugu.

2.1.1. Traditional Four-Step Transport Modeling

This framework serves as a fundamental tool for transportation planners and researchers to predict and analyze traffic flows and congestion patterns in urban areas. This framework provides a structured approach to estimating travel demand and assigning it to transportation networks based on sequential steps that consider land use, socioeconomic, and transportation system characteristics [31]. The four steps are Trip Generation, Trip Distribution, Mode Choice, and Route Assignment; each focus on specific aspects of travel demand modeling and utilize various mathematical and statistical techniques.
Trip Generation: The first step estimates the number of trips produced by and attracted to each zone within the study area, using the concept of trip ends to represent origins and destinations. Regression models commonly relate trip ends to explanatory variables such as population, employment, and land use [32]. These models typically develop using household travel survey data, with residential zones using variables like households, demographics, car ownership, and employment rates, while non-residential zones consider job numbers, commercial presence, and other attractors. When local data is insufficient, planners may use standard trip generation rates from databases like those provided by the Institute of Transportation Engineers.
Trip Distribution: This step involves distributing trips between zones to create an origin–destination matrix using spatial interaction models. The gravity model, the most common approach, assumes that the trip numbers between zones are proportional to trip ends in each zone and inversely proportional to the impedance between them. Model calibration uses observed data or iterative methods, like Furness or Fratar techniques, incorporating factors such as intervening opportunities and zone-specific attractiveness for different trip purposes.
Mode Choice: The third step splits the origin–destination matrix by transportation mode based on traveler characteristics and relative mode attributes. This recognizes individuals’ different preferences and constraints influenced by income, car ownership, travel time, cost, and convenience [33]. Discrete choice models like multinomial logit or nested logit estimate the probability of choosing particular modes based on their associated utility. The utility functions include mode characteristics and traveler socioeconomic attributes, with coefficients estimated using revealed preference or stated preference survey data.
Route Assignment: The final step loads the origin–destination matrices onto transportation networks to determine the specific routes travelers use. This simulates actual traffic flow and estimates performance measures like link volumes, travel times, and congestion levels. Traffic assignment models, including user equilibrium and stochastic user equilibrium models, assume travelers choose routes based on utility maximization principles [34]. User equilibrium assumes perfect information and route choice, minimizing travel times, while stochastic user equilibrium recognizes imperfect information and perceived travel times, providing more realistic route choice representation.
The framework has significant limitations, particularly its aggregate nature assuming uniform characteristics within zones, which may not capture travel behavior heterogeneity and complex decision-making processes [35]. The static and deterministic representation may not reflect dynamic and stochastic real-world traffic flow. Additionally, its reliance on historical data and assumptions of stable relationships between land use, socioeconomic factors, and travel behavior may not hold in rapidly changing urban areas, particularly in developing countries. Despite limitations, the theory remains valuable for transportation planning and policy analysis, particularly for long-term strategic decision-making. It provides systematic quantitative approaches to estimate travel demand and assess transportation system performance, helping identify congestion drivers, evaluate scenarios, and prioritize investments. However, complementing it with approaches considering behavioral, temporal, and spatial dimensions is important. Activity-Based Travel Demand Modeling, Dynamic Traffic Assignment, and Agent-Based Simulation address the traditional framework’s limitations, providing more realistic travel behavior and network performance representations.
In Enugu, Nigeria, applying this framework can provide insights into current and future travel demand and congestion levels. Collecting data on land use, socioeconomic, and transportation characteristics while calibrating models to local contexts enables the estimation of trip generation, distribution, modal split, and the resulting traffic flows. This identifies critical congested corridors and intersections, revealing contributing factors like employment concentration, public transportation deficiencies, or inadequate road capacity. Planners can develop targeted strategies, including public transportation improvements, non-motorized mode promotion, traffic management measures, and selective infrastructure expansion. However, the framework may not fully capture the unique challenges in developing cities like Enugu. High informal settlement levels, paratransit and non-motorized mode prevalence, rapid population growth, and limited resources require different approaches than in developed country contexts. While providing useful analytical starting points, the framework should be complemented with methods sensitive to local contexts that engage stakeholders and communities. This includes participatory mapping, qualitative surveys, and scenario planning, capturing diverse user group needs, plus advanced disaggregate models that better represent complex dynamic travel behavior and congestion. The Traditional Four-Step Transport Modeling framework thus serves as a foundational tool requiring adaptation and supplementation for effective application in developing urban contexts like Enugu. Its systematic approach provides valuable insights, while acknowledging its limitations ensures more a comprehensive understanding of urban transportation challenges and opportunities.

2.1.2. Activity-Based Travel Behavior Theory

This theory represents a comprehensive approach to understanding and modeling travel demand by focusing on underlying activities and decision-making processes that drive individuals’ travel behavior. Unlike the Traditional Four-Step Transport Modeling framework, that emphasizes trips themselves, this theory recognizes travel as derived demand undertaken to participate in activities distributed across space and time [36]. The core premise is that individuals’ travel patterns result from complex interplay between personal characteristics, household and social constraints, and spatial and temporal attributes of activities they need or want to engage in. Understanding these relationships and trade-offs enables planners and policymakers to develop more realistic strategies for managing travel demand and congestion.
A key feature of this theory is that it considers the entire activity–travel pattern rather than individual trips, accounting for interdependencies and constraints between different activities and trips such as dropping children at school before work or combining shopping and leisure in the same tour [37]. The theory employs various modeling techniques to capture complex activity–travel patterns:
  • Discrete choice models (multinomial logit or nested logit) estimate the probability of choosing particular activity or trip alternatives based on the utility associated with each alternative. Utility functions include alternative attributes (travel time, cost, activity type) and individual socioeconomic characteristics (age, gender, income) [38].
  • Time-use models focus on time allocation to different activities and influencing factors like preferences, obligations, and constraints. These take continuous-time or discrete-time forms, with the latter dividing days into fixed intervals and estimating activity engagement probability during each interval [39].
  • Scheduling models, such as the Scheduling Model Framework, capture dynamic and interdependent activity–travel decisions by representing scheduling as a series of choices over time. These consider trade-offs between activity participation utility, travel disutility, and time–space prism constraints [40].
Activity-Based Travel Behavior Theory’s advantage lies in capturing the heterogeneity and flexibility of travel behavior. By explicitly considering the individual characteristics, household interactions, and contextual factors shaping activity–travel patterns, these models provide realistic representations of travel demand and policy responses [41]. This helps identify population segments likely to change their behavior in response to interventions like congestion pricing or public transportation improvements. An important aspect involves considering social and institutional contexts where activity–travel decisions occur, including transportation service availability and quality, land use patterns, urban form, social norms regarding work and leisure, and governing policies and regulations [39]. Incorporating these factors enables comprehensive, policy-sensitive assessment of intervention impacts on travel behavior and congestion.
The theory recognizes interpersonal interactions and joint decision-making in shaping activity–travel patterns. Many activities involve negotiation and coordination, affecting timing, location, and travel mode. Tour-based models represent household activity–travel patterns as series of tours, capturing joint activity participation and travel coordination among household members [42]. A prominent development in this theory is integrating time-use data into modeling frameworks. Time-use surveys collect detailed information on activity and trip sequences and durations over days or weeks, providing rich data for understanding complex patterns of activity participation and travel behavior [39]. This helps identify the typical activity patterns and constraints of different population segments and how these vary by day, season, or life cycle stage.
Applying Activity-Based Travel Behavior Theory in Enugu can provide valuable insights into managing travel demand and congestion in a rapidly developing city. Collecting data on activity patterns, constraints, and preferences enables the identification of key congestion drivers and the development of targeted strategies. The theory can help to identify the specific activity centers and corridors generating the highest travel demand and congestion, based on employment, education, shopping, and leisure activity concentrations. This information prioritizes investments in public transportation, non-motorized infrastructure, and traffic management measures serving high-demand areas. It can evaluate the potential impacts of land use and transportation policies on activity patterns and travel behavior, assessing transit-oriented development, mixed-use zoning, or bike-sharing programs’ potential to reduce car dependence by considering the accessibility, convenience, and cost changes these policies induce. The theory provides a nuanced, equity-focused assessment of the distributional impacts of congestion management strategies. Considering the activity patterns, constraints, and preferences of different segments (low-income households, women, people with disabilities) enables policies that are inclusive and responsive to diverse needs.
However, the application of Activity-Based Travel Behavior Theory in the context of Enugu faces challenges, including limited data availability and quality, potentially requiring innovative collection methods like GPS tracking, mobile phone data, or social media to supplement traditional surveys [43]. The model complexity and computational requirements may necessitate simplified approaches, balancing accuracy and feasibility, or collaboration with academic institutions for technical support [44]. Its implementation requires participatory approaches, engaging stakeholders and communities using qualitative methods like focus groups, interviews, or community mapping to complement quantitative modeling [45]. Despite these challenges, the benefits are significant. By providing a realistic, policy-sensitive assessment of travel demand and congestion while considering diverse user needs, Activity-Based Travel Behavior Theory can help develop effective, equitable, and sustainable transportation strategies, improving quality of life and economic competitiveness in Enugu.

2.1.3. Mobility Transition Theory

Mobility Transition Theory provides a comprehensive framework for understanding the complex process of change in urban transportation systems, particularly in developing countries experiencing rapid economic growth, urbanization, and motorization [46]. Drawing from economics, geography, and sociology, it explains mobility transition patterns and their implications for sustainable urban development [47]. The theory’s proposition is that cities undergo distinct stages of mobility development as they grow, each characterized by different levels of motorization, modal shares, and transportation infrastructure. These stages result from the interplay between economic, demographic, and technological factors, alongside policy and institutional contexts [48].
Stage 1: Pre-motorization, typically featuring low economic development and urbanization with predominantly non-motorized transportation (walking, cycling). Most trips are short and local, while transportation infrastructure remains limited and poorly maintained. As cities develop, however, they experience rapid motorization, driven by rising incomes, falling vehicle ownership costs, and increasing mobility demand [49].
Stage 2: The Motorization Take-off phase is characterized by sharp increases in private vehicles and expanding road networks, with car-oriented urban forms. Non-motorized modal shares decline while private cars and motorcycles increase rapidly. This generates negative externalities—traffic congestion, air pollution, road accidents, and social exclusion—disproportionately affecting low-income and vulnerable groups [22].
Stage 3: Saturation as cities continue motorizing, private vehicle ownership growth slows as markets saturate, and driving costs increase due to congestion and parking restrictions. Simultaneously, motorization’s negative externalities become more apparent, driving demand for alternative transportation modes like public transit, cycling, and walking [50].
Stage 4: Sustainable mobility features a shift toward sustainable, equitable urban transportation, driven by technological innovation, policy reform, and behavioral change [51]. Cities invest in high-quality public transit (BRT, light rail) and cycling/walking infrastructure to reduce car dependence. They adopt policies discouraging private vehicle use—congestion pricing, parking management, car-free zones—to manage demand and reduce externalities [52].
This theory helps to identify key drivers and challenges of sustainable mobility across different contexts. In early-stage cities (many in sub-Saharan Africa), focus centers on providing basic accessibility through non-motorized infrastructure, informal transit services, and low-cost public transportation. Cities experiencing rapid motorization (Asia, Latin America) prioritize managing private vehicle growth through congestion pricing, parking management, and land use planning [53]. Cities entering saturation (Europe, North America) promote shifts toward sustainable transportation through high-quality public transit investments and demand management policies. Cities already in sustainable mobility phases (Copenhagen, Amsterdam) maintain their existing system quality while exploring new technologies like electric vehicles, shared mobility, or mobility-as-a-service [54].
However, it is important to recognize that mobility transition is not linear or deterministic; cities experience different patterns depending on their specific economic, social, and political contexts. Some cities “leapfrog” stages by adopting technologies or policies that bypass motorization’s negative externalities. Others experience “lock-in” effects, where existing infrastructure makes shifts to sustainable modes difficult [55]. The transition is simultaneously technical, economic, social, and political, involving diverse actors with different priorities, values, and incentives. These actors engage in cooperation, competition, or conflict, shaping transition outcomes [56]. Understanding and managing mobility transitions require holistic, inclusive approaches considering complex interplays between factors and stakeholders, balancing economic, social, and environmental dimensions of sustainable urban development. By recognizing distinct transition stages and specific shaping factors, planners and policymakers can develop targeted, effective strategies for managing urban growth and promoting sustainable transportation tailored to their city’s unique context and challenges.
In Enugu, Nigeria, Mobility Transition Theory offers a valuable framework for understanding urban transport trends and guiding sustainable mobility development. Currently in the Motorization Take-off stage, Enugu is experiencing a growing demand for motorized transport due to urbanization and rising incomes, alongside limited non-motorized options like walking and cycling. However, challenges such as its rapid population growth, poor infrastructure, limited funding, and weak institutional capacity hinder progress [5]. This theory aids in identifying both the drivers of and barriers to sustainable mobility, allowing planners to target interventions effectively. For instance, it can help recognize groups likely to adopt private vehicles, such as middle-income households, and encourage shifts toward public transport or non-motorized modes through infrastructure investments and incentives. It also highlights vulnerable groups, like low-income residents, women, and people with disabilities, who risk marginalization in the transition, supporting the creation of inclusive policies like transit subsidies and accessible infrastructure. Furthermore, the theory supports strategies to address the negative effects of motorization, including congestion, pollution, and accidents, through demand management and green transport infrastructure. Finally, it promotes participatory planning by engaging diverse stakeholders to co-develop mobility solutions that reflect economic, social, and environmental priorities

2.1.4. Complexity Theory

This theory provides a novel lens for understanding urban transportation systems, drawing from physics, biology, and the social sciences to explain how complex systems emerge, evolve, and adapt. This approach reveals properties and behaviors that cannot be predicted through traditional linear methods [57]. The theory posits that urban transportation systems transcend the sum of their components—vehicles, roads, and users—arising instead from complex interactions and feedback loops within broader social, economic, and environmental contexts [58]. These interactions generate emergent properties like traffic congestion, self-organization, and phase transitions that cannot be explained by analyzing components in isolation [59]. The key properties applicable to traffic congestion dynamics include the following:
Non-Linearity and Chaos: Complex transportation systems exhibit non-linear and chaotic behavior, where minor changes such as small accidents or slight demand variations can produce disproportionately large outcomes like widespread congestion. This non-linearity challenges accurate traffic forecasting and highlights the potential for chaotic behavior, including sudden congestion onset or traffic jam formation [50].
Fractals and Self-Similarity: Transportation systems display self-similarity and fractal structures, with similar spatial and temporal patterns across different scales—from individual vehicles and intersections to entire cities. This self-similarity suggests underlying rules governing traffic pattern emergence and evolution, offering insights for developing effective management strategies [60].
Emergence and Self-Organization: Traffic congestion emerges not from top-down planning but from the bottom-up interactions of individual vehicles and users. Traffic jams may arise from local vehicle interactions, such as lane-changing or car-following behaviors, rather than centralized control mechanisms [61].
Phase Transitions: The theory emphasizes feedback loops and adaptive behavior in transportation system evolution. Systems constantly adjust to changing conditions due to travel demand variations, road capacity changes, or policy interventions. These feedback loops can amplify or dampen external shock effects, leading to new, potentially more efficient patterns [62].
Complexity Theory necessitates flexible, adaptive, and participatory planning approaches that accommodate inherent system uncertainty. Instead of top-down, command-and-control strategies assuming stable environments, planners need bottom-up, collaborative approaches harnessing collective stakeholder intelligence [63]. Adaptive strategies should adjust in real time to changing conditions, potentially incorporating dynamic pricing mechanisms like congestion charges that incentivize behavior change, and intelligent transportation systems (ITSs) for real-time traffic monitoring and management [64]. Participatory methods (citizen juries, stakeholder workshops, online platforms) can facilitate dialogue and co-creation among diverse groups [65]. Moreover, Complexity Theory suggests that transportation planning requires systemic, integrative perspectives considering multiple dimensions and scales, plus interactions with other urban systems like land use and energy. This involves comprehensive multimodal transportation models capturing complex trade-offs between policy objectives, and holistic evaluation frameworks assessing broader transportation decision impacts [66].
In the context of Enugu, Nigeria, the application of Complexity Theory offers valuable insights for managing traffic congestion in Enugu, a rapidly growing city whose transportation network likely exhibits non-linearity, self-similarity, emergence, and adaptation. Rapid population growth may cause non-linear increases in travel demand and congestion, as infrastructure struggles to meet changing resident needs. This could trigger new travel patterns, increased informal transport use, and self-organized traffic flows in different city areas. Enugu’s transportation system may display self-similar properties, such as fractal road network distribution and power-law scaling of travel distances, suggesting underlying mechanisms governing system evolution. Understanding these can help develop targeted congestion management strategies. Application requires recognizing Enugu’s specific social, economic, and political context, necessitating participatory approaches like community-based mapping, stakeholder dialogues, and citizen science initiatives that engage diverse resident perspectives [67]. Planners must work with local communities to identify specific user group needs (low-income households, women, people with disabilities) and co-design equitable solutions. This might include flexible, affordable public transportation options, like demand-responsive services, and improved non-motorized infrastructure, such as sidewalks and bike lanes [68]. Enugu requires adaptive, learning-oriented planning approaches that evolve with changing system conditions. Dynamic, data-driven tools (real-time traffic monitoring, agent-based modeling, machine learning) can help us to understand and anticipate complex system behaviors [69]. Flexible strategies might include dynamic public transport pricing and routing, real-time user information systems, and adaptive traffic control, optimizing vehicle and pedestrian flow. These strategies should be integrated with cross-sectoral urban planning approaches (transit-oriented development, mixed-use zoning, green infrastructure), creating compact, connected, livable environments. By embracing Complexity Theory principles, Enugu can develop more effective, resilient transportation systems that adapt to rapid urban growth while addressing diverse community needs and promoting sustainable mobility.
While these four theoretical frameworks provide valuable insights into urban transportation dynamics, their application to the specific context of Enugu requires empirical investigation of the city’s unique traffic patterns. Enugu represents a compelling case study of congestion challenges in a mid-sized sub-Saharan city experiencing rapid growth and motorization without corresponding infrastructure development. As highlighted by [5,20], despite previous rehabilitation efforts for major route-ways in Enugu, traffic congestion persists, suggesting the existence of underlying factors beyond physical infrastructure. The absence of comprehensive volumetric traffic analysis along key distributors represents a critical knowledge gap that hinders evidence-based planning. By examining traffic volumes, peak hour factors, and spatiotemporal variations across three major corridors—Abakpa, Nike, and Trans-Ekulu Road—this study aims to empirically characterize Enugu’s congestion dynamics within the theoretical frameworks discussed. Understanding these patterns can illuminate how the mobility transition stage, activity scheduling behaviors, Route Assignment processes, and emergent complexity manifest in Enugu’s specific urban context, thereby providing the foundation for targeted interventions that address the city’s particular congestion challenges.

3. Research Methodology

3.1. Study Area

The study area was Enugu city, a mid-sized developing sub-Saharan city [70] at the heart of Enugu State, southeastern Nigeria (see Figure 1). It has grown from a small coal mining settlement to the status of an urban center with many economic, industrial, and administrative features [71,72].
The present study focused on three main distributor roads in Enugu: Abakpa, Nike, and Trans-Ekulu Road (Figure 2). Specifically, we examined critical congestion points at Abakpa Junction, Nike Road near Nowas Junction, and the Trans-Ekulu roundabout—notorious traffic bottlenecks that experience persistent congestion. These locations represent significant pain points for residents, who frequently seek alternative routes to avoid the substantial delays and frustration these areas cause.
Furthermore, these three major distributors represent critical arteries in Enugu’s transportation network, each serving distinct urban functions, though there are no existing traffic data on the estimated capacity of vehicles per hour for the roads. The Abakpa Road runs approximately 7.2 km from the Abakpa Nike community to Enugu city center, functioning as the primary access corridor for the densely populated eastern residential areas. This dual carriageway features two lanes in each direction, with intermittent dedicated turning lanes at major intersections. The road’s commercial frontage, with numerous unregulated access points and on-street parking, significantly reduces its functional capacity. Nike Road extends 5.6 km from Trans-Ekulu Junction to Nike Lake, serving as a crucial link between the city center and northeastern suburbs. This single carriageway, with one lane in each direction, is compromised by its deteriorating surface conditions and inadequate drainage systems that create bottlenecks during inclement weather. The Trans-Ekulu Road spans 4.3 km, from Nike Lake Hotel Road to the Enugu–Onitsha Expressway, primarily serving mixed residential and institutional land uses, with one lane in each direction.
While our measurement approach utilized single-point data collection at strategic locations along each distributor, these points were specifically selected to capture the most representative traffic dynamics based on preliminary observations and local knowledge. The Abakpa Junction monitoring point captured the convergence of multiple traffic streams from Abakpa, Trans-Ekulu, and the city center; the Nike Road point at Nowas Junction represents where commercial and residential traffic intersect; and the Trans-Ekulu roundabout point served as a critical node where multiple local streets connect to the distributor. This approach aligned with established traffic engineering methodologies, where critical nodes are used to characterize broader corridor performance, particularly in resource-constrained environments [28]. To ensure that the current study’s single-point measurements effectively represented route-way dynamics, we conducted supplementary reconnaissance observations at multiple points along each distributor to confirm traffic flow continuity and identify any significant mid-corridor variations. These observations revealed consistent congestion patterns propagating from the selected measurement points, validating their representativeness of corridor-wide conditions. While this approach had inherent limitations compared to multiple-point measurements along each route, it effectively balanced methodological rigor with practical resource constraints while still enabling the meaningful analysis of spatiotemporal traffic patterns across Enugu’s key distributors.
This study was limited to popular distributors in Enugu city (see Figure 2), but its findings will provide insight or basic knowledge of the volumetric traffic situation along the major route-ways in Enugu and other cities in Nigeria, allowing us to see the urgent need to devise measures to curb traffic congestion. To ensure a comprehensive and representative analysis of the traffic situation in Enugu city, the study employed a survey research design and collected primary data through a week-long traffic census. Besides referring to some secondary sources, the study was based mainly on the primary data sources used to ascertain volumetric data (total number of vehicles) and vehicle flow rate during road traffic jams, including observation through field surveys and the timed countdown of vehicles within traffic queues. This approach was limited to route-way studies, traffic flow rate, and volumetric traffic analysis. This approach was consistent with methodologies employed in previous studies on traffic congestion in Nigerian cities [27,29]. The procedures and processes involved in data collection were carried out by three different groups of research assistants and were supervised and validated by the traffic unit of the Nigerian police, ensuring the reliability and accuracy of the data.

3.2. Data Analysis

The vehicular volume and traffic flow rate were observed and documented at four consecutive 15 min periods for the periodic peak hour selected. The peak hours included morning (7:30 AM–8:30 AM; 8:30 AM–9:30 a.m) and evening (4:00 PM–5:00 p.m; 5:00 PM–6:00 PM; 6:00 pm–7: 00 p.m; 7:00 p.m–8:00 PM), as highlighted by Okeke et al. [9]. The road users’ vehicle types were limited to trucks, private cars, commercial cars, buses, mini-buses, and tricycles (keke). Mean data collected was analyzed using the peak hour factor, mean plots, and chi-square tests.
To determine the traffic conditions, the volumetric data and traffic flow rate were observed at four consecutive 15 min of an hour intervals over the week-long study period, and this was calculated using the peak hour factor formula (Equation (1))
PHF = V/4v15
where
PHF is the peak hour factor.
V = the hourly volume.
V15 = the volume during the peak 15 min of the peak hour.
To effectively capture the spatiotemporal dimensions of the traffic dynamics, the analysis explicitly examined both spatial variation (across the three distributor roads) and temporal fluctuations (across different times of day and days of the week). The spatial component compared traffic volumes, flow characteristics, and congestion patterns between Abakpa, Nike, and Trans-Ekulu Road, which represent distinct corridors within Enugu’s transportation network. Each of these distributors serves different urban contexts and development patterns: Abakpa Road primarily connects densely populated residential areas to the city center; Nike Road links the northeastern suburbs with commercial zones; and Trans-Ekulu Road serves mixed residential and institutional areas. By conducting simultaneous measurements across these three corridors, the study can identify spatial differences in congestion patterns, peak volumes, and traffic distribution that might inform targeted infrastructure or policy interventions for specific areas of the city. This approach aligned with emerging research emphasizing the importance of spatially differentiated analysis for effective urban mobility planning [16].
Furthermore, to determine whether there was any significant difference in the volumetric and traffic flow rate among all the time zones, a chi-square test was conducted at a 95% level of confidence. The chi-square formula is shown in (Equation (2)):
X 2 = ( O i E i ) 2 E i
where
X2 = chi-square.
Oi = the observed value.
Ei = the expected value.

4. Results and Discussion

Traffic counting was performed during the peak hour periods in the morning from 7:30 AM–9:30 AM and then in the evening from 4:00 PM–8:00 PM. Volumes were observed at four consecutive 15 min periods within the peak hours under study. The finding that peak traffic congestion occurs during evening hours from 4 PM to 8 PM contrasts with some earlier studies in Enugu metropolis that identified the morning rush or mid-day hours as the periods of worst congestion [19]. This disparity can be attributed to the evening traffic been often characterized by a diverse range of trip purposes, including not only work-related commutes but also those to leisure activities, shopping trips, and social gatherings. This variety of trip purposes leads to increased traffic demand and congestion as individuals navigate through the city for various reasons. Also, unlike the morning rush hour, where commuters typically depart for their destinations within a narrower time window to reach work or school on time, the evening rush hour may involve delayed departures as commuters and businesses complete their activities before heading home. This staggered departure pattern can prolong the duration of congestion and exacerbate traffic congestion level. However, it aligns with emerging research from other developing cities highlighting a shift towards increased evening-hour delays. For instance, Tiwari and Jain [73] observed an evening rush in Delhi attributable to social and recreational trips overlapping with commutes. As medium-sized cities like Enugu urbanize, off-peak discretionary trips made possible by rising incomes could be contributing to irregular overloaded traffic distribution [5] not conforming to conventional wisdom. Additionally, the marked difference in congestion levels between the morning and evening periods, shown in Table 1, underscores the need for temporal flexibility in transportation policies. Fixed-schedule traffic management schemes such as peak hour dedicated lanes or odd–even rationing based on outdated historical trends will likely fail to account for fluctuating congestion profiles within the same day. Dynamic approaches leveraging advanced data collection and adaptive signaling/routing enabled through intelligent transportation system (ITS) integration offer more promise. For example, Accra’s traffic control center monitors real-time GPS feeds to adjust signal times at junctions where delays are spiking [74]. The observed traffic patterns in Enugu reflect broader challenges faced by rapidly growing secondary cities in the Global South. As Pojani and Stead [22] highlight, these cities often experience a “motorization transition” characterized by increasing car ownership and use, but without the corresponding infrastructure improvements seen in larger metropolises. This mismatch between mobility demand and supply creates unique congestion dynamics that defy conventional modeling approaches developed for more established urban areas. Our findings contribute to the growing body of literature on these “in-between” cities, echoing Cervero’s [75] call for context-specific transportation solutions that account for the informal sector, mixed traffic, and limited institutional capacity typical of such environments.
The volumetric traffic flow rate was calculated using (Equation (1)). Our findings show that the volumetric road traffic is high along the routes in the city area, with a mean total of 2334 vehicles per hour. These results align with the findings of Okeke et al. [4] that the colonial city of Enugu is heavily automobile-dependent. Extending Wei et al.’s [13] comparative built environment analysis, they found increasing car ownership and suburb-to-center commuting as key congestion drivers in rapidly expanding Chinese cities. But Enugu’s results suggest a stronger influence of informal paratransit, mixed traffic, and infrastructure deficits, reflecting its earlier motorization stage.
The volumetric analyses revealed variations in the hourly peak period total volume. The flow rate also varied within every 15 min of the peak hours. The maximum flow rate for every 15 min within the study hour was 243 veh. per 0.25 h, and the maximum flow rate for the study hour was 974 veh/h on Abakpa/Nike Road. The minimum flow rate for every 15 min within the study hour was 155 vehicles per 0.25 h, and the minimum flow rate for an hour was 620 veh/h in Abakpa/Nike Road. The maximum flow rate occurred in the evening within 6:00 PM to 8:00 PM, while the minimum flow rate occurred in the morning between 8:30 AM–9:30 AM. This shows that the peak period of traffic congestion is in the evening as compared to the morning period. The maximum flow rate for every 15 min (243.5 vehicles. per 0.25 h) establishes that the average waiting time for commuters in the evening was higher compared to the morning period, as shown in Table 1. This can be attributed to the fact that, in the evening, the road receives traffic from commuters residing in Nsukka town. Time-sensitive activities can be adduced to influence this variance, since commuters’ behavior varies depending on the time of the day and their specific schedules. Enugu city is the center of attraction for educational, commercial, and healthcare services; therefore, in the morning, commuters may prioritize reaching their destinations promptly to avoid being late. Some commuters may opt for alternative non-motorable routes or modes of transportation in the morning to avoid congested areas, or take advantage of less traffic during off-peak hours, correlating to the user equilibrium (UE) model of Route Assignment. This redistribution of traffic can lead to fluctuations in congestion levels throughout the day, with heavy convergence at the close of business due to commuters returning to various Nsukka suburbs. This situation is worsened by freight and delivery activities, as well as part-time taxi drivers who ply the road in the evening to evade the numerous road union and local authority taxes.
The traffic patterns observed in Enugu position the city within the second stage of Mobility Transition Theory—the “Motorization Take-off” phase—characterized by increasing private vehicle ownership without corresponding infrastructure development. The mean traffic volume of 2334 vehicles per hour across relatively narrow corridors indicates the significant motorization pressure on infrastructure designed for lower volumes. Furthermore, the observed spatial imbalance in traffic distribution, with Abakpa Road consistently experiencing 20–30% higher volumes than alternative routes, exemplifies the inefficient network utilization typical of cities in this transition phase. The complete traffic cessation on Mondays due to political factors also demonstrates the vulnerability of transportation systems in this developmental stage, where redundancy and resilience remain limited. As Enugu continues its mobility transition, these empirical findings suggest that it may experience intensifying congestion challenges before potentially reaching the “saturation” phase, where economic and social pressures could eventually catalyze shifts toward more sustainable and efficient mobility systems. This places Enugu at a critical intervention point in the mobility transition trajectory, where policy decisions could either accelerate progression toward sustainable mobility or risk prolonged congestion challenges through auto-centric development patterns.
The observed evening traffic peaking patterns in Enugu demonstrate the non-linear characteristics of traffic congestion described in Complexity Theory. The addition of just 194 vehicles per hour between the morning and evening peaks on Abakpa/Nike Road (620 versus 974 vehicles) resulted in disproportionately larger congestion effects, exemplifying how seemingly minor changes in traffic volume can produce dramatically amplified system-wide impacts. This non-linear relationship between traffic volume and congestion severity reflects the phase transition property articulated in Complexity Theory, where a transportation network shifts from a free-flowing to a congested state once critical thresholds are crossed. The evening peak’s 57% higher volume surpasses this critical threshold, triggering widespread congestion beyond what a linear relationship would predict. These findings align with Zhu et al.’s [50] observations that small perturbations in urban mobility systems can cascade into system-wide disruptions through non-linear amplification mechanisms.
Consequently, the present study’s findings appear to be at variance with the conclusion reached by [9] regarding peak hour traffic in Abakpa/Nike Road of Enugu metropolis. According to their research report, the mid-day hours of 12 PM to 1 PM and 3 PM to 4 PM were the peak hour traffic periods in the region. This discrepancy could potentially be explained by differences in the data collection period or analysis approach between the two studies. In addition, the present study’s findings contradict the results reported by [27], who observed that the peak period of traffic congestion occurred in the morning. This conflicting result highlights the variability and complexity of traffic patterns as explained in Complexity Theory, where shifts can occur in the short term due to infrastructure projects, policy changes, school/office schedules, etc. For example, recent road expansion work conducted from 2019 to 2022 along Abakpa/Nike Road may have helped ease morning traffic, but more vehicles accessing the CBD area in the evenings could now be causing evening rush hour delays. A longitudinal, multi-site traffic-monitoring effort tracking such infrastructure and land use changes would shed more light on these dynamic patterns.
Nevertheless, this study aligns with the observations of Irunokhai et al. [27] that the average waiting time for commuters in the evening was higher compared to the morning period. The findings of various studies conducted on traffic congestion in the area suggest that the traffic situation is a constant, complex, and dynamic phenomenon, influenced by multiple factors related to the inter-city and intra-city mobility requirements of urban residents. While some researchers have reported peak traffic congestion during morning rush hour, others have identified the mid-day and afternoon hours as peak periods of traffic congestion. These disparate findings highlight the variability of traffic conditions in the area and the need for a more comprehensive understanding of the underlying factors driving traffic patterns. A mixed-methods approach combining quantitative traffic volume data and qualitative interviews/surveys of commuters and transportation authorities could provide richer insights into the key triggers behind peak congestion. Additionally, the adoption of smart traffic-monitoring systems leveraging real-time GPS signals along with traditional manual counts may enable the detection of congestion spikes as they occur and the correlation of them with potential causal events happening in the region.

4.1. Peak Hour Factor (PHF) Results

In Table 2, PHF values closer to 1.0 indicate a more uniform traffic distribution throughout the hour. PHF values closer to 0.25 indicate highly concentrated traffic within a short period. The lowest PHF values (0.79–0.82) occur during the evening peaks, indicating more concentrated traffic flows. Morning periods show higher PHF values (0.88–0.93), indicating more evenly distributed traffic. This analysis reveals that, while Abakpa/Nike Road carries the highest overall volume during evening peaks, it also experiences the most concentrated traffic patterns (PHF = 0.79), creating particularly challenging conditions for traffic management. The combination of high-volume and low-PHF traffic indicates a higher potential for congestion formation during these periods.
Furthermore, the PHF values range from 0.79 to 0.93, indicating moderate to significant fluctuations in traffic volumes within the hourly periods. The lowest PHF value of 0.79 was observed on Abakpa/Nike Road during the evening peak (7:00–8:00 PM), indicating more concentrated traffic during this period, with approximately 31% of the hourly volume occurring in the busiest 15 min interval. Conversely, the morning period on Trans-Ekulu Road exhibited the highest PHF value of 0.93, reflecting a more uniform distribution of traffic throughout the hour. These variations in PHF values across distributors and time periods reveal important differences in the temporal concentration of traffic, with lower PHF values corresponding to periods when road capacity is under the greatest strain.

4.2. Hypothetical Result

The result of the chi-square analysis revealed a computed value of X2 = 55.5, with df = 8. At a 95% level of confidence, the table value is 15.5. Since the calculated value is higher than the table value (55.5 > 15.5), Ho is rejected, while the alternative is accepted. It is therefore concluded that there is a significant difference in volumetric traffic flow rate among the various routes in Enugu urban area. This could be as a result of the causes of traffic congestion in the areas as observed, such as potholes, traffic wardens, the illegal parking of vehicles along the route-ways, delays in removing damaged vehicles along the route-ways, and roadside trading, among others [20].
The significant spatial variations in traffic volumes across the three studied corridors (χ2 = 55.5, df = 8) reflect the fundamental principles of the Traditional Four-Step Transport Model’s Route Assignment phase. The consistently higher traffic volumes on Abakpa Road compared to the Trans-Ekulu and Nike Roads demonstrate how route choice decisions follow user equilibrium principles, where travelers distribute themselves across the network based on perceived travel times and costs. However, the persistence of this imbalance suggests limitations in the network’s ability to reach true equilibrium—a situation that Complexity Theory would attribute to feedback loops between congestion levels and travel behavior. As congestion increases on Abakpa Road, we observe emergent self-organizing behavior, where some travelers adopt alternative routes or departure times, yet these adaptations remain insufficient to fully balance the system. This pattern aligns with the theoretical expectations from the Route Assignment component of the Four-Step Model, where capacity constraints influence route choice, though the observed spatial concentration suggests that additional factors beyond travel time minimization are influencing route selection, including reliability preferences and incomplete network information that traditional models may not fully capture.
The graphical representation in Figure 3 displays the daily traffic volume along the route-ways in Enugu, revealing a conspicuous absence of vehicular traffic on Mondays, which marks the first workday of the week. This observed pattern of vehicular movement can be attributed to the “sit-at-home” order enforced in the Southeast region of Nigeria, which restricts all non-essential activities and movement, thereby compelling individuals to remain in their homes. As a consequence, the absence of vehicular traffic on Mondays is a direct result of compliance with this order. The data analysis reveals that traffic volume is relatively high during the weekend, but Tuesday holds the record for the highest volumetric traffic jam. This can be attributed to the fact that Tuesday has become the de facto first workday of the week in the region. Many businesses and offices resume their operations on Tuesday after the weekend, leading to increased mobility demands and, consequently, increased traffic congestion. On the other hand, traffic volume was observed to be low on Sundays, which is a reflection of the reduced economic and commercial activities on this day owing to the religious inclination of a major proportion of the residents. The observed absence of traffic on Mondays and lower weekend volumes aligns with findings by Okeke et al. [1] regarding the impacts of the “sit-at-home” order on mobility patterns in southeastern Nigeria. The distinctive weekday traffic distribution pattern observed in Enugu, particularly the Tuesday peak phenomenon, can be interpreted through Activity-Based Travel Behavior Theory’s lens of scheduling constraints and activity patterns. The complete absence of traffic on Mondays due to socio-political factors creates a compression effect where activities typically distributed across two weekdays are concentrated into Tuesday. This phenomenon demonstrates how external constraints reshape activity schedules and subsequent travel patterns exactly as predicted by time-use models within Activity-Based Theory. The significant Tuesday peak (followed by gradual decline throughout the week) illustrates Bowman and Ben-Akiva’s [37] concept of activity rescheduling under constraints, where individuals adapt their activity–travel patterns in response to institutional and social limitations. Residents likely reschedule Monday’s postponed essential activities like banking, government services, healthcare appointments, and major shopping to Tuesday, creating accumulated demand that exceeds normal weekday levels. This empirical observation provides valuable insight into how socio-political disruptions reshape activity scheduling in ways that conventional transportation demand models might overlook.
However, the disproportionate peaking of congestion on Tuesdays as the de facto first working day deserves further inquiry. The near absence of traffic on Mondays due to regional political factors also highlights the vulnerabilities and externalities facing transportation infrastructure planning, an insight useful for planners in conflict-prone regions. Adan and Fourie [76] recommend that such socioeconomic concerns be incorporated into traffic simulation models to avoid oversimplification. Furthermore, the dramatic increase in post-lockdown mobility across cities of all sizes underscores an urgent need to mainstream sustainable transportation policies before ad hoc infrastructure expansion enables unsustainable vehicle dependence, as explored by [77]. The weekly traffic pattern observed in Enugu, with its distinctive Tuesday peak, exemplifies the complex interplay between socio-political factors and urban mobility that is often overlooked in traditional transportation planning. This phenomenon aligns with Klopp and Cavoli’s [78] argument for a “Southern perspective” on sustainable urban mobility, which emphasizes the need to consider local governance structures, cultural practices, and economic realities in policy formulation. The “sit-at-home” order’s impact on traffic flows demonstrates how non-transport-related policies can significantly shape urban mobility patterns, echoing findings by Salon and Gulyani [79] on the influence of security concerns on travel behavior in Nairobi. The variability of congestion patterns even at the intra-city level highlights the risks of generalization and need for evidence-based planning that incorporates exogenous factors affecting urban mobility along with traditional supply–demand levers for mitigation. As the city of Enugu faces complex, interconnected challenges of managing post-COVID mobility amidst stretched budgets and accelerating climate risks, hyperlocal research illuminating the when, where, and why behind traffic flows will grow in policy value.
The spatiotemporal analysis reveals distinctive traffic signatures across Enugu’s three major distributors, as illustrated in Figure 3. From a spatial perspective, significant differences emerge in both traffic volumes and temporal distribution patterns. Abakpa/Nike Road consistently experiences the highest traffic volumes (mean = 809.2 vehicles/h), followed closely by Abakpa Road (mean = 805.6 vehicles/h), while Trans-Ekulu Road exhibits comparatively lower volumes (mean = 719.4 vehicles/h). This spatial distribution indicates an imbalanced utilization of the city’s road network capacity, with approximately 12.5% higher traffic volumes concentrated on Abakpa/Nike Road compared to Trans-Ekulu Road.
The spatial variation in congestion vulnerability is further evidenced by the differences in peak hour factors across the three distributors. Abakpa/Nike Road consistently demonstrates lower PHF values (mean = 0.85) compared to Trans-Ekulu Road (mean = 0.88) and Abakpa Road (mean = 0.87), indicating more concentrated traffic peaks that exacerbate congestion risk. This spatial pattern suggests that, even with comparable overall volumes, Abakpa/Nike Road experiences sharper traffic peaks that create disproportionate pressure on its capacity.
Beyond these aggregate differences, the spatial analysis reveals distinct corridor-specific responses to temporal factors. During morning peaks (7:30–8:30 AM), the spatial disparity in traffic volumes between the three roads is relatively modest (8.9% difference), suggesting a more balanced network utilization. However, this spatial distribution shifts dramatically during evening periods, particularly during the 7:00–8:00 PM peak, when the difference increases to 14.9% between Trans-Ekulu and Abakpa/Nike Road. This widening spatial disparity during evening hours indicates that congestion effects are not uniformly distributed across the network.
The day-of-the-week analysis further illuminates how spatial traffic patterns evolve throughout the week. While Tuesday represents the highest volume day across all three distributors following the Monday “sit-at-home” effect, the magnitude of this peak varies spatially, with Abakpa/Nike Road experiencing a more pronounced Tuesday surge (23% above weekly average) compared to Trans-Ekulu Road (18% above weekly average). Similarly, Sunday volume reduction affects the three corridors differently, with Trans-Ekulu Road experiencing the most significant reduction (46% below weekday average), likely reflecting its connection to areas with predominantly religious and institutional land uses that are less active on Sundays.
In relating to wider scholarship, Imoro Musah [80] noted that economic rationale and structural factors underpin individuals’ imperative to resume productive activities after closures, often overwhelming transport infrastructure unprepared for spikes. This resonates with the Tuesday surges found here. But the question remains whether gradual normalization is possible. As Huang et al. [81] discussed in the Chinese context, promoting temporary remote work and flexible scheduling could distribute return commutes more evenly. Furthermore, the observations contradict Bashiru and Waziri’s [29] finding of worst congestion on Mondays. This underscores the need for granular, hyperlocal traffic analysis before policy interventions noted by [82] when assessing Abuja’s transportation challenges. While macro-trends exist, regional socioeconomic distinctions manifest as mobility variations. So prescriptive interventions require the evidence-based assessment of distinct congestion triggers. Critically, the analysis reveals peak hour factors exceeding 1 across days, indicating the irregular spreading of hourly volumes.
The observation of peak hour factors exceeding 1 across multiple days provides empirical evidence of the micro-level decision-making processes described in Activity-Based Travel Behavior Theory. These elevated PHF values indicate that, rather than conforming to conventional peak spreading patterns, Enugu’s travelers are making nuanced departure time choices based on their individual activity schedules and constraints. The 15 min interval analysis reveals that travelers are not simply shifting trips earlier or later to avoid peak congestion, as rational choice theory might predict; instead, they appear to be prioritizing activity participation over travel time minimization. This behavior aligns with [38]’s assertion that activity scheduling takes precedence over travel optimization in many contexts. The irregular volume distribution suggests that travelers are making complex trade-offs between arrival time requirements (such as work or school schedules), optimal activity duration, and household constraints—exactly the multi-dimensional decision space that Activity-Based models are designed to capture. The particularly high PHF values observed on Tuesdays further reinforce how institutional constraints (in this case, the Monday mobility restrictions) shape subsequent activity scheduling and time-of-day travel choices.
Hawas [83] highlighted how using offset working times and high-occupancy lanes for peaks can temper congestion. But further study into the behaviors driving peaking tendencies could lead to customized solutions balancing adherence needs and flow. The complexity also warrants exploring public transit and multimodal options in fast-growing contexts, as Saberi et al. [84] discussed regarding Iranian cities. These findings offer a granular perspective into mobility changes in developing urban areas, highlighting how both external and internal triggers like economic reactivation and infrastructure limitations interact to shape acute congestion. While consonant with wider trends, notable place-specific nuances exist, demanding tailored, evidence-led interventions as opposed to monolithic transport planning. In the broader context of sustainable urban development, our findings contribute to the ongoing debate about the applicability of global “best practices” in diverse local contexts. As Watson [85] argues, there is a need to “see from the South” when addressing urban challenges in the rapidly growing cities of the Global South. The unique traffic patterns observed in Enugu, influenced by factors ranging from informal economic activities to regional political dynamics, reinforce this perspective. They call for a reimagining of urban mobility solutions that goes beyond technocratic approaches, aligning with Parnell and Robinson’s [86] vision of a more grounded, context-sensitive urban theory. As cities like Enugu navigate the complexities of sustainable development amidst resource constraints and climate change pressures, studies such as ours provide crucial empirical foundations for developing locally appropriate, globally informed mobility strategies.

5. Conclusions and Recommendations

Urban transportation planning has become a critical concern in contemporary cities, as growing populations and increasing vehicle use have led to significant traffic congestion problems. In order to develop effective strategies for managing and mitigating these issues, it is essential to have an accurate and comprehensive understanding of the volumetric traffic patterns and congestion levels within the affected areas. This is particularly true for rapidly growing cities in the global south, such as Enugu, Nigeria, where the interplay of various socioeconomic, political, and infrastructural factors contributes to the unique and complex nature of traffic congestion. The present study analyzed volumetric traffic congestion along major route-ways in Enugu city, Nigeria. The findings reveal a complex and dynamic pattern of traffic flow throughout the week, with high volumetric road traffic observed on most days, except for Sundays and Mondays. The study highlights the critical role of socioeconomic, political, and infrastructural factors in shaping the unique traffic characteristics of Enugu city. It identified the peak period of traffic congestion, which occurs in the evenings, particularly between 6 PM and 8 PM. During these hours, commuters experience significantly longer waiting times compared to morning periods, suggesting a need for targeted interventions to alleviate congestion during these specific time frames. Tuesdays record the highest volumetric traffic, a phenomenon likely attributed to its function as the de facto first working day of the week in the region following the Monday “sit-at-home” order.
The study further highlights the spatial variation in traffic congestion within Enugu city, with Abakpa Road consistently experiencing higher average traffic flow compared to Trans-Ekulu Road and Abakpa/Nike Road. This finding underscores the importance of location-specific traffic management strategies and interventions tailored to the unique characteristics of each route-way. Several factors contribute to traffic congestion in Enugu city, such as potholes, traffic warden activities, the illegal parking of vehicles along the route-ways, delays in removing damaged vehicles, and roadside trading. These findings emphasize the need for a holistic approach to traffic management that addresses not only infrastructural issues but also human factors and enforcement of traffic rules and regulations. The chi-square test results reveal a significant difference in the volumetric traffic flow rate among the various route-ways in Enugu city, highlighting the heterogeneous nature of traffic patterns within the city. This finding suggests that a one-size-fits-all approach to traffic management may not be effective, and that interventions should be tailored to the specific characteristics and needs of each route-way. The low volumetric traffic observed on Sundays in Enugu city is another notable finding of this study, which can be attributed to the reduced economic and commercial activities on this day due to the religious inclinations of a significant proportion of the residents. Based on the results of the study, the following recommendations are proposed:
  • Prioritize traffic management interventions along Abakpa Road, as the mean values for both morning and evening traffic suggest that this route consistently has a higher average flow compared to Trans-Ekulu Road and Abakpa/Nike Road.
  • Implement targeted traffic control measures, such as adaptive signal timing or dynamic lane allocation, during the identified peak congestion periods, particularly between 6 PM and 8 PM, to alleviate the extended waiting times experienced by commuters in the evenings.
  • Develop a comprehensive traffic management plan for Tuesdays, as the study revealed that this day records the highest volumetric traffic, likely due to its function as the de facto first working day of the week in the region following the Monday “sit-at-home” order.
  • Collaborate with local authorities, research institutes, and stakeholders to address the identified causes of traffic congestion specific to Enugu city, such as potholes, traffic warden activities, the illegal parking of vehicles along the route-ways, and roadside trading.
  • Invest in the rapid removal of damaged vehicles along the route-ways to minimize their contribution to traffic congestion in Enugu city.
  • Develop and implement a public awareness campaign to educate road users in Enugu city about the identified peak congestion periods and encourage them to plan their journeys accordingly, promoting off-peak travel when possible.
  • Strengthen the enforcement of traffic rules and regulations along the studied route-ways in Enugu city to minimize the impact of human factors on traffic congestion, such as illegal parking and roadside trading.
  • Collaborate with local governments to adjust public transport schedules on Tuesday, pilot staggered work hours, or clearly specify how to balance political factors with daily traffic needs.

Implications and Future Considerations

  • The observed traffic patterns underscore the importance of efficient traffic management strategies, particularly during peak hours.
  • The identified peak periods can inform the implementation of targeted interventions, such as traffic diversions or improved road infrastructure, to alleviate congestion.
  • Further studies could delve into the factors influencing traffic patterns, considering socioeconomic factors, urban planning, and potential road expansions.
It is imperative that future research focuses on exploring the long-term complex dynamics of traffic congestion and developing evidence-based solutions to address this critical challenge in urban areas. Also, future research should integrate low-cost technologies (such as mobile phone signal data and drone aerial photography) to expand their observation range or introduce traffic simulation models (like Vissim) to simulate the effects of different policy interventions (such as optimizing intersection signals or widening lanes).

Author Contributions

Conceptualization, G.O.C. and M.O.I.; methodology, G.O.C., F.O.O. and M.O.I.; software, S.G.; validation, F.O.O., E.D.O. and C.A.O.; formal analysis, F.O.O. and M.O.I.; investigation, F.C.A.; resources, F.C.A. and A.E.I.; data curation, F.O.O.; writing—original draft preparation, G.O.C. and M.O.I.; writing—review and editing, F.O.O., R.N.-O., A.E.I., E.D.O. and S.G.; visualization, C.A.O.; supervision, F.O.O.; project administration, G.O.C.; funding acquisition, R.N.-O. All authors have read and agreed to the published version of the manuscript.

Funding

This research received no external funding.

Institutional Review Board Statement

Approval was obtained from the Ethics Committee of the Faculty of Environmental Studies, University of Nigeria, Enugu Campus, ref. FES/UN/EC.8/101/Vol2. The procedures used in this study adhere to the tenets of the Declaration of Helsinki.

Informed Consent Statement

The authors confirm they sought and obtained informed consent from all participants in the study.

Data Availability Statement

The authors confirm that the data supporting the findings of this study are available within the article.

Conflicts of Interest

The authors declare that they have no known competing financial interests or personal relationships that could have appeared to influence the work reported in this paper.

References

  1. Okeke, F.O.; Echendu, F.I.; Nnaemeka-Okeke, R.C. Determinants of intra-urban travel in southeast Nigeria; evidence from city of Enugu. Transp. Probl. 2021, 16, 185–198. [Google Scholar] [CrossRef]
  2. Rześny-Cieplińska, J. Overview of the practices in the integration of passenger mobility and freight deliveries in urban areas. Case Stud. Transp. Policy 2023, 14, 101106. [Google Scholar] [CrossRef]
  3. Okosun, A.E.; Okeke, F.O.; Igwe, A.E.; Ezema, E.C.; Okpalike, C.O. Rural area infrastructural challenges and the role of architecture in urban-rural development in Nigeria. Eur. J. Sustain. Dev. 2023, 12, 305. [Google Scholar] [CrossRef]
  4. Okeke, F.O.; Okosun, A.E.; Udeh, C.A.; Okekeogbu, C.J. Cities for People: The Dependency & Impact of Automobile in the Life of City Dwellers. Eur. J. Sustain. Dev. 2020, 9, 157–178. [Google Scholar] [CrossRef]
  5. Echendu, I.F.; Okeke, F.O.; Nnaemeka-Okeke, R.C. An investigation of challenges in the existing pattern of intra-city traffic in Enugu metropolis. TeMA J. Land Use Mobil. Environ. 2020, 13, 191–208. [Google Scholar] [CrossRef]
  6. Okpalike, C.O.; Okeke, F.O.; Ezema, E.C.; Oforji, P.I.; Igwe, E.A. Effects of Renovation on Ventilation and Energy Saving in Residential Building. Civ. Eng. J. 2021, 7, 124–134. [Google Scholar] [CrossRef]
  7. Chukwurah, G.O.; Onwuneme John-nsa, C.; Okeke, F.O.; Chukwudi, E.C.; Ogorchukwu, I.M. Rapid spatial growth of cities and its planning implications for developing countries: A case study of Abuja, Nigeria. Indones. J. Geogr. 2022, 54, 313–320. [Google Scholar] [CrossRef]
  8. Jilani, U.; Asif, M.; Zia, M.; Rashid, M.; Shams, S.; Otero, P. A Systematic Review on Urban Road Traffic Congestion. Wirel. Pers. Commun. 2023, 140, 81–109. [Google Scholar] [CrossRef]
  9. Okeke, F.O.; Gyoh, L.; Echendu, F.I. Impact of land use morphology on urban transportation. Civ. Eng. J. 2021, 7, 1753–1773. [Google Scholar] [CrossRef]
  10. Chukwurah, G.O.; Okeke, F.O.; Isimah, M.O.; Igwe, A.E. Assessment of the performance of railway transportation in Nigeria from 1970 to 2010. Sci. Afr. 2022, 15, e01120. [Google Scholar] [CrossRef]
  11. Nwankwo, C. Environmental change and identity questions in farmer and herder’s eco-violence narratives in the Nigerian Benue Valley. SN Soc. Sci. 2024, 4, 50. [Google Scholar] [CrossRef]
  12. Almeida, A.; Brás, S.; Sargento, S.; Oliveira, I. Exploring bus tracking data to characterize urban traffic congestion. J. Urban Mobil. 2023, 4, 100065. [Google Scholar] [CrossRef]
  13. Wei, X.; Ren, Y.; Shen, L.; Shu, T. Exploring the spatiotemporal pattern of traffic congestion performance of large cities in China: A real-time data based investigation. Environ. Impact Assess. Rev. 2022, 95, 106808. [Google Scholar] [CrossRef]
  14. Huang, Z.; Loo, B.P.Y. Urban traffic congestion in twelve large metropolitan cities: A thematic analysis of local news contents, 2009–2018. Int. J. Sustain. Transp. 2023, 17, 592–614. [Google Scholar] [CrossRef]
  15. Noor, M.A.; Ashrafi, S.; Fattah, M.A.; Morshed, S.R.; Rahman, S. Assessment of traffic congestion scenario at the CBD areas in a developing city: In the context of Khulna City, Bangladesh. Transp. Res. Interdiscip. Perspect. 2021, 11, 100435. [Google Scholar] [CrossRef]
  16. Rouky, N.; Bousouf, A.; Benmoussa, O.; Fri, M. A spatiotemporal analysis of traffic congestion patterns using clustering algorithms: A case study of Casablanca. Decis. Anal. J. 2024, 10, 100404. [Google Scholar] [CrossRef]
  17. Irunokhai, E.A.; Adigun, J.O. Reducing Traffic Congestion and Violation Using Round Robin Algorithm. Int. J. Appl. Res. Technol. 2019, 8, 50–55. [Google Scholar]
  18. Okeke, F.O.; Eziyi, I.O.; Udeh, C.A.; Ezema, E.C. City as Habitat: Assembling the fragile city. Civ. Eng. J. 2020, 6, 1143–1154. [Google Scholar] [CrossRef]
  19. Ali, A.N. An assessment of the quality of intraurban bus services in the city of Enugu, Enugu State, Nigeria. Theor. Empir. Res. Urban Manag. 2010, 5, 74–91. [Google Scholar]
  20. Uwadiegwu, B.O. Factors Responsible for Traffic Congestion in Nigeria, A Case Study of Mayor Bus Stop and Coal Camp Along Agbani Road in Enugu City, Nigeria. J. Environ. Earth 2013, 3, 71–78. [Google Scholar]
  21. Vidović, K.; Mandžuka, S.; Brčić, D. Estimation of urban mobility using public mobile network. In Proceedings of the 2017 International Symposium ELMAR, Zadar, Croatia, 18–20 September 2017; pp. 21–24. [Google Scholar] [CrossRef]
  22. Pojani, D.; Stead, D. The Urban Transport Crisis in Emerging Economies: An Introduction. In The Urban Transport Crisis in Emerging Economies; Springer: Cham, Switzerland, 2017; pp. 1–10. [Google Scholar]
  23. Agyapong, F.; Ojo, T.K. Managing traffic congestion in the Accra Central Market, Ghana. J. Urban Manag. 2018, 7, 85–96. [Google Scholar] [CrossRef]
  24. Chakrabartty, A.; Gupta, S. Estimation of congestion cost in the city of Kolkata-a case study. Curr. Urban Stud. 2015, 3, 95–104. [Google Scholar] [CrossRef]
  25. Chao, D. Research on Solutions for Urban Traffic Congestion. In Proceedings of the 2016 2nd International Conference on Humanities and Social Science Research, Singapore, 29–31 July 2016; Volume 41, pp. 195–201. [Google Scholar]
  26. Onyeneke, C.C. Causes and Effects of Traffic Congestions in Nigeria. Glob. J. Sci. Front. Res. 2018, 18, 7–16. [Google Scholar]
  27. Irunokhai, E.A.; Onihunwa, J.O.; Oni, E.K.; Adigun, J.O.; Dada, O.S. Analysis of Traffic Congestion on Nigerian Roads (A Case Study of Sango T Junction, Ibadan). Int. J. Comput. Appl. 2020, 176, 0975–8887. [Google Scholar]
  28. Ukpata, J.O.; Etika, A.A. Traffic Congestion in Major Cities of Nigeria. Int. J. Eng. Technol. 2012, 2, 1433–1438. [Google Scholar]
  29. Bashiru, A.R.; Waziri, O.O. Analysis of Intra-Urban Traffic Problems in Nigeria; A study of Lagos Metropolis. Indones. J. Geogr. 2008, 40, 31–51. [Google Scholar]
  30. Aderamo, A.J.; Atomode, T.I. Traffic Congestion at Road Intersection in Ilorin, Nigeria. Aust. J. Basic Appl. Sci. 2011, 5, 1439–1448. [Google Scholar]
  31. Ortúzar, J.D.D.; Willumsen, L.G. Modelling Transport, 4th ed.; John Wiley & Sons: Chichester, UK, 2011. [Google Scholar]
  32. Singh, R.; Lukman, A.; Flintsch, G.; Dymond, R.; Wu, Z. Road traffic congestion analysis using the four-step model for a small urban area. Case Stud. Transp. Policy 2021, 9, 525–537. [Google Scholar] [CrossRef]
  33. Outwater, M.; Bradley, M.; Ferdous, N.; Bhat, C.; Pendyala, R.; Hess, S.; Daly, A.; LaMondia, J. Tour-Based National Model System Estimator, Tour-Based and Supply Chain-Focused National Freight Model System Estimator; Federal Highway Administration: Washington, DC, USA, 2018.
  34. Barcelo, J. Fundamentals of Traffic Simulation; Springer: New York, NY, USA, 2010. [Google Scholar] [CrossRef]
  35. Castiglione, J.; Bradley, M.; Gliebe, J. Activity-Based Travel Demand Models: A Primer; The National Academy Press: Washington, DC, USA, 2015. [Google Scholar] [CrossRef]
  36. Pinjari, A.R.; Bhat, C.R. Activity-Based Travel Demand Analysis. In A Handbook of Transport Economics; de Palma, A., Lindsey, R., Quinet, E., Vickerman, R., Eds.; Edward Elgar Publishing: Cheltenham, UK, 2011; pp. 213–248. [Google Scholar]
  37. Bowman, J.L.; Ben-Akiva, M.E. Activity-based disaggregate travel demand model system with activity schedules. Transp. Res. Part A Policy Pract. 2001, 35, 1–28. [Google Scholar] [CrossRef]
  38. Ettema, D.; Timmermans, H. Activity-Based Approaches to Travel Analysis; Pergamon: Oxford, UK, 1997. [Google Scholar]
  39. Bhat, C.R.; Koppelman, F.S. A retrospective and prospective survey of time-use research. Transportation 1999, 26, 119–139. [Google Scholar] [CrossRef]
  40. Miller, E.J.; Roorda, M.J. Prototype model of household activity–travel scheduling. Transp. Res. Rec. 2003, 1831, 114–121. [Google Scholar] [CrossRef]
  41. Habib, K.M.N.; Day, N.; Miller, E.J. An investigation of commuting trip timing and mode choice in the Greater Toronto Area: Application of a joint discrete-continuous model. Transp. Res. Part A Policy Pract. 2008, 42, 1139–1153. [Google Scholar] [CrossRef]
  42. Shiftan, Y.; Suhrbier, J. The analysis of travel and emission impacts of travel demand management strategies using activity-based models. Transportation 2002, 29, 145–168. [Google Scholar] [CrossRef]
  43. Anda, C.; Erath, A.; Fourie, P.J. Transport modelling in the age of big data. Int. J. Urban Sci. 2018, 22, 1–24. [Google Scholar] [CrossRef]
  44. Jovic, J.; Djoric, V. Application of transport demand modeling in pollution estimation of a street network. Therm. Sci. 2009, 13, 229–243. [Google Scholar] [CrossRef]
  45. Le Dantec, C.A.; Asad, M.; Misra, A.; Watkins, K.E. Planning with crowdsourced data: Rhetoric and representation in transportation planning. In Proceedings of the 18th ACM Conference on Computer Supported Cooperative Work & Social Computing, Vancouver, BC, Canada, 14–18 March 2015; pp. 1717–1727. [Google Scholar] [CrossRef]
  46. Lanz, B.; Scheiner, J.; Holz-Rau, C. Travel mode choice: Mobility transitions over the life course. Transportation 2021, 48, 621–646. [Google Scholar]
  47. Lall, S.V.; Henderson, J.V.; Venables, A.J. Africa’s Cities: Opening Doors to the World; The World Bank: Washington, DC, USA, 2017. [Google Scholar] [CrossRef]
  48. Kuhnimhof, T.; Armoogum, J.; Buehler, R.; Dargay, J.; Denstadli, J.M.; Yamamoto, T. Men shape a downward trend in car use among young adults—Evidence from six industrialized countries. Transp. Rev. 2012, 32, 761–779. [Google Scholar] [CrossRef]
  49. Echenique, M.H.; Hargreaves, A.J.; Mitchell, G.; Namdeo, A. Growing cities sustainably: Does urban form really matter? J. Am. Plan. Assoc. 2012, 78, 121–137. [Google Scholar] [CrossRef]
  50. Zhu, J.; Pu, Y.; Huang, K.; Wang, X. Optimization Models for Urban Road Transportation Network. In Proceedings of the Eighth International Conference of Chinese Logistics and Transportation Professionals, Chengdu, China, 31 July–3 August 2008; ASCE: Reston, VA, USA, 2009; pp. 3455–3461. [Google Scholar] [CrossRef]
  51. Vasconcellos, E.A. Urban Transport, Environment and Equity. The Case for Developing Countries; Earthscan: London, UK, 2001. [Google Scholar]
  52. Banister, D. Cities, mobility and climate change. J. Transp. Geogr. 2011, 19, 1538–1546. [Google Scholar] [CrossRef]
  53. Cervero, R. Linking urban transport and land use in developing countries. J. Transp. Land Use 2013, 6, 7–24. [Google Scholar] [CrossRef]
  54. Hickman, R.; Ashiru, O.; Banister, D. Transport and climate change: Simulating the options for carbon reduction in London. Transp. Policy 2019, 12, 110–125. [Google Scholar] [CrossRef]
  55. Klinger, T.; Kenworthy, J.R.; Lanzendorf, M. Dimensions of urban mobility cultures–a comparison of German cities. J. Transp. Geogr. 2013, 31, 18–29. [Google Scholar] [CrossRef]
  56. Umaña-Barrios, N.; Gil, A.S. How Can Spatial Design Promote Inclusivity, Gender Equality and Overall Sustainability in Costa Rica’s Urban Mobility System? Procedia Eng. 2017, 198, 1018–1035. [Google Scholar] [CrossRef]
  57. Batty, M. The New Science of Cities; MIT Press: Cambridge, MA, USA, 2013. [Google Scholar] [CrossRef]
  58. Rundle, M.; Freeman, C.; Anthonissen, J.; Lovett, A.; Dallimer, M. Applying complexity theory for sustainable urban planning: Conceptualizing cities as social-ecological-technical systems. Front. Environ. Sci. 2020, 8, 131. [Google Scholar] [CrossRef]
  59. Chen, J.; Xu, C.; Zhang, M.; Wang, H. Exploring urban taxi ridership and local associated factors using GPS data and geographically weighted regression. Cities 2017, 74, 161–170. [Google Scholar] [CrossRef]
  60. Huang, Z.; Zheng, P.; Wen, Y.; Ye, B. Complexity and self-similarity in urban traffic system. Phys. A 2017, 469, 654–665. [Google Scholar] [CrossRef]
  61. Avella, P.; Bernardi, G.; Boccia, M.; Mattia, S. An optimization approach for congestion control in network routing with quality of service requirements. Networks 2019, 74, 124–133. [Google Scholar] [CrossRef]
  62. Ganin, A.A.; Kitsak, M.; Marchese, D.; Keisler, J.M.; Seager, T.; Linkov, I. Resilience and efficiency in transportation networks. Sci. Adv. 2017, 3, e1701079. [Google Scholar] [CrossRef]
  63. Sengupta, U.; Rauws, W.S.; de Roo, G. Planning and complexity: Engaging with temporal dynamics, uncertainty and complex adaptive systems. Environ. Plan. B Plan. Des. 2016, 43, 970–974. [Google Scholar] [CrossRef]
  64. Zheng, H.; Son, Y.J.; Chiu, Y.C.; Head, L.; Feng, Y.; Xi, H.; Kim, S.; Hickman, M. A Primer for Agent-Based Simulation and Modeling in Transportation Applications, 2nd ed.; Federal Highway Administration: Washington, DC, USA, 2020. Available online: https://rosap.ntl.bts.gov/view/dot/50492 (accessed on 22 November 2024).
  65. Le Pira, M.; Ignaccolo, M.; Inturri, G.; Pluchino, A.; Rapisarda, A. Modelling stakeholder participation in transport planning. Case Stud. Transp. Policy 2015, 3, 230–238. [Google Scholar] [CrossRef]
  66. Gonzalez-Feliu, J.; Salanova Grau, J.M.; Beziat, A. A decision support system for city logistics: A methodological approach and its application to a French urban area. In Models and Technologies for Intelligent Transportation Systems; CRC Press: Boca Raton, FL, USA, 2014; pp. 301–313. [Google Scholar] [CrossRef]
  67. Agyemang, E.; Amedzro, K.K.; Silva, E. The emergence of city-regions and their implications for contemporary spatial governance: Evidence from Ghana. Cities 2017, 71, 70–79. [Google Scholar] [CrossRef]
  68. Okosun, A.E.; Okeke, F.O.; Igwe, A.E.; Ezema, E.C. Transit, walking and cycling infrastructure and sustainable development in Enugu city, Nigeria. IOP Conf. Ser. Earth Environ. Sci. 2023, 1239, 012022. [Google Scholar] [CrossRef]
  69. Leung, K.H.; Choy, K.L.; Siu, P.K.; Ho, G.T.; Lam, H.Y.; Lee, C.K. A B2C e-commerce intelligent system for re-engineering the e-order fulfilment process. Expert Syst. Appl. 2018, 91, 386–401. [Google Scholar] [CrossRef]
  70. Okeke, F.O.; Sam-Amobi, C.; Okeke, F.I. Role of local town planning authorities in building collapse in Nigeria: Evidence from Enugu metropolis. Heliyon 2020, 6, e04361. [Google Scholar] [CrossRef]
  71. Mba, E.J.; Okeke, F.O.; Igwe, A.E.; Ebohon, O.J.; Awe, F.C. Changing needs and demand of clients vs ability to pay in architectural industry. J. Asian Archit. Build. Eng. 2025, 15, 1–24. [Google Scholar] [CrossRef]
  72. Mba, E.J.; Okeke, F.O.; Igwe, A.E.; Ozigbo, C.A.; Oforji, P.I.; Ozigbo, I.W. Evolving trends and challenges in sustainable architectural design; a practice perspective. Heliyon 2024, 10, e39400. [Google Scholar] [CrossRef]
  73. Tiwari, G.; Jain, D. Accessibility and safety indicators for all road users: Case study Delhi BRT. J. Transp. Geogr. 2012, 22, 87–95. [Google Scholar] [CrossRef]
  74. Agyemang, E. The emergence of intelligent transport systems in Ghana. GeoJournal 2015, 80, 769–785. [Google Scholar]
  75. Cervero, R. Transport Infrastructure and the Environment: Sustainable Mobility and Urbanism; IDB Working Paper No. 380; Inter-American Development Bank: Washington, DC, USA, 2013. [Google Scholar] [CrossRef]
  76. Adan, I.; Fourie, P.J. Optimizing traffic control vehicle priorities through socio-economic modeling. J. Transp. Eng. 2006, 132, 130–137. [Google Scholar]
  77. Ariza-Álvarez, A.; Soria-Lara, J.A.; Aguilera-Benavente, F. Planning Adaptive Strategies for Urban Transport and Land Use using Scenario-Building. Transp. Res. Procedia 2022, 60, 274–281. [Google Scholar] [CrossRef]
  78. Klopp, J.M.; Cavoli, C. The paratransit puzzle: Mapping and master planning for transportation in Maputo and Nairobi. In The Routledge Handbook of Planning Megacities in the Global South; Routledge: London, UK, 2019; pp. 504–518. [Google Scholar]
  79. Salon, D.; Gulyani, S. Commuting in Urban Kenya: Unpacking travel demand in large and small Kenyan cities. Sustainability 2019, 11, 3823. [Google Scholar] [CrossRef]
  80. Imoro Musah, B.; Peng, L.; Xu, Y. Urban Congestion and Pollution: A Quest for Cogent Solutions for Accra City. IOP Conf. Ser. Earth Environ. Sci. 2020, 435, 012026. [Google Scholar] [CrossRef]
  81. Huang, Q.; Feng, S.; Zhang, G.; Zhang, Y.; Harumain, Y.A.S. Commuter Bus Operation Rules under Two Traffic Scenarios and Two Weather Conditions: Naturalistic Driving Study on Vehicle Speed and Clearance. Sustainability 2022, 14, 2473. [Google Scholar] [CrossRef]
  82. Abuh, P.O.; John, J.A. Geographic Analysis of Traffic Congestion in FCT-Abuja, Nigeria. J. Sustain. Environ. Manag. 2023, 2, 26–32. [Google Scholar] [CrossRef]
  83. Hawas, Y.E. A multi-paradigm approach to modeling the effects of offset time on congested urban road networks. Simul. Model. Pract. Theory 2007, 15, 1314–1336. [Google Scholar]
  84. Karimi, S.; Samadzad, M.; Lesteven, G. Navigating public transport during a pandemic: Key lessons on travel behavior and social equity from two surveys in Tehran. Transp. Res. Part A Policy Pract. 2024, 184, 104075. [Google Scholar] [CrossRef]
  85. Watson, V. Seeing from the South: Refocusing urban planning on the globe’s central urban issues. Urban Stud. 2009, 46, 2259–2275. [Google Scholar] [CrossRef]
  86. Parnell, S.; Robinson, J. (Re)theorizing cities from the Global South: Looking beyond neoliberalism. Urban Geogr. 2012, 33, 593–617. [Google Scholar] [CrossRef]
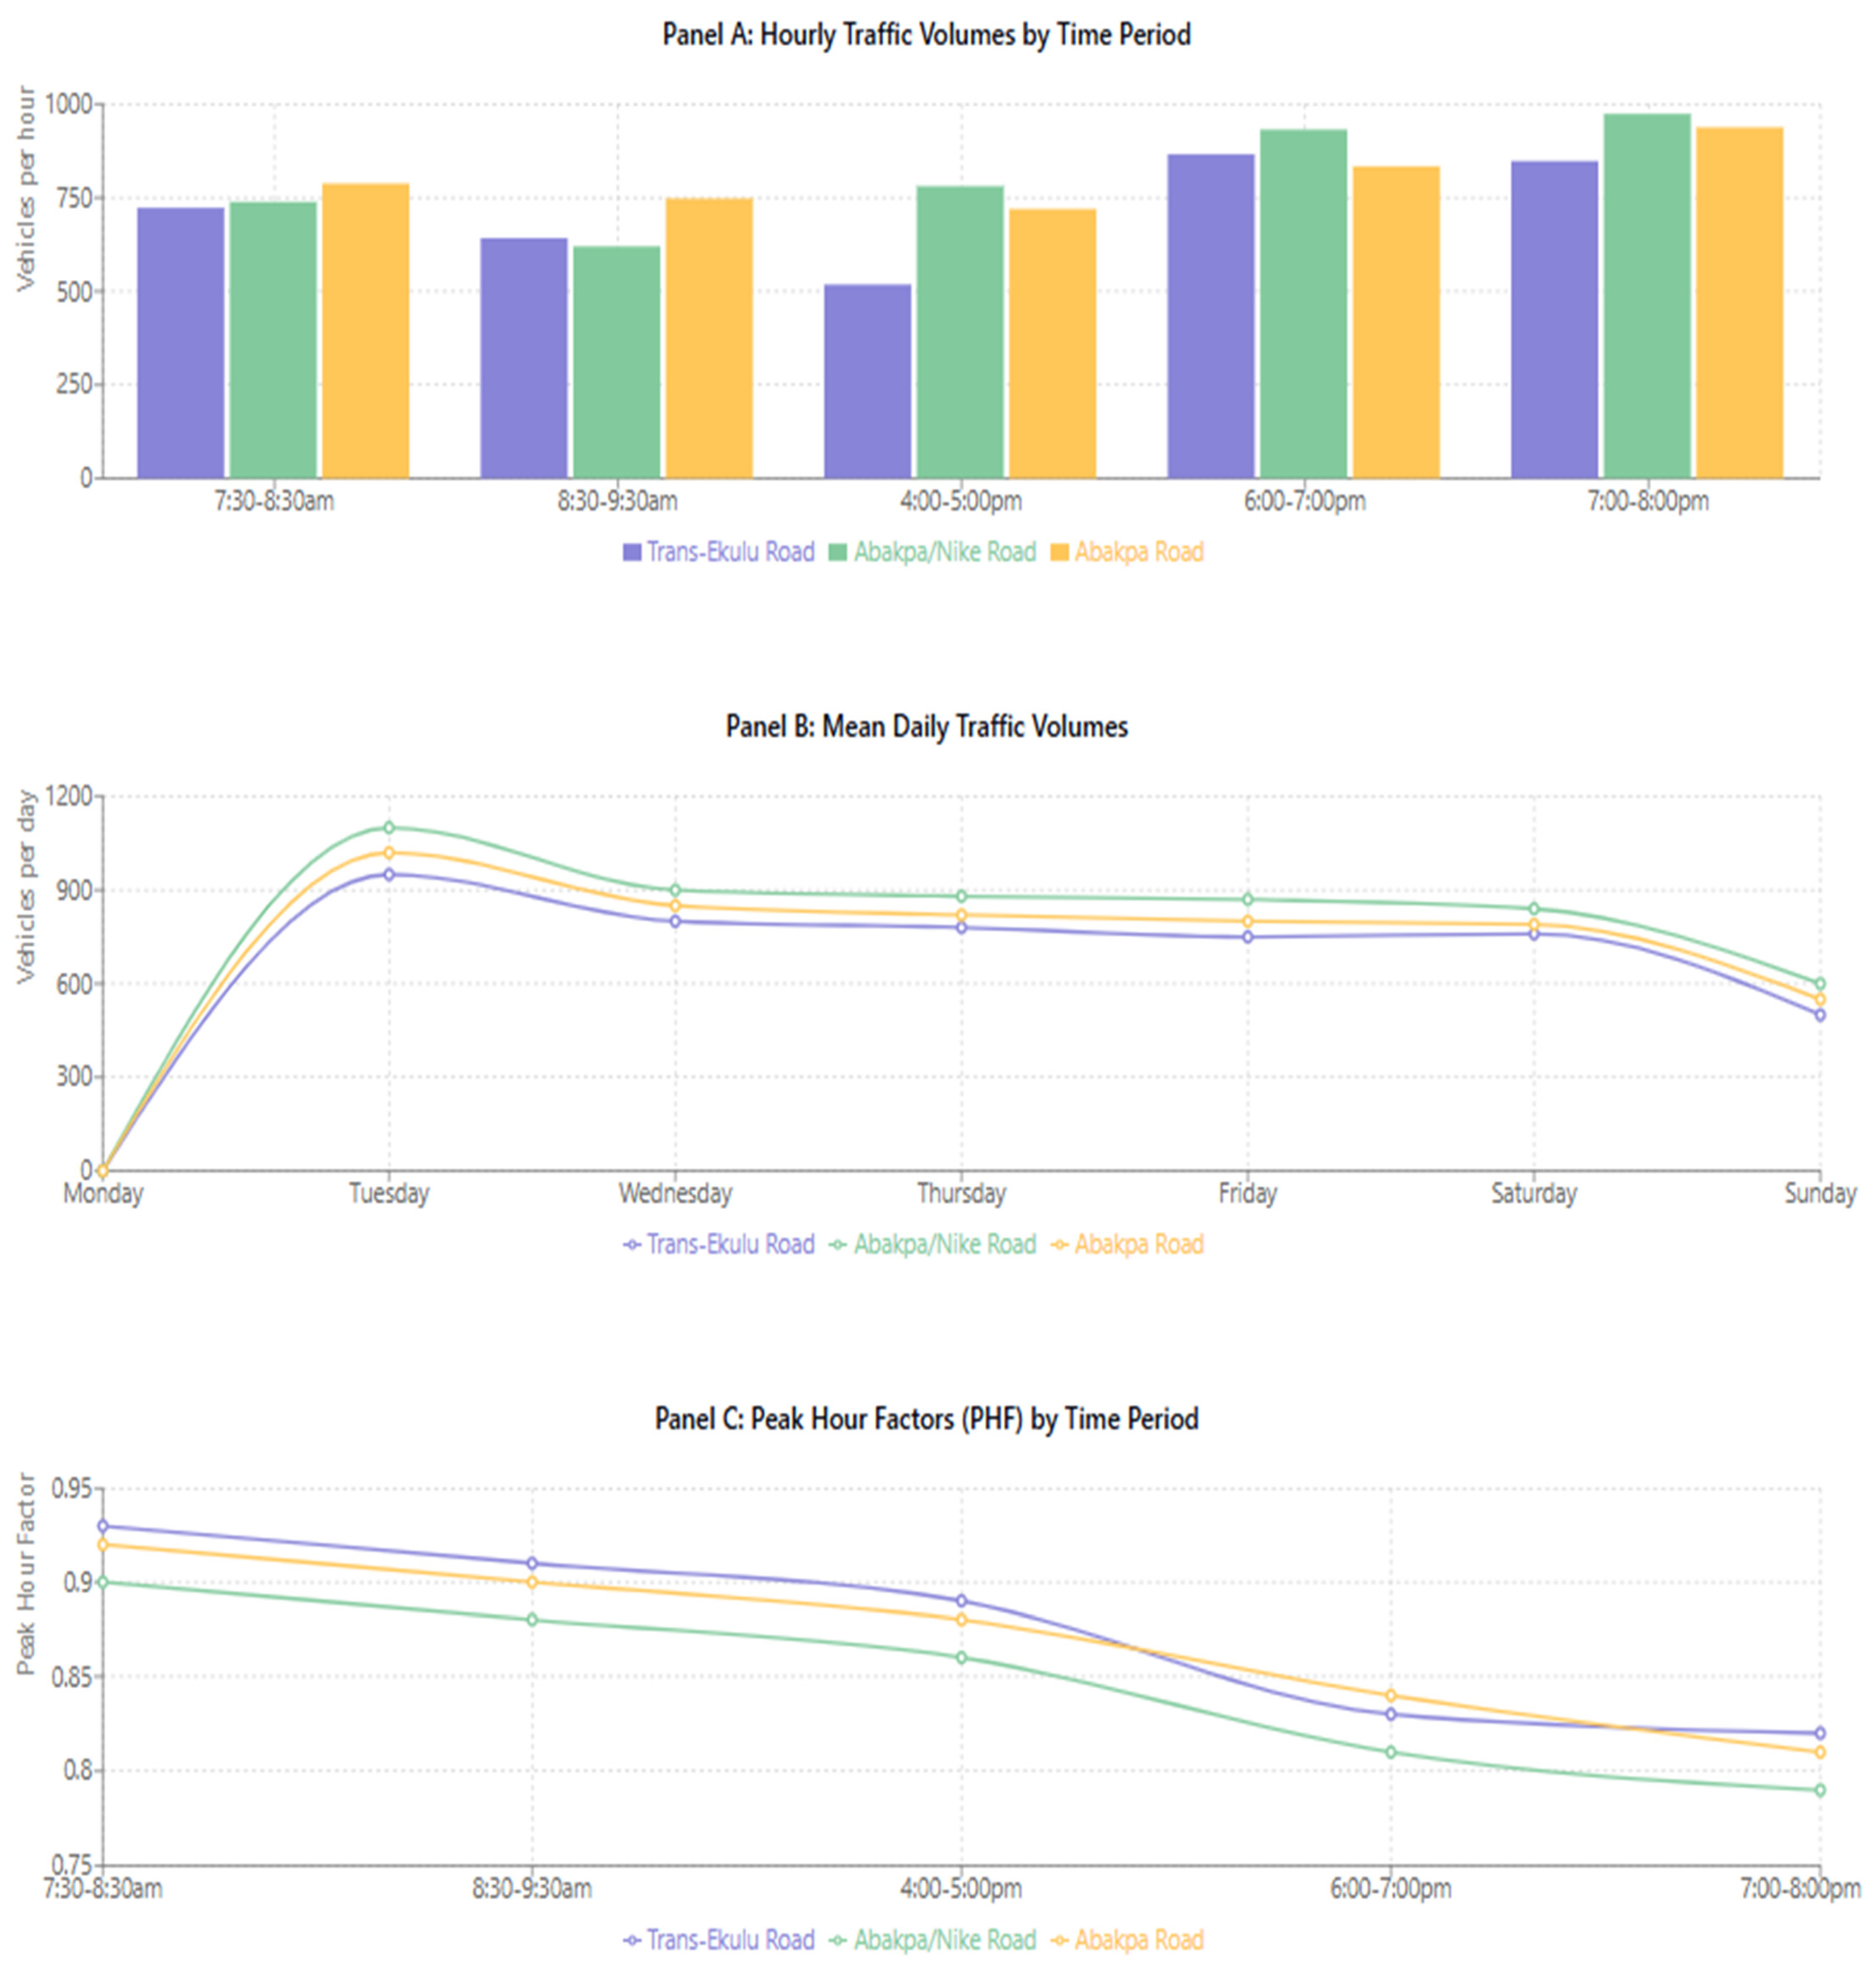
Figure 1. Map of Nigeria showing Enugu State; map of Enugu State showing study area [9].
Futuretransp 05 00071 g001
Figure 2. Map of Enugu city showing data collection points.
Futuretransp 05 00071 g002
Figure 3. The spatiotemporal traffic dynamics across Enugu’s major distributors. Note: (Panel A) illustrates traffic volumes across different time periods, showing spatial variations between distributors. (Panel B) demonstrates the weekly pattern across distributors, highlighting the absence of traffic on Mondays and peak volumes on Tuesdays. (Panel C) shows the correctly calculated peak hour factor (PHF = V/(4 × V15)) for each distributor by time period.
Futuretransp 05 00071 g003
Table 1. The volumetric traffic.
Time PeriodTrans-Ekulu RoadAbakpa/Nike RoadAbakpa Road
MorningVehicles in HourAvergae Flow Rate in Minutes (V15)Vehicles in HourAvergae Flow Rate in Minutes (V15)Vehicles in HourAvergae Flow Rate in Minutes (V15)
7:30–8:30 AM723 veh/h181739 veh/h185788 veh/h197
8:30–9:30 AM642 veh/h161620 veh/h155748 veh/h187
Evening
4:00–5:00 PM518 veh/h130781 veh/h195720 veh/h180
6:00–7:00 PM866 veh/h217932 veh/h233834 veh/h209
7:00–8:00 PM848 veh/h212974 veh/h244938 veh/h235
Mean720180810203806201
Table 2. The peak hour factor (PHF) results.
Time PeriodTrans-Ekulu RoadAbakpa/Nike RoadAbakpa Road
Morning
7:30–8:30 AM0.93 (723/(4 × 195))0.90 (739/(4 × 205))0.92 (788/(4 × 214))
8:30–9:30 AM0.91 (642/(4 × 176))0.88 (620/(4 × 176))0.90 (748/(4 × 208))
Evening
4:00–5:00 PM0.89 (518/(4 × 146))0.86 (781/(4 × 227))0.88 (720/(4 × 205))
6:00–7:00 PM0.83 (866/(4 × 261))0.81 (932/(4 × 288))0.84 (834/(4 × 248))
7:00–8:00 PM0.82 (848/(4 × 259))0.79 (974/(4 × 308))0.81 (938/(4 × 290))
Mean0.880.850.87
Disclaimer/Publisher’s Note: The statements, opinions and data contained in all publications are solely those of the individual author(s) and contributor(s) and not of MDPI and/or the editor(s). MDPI and/or the editor(s) disclaim responsibility for any injury to people or property resulting from any ideas, methods, instructions or products referred to in the content.

