Review

Evaluating Project Selection Criteria for Transportation Improvement Plans (TIPs): A Study of Southeastern U.S. Metropolitan Planning Organizations

by
Mahdi Baghersad
*,
Virginia P. Sisiopiku
and
Avinash Unnikrishnan
Department of Civil, Construction and Environmental Engineering, The University of Alabama at Birmingham, Birmingham, AL 35294, USA
*
Author to whom correspondence should be addressed.
Future Transp. 2025, 5(2), 72; https://doi.org/10.3390/futuretransp5020072
Submission received: 11 February 2025 / Revised: 25 March 2025 / Accepted: 19 May 2025 / Published: 5 June 2025

Abstract

Metropolitan Planning Organizations (MPOs) are required to prepare a Transportation Improvement Plan (TIP) that outlines a fiscal strategy over a four-year period in order to qualify for federal funding. However, the growing population and limited financial resources available often pose significant challenges for transportation agencies in aligning their needs with available budgets. This article examines the project selection criteria used by 20 MPOs in the Southeastern United States to identify the best practices for prioritizing projects in TIPs. Using document analysis, this study categorizes the most commonly used criteria into nine broad groups: safety and security; environmental impacts; mobility, accessibility, and connectivity; preservation; environmental justice; equity; economic factors; alignment with other plans; and local support. Many of these categories are further divided into subcategories and metrics. Despite variations in criteria, weighting, scoring, and methodologies across these MPOs, the study identifies several shared factors that support effective decision-making in regional transportation planning. These findings can help transportation planners and policymakers refine their project prioritization strategies, promote consistency, and lead to improved decision-making frameworks for future TIP development.

1. Introduction

Metropolitan Planning Organizations (MPOs) were established under the Federal-Aid Highway Act of 1962 to ensure that urban areas with populations of more than 50,000 engage in coordinated transportation planning. The federal government created MPOs to integrate local and regional transportation needs into state and national transportation strategies. One of the primary functions of MPOs is to develop Metropolitan Transportation Plans (MTPs) and Transportation Improvement Programs (TIPs). The MTP is a strategic roadmap for future transportation systems over a 20-year horizon or longer. It includes evaluations of transportation supply and demand, strategies for infrastructure investments, environmental impact assessments, and financial planning to ensure successful execution. In contrast, the TIP is a four-year short-term plan that outlines the specific projects to be implemented in alignment with the MTP. To ensure realistic implementation, TIPs are fiscally constrained and bridge the long-term vision of the MTP with actionable steps [1].
Under federal law, MPOs must prepare a TIP to receive federal funding, as outlined in 23 U.S.C. § 134 (j) and 49 U.S.C. § 5303 (j). These statutes require MPOs to develop their TIPs in collaboration with state and local transit agencies and include both capital and non-capital transportation projects [2,3].
Transportation agencies utilize various methods to allocate resources, ranging from broad project categories to more refined subgroups. Alternatively, they may consider geographic or strategic factors. However, as agencies adapt to shifting geographic and demographic patterns, they also face the challenge of maintaining and expanding existing systems under financial constraints, which makes the process increasingly complex. This complexity is intensified by the need to comply with federal regulations, such as the MAP-21 Moving Ahead for Progress in the 21st Century Act (MAP-21) and the Fixing America’s Surface Transportation Act (FAST Act), and the need to consider environmental impacts and air quality issues [4].
As transportation planning grows more intricate, decision-makers face challenges in balancing various criteria, such as safety, cost effectiveness, environmental sustainability, and equity. This study aims to investigate the development of TIPs and project selection criteria across MPOs in the Southeastern U.S. By reviewing the literature and analyzing the criteria used by 20 MPOs, this report identifies common factors in project prioritization. Although previous studies have examined the methods agencies use to allocate resources, few have focused specifically on the criteria MPOs use for selecting projects [5,6,7,8,9]. This study addresses this gap with the goal of identifying the best practices to assist decision-makers in navigating the complexities of modern transportation planning.

2. Literature Review

While transportation planning has been widely studied over the past decades, project prioritization and resource allocation methods within MPOs are relatively under-researched. This scarcity of comprehensive research underscores the need for further exploration in this field, particularly considering evolving challenges such as climate change, equity, and resource constraints.
This literature review examines the evolution of transportation planning practices, focusing on resource allocation, project prioritization, and performance-based methodologies. The goal is to highlight key studies and frameworks that have shaped modern transportation planning and to analyze the various prioritization methods adopted by MPOs and state agencies. This review identifies the best practices and emerging trends in transportation project prioritization by synthesizing recent case studies and models.
Over the past century, transportation planning has seen a significant transformation in the allocation of resources. In the early 20th century, transportation agencies primarily concentrated on expanding highways and bridges to support the rapid growth of urbanization and vehicular traffic. However, legislative acts such as the 1962 Federal-Aid Highway Act, the National Environmental Policy Act (NEPA), and the 1970 Clean Air Act began to reshape transportation policy. These acts introduced environmental sustainability considerations and encouraged the integration of multimodal transportation systems [4].
By the mid-1970s, agencies shifted their focus from building new highways to maintaining and preserving existing infrastructure. This trend continued into the early 2000s, when performance-based planning became a central tool for allocating resources based on measurable outcomes. Recent legislation, such as MAP-21 and the FAST Act, has further emphasized the need for data-driven approaches to allocate limited resources effectively. This evolution has enabled transportation agencies to balance the preservation of aging infrastructure with contemporary challenges, including congestion, climate change, and the integration of multimodal connectivity [4].
Metropolitan Planning Organizations (MPOs) are critical in transportation planning, particularly in coordinating regional transportation systems and allocating resources. Sciara [10] examined the evolution of MPOs and their expanded responsibilities, driven by federal legislation such as the Intermodal Surface Transportation Efficiency Act (ISTEA) and subsequent acts. These policies broadened the scope of MPOs to include a broader range of considerations, such as economic vitality, safety, mobility, environmental sustainability, and equity. However, despite this progress, Sciara highlighted the continued difficulties MPOs face in balancing regional priorities with local needs and their limited authority over local land use decisions, which remains a barrier to fully realizing regional planning goals.
With the rise of performance-based planning in the 2000s, transportation agencies began to rely on data-driven approaches to allocate resources more efficiently. Noyce et al. [11] identified three primary methods used by transportation agencies: Benefit–Cost Analysis (BCA), Cost-Effectiveness Analysis (CEA), and Multi-Criteria Analysis (MCA). BCA focuses on evaluating projects based on their long-term economic returns, while CEA ranks projects according to their overall cost per unit of benefit. MCA, which has gained popularity in recent years, allows agencies to evaluate projects based on a variety of criteria, balancing economic, environmental, and social factors.
State-level case studies provide concrete examples of how performance-based methods are applied. Johnson and List [12] examined the prioritization frameworks used in Virginia, North Carolina, and Massachusetts. Virginia’s SMART SCALE, for example, uses a transparent data-driven scoring system to prioritize projects based on their benefits relative to cost, promoting long-term infrastructure stability. Similarly, North Carolina’s Strategic Transportation Investments (STI) approach allocates funds based on measurable performance metrics such as congestion reduction, safety, and economic competitiveness. Massachusetts has implemented a Capital Investment Plan (CIP), which uses a comparable scoring system to evaluate projects across multiple transportation modes, emphasizing mobility, safety, environmental impacts, and cost effectiveness. Each framework demonstrates the increasing reliance on quantitative scoring systems to ensure transportation investments align with statewide goals.
Duncan and Schroeckenthaler [4] identified seven key aspects of resource allocation in transportation planning within performance-based planning: preservation improvement, modal balance, geographic balance, transparency versus complexity, top down versus bottom up, agency discretion/flexibility versus policy/model-driven consistency, and objectivity versus subjectivity. Their study pointed out significant challenges, including cross-modal comparisons, the need for improved data and tools, and the balance between transparency and flexibility. Case studies from Oregon, Florida, Massachusetts, and Idaho provided insights into innovative strategies for resource allocation, demonstrating how flexible funding can improve performance outcomes while addressing geographic and modal balance.
Although quantitative methods dominate resource allocation, many transportation agencies are adopting mixed approaches that incorporate qualitative factors, such as community input and political considerations. Kramer et al. [13] provided a report exploring various methods commonly used by MPOs, including BCA, CEA, MCA, and process-based methods. Unlike data-driven approaches, process-based methods rely on community input and political considerations, allowing qualitative factors to influence decision-making significantly. The review also highlighted the increasing use of combination methods, where agencies combine quantitative and qualitative techniques to tailor their prioritization processes to specific regional needs. This adaptability allows agencies to maintain flexibility while addressing the complexity of modern transportation challenges.
In addition to the above-mentioned prioritization methods, cross-modal prioritization is an emerging area of focus for transportation agencies. Gunasekera and Hirschman [14] analyzed how agencies prioritize projects across various transportation modes, such as highways, transit, and pedestrian and bicycle infrastructure. Their survey of 17 state DOTs and 36 MPOs revealed that, although most agencies still operate in traditional silos, 65% of the surveyed prioritization processes have the potential to be adapted for cross-modal comparisons. This indicates that, while cross-modal prioritization is not yet widely practiced, many existing methods can be adjusted to compare projects supporting different modes more effectively. They emphasized that no single prioritization method can address the diverse needs of transportation systems. Instead, they advocate for a flexible, mixed approach, which combines universal criteria, like BCA, with mode-specific criteria, such as pavement conditions for highways.
In a peer exchange hosted by the North Carolina Department of Transportation (NCDOT) in 2014 [15], key strategies for cross-modal project prioritization were discussed. The event gathered representatives from state DOTs and MPOs to share best practices for prioritizing projects across various transportation modes. The discussions emphasized the importance of selecting and weighing mode-neutral and mode-specific criteria, ensuring that projects from different transportation modes are evaluated fairly. The report highlighted the challenges of comparing projects across modes and suggested the need for flexible prioritization criteria considering local input and performance-based metrics. One key point from the exchange was the recommendation to use a combination of quantitative data and local input to drive decision-making, as well as the importance of developing common criteria across all modes.
Kulkarni et al. [16] identified limitations in using BCA for large-scale transportation projects. While BCA works well for localized projects, it overlooks non-economic factors and the complexity of larger infrastructure. To address this, they introduced a need-based prioritization model. This model prioritizes projects based on deficiencies, safety concerns, and long-term preservation needs rather than purely economic metrics. It incorporates community concerns and non-economic impacts, ensuring more equitable resource allocation. This approach has been successfully used in Kansas for over two decades in the state’s highway improvement program.
Transportation agencies often use comprehensive frameworks that combine both quantitative and qualitative methods for project prioritization. Outwater et al. [17] developed a framework for the Puget Sound Regional Council’s Transportation 2040 Plan. Their approach evaluated transportation alternatives based on criteria such as mobility, economic prosperity, environmental stewardship, and equity. By integrating BCA with non-monetary measures and using techniques like the analytic hierarchy process (AHP), this framework captured a broader range of benefits and addressed the limitations of solely economic evaluation methods.
In conclusion, the literature highlights a significant shift toward data-driven, performance-based approaches in transportation project prioritization. As transportation systems become more complex, agencies are adopting frameworks that balance factors like safety, economic impact, environmental sustainability, and equity. However, no single prioritization method fits all agencies and regions, as each must adapt to local needs and constraints. The evolving use of quantitative and qualitative measures underscores the need for flexibility and transparency in decision-making. Cross-modal prioritization and stakeholder engagement are increasingly important, ensuring investments align with long-term regional and statewide goals.

3. Methodology

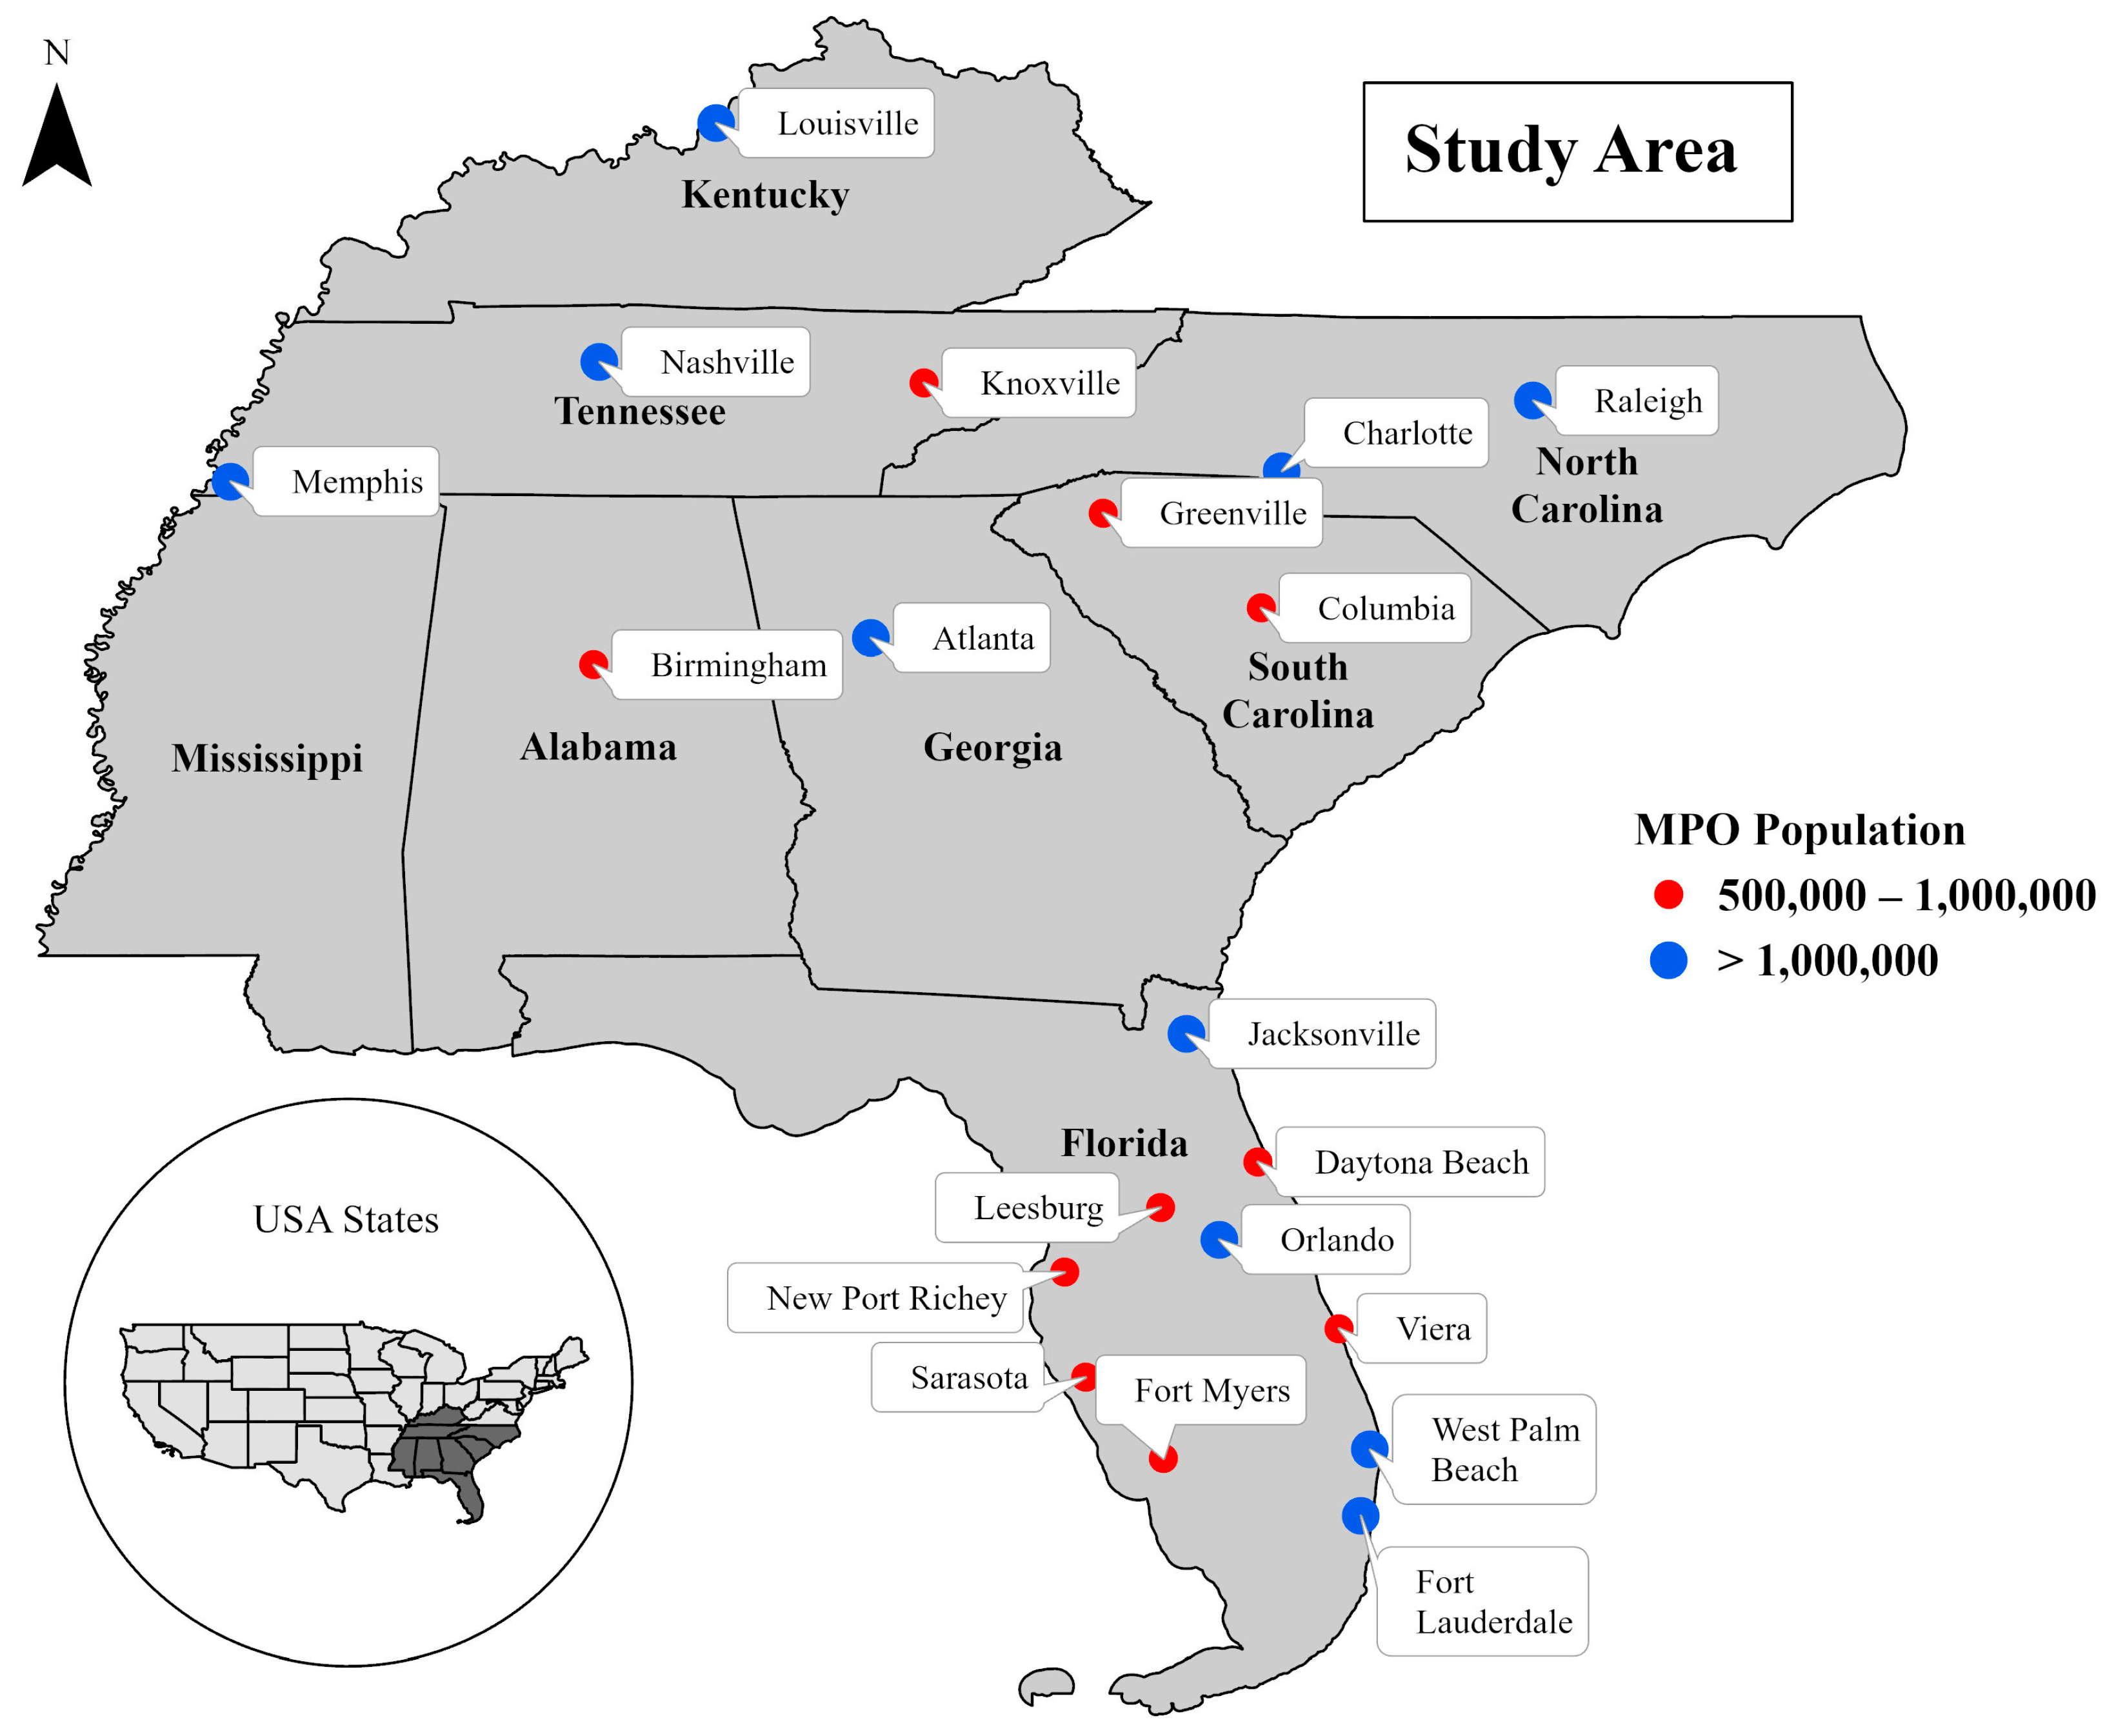
3.1. Data Collection

The main aim of this study is to identify the most common criteria for project prioritization across MPOs in the southern United States. The focus area was Region IV, based on the United States Department of Transportation divisions, which covers eight states and two territories [18]. Table 1 shows the number of MPOs in this region, totaling 104. This study focused on MPOs with populations greater than 500,000 based on the 2020 census. This threshold was chosen to focus on medium and large MPOs that face more substantial challenges, such as congestion management, integration of multimodal and transit systems, and air quality, equity, and environmental justice (EJ) considerations, as well as the management of high-capacity and freight corridors. While the practices of smaller MPOs provide valuable information, their project selection processes tend to focus on smaller, localized concerns, such as rural or small-town transit needs. These issues, while important, are not directly applicable to the challenges faced by larger, more urbanized MPOs.
As shown in Table 1, out of a total of 104 MPOs in the Southeastern U.S., 26 MPOs (25%) have populations exceeding 500,000, meaning this study excluded 75% of the MPOs in the region.
MPOs with populations between 500,000 and 1,000,000 often face similar challenges and opportunities in transportation planning and project selection, such as managing a balanced mix of urban and suburban transportation needs. These MPOs frequently employ innovative, localized strategies that address the demands of expanding transportation networks and the specific needs of smaller urbanized areas, and, in our study, provide a comprehensive look at scalable solutions and best practices.
Moreover, MPOs with populations greater than 1,000,000 were included because they manage more complex transportation systems, often dealing with issues such as high-density traffic, regional connectivity, and multimodal transportation infrastructure. These larger MPOs frequently pioneer advanced strategies that may serve as models for mid-sized regions, offering insight into how complex transportation challenges can be addressed on a broader scale.
Of these 26 MPOs, detailed information on the project selection criteria was available for 20 MPOs. The remaining 6 MPOs either did not explicitly provide their selection criteria, or the relevant data were not available in their publicly accessible online documents. The following gives a breakdown of the process for selecting MPOs:
  • Total number of MPOs in the Southeast U.S.: 104;
  • Number of MPOs with a population of more than 500,000: 26;
  • Number of MPOs without publicly available selection criteria: 6;
  • Remaining MPOs for study: 20.
The exclusion of 6 MPOs did not significantly impact the study’s findings, as the remaining 20 MPOs provide a comprehensive presentation of project prioritization criteria for both medium and large-sized MPOs.
Table 2 lists the 20 MPOs included in this study and relevant details such as state, major city, area, and population.
Figure 1 shows the geographical distribution of the 20 studied MPOs. MPOs with populations of 1 million or less are represented by red circles, while those with populations over 1 million are shown by blue circles. Notably, the number of MPOs with populations of 1 million or less is equal to the number of MPOs with populations greater than 1 million, totaling 10 for each group.

3.2. Data Sources

All data used in this synthesis were extracted from publicly available documents provided by MPOs on their websites. Most information was obtained from TIP and LRTP documents. However, in some cases, MPOs did not include all the details regarding their scoring and weighting processes in these documents and referred readers to additional sources. To ensure comprehensive data collection, this research also utilized other documents to compile information such as technical reports, project prioritization processes, master plans, mobility hub program overviews, road safety analysis frameworks, unified planning work programs, lists of priority projects, and other related resources.

3.3. Categorization and Analysis Process

The collected information was imported into an Excel spreadsheet for analysis. To streamline the research and enhance clarity, the criteria from the 20 MPOs were categorized into nine broad groups. Within each category, subgroups were created to further organize the criteria into actionable, measurable, and conceptual components. Table 3 shows the nine broad categories and related subgroups.
One of the challenges encountered during this process was the variation in terminology and how MPOs described criteria. These variations in terminology made it necessary to interpret the underlying intent of each criterion to ensure a consistent comparison across MPOs. Moreover, some MPOs categorized criteria differently than the groups used in this study, which requires careful reclassification to ensure consistency and facilitate comparison.
It is also important to note that all the MPOs considered public involvement and performance measures separately in their TIP processes. As a result, this study did not include these factors unless they were explicitly employed in the MPOs’ scoring criteria for project selection. This ensured the focus remained on criteria directly influencing project ranking.
While this study focuses on identifying and categorizing frequently used project selection criteria across MPOs, it does not analyze the relative weights or scores assigned to each criterion. This omission is intentional due to the lack of a standardized framework across MPOs—some organize their criteria by mode (e.g., transit, roadway), while others group them by policy focus (e.g., safety, equity). Moreover, only a portion of the MPOs reviewed publicly disclose their scoring or weighting systems and those that do often use different approaches and terminology. A comparative analysis of weights would therefore require limiting the sample to MPOs with similar structures, which would significantly reduce the size and representativeness of the dataset.

4. Results

The MPOs considered in this study employ a wide variety of processes, methods, weighting, and scoring approaches to select projects for inclusion in their TIP, tailored to the specific needs of their region. Despite the lack of uniformity in these methods, several common criteria emerge across the MPO documents studied. The weighting and scoring of criteria are typically based on regional priorities or identified gaps unique to each region, and, therefore, this research does not consider weighting and scoring. Although some MPOs categorize projects based on the mode of transportation, criteria related to aviation, rail, and water modes are excluded from the discussion.
The criteria in this section are divided into nine broad categories, namely, safety and security; environmental impacts; mobility, accessibility, and connectivity; preservation; environmental justice; equity; economic factors; alignment with other plans; and local support. Each category is further divided into subgroups, sorted by the most commonly used criteria, to provide a structured understanding of how medium- and large-sized MPOs in the Southeastern U.S. prioritize transportation projects.
Figure 2 illustrates the frequency of the most common criteria used by the 20 studied MPOs. Each bar represents the number of MPOs that consider each criterion. The blue color indicates larger MPOs (population > 1 million), while the red color represents medium-sized MPOs (500,000 ≤ population ≤ 1 million). The criteria most frequently utilized by the studied MPOs, with similar adoption rates across the two population groups, are safety and security; mobility, accessibility, and connectivity; and environmental impacts. Preservation and economic factors are utilized by 17 and 16 MPOs, respectively. However, equity and alignment with other plans appear as less frequently used criteria across all MPOs. Notably, MPOs with populations exceeding 1 million employ these criteria more frequently, indicating that larger MPOs tend to adopt a broader range of criteria to evaluate their project selections.

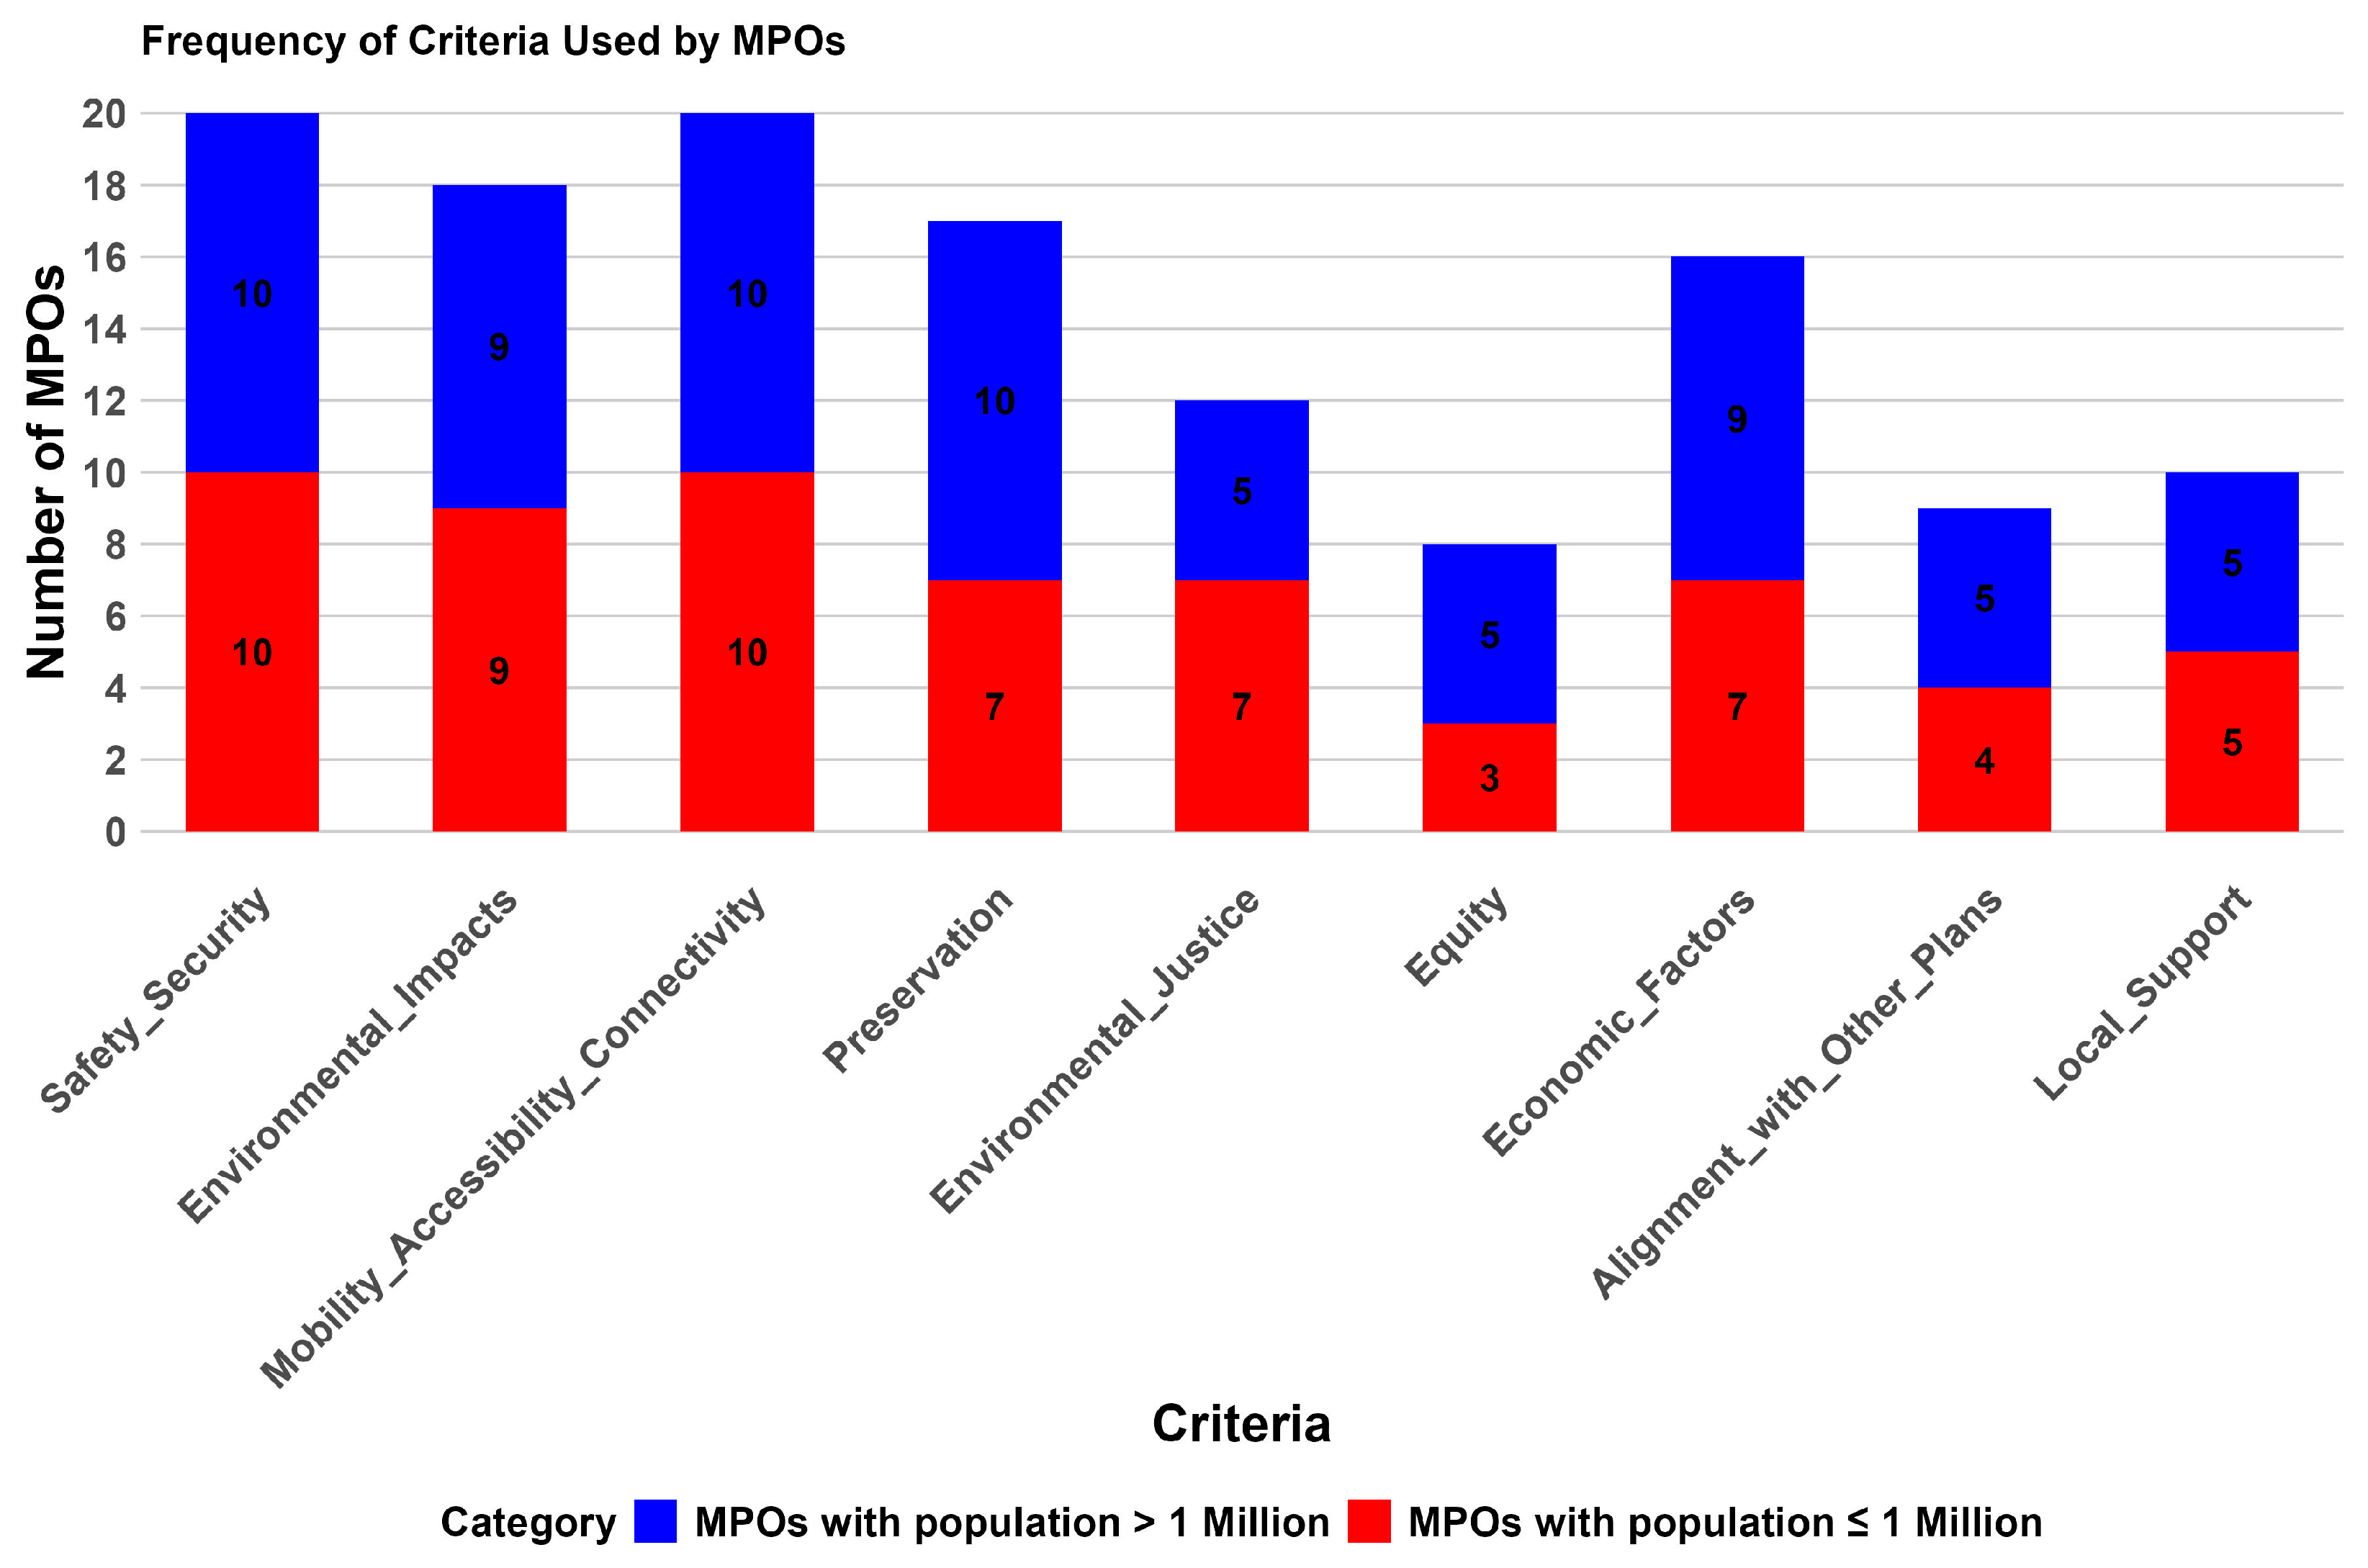
4.1. Safety and Security

Safety is a fundamental criterion considered by all MPOs in this synthesis for prioritizing projects in the TIP. It is also a key component of performance management, guiding MPOs as they set objectives and monitor progress toward achieving long-term transportation goals. In this context, safety focuses on minimizing the risk and severity of traffic crashes, while security addresses protecting users from intentional harm, such as crime or vandalism.

4.1.1. Crash Frequency and Severity

A primary concern for MPOs is the reduction of crash frequency and severity. Many MPOs utilize metrics such as crash rate, crash density, the number of fatal and injury crashes, fatal crash rate, and severe injury crash rate to prioritize projects that aim to mitigate these factors. The period over which crash data are analyzed varies from three to ten years, depending on the MPO.

4.1.2. High-Risk Locations

High-risk locations, particularly those with a history of frequent or severe crashes, receive special consideration from MPOs. Projects targeting these areas are often prioritized due to their potential for significant safety improvements. Identifying high-crash corridors, intersections, and high-injury networks ensures that the most hazardous components of the transportation system are prioritized for improvements.

4.1.3. Non-Motorized Safety

The safety of pedestrians and cyclists is another critical focus for many MPOs. Projects that enhance safety for these vulnerable road users are prioritized in areas with significant pedestrian and bicycle activity. This may include the addition of new crosswalks, bike lanes, or other improvements to existing infrastructure. MPOs recognize that improving non-motorized safety improves overall traffic safety and promotes healthier and more sustainable transportation options.

4.1.4. Systemic Safety Improvements

Several MPOs adopt a systemic approach by incorporating broad safety improvements across the transportation network. This approach involves identifying and implementing projects that reduce risks throughout the system, such as redesigning intersections, adding protective barriers, or considering comprehensive safety measures like Crash Modification Factors (CMFs).

4.1.5. Emergency and Evacuation Routes

Ensuring that evacuation routes are safe and accessible during emergencies is a critical consideration for certain MPOs. Projects that enhance the safety and security of these routes are often given priority, particularly in regions susceptible to natural disasters or other emergencies. Improving these routes ensures that communities can effectively respond in times of crisis.

4.1.6. Transit Safety and Security Criteria

Transit safety and security are other key considerations for MPOs when selecting projects for the TIP. Projects that incorporate security enhancements, such as improved lighting, surveillance systems, and safer transit stops, are prioritized. Additionally, initiatives that enhance the overall safety of transit corridors, such as the addition of protected bicycle lanes, sidewalks, or bus shelters, are critical factors in this process.

4.2. Environmental Impacts

Eighteen out of twenty MPOs (90 percent) explicitly consider environmental impacts when scoring projects for inclusion in the TIP. In most MPOs, projects that mitigate environmental harm are awarded positive scores, while those that negatively impact the environment are penalized.

4.2.1. Climate Change

A key criterion within this group that is emphasized across many MPOs is climate change adaptation. The natural hazards that threaten a region vary depending on its geographic and climatic conditions. Projects addressing climate change concerns such as sea level rise, extreme weather, flooding, hurricanes, and vulnerabilities in specific corridors tend to receive higher scores. This prioritization reflects the growing awareness of the need to prepare infrastructure for the impact of climate change.

4.2.2. Air Quality and Emissions

Several MPOs prioritize projects that aim to reduce greenhouse gases and other pollutants, such as CO2, NOx, and volatile organic compounds (VOCs), associated with transportation. A critical aspect of this is minimizing the overall environmental footprint of transportation investments. This involves reducing direct emissions and ensuring that projects contribute positively to the environment through mitigation activities and pollution prevention.
Moreover, some MPOs integrate the concept of Vehicle Miles Traveled (VMT) and its impact on emissions, particularly in relation to future growth and shifts in transportation modes. Introducing new transit services, such as electric buses and light rail, is mentioned as a key strategy for reducing emissions. Additionally, a few MPOs award points to projects that advance innovative transportation infrastructure, including automated vehicles, intelligent transportation systems (ITS), and alternative fuel vehicles, reflecting a commitment to environmentally responsible transportation solutions [20,21,22].

4.2.3. Natural, Community, and Cultural Resources Protection

Protecting natural resources, including wetlands, natural habitats, cultural sites, and community resources, is a priority for many MPOs. Several MPOs also assess the proximity of proposed projects to environmentally sensitive areas and special designations, such as protected lands and conservation areas. Projects that negatively impact these resources typically receive lower scores or negative scores. This approach underscores the importance of preserving natural and cultural heritage while planning and executing transportation projects.

4.3. Mobility, Accessibility, and Connectivity

All MPOs included in this research utilize criteria related to mobility, accessibility, and connectivity to prioritize projects. While mobility refers to the ease of movement of people, vehicles, and goods between different locations, accessibility concerns the ease of reaching specific sites or locations. Although these concepts are distinct, they are closely related and often considered in tandem by MPOs when evaluating projects [23]. The following criteria are integral to this assessment:

4.3.1. Congestion Management

Congestion management is a critical component of transportation planning, impacting both the safety and effectiveness of the transportation system. MPOs use a variety of criteria to assess and prioritize projects to alleviate congestion and improve traffic flow. The most common factors considered in this context include the following:
  • Volume/Capacity (V/C) Ratio
The V/C ratio is a metric commonly used by MPOs to evaluate congestion. This ratio compares the volume of traffic on a roadway with its capacity and projects targeting high V/C ratios are often prioritized. Some MPOs also compare existing and future V/C ratios to determine the potential impact of a project on congestion reduction.
  • Delay
Delay is another significant factor considered by MPOs when evaluating congestion. This criterion includes measures such as the travel time index (TTI), average travel speed, the percentage of heavily congested travel, vehicle delay, and the duration of congestion.
  • Travel Time Index
A few MPOs consider the TTI as a criterion for project prioritization in reducing congestion. TTI metrics compare peak travel speeds to free-flow speeds, providing insights into the efficiency of the transportation network.
  • Congestion Management Strategies
Some MPOs consider a broader approach to congestion management by including criteria that reflect the effectiveness of specific strategies. These strategies include recommendations from the congestion management process, congestion intensity, mitigation efforts, and cost-effective congestion reduction techniques.
  • Non-Single-Occupancy Vehicle Strategies
Non-single-occupancy vehicle (SOV) strategies aim to reduce congestion without the need for road widening. These strategies promote alternatives such as transit services and the provision of bicycle and pedestrian facilities.
  • Capacity Improvement
Some MPOs prioritize projects that increase the capacity of existing roadways or add new capacity through infrastructure improvements. This includes criteria such as widening, adding new or additional turn lanes, and increasing queue lengths.

4.3.2. Freight Movement

Given that mobility also encompasses the movement of goods, many MPOs prioritize criteria related to freight movement. The key factors in this category include the following:
  • Truck and Freight Volume
The most common criteria related to freight movement are factors that focus on the truck and freight volume. These factors include truck traffic, truck volume, average daily truck percentage, and freight volume.
  • Infrastructure and Capacity Improvements
This criterion addresses the enhancement of physical infrastructure that supports freight movement. It includes addressing statewide truck bottlenecks, improving regional freight corridors, and enhancing the overall capacity and reliability of the freight network.
  • Access and Connectivity
Access and connectivity for freight are critical considerations. MPOs prioritize projects that ensure well-connected and easily accessible freight routes and facilities, particularly along high-freight-volume corridors.

4.3.3. Transit

Public transit is a crucial element in transportation planning, particularly for improving mobility and ensuring accessibility for all users, including those who do not drive. MPOs evaluate transit-related projects using various criteria that focus on passenger movement, multimodal transportation, infrastructure, innovation, and connectivity.
  • Passenger Movement and Ridership
This category assesses how effectively transit services facilitate the movement of people and impact overall ridership. Key criteria include passenger vehicle travel time and distance, passenger vehicle delay, transit average load, and metrics such as changes in project-level transit boardings, ridership growth, and ridership potential.
  • Transit Infrastructure
This group focuses on the physical infrastructure supporting transit services, including stations, routes, and amenities. Criteria in this category include improvements to transit facilities, such as adding or upgrading multimodal stations; bus stops and shelters; enhancing system efficiency through reduced headways; and ensuring compliance with Americans with Disabilities Act (ADA) standards.
  • Multimodal and Non-Automobile Transportation
This category emphasizes the integration of various transportation modes, including walking, cycling, and transit. The criteria for this group include multimodal accommodations that incorporate pedestrian, bicycle, and transit facilities. Projects within this category focus on providing marked and signed bike lanes, shared-use paths, and dedicated pedestrian and bicycle facilities near transit hubs to enhance last-mile connectivity and support multiple modes of transportation.
  • Reliability, Connectivity, and Innovation
Projects in this category are evaluated based on their ability to improve on-time performance, reduce service disruptions, and enhance travel time predictability. Additionally, projects that add new transit routes, improve existing ones, or reduce headways are prioritized. MPOs also consider projects that explore innovative transit options, such as micro-transit, within this category.
  • Land Use and Demographics
This criterion evaluates the relationship between transit projects, land use, and population demographics. Projects serving areas with higher population and employment densities, especially near schools and transit-supportive housing, are given higher priority for funding.

4.3.4. Active Transportation (Pedestrian/Bicycle)

MPOs utilize various criteria to evaluate and prioritize projects that enhance active transportation, focusing on mobility, accessibility, and connectivity:
  • Facility Design and Improvements
MPOs prioritize projects that focus on the construction and enhancement of sidewalks, trails, bike lanes, and related infrastructure. This group of criteria ensures that these facilities are ADA compliant and context appropriate, and provide safe, accessible routes for all users. Specific criteria within this group include the design of facilities, the construction or improvement of sidewalks and trails, the availability of end-of-trip facilities, and the proportion of system miles equipped with accommodations.
  • Demand and Level of Service (LOS)
MPOs assess the demand for pedestrian and bicycle facilities and the quality of service they provide. This includes understanding the existing and projected demand for these modes of transportation and evaluating how well current and proposed infrastructure meets this demand. Criteria such as pedestrian and bicycle demand and LOS are critical for identifying areas where investments are most needed.
  • Multimodal Integration and Connectivity
This criterion emphasizes the integration of pedestrian and bicycle facilities with other transportation modes to enhance connectivity. Projects that support seamless transitions between walking, biking, and public transit are prioritized. Multimodal integration and connectivity criteria support a more sustainable and efficient transportation system that allows users to switch between different modes easily.

4.3.5. Travel Time Reliability

The criterion of travel time reliability focuses on ensuring that transportation projects enhance the consistency and dependability of travel times across various modes of transportation, particularly in congested and high-priority segments. This includes evaluating the effectiveness of projects in improving travel times through capacity enhancements, the implementation of advanced technologies like upgraded signal timing, and the installation of changeable message signs.

4.3.6. Traffic Flow

MPOs prioritize projects that enhance traffic flow, increase capacity, and manage demand effectively. The following criteria are used to evaluate this concept:
  • Traffic Volume
MPOs assess traffic volumes based on annual average daily traffic (AADT) and average daily traffic (ADT) to identify areas where capacity enhancements are needed.
  • Level of Service (LOS)
LOS is a widely used metric that evaluates the quality of service provided by roadways, particularly in terms of traffic flow and congestion. Projects are evaluated based on their ability to maintain or improve LOS, especially in critical areas such as rural facilities and major urban corridors.
  • Travel Distance and Density
Travel distance, measured in VMTs, and person-miles traveled, along with traffic demand/density, are important factors in transportation planning. MPOs use these metrics to understand travel patterns and prioritize projects that reduce travel distances, increase person capacity, and manage traffic density effectively.
  • Travel Demand Management (TDM)
MPOs prioritize projects incorporating TDM strategies, such as reducing the number of peak-hour vehicle trips.

4.3.7. Access to Destinations

MPOs prioritize projects that enhance access to various destinations, which can improve quality of life, economic development, and overall sustainability. The following criteria are used to evaluate accessibility:
  • Access to Employment
Projects that improve access to employment centers, jobs, and high-density employment areas are prioritized.
  • Access to Community Resources
This group includes criteria that prioritize access to community resources, such as schools, parks, healthcare facilities, grocery stores, and shopping centers.
  • Tourism and Activity Centers
This group addresses access to tourism-related areas, cultural locations, activity centers, and urban and downtown centers.

4.3.8. Multimodal Connectivity

MPOs evaluate projects based on their ability to close network gaps, integrate multiple modes of transportation, and support strategic regional connections.
  • Network Connectivity and Gaps
Projects that improve network continuity by closing existing gaps, expanding the network, and connecting similar facilities are prioritized for their ability to enhance the overall efficiency and reliability of the transportation network operation.
  • Multimodal Integration and Access
This criterion emphasizes the integration of multiple transportation modes, such as walking, biking, transit, and vehicle use. MPOs prioritize projects that enhance connectivity between different modes, support the development of multimodal hubs, and promote the use of sustainable transportation options.
  • Regional and Strategic Connectivity
Regional and strategic connections are essential for supporting economic development and aligning transportation networks with broader regional and national planning objectives. Related project prioritization criteria focus on connecting projects to regional networks, providing consistency with future land use plans, and improving connectivity between key regional markets and strategic corridors.

4.3.9. Intelligent Transportation Systems (ITS) and Advanced Traffic Management Systems (ATMS)

These criteria focus on leveraging advanced technologies to improve the efficiency, safety, and management of transportation networks. Projects that incorporate innovative technologies are prioritized to align with strategic goals for modernizing infrastructure. There is also significant emphasis on deploying ITS in regions where these technologies currently do not exist.

4.4. Preservation

This category focuses on the enhancement and maintenance of existing transportation assets. Among the 20 MPOs analyzed, 17 MPOs provided criteria to prioritize projects based on preservation needs. The preservation category is divided into four subgroups: infrastructure condition, bridge condition, pavement condition, and traffic flow.

4.4.1. Infrastructure Condition

This subgroup evaluates structural and facility conditions, including the location and significance of projects within communities and the improvement of aging infrastructure and facilities. Criteria in this group also assess the scope and strategic integration of projects, such as roadway reconstruction, sidewalk repair, and projects that serve multiple land uses. Additionally, maintenance capability, frequency, effectiveness of repairs, and efforts to minimize long-term maintenance costs are considered.

4.4.2. Bridge Condition

The condition and age of bridges are critical factors in prioritizing bridge-related projects. Older bridges in poor condition are prioritized for repair or replacement to prevent structural failures and maintain connectivity. Bridges on significant routes, such as the interstate national highway system, are given special attention due to their importance in regional and national mobility.

4.4.3. Pavement Condition

Pavement condition is assessed using various metrics, including the Pavement Condition Index (PCI) and the International Roughness Index (IRI). Projects addressing poor pavement conditions are given higher priority to ensure the longevity and safety of the roadway network.

4.4.4. Traffic Flow

Some MPOs consider traffic flow characteristics when prioritizing preservation projects. Metrics such as traffic volume, ADT, V/C, travel time delay, freight volumes, and speeds are used to evaluate and prioritize projects that aim to improve or maintain traffic flow efficiency.

4.5. Environmental Justice (EJ)

Of the MPOs, 65 percent (13 out of 20) prioritize projects located in designated EJ areas, ensuring they do not negatively impact these communities. These projects often include transit improvements, safety enhancements, and bicycle and pedestrian infrastructure aimed at benefiting low-income and minority populations. Additionally, MPOs often prioritize projects that ensure compliance with ADA requirements and make transportation services more accessible to those with limited English proficiency.

4.6. Equity

This group emphasizes the importance of prioritizing underserved and disadvantaged communities in transportation projects. Key criteria include improving the distribution of transit services, enhancing safety, and reducing travel times within equity areas. The group also focuses on increasing access to affordable housing and delivering benefits to traditionally underserved populations. Additionally, it stresses the importance of fair participation in the decision-making process and ensures that projects improve job accessibility, particularly through transit enhancements. Overall, this group aims to make transportation projects more inclusive and equitable for all.

4.7. Economic Factors

Economic factors play a crucial role in the prioritization of transportation projects, as they directly impact the sustainability and long-term viability of regional investments. By carefully evaluating the financial and economic implications of proposed projects, MPOs ensure that resources are allocated efficiently and contribute to the region’s overall economic growth and stability. Below are the criteria used to evaluate projects regarding economic factors:

4.7.1. Financial Viability and Cost Efficiency

This group examines the financial aspects of projects by emphasizing the importance of cost effectiveness and return on investment. These criteria evaluate the planning-level construction and right-of-way costs against the anticipated benefits, such as vehicle hours saved and safety improvements. The group also considers the overall project cost, the availability of division category funds, and the potential for local matching funds. By assessing the benefit–cost ratio and cost efficiency, these criteria ensure that projects fit within budgetary constraints and maximize financial returns, making them viable investments for the region.

4.7.2. Economic Competitiveness and Growth

This criterion assesses how a project supports economic activity, enhances market readiness, and contributes to long-term economic growth. Projects are evaluated based on their ability to foster business development, create or retain jobs, and stimulate economic competitiveness.

4.7.3. Population and Employment

This group focuses on the demographic and employment impacts of transportation projects. Criteria within this group assess how projects serve current and future population growth, employment opportunities, and housing balance. The group evaluates the distribution of jobs and housing, productivity in terms of trips per hour, and the overall population density within the project area.

4.7.4. Implementation Feasibility and Urban Planning

This group evaluates the practicality and readiness of transportation projects, considering the challenges related to utility costs, right-of-way acquisition, and project staging. This group also considers the urban planning aspects, such as how projects fit within urban growth boundaries and their impact on high-growth areas.

4.8. Alignment with Other Plans

This group emphasizes the importance of projects being consistent with various plans, such as local comprehensive plans, MPO-adopted plans, and specific community or sector plans. This ensures that projects are aligned with current transportation goals and supported by local stakeholders.

4.9. Local Support

This group of criteria emphasizes the importance of local support, public involvement, and strategic prioritization in transportation projects. Local support is assessed through endorsements from community members and alignment with local ordinances. Public outreach is gauged by survey results and public input, and funding and partnerships are evaluated on the availability of matching funds and the strength of partnerships.
The findings from the analysis of project prioritization practices of 20 medium- and large-sized MPOs in the Southeastern United States highlight several shared priorities that shape regional transportation planning. While the criteria for project selection vary based on local needs and challenges, this study identified several criteria commonly used within these MPOs to enhance their transportation infrastructure and facilities both regionally and nationally. These criteria provide a foundational framework for project selection processes in regions with similar population demographics and needs and can be further refined through weighting and scoring methods to address each region’s unique challenges and priorities. By tailoring these approaches, MPOs can ensure that transportation investments target the specific needs and vulnerabilities of their communities properly and effectively.

5. Discussion

A thorough literature review revealed that no previous study has focused on the exclusively common criteria for selecting projects across various MPOs. Most research has concentrated on methods used to prioritize projects at the state or MPO levels [5,6,7,8,9,24,25] or investigate a particular aspect of transportation, such as transit [26,27], equity [28], or active transportation [29]. Therefore, this study addresses this gap and provides new insights into the project selection process across multiple MPOs by highlighting the frequently used criteria.

5.1. Factors Influencing Common Criteria

Several reasons explain why certain criteria are used more often in the project selection process. The first and most significant reason is the presence of federal and state mandates. Numerous federal laws and regulations, such as the Fixing America’s Surface Transportation (FAST) Act, Moving Ahead for Progress in the 21st Century (MAP-21), the Congestion Mitigation and Air Quality (CMAQ) Program, the National Environmental Policy Act (NEPA), Title VI of the Civil Rights Act, and the Environmental Justice (EJ) Executive Order, outline core criteria that MPOs must consider when prioritizing their projects to ensure their TIPs comply with federal funding requirements. While these regulations do not dictate specific criteria, they encourage MPOs to move towards integrated criteria and goals. For example, the FAST Act emphasizes performance-based planning and forces MPOs to use measurable metrics for safety, infrastructure condition, congestion reduction, and environmental sustainability when selecting projects.
The second major factor leading MPOs to use frequent criteria is limited funding, which forces MPOs to evaluate projects based on financial viability and cost efficiency. From this perspective, they can manage constrained budgets by maximizing the benefits of transportation investments while minimizing costs. Therefore, the selection criteria often favor projects that are economically feasible based on available funding and those that demonstrate a strong benefit–cost ratio.
Another factor is the necessity to address the needs of an increasing population and employment distribution. Accordingly, MPOs frequently prioritize projects that accommodate travel demand, improve safety, reduce congestion, enhance job accessibility, and promote regional connectivity.
Finally, in recent years, the increasing focus on equity, environmental justice, and sustainability has prompted MPOs to adopt criteria that take these factors into account. Projects that consider underserved populations, mitigate environmental impact, and incorporate multimodal access are more likely to be prioritized.

5.2. Regional Challenges in the Southeast

MPOs in the Southeast U.S. face unique challenges compared to those at the national level, impacting regional transportation planning and project selection. One of the most significant challenges is the above-average population growth. From 2019 to 2023, the Southeast saw a 3.45 percent increase in population, while the rest of the U.S. experienced a 2.03 percent increase [30]. This accelerated growth places increased demand on transportation infrastructure, which requires MPOs to balance expansion with system preservation while ensuring adequate mobility options for growing communities.
Rapid suburban expansion presents another challenge that complicates planning efforts. Many metropolitan areas in the Southeast continue to develop at low densities, primarily relying on private cars for transportation [31]. This pattern makes providing public transit options more challenging and expensive. Unlike the denser urban areas, Southern MPOs must deal with longer travel distances and dispersed land use, which often results in a focus on expanding highways rather than pursuing multimodal solutions.
Another challenge for the Southeast is that this region is home to a large number of historically underserved communities, where transportation disparities continue to affect mobility and access to essential services [32,33,34]. Therefore, MPOs in the area need to place more effort into integrating equity into each criterion to prevent further inequity in transportation while accommodating the rapid growth requirements in the field.
Finally, many cities and regions in the Southeast are vulnerable to climate change and natural hazards, which demand greater attention from transportation planners. This geographical area is experiencing some of the highest frequencies of hurricanes, coastal and inland flooding, and extreme heat events in the nation [35]. These disasters exert increasing pressure on transportation infrastructure, often damaging roads, bridges, and transit systems. Additionally, in coastal areas, sea level rise poses a long-term threat, particularly for MPOs responsible for planning for locations facing these circumstances. Since underserved communities are often situated in the most vulnerable areas, the process of establishing project selection criteria becomes more complicated as it must balance limited funding, equity, the expansion of new infrastructure and facilities, and the maintenance of existing infrastructures.

5.3. Strengths, Limitations, and Refinement of Existing Criteria

Evaluating the strengths and weaknesses of existing project selection criteria reveals important insights into how MPOs are shaping transportation priorities. One of the key strengths of these criteria is their flexibility. Most MPOs apply frameworks that are adaptable to regional priorities while still aligning with federal planning goals. The criteria also tend to be multimodal in scope, covering roadway projects, transit, and active transportation, which allows agencies to balance a wide range of transportation needs. Another strength is the increasing use of data-driven evaluation, particularly in areas such as safety performance and environmental impact. Many MPOs have also begun incorporating climate change and sustainability into their selection processes, signaling a shift toward more forward-looking planning.
However, several limitations remain. In many cases, particularly with criteria related to equity and environmental justice, there is a lack of clearly defined measurement units or thresholds. Often, these criteria focus primarily on preventing future inequities rather than addressing existing or historical disparities, which can weaken accountability and lead to inconsistencies in how projects are evaluated. While active transportation and public transit are frequently mentioned, they are not always prioritized or supported by detailed scoring systems, resulting in a continued emphasis on roadway infrastructure. In addition, data-driven methods enhance decision-making; however, they can be resource intensive, requiring staff time, technical expertise, and institutional capacity that smaller MPOs may lack. These limitations suggest a need for clearer definitions, more balanced weighting, and increased support for building capacity within MPOs to ensure that selection processes are both equitable and effective.
MPOs can take several steps to refine their project selection criteria to improve equity, sustainability, and efficiency. First, equity-related criteria should go beyond general references to underserved populations and instead incorporate clear, measurable indicators, such as the percentage of low-income households served, access improvements for historically marginalized communities, or reductions in transportation burden. In terms of sustainability, MPOs can strengthen their frameworks by explicitly including climate resilience, emissions reduction, and support for active and public transportation systems. These priorities should be reflected not only in narrative goals but also in the scoring and weighting structure. For efficiency, MPOs should invest in data systems and performance-based methods that allow them to assess long-term benefits, cost effectiveness, and system-wide impacts.

5.4. Broader Implications and Policy Recommendations

While this study focuses specifically on the MPOs in the Southeast U.S., many of the nine broad categories can be generalized to MPOs in other regions. Particularly reflecting the national policy guidance that influences MPO practices across the country are criteria that are driven by federal mandates such as safety; environmental impacts; mobility, accessibility, and connectivity; preservation; environmental justice; equity; and economic factors. However, the degree to which MPOs apply these criteria and the weight they assign to them can vary significantly based on local transportation needs, regional priorities, and funding limitations. In contrast, using subgroup criteria requires caution and careful consideration. Selecting or removing each subgroup’s criteria requires a context-specific analysis of transportation challenges and priorities unique to each region. For example, MPOs in the Western U.S. may place greater emphasis on wildfire resilience or water conservation, while Northeastern MPOs may prioritize transit investment and infrastructure aging. Therefore, while the findings from this study can serve as a useful framework or starting point, further analysis is necessary to identify which criteria are most appropriate and effective in other regional contexts.
The reliability of publicly available MPO data varies significantly across regions. While some MPOs provide detailed and regularly updated documents, such as project scoring sheets, criteria descriptions, and performance reports, others provide only limited information. In some cases, the data are embedded in other documents rather than in TIPs, without standardized formats, making cross-comparisons more difficult and time consuming. Additionally, the lack of transparency or missing details, particularly regarding how selection criteria are applied or weighted, hinders a full understanding of decision-making processes. These inconsistencies can result in an incomplete picture of regional transportation priorities and limit the generalization and replication of research findings. Improving the standardization, accessibility, and clarity of MPO data would increase transparency and promote more equitable and evidence-based transportation planning nationwide.
Based on the findings, several actionable recommendations can be made to improve the transparency, consistency, and effectiveness of project selection practices across MPOs. First, MPOs can work toward defining clear and measurable indicators for criteria that lack the appropriate measurements, especially in areas like equity, environmental justice, and sustainability. This would improve consistency in evaluation and allow for more accountable decision-making. Second, to promote balance across transportation modes, MPOs could develop scoring systems that better reflect the value of active transportation and transit projects, rather than allowing roadway-focused metrics to dominate. Third, federal and state agencies could play a supportive role by developing guidance or templates for project evaluation frameworks that MPOs can adapt to local needs, which can prove especially helpful for smaller agencies with limited capacity. Finally, expanding technical and financial support for capacity building would help ensure that even resource-constrained MPOs can implement more data-driven, inclusive, and forward-looking project prioritization methods in the future.

6. Conclusions

This paper presents a comprehensive review of the project selection criteria used by 20 MPOs in the Southeastern U.S. for inclusion in the TIPs. These MPOs were selected based on population size and the availability of online documents, ensuring a representative analysis of both medium and large-sized MPOs (10 each). This approach allows the findings to reflect a broad range of agencies with diverse transportation needs.
While there are significant differences in processes and methodologies across MPOs, nine broad categories and 26 subgroups emerged as commonly used project selection criteria. This consistency highlights the priorities shared among MPOs in the southeast of the US. However, the observed variation suggests that local factors such as regional needs, geography, population density, the age of infrastructure, available resources, and growth trends significantly influence how these criteria are weighted and applied. These differences present both opportunities and challenges for transportation planners. On the one hand, they emphasize the need for flexibility to address the unique characteristics of each region. On the other hand, this variation requires considerable time and up-to-date and detailed technical data to develop frameworks tailored to each region’s specific needs and priorities.
The frequently used project selection criteria have significant implications for future transportation planning. These criteria result from many years of experience, public engagement, and continuous refinement by MPOs, which have tested and adjusted them over time. MPOs in other regions or countries could use these widely recognized criteria as a starting point and adapt them by adjusting weights and scores based on their local transportation needs. This can be especially beneficial for smaller MPOs that may not have the resources to develop a complete framework from scratch, saving both time and resources. Clearly presenting and sharing selection criteria also enhances transparency in the planning process and helps community members, elected officials, and advocacy groups to understand the reasoning behind decision-making for project prioritization.
As transportation systems evolve with an increasing focus on electrification, automation, climate resilience, and multimodal integration, traditional criteria may no longer be adequate to address emerging innovations and technologies. The criteria in this study provide a framework that MPOs can enhance by incorporating projected and future considerations, such as technology readiness, resilience to extreme weather, and long-term emissions impacts. These improved frameworks could utilize real-time data, predictive modeling, or scenario-based planning tools to more effectively capture future risks. Additionally, the study’s emphasis on flexibility supports the idea that maintaining core criteria while adjusting weights and scoring can effectively address emerging trends and local values. In this way, the analysis can reflect both current practices and more complex future needs.

7. Limitations and Future Works

While this study offers valuable insights into the factors commonly used by the 20 studied MPOs, there are a few limitations that may have influenced the scope of the findings.
By focusing on MPOs in the Southeast U.S., the results may not fully reflect the diversity of transportation needs across the country. Different regions face unique challenges based on geography, socio-economic conditions, and population growth, which shape transportation priorities. Future research could benefit from expanding the study to include a broader range of MPOs from various geographic regions to offer a more well-rounded perspective on project selection criteria.
The study relies heavily on publicly available documents, but many MPOs do not provide complete details about their ranking and prioritization processes. Some refer to supplementary documents or workshops that are not accessible online, making it harder to grasp how decisions are made entirely. Future research could address this limitation by directly contacting MPOs through questionnaire surveys or interviews, which would provide deeper insights into the differences in their processes.
One potential direction for future research is the application of cluster analysis to group MPOs based on similarities in their project selection criteria. While this study focused on identifying frequently used criteria across Southeastern MPOs, it did not attempt to statistically categorize MPOs into distinct groups. The use of cluster analysis could uncover underlying patterns or regional typologies that may not be immediately visible through qualitative review alone.
This study also focuses on the common criteria used for project selection. However, it does not delve into the methods of weighting and scoring, which are essential in determining which projects are prioritized. Due to the significant variation in these methods across MPOs, it was challenging to include them consistently in this analysis. Future work could focus on case studies of MPOs with similar characteristics, allowing for a more detailed comparison of their decision-making frameworks.
Another limitation is that the study excludes aviation, rail, and water transportation modes. These modes are critical in certain regions, particularly in coastal or border areas where ports, airports, and railways play major roles in transportation. Expanding future studies to cover these modes would provide a more complete picture of transportation priorities in regions where they are essential.
It should be noted that transportation planning is not static; it evolves with new policies, funding shifts, and technological advances. The data in this study represent a snapshot in time, but MPOs regularly update their criteria and processes. It is recommended that future studies track how these priorities change over time in response to regional or national developments. Additionally, it would be beneficial to analyze the long-term impact of project selections to see if they effectively addressed the problems they were meant to solve.
Finally, this study focused on MPOs with populations of over 500,000, including both large- and medium-sized MPOs. Larger MPOs often manage more complex, multimodal systems with greater funding, while smaller MPOs tend to focus on immediate local needs with fewer resources. Balancing these differences when analyzing project selection criteria requires careful consideration. Future research could narrow its focus to MPOs with similar population sizes or funding levels to explore more deeply how these factors influence project prioritization within the TIP process.

Author Contributions

Study conception and design: M.B. and V.P.S.; data collection and interpretation of results: M.B.; draft manuscript preparation: M.B. and V.P.S.; funding acquisition: V.P.S. and A.U. All authors have read and agreed to the published version of the manuscript.

Funding

This research was funded by the Regional Planning Commission of Greater Birmingham (RPCGB). Grant account number 346505.01.01.2025247.

Institutional Review Board Statement

Not applicable.

Informed Consent Statement

Not applicable.

Data Availability Statement

The raw data supporting the conclusions of this article will be made available by the authors on request.

Acknowledgments

The authors would like to thank the RPCGB for the financial support for this work.

Conflicts of Interest

The authors declare no conflicts of interest. The funders had no role in the design of the study; in the collection, analyses, or interpretation of data; in the writing of the manuscript; or in the decision to publish the results.

References

  1. Mallett, W.J. Metropolitan Transportation Planning; Congressional Research Service: Washington, DC, USA, 2010.
  2. U.S. Congress 23 U.S.C. § 134-Metropolitan Transportation Planning. Available online: https://www.govinfo.gov/app/details/USCODE-2021-title23/USCODE-2021-title23-chap1-sec134/summary (accessed on 10 June 2024).
  3. U.S. Congress 49 U.S.C. § 5303-Metropolitan Transportation Planning. Available online: https://www.govinfo.gov/app/details/USCODE-2022-title49/USCODE-2022-title49-subtitleIII-chap53-sec5303 (accessed on 10 June 2024).
  4. Duncan, C.; Schroeckenthaler, K. Resource Allocation of Available Funding to Programs of Work; National Academies of Sciences, Engineering, and Medicine: Washington, DC, USA, 2017; ISBN 978-0-309-39001-9. [Google Scholar]
  5. Macharis, C.; Bernardini, A. Reviewing the Use of Multi-Criteria Decision Analysis for the Evaluation of Transport Projects: Time for a Multi-Actor Approach. Transp. Policy 2015, 37, 177–186. [Google Scholar] [CrossRef]
  6. Novak, D.C.; Koliba, C.; Zia, A.; Tucker, M. Evaluating the Outcomes Associated with an Innovative Change in a State-Level Transportation Project Prioritization Process: A Case Study of Vermont. Transp. Policy 2015, 42, 130–143. [Google Scholar] [CrossRef]
  7. Liu, M.; Balali, V.; Wei, H.-H.; Pena-Mora, F. Scenario-Based Multi-Criteria Prioritization Framework for Urban Transportation Projects. Am. J. Civ. Eng. Archit. 2015, 3, 193–199. Available online: https://www.researchgate.net/publication/296694878 (accessed on 10 February 2025).
  8. Rezvani, A.Z.; Peach, M.; Thomas, A.; Cruz, R.; Kemmsies, W. Benefit-Cost Methodology for Highway-Railway Grade Crossing Safety Protocols as Applied to Transportation Infrastructure Project Prioritization Processes. Transp. Res. Procedia 2015, 8, 89–102. [Google Scholar] [CrossRef]
  9. Marcelo, D.; Mandri-Perrott, C.; House, S.; Schwartz, J.Z. An Alternative Approach to Project Selection: The Infrastructure Prioritization Framework; World Bank: Washington, DC, USA, 2016. [Google Scholar]
  10. Sciara, G.-C. Metropolitan Transportation Planning: Lessons From the Past, Institutions for the Future. J. Am. Plan. Assoc. 2017, 83, 262–276. [Google Scholar] [CrossRef]
  11. Noyce, D.A.; McCahill, C.; Sundquist, E.; Chitturi, M. Modern Project Prioritization for Transportation Investments; Center for Transportation, Equity, Decisions and Dollars, USDOT University Transportation Center; The University of Texas at Arlington: Arlington, TX, USA, 2021. [Google Scholar]
  12. Johnson, S.; List, K. Performance-Based Statewide Project Prioritization; Foursquare ITP: Washington, DC, USA, 2018. [Google Scholar]
  13. Kramer, J.; Boyd, T.; Dinehart, T. Metropolitan Planning Organization (MPO) List of Project Priorities (LOPP) Development Practices in Florida: Literature Review; Center for Urban Transportation Research (CUTR), University of South Florida: Tampa, FL, USA, 2023. [Google Scholar]
  14. Gunasekera, K.; Hirschman, I. Cross Mode Project Prioritization, NCHRP 08-36, Task 112; Parsons Brinckerhoff: New York, NY, USA, 2014. [Google Scholar]
  15. Middleton, S. Cross-Modal Project Prioritization: A TPCB Peer Exchange; John, A., Ed.; Volpe National Transportation Systems Center: Cambridge, MA, USA, 2015.
  16. Kulkarni, R.B.; Miller, D.; Ingram, R.M.; Wong, C.-W.; Lorenz, J. Need-Based Project Prioritization: Alternative to Cost-Benefit Analysis. J. Transp. Eng. 2004, 130, 150–158. [Google Scholar] [CrossRef]
  17. Outwater, M.L.; Adler, T.; Dumont, J.; Kitchen, M.; Bassok, A. Quantitative Approaches for Project Prioritization: Case Study in Puget Sound, Washington. Transp. Res. Rec. 2012, 2303, 108–116. [Google Scholar] [CrossRef]
  18. United States Department of Transportation. Region 4|FTA. Available online: https://www.transit.dot.gov/about/regional-offices/region-4/region-4 (accessed on 15 September 2024).
  19. United States Department of Transportation. MPO Database-Transportation Planning Capacity Building Program. Available online: https://www.planning.dot.gov/mpo/default.aspx (accessed on 15 September 2024).
  20. Space Coast Transportation Planning Organization. List of Project Priorities. Available online: https://www.spacecoasttpo.com/home/showpublisheddocument/2164/638405863565030000 (accessed on 20 July 2024).
  21. North Florida Transportation Planning Organization. FY 2024/25 to FY 2028/29 Transportation Improvement Program. Available online: https://northfloridatpo.com/uploads/TIP-24-29-Final.pdf (accessed on 10 August 2024).
  22. Kentuckiana Regional Planning and Development Agency. FY 2023-FY 2026 Transportation Improvement Program: Louisville/Jefferson County, KY-IN Metropolitan Planning Area. Available online: https://www.kipda.org/wp-content/uploads/2023/05/FY2023-TIP-FINAL-5-25.pdf (accessed on 12 August 2024).
  23. Roess, R.P.; Prassas, E.S.; McShane, W.R. Traffic Engineering, 5th ed.; Pearson Education Inc.: Hoboken, NJ, USA, 2021; pp. 7–8. [Google Scholar]
  24. Kissel, C.; Gron, C. Transportation Project Prioritization and Performance-Based Planning Efforts in Rural and Small Metropolitan Regions; National Association of Development Organizations: Washington, DC, USA, 2011. [Google Scholar]
  25. Maggiore, M.; Ford, K.M. Guide to Cross-Asset Resource Allocation and the Impact on Transportation System Performance; Transportation Research Board: Washington, DC, USA, 2015; ISBN 978-0-309-30852-6. [Google Scholar]
  26. Federal Transit Administration. TAM Investment Prioritization State of the Practice; Federal Transit Administration: Washington, DC, USA, 2020.
  27. Transportation Research Board. Prioritization of Public Transportation Investments: A Guide for Decision-Makers; Transportation Research Board: Washington, DC, USA, 2021; ISBN 978-0-309-68614-3. [Google Scholar]
  28. Krapp, A. Transportation Equity Project Prioritization Criteria. (Master’s Capstone Project). University of Illinois at Urbana-Champaign, De-partment of Urban and Regional Planning, Urbana, IL; 2020. Available online: https://www.ideals.illinois.edu/items/116565 (accessed on 10 February 2025).
  29. Lagerwey, P.A.; Hintze, M.J.; Elliott, J.B.; Toole, J.L.; Schneider, R.J. Pedestrian and Bicycle Transportation Along Existing Roads—ActiveTrans Priority Tool Guidebook; Transportation Research Board: Washington, DC, USA, 2015; ISBN 978-0-309-30854-0. [Google Scholar]
  30. United States Census Bureau. ACS 5-Year Estimates Data Profiles: DP05-Demographic and Housing Estimates [2019 & 2023].; United States Census Bureau: Suitland, MD, USA, 2023.
  31. Terando, A.J.; Costanza, J.; Belyea, C.; Dunn, R.R.; McKerrow, A.; Collazo, J.A. The Southern Megalopolis: Using the Past to Predict the Future of Urban Sprawl in the Southeast U.S. PLoS ONE 2014, 9, e102261. [Google Scholar] [CrossRef] [PubMed]
  32. Tamir, C. The Growing Diversity of Black America; Pew Research Center: Washington, DC, USA, 2021. [Google Scholar]
  33. Benson, C.; Bishaw, A.; Glassman, B. Persistent Poverty in Counties and Census Tracts (ACS-51); United States Census Bureau: Suitland, MD, USA, 2023.
  34. Benavidez, G.A. Chronic Disease Prevalence in the US: Sociodemographic and Geographic Variations by Zip Code Tabulation Area. Prev. Chronic. Dis. 2024, 21, E14. [Google Scholar] [CrossRef] [PubMed]
  35. Carter, L.; Terando, A.; Dow, K.; Hiers, K.; Kunkel, K.E.; Lascurain, A.; Marcy, D.; Osland, M.; Schramm, P.; Jerolleman, A. Impacts, Risks, and Adaptation in the United States: Fourth National Climate Assessment, Volume II; U.S. Global Change Research Program: Washington, DC, USA, 2018; pp. 743–808.
Figure 1. Distribution of the 20 studied MPOs in the Southeast U.S.
Futuretransp 05 00072 g001
Figure 2. Frequency of criteria used by the studied MPOs categorized by population size.
Futuretransp 05 00072 g002
Table 1. Number of MPOs in each state and territory [19].
State/TerritoryNumber of MPOsNumber of MPOs with Population > 500,000
Alabama121
Florida2714
Georgia151
Kentucky51
Mississippi30
North Carolina192
South Carolina103
Tennessee123
The Commonwealth of Puerto Rico11
The United States Virgin Islands00
Sum10426
Table 2. Information of the 20 MPOs in this study [19].
MPOStateMajor CityArea
(Sq. Mile)
2020 Census Population
Birmingham MPO (RPCGB)ALBirmingham2263962,374
Broward MPO (BMPO)FLFort Lauderdale12251,944,346
Lake-Sumter MPOFLLeesburg1733513,060
Lee County MPOFLFort Myers826755,466
Metroplan OrlandoFLOrlando28592,289,419
North Florida Transportation Planning OrganizationFLJacksonville26811,576,159
Palm Beach MPOFLWest Palm Beach19801,490,994
Pasco County MPOFLNew Port Richey767561,900
River to Sea Transportation Planning OrganizationFLDaytona Beach1358658,578
Sarasota-Manatee MPOFLSarasota1336831,884
Space Coast Transportation Planning OrganizationFLViera1067602,572
Atlanta Regional Commission (ARC)GAAtlanta45505,585,284
Louisville/Jefferson County KY-IN MPOKYLouisville14231,136,612
Capital Area MPO (CAMPO)NCRaleigh16041,357,017
Charlotte Regional Transportation Planning Organization (CRTPO)NCCharlotte15591,523,089
Columbia Area Transportation Study (COATS)SCColumbia1223707,559
Greenville-Pickens Area Transportation Study (GPATS)SCGreenville906700,902
Knoxville Regional Transportation Planning OrganizationTNKnoxville1066727,080
Memphis Urban Area MPOTNMemphis15131,146,882
Nashville Area MPOTNNashville39511,822,846
Table 3. Nine broad categories and subgroups.
CategoriesSubgroups
Safety and SecurityCrash Frequency and Severity
High-Risk Locations
Non-Motorized Safety
Systemic Safety Improvements
Emergency and Evacuation Routes
Transit Safety and Security Criteria
Environmental ImpactsClimate Change
Air Quality and Emissions
Natural, Community, and Cultural Resources Protection
Mobility, Accessibility, and ConnectivityCongestion Management
Freight Movement
Transit
Active Transportation
Travel Time Reliability
Traffic Flow
Access to Destinations
Multimodal Connectivity
Intelligent Transportation Systems (ITS) and Advanced Traffic Management Systems (ATMS)
PreservationInfrastructure Condition
Bridge Condition
Pavement Condition
Traffic Flow
Environmental Justice
Equity
Economic FactorsFinancial Viability and Cost Efficiency
Economic Competitiveness and Growth
Population and Employment
Implementation Feasibility and Urban Planning
Alignment with Other Plans
Local Support
Disclaimer/Publisher’s Note: The statements, opinions and data contained in all publications are solely those of the individual author(s) and contributor(s) and not of MDPI and/or the editor(s). MDPI and/or the editor(s) disclaim responsibility for any injury to people or property resulting from any ideas, methods, instructions or products referred to in the content.

