Article

Intercity Railfares After HSR Liberalisation in Spain: Price Patterns in the Madrid–Barcelona Corridor

by
Santiago García-Samaniego
1 and
Javier Campos
2,*
1
Department of Economics, Universidad Carlos III de Madrid, E-28008 Madrid, Spain
2
Department of Applied Economics, Universidad de Las Palmas de Gran Canaria, E-35011 Las Palmas, Spain
*
Author to whom correspondence should be addressed.
Future Transp. 2025, 5(2), 66; https://doi.org/10.3390/futuretransp5020066
Submission received: 29 March 2025 / Revised: 28 April 2025 / Accepted: 6 May 2025 / Published: 3 June 2025

Abstract

This paper analyses the evolution of the prices of intercity high-speed rail (HSR) services operated by the Spanish public company, Renfe, on the Madrid–Barcelona route between April 2019 and June 2022. This period marks one of the most important events in the recent history of railways in Spain: the end of Renfe’s monopoly and the opening of this and other corridors to private competitors. Our main objective is to study the impact of the entry of the first competitor, Ouigo, on the incumbent’s pricing strategy. Our analysis confirmed that Renfe perfectly anticipated Ouigo’s entry and adjusted its prices about four months before the market opened. Interestingly, the incumbent also modified its tariff structure in advance according to the target customer’s willingness to pay. These results may be of interest for the forthcoming liberalisation of other intercity corridors.

1. Introduction

After China, Spain has the second longest high-speed rail network (HSR) in the world. And, like many other European countries, its operating model began as a monopoly of a public service company (Renfe) together with a public infrastructure manager. However, in 2021, following the guidelines emanating from the European Commission’s legislation (and the examples of other countries, such as Italy and Germany), the government decided to open only some intercity corridors to competition. The justification given for choosing this model (of partial liberalisation instead of a total and simultaneous opening of the entire network) was to learn from possible successes and mistakes. This paper focuses in particular on the role of HSR liberalisation between Spain’s two main cities: Madrid and Barcelona.
Both cities were part of a railway model that had been monopolised for decades and was now open to competition. In this context, it is very interesting to analyse not only the overall effect or impact on prices—in principle we should expect a significant reduction in the observed price levels—but also how the adjustment takes place. This process, which is often overlooked in literature that tends to focus on quantitative effects, can provide important insights into how competition actually works, how the strategic interaction between incumbents and new entrants takes place, and, more generally, how the liberalisation process as a whole could be improved in related sectors.
The history of railways in Spain provides a very interesting opportunity to build a case study on this issue. From its beginnings in the second half of the nineteenth century, and for almost 80 years, it was mainly associated with private concessions, but as a result of the need to rebuild the infrastructure after the Spanish Civil War, it was deemed necessary in 1941 to create a single state-controlled operator by nationalising and merging the existing private companies. Renfe (an acronym for Red Nacional de los Ferrocarriles Españoles) would operate as a vertically integrated monopoly until 2005, when its activities were split into a service provider (Renfe Operadora) and an infrastructure manager (later known as ADIF, or Administrador de Infraestructuras Ferroviarias), both still under the control of the Ministry of Transport [1]. This reform and others that followed in subsequent years were the result of a process of railway liberalisation imposed from Brussels. See Section 2 for more details.
The gradual increase in intercity mobility in Spain, especially since the late 1960s, has been a major challenge for Renfe, which has barely been able to maintain its market share compared to road and air passenger transport. However, the implementation of the high-speed rail (HSR) network marked a turning point on some routes, making the country a world leader in the provision of these services, with a total network of more than 3600 km. Spanish authorities, with the explicit support of European Union (EU) funds, have invested considerable resources in this sector (more than 65 billion euros since 1987 according to AIREF, 2020 [2]), although the results in terms of traffic are less promising (only 5.6 billion passengers per year, compared with 35.8 billion in France). Furthermore, the Spanish competition authority, CNMC (Comisión Nacional de los Mercados y la Competencia), has recently acknowledged that HSR is a very strategic sector that contributes to the development of other industries and sectors and to regional cohesion.
As a result of EU regulations, the rail sector has been increasingly liberalised in other European countries. Germany and Italy, for example, opened their high-speed lines to competition from different operators a decade ago. Spain followed suit in 2020, and, with less enthusiasm, France has recently joined in, finally removing high-speed rail from the list of sectors awaiting market-orientated reforms [3].
Such a long process, in which the countries involved—including Spain—have had to adopt liberalisation measures that have sometimes been difficult for public opinion to understand or that have directly contradicted the ideological principles of the governments that have had to implement them, is undoubtedly an interesting case study. In this context and from an economic perspective, one of the most important issues when opening a historically monopolised market to competition is to observe the pricing response of the incumbent. As the European Commission (2012) [4] explicitly states, “(...) the introduction of competition is expected to force operators to develop their cost efficiency, to increase innovation and quality levels, and to benefit final consumers through price changes”.
Ideally, these “price changes” should be addressed mainly in quantitative terms (that is, estimating how much the average fare per passenger km is reduced after the entry of competitors on the same route). If we had aggregated data on prices, supply and demand on the route, and even possible comparisons with other non-liberalised corridors, it would be possible to build causal models, including difference-in-difference models, which would help us to identify and quantify price changes. Unfortunately, this information is only partially available at a disaggregated level, both from the companies’ own observatories and from public sources. There are also private companies that collect this information but, surprisingly, they have exclusivity agreements that do not allow them to disclose disaggregated information.
This paper deliberately opts for a descriptive methodology over a traditional quantitative approach, aiming to elucidate how prices actually change rather than simply quantifying the changes. Such approaches are commonplace in economic research. Joskow et al. [5], for instance, demonstrated that in liberalised markets like airlines, incumbents not only lower prices upon competitors’ entry but are compelled to align with special promotions and deals. Yamawacki [6] posited that the pricing reaction of incumbents is specific to each firm and that the swiftness of this reaction is crucial for evaluating the significance and consequences of liberalisation measures. This paper’s primary contribution lies in applying this method to Spain’s most significant intercity corridor, which began experiencing competition in December 2020. We concentrate on the influence of the first private competitor, Ouigo, which entered the market in May 2021, and evaluate the response of the incumbent public monopoly, Renfe, to this new entrant. The research uses an extensive database of average daily and monthly rail prices along the Madrid–Barcelona route over three years, both before and after liberalisation, from 12 April 2019 to 24 June 2022. A distinctive and innovative aspect of this paper is the disaggregation of prices based on users’ willingness to pay (WTP), distinguishing between ’economy or low WTP’ and ’business or high WTP’ travellers, to determine if the incumbent’s pricing strategy varies with traveller type.

2. The Spanish HSR Liberalisation Process in Context

The initiative to open up HSR markets in Europe stemmed from the Commission’s aim to achieve a more competitive and efficient outcome, with the expectation that end users would benefit. Historically, the European economic model for rail passenger transport markets was dominated by vertically integrated monopolies through state-owned companies [7]. However, at the beginning of the 21st century, the European Union decided to act and embarked on a profound regulatory journey towards the aforementioned market opening and the entry of competition. This regulatory framework was divided into four steps, publicly known as the four railway packages.
The process began in 2001 with the regulatory framework for the first of the four packages. The First Package started the transformation by setting out the principles for the vertical unbundling of the single public company into two separate companies, both an infrastructure manager and a transport service provider. This was a necessary first step to achieve a competitive market by separating the activities that can benefit from competition (passenger transport services) from those that cannot (infrastructure provision or management) [8]. The Second Package was published in 2004. It created the European Railway Agency and defined the necessary provisions for the liberalisation of the freight transport services. In 2007, through the Third Package, the regulator stipulated the liberalisation of international passenger services from 2010, thus permitting any licenced railway company to operate cross-border routes within EU economies. Lastly, in the Fourth Package of 2016, the EU established the final regulatory step. It ordered the opening of commercial passenger transport routes to private competition from December 2020 and defined the technical requirements for private operators to access the market. Furthermore, this last package concluded the establishment of the Single Rail Market Area. From this, the process was concluded in terms of regulation, and any operator established in any Member economy was allowed to offer its services in all the EU territory.

2.1. The Liberalisation Process in Spain

According to the European Commission (2012) [4], some European countries had already successfully liberalised their passenger rail markets after the implementation of the railway packages. In some of them, the market power of new entrants was noticeable, such as in the Czech Republic (73%), Italy (34%), or Austria (18%). However, in many others, such as Spain or France, competition was almost non-existent at that time. In Spain, the implementation of the EU regulatory packages implied several legislative changes. The model chosen for competition on the same route was the ‘framework contract’. This sets out a series of rights and obligations between the service providers and the infrastructure manager to ensure a minimum level of planning and coordination. This infrastructure manager was ADIF, which remained a government-owned company.
The high-speed rail market in Spain has been on the rise in recent years. According to official data, the number of passengers who used these services in 2023 was the highest ever recorded. More than 31 million people were transported by the country’s HSR operators last year. In terms of monthly demand, the highest recorded was in April 2024, which exceeded 3.1 million. Figure 1 shows that demand is growing at a significantly higher rate than before competition. In the five monopoly years between January 2015 and January 2020, excluding COVID-19 periods, the number of monthly passengers increased by only about 0.5 million. However, after pandemic periods and with market opening, we observed growth of more than 1.1 million additional monthly passengers in the two years between April 2022 and April 2024 alone.
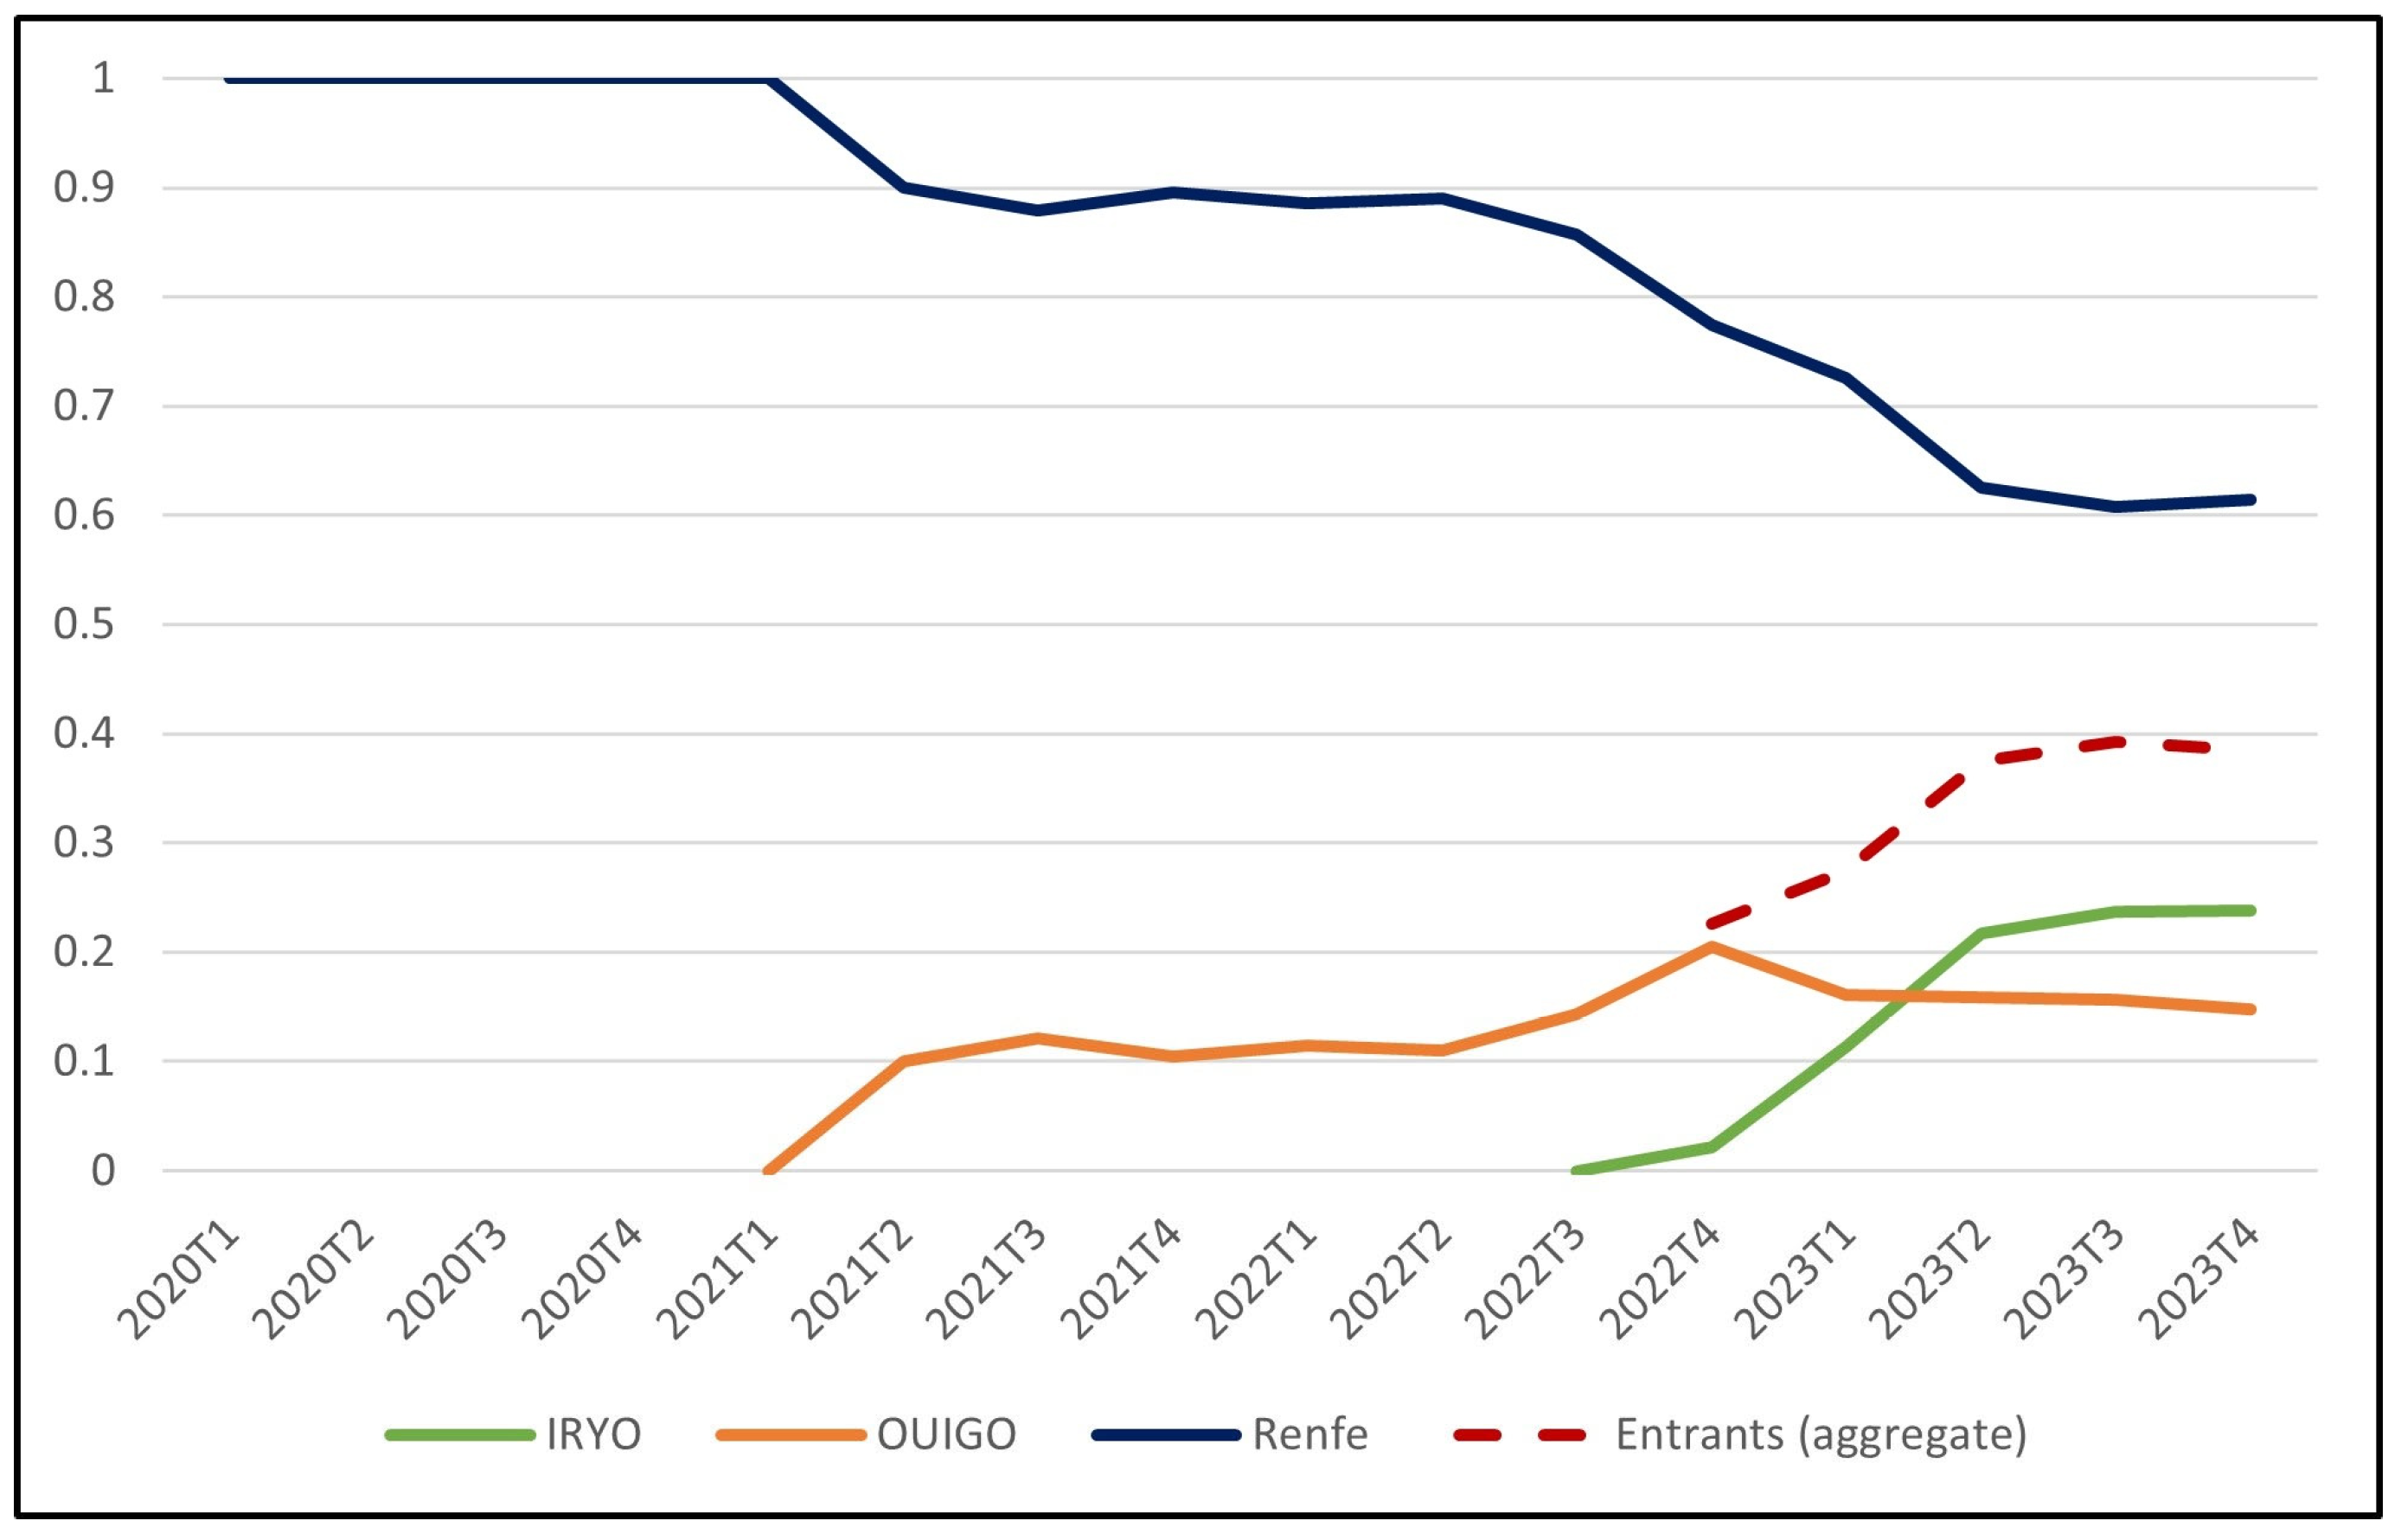
During this period, the incumbent monopoly, Renfe, faced competition from two new entrants. Firstly, the French company Ouigo started operating on the Madrid–Barcelona corridor in May 2021. Second, a year and a half later, in November 2022, Italy’s Iryo started its services on the same corridor (see Figure 2). The most recent data published by the CNMC on passenger demand by operator show that the two new entrants have already captured more than 39% of the market share of total HSR passengers in the country.
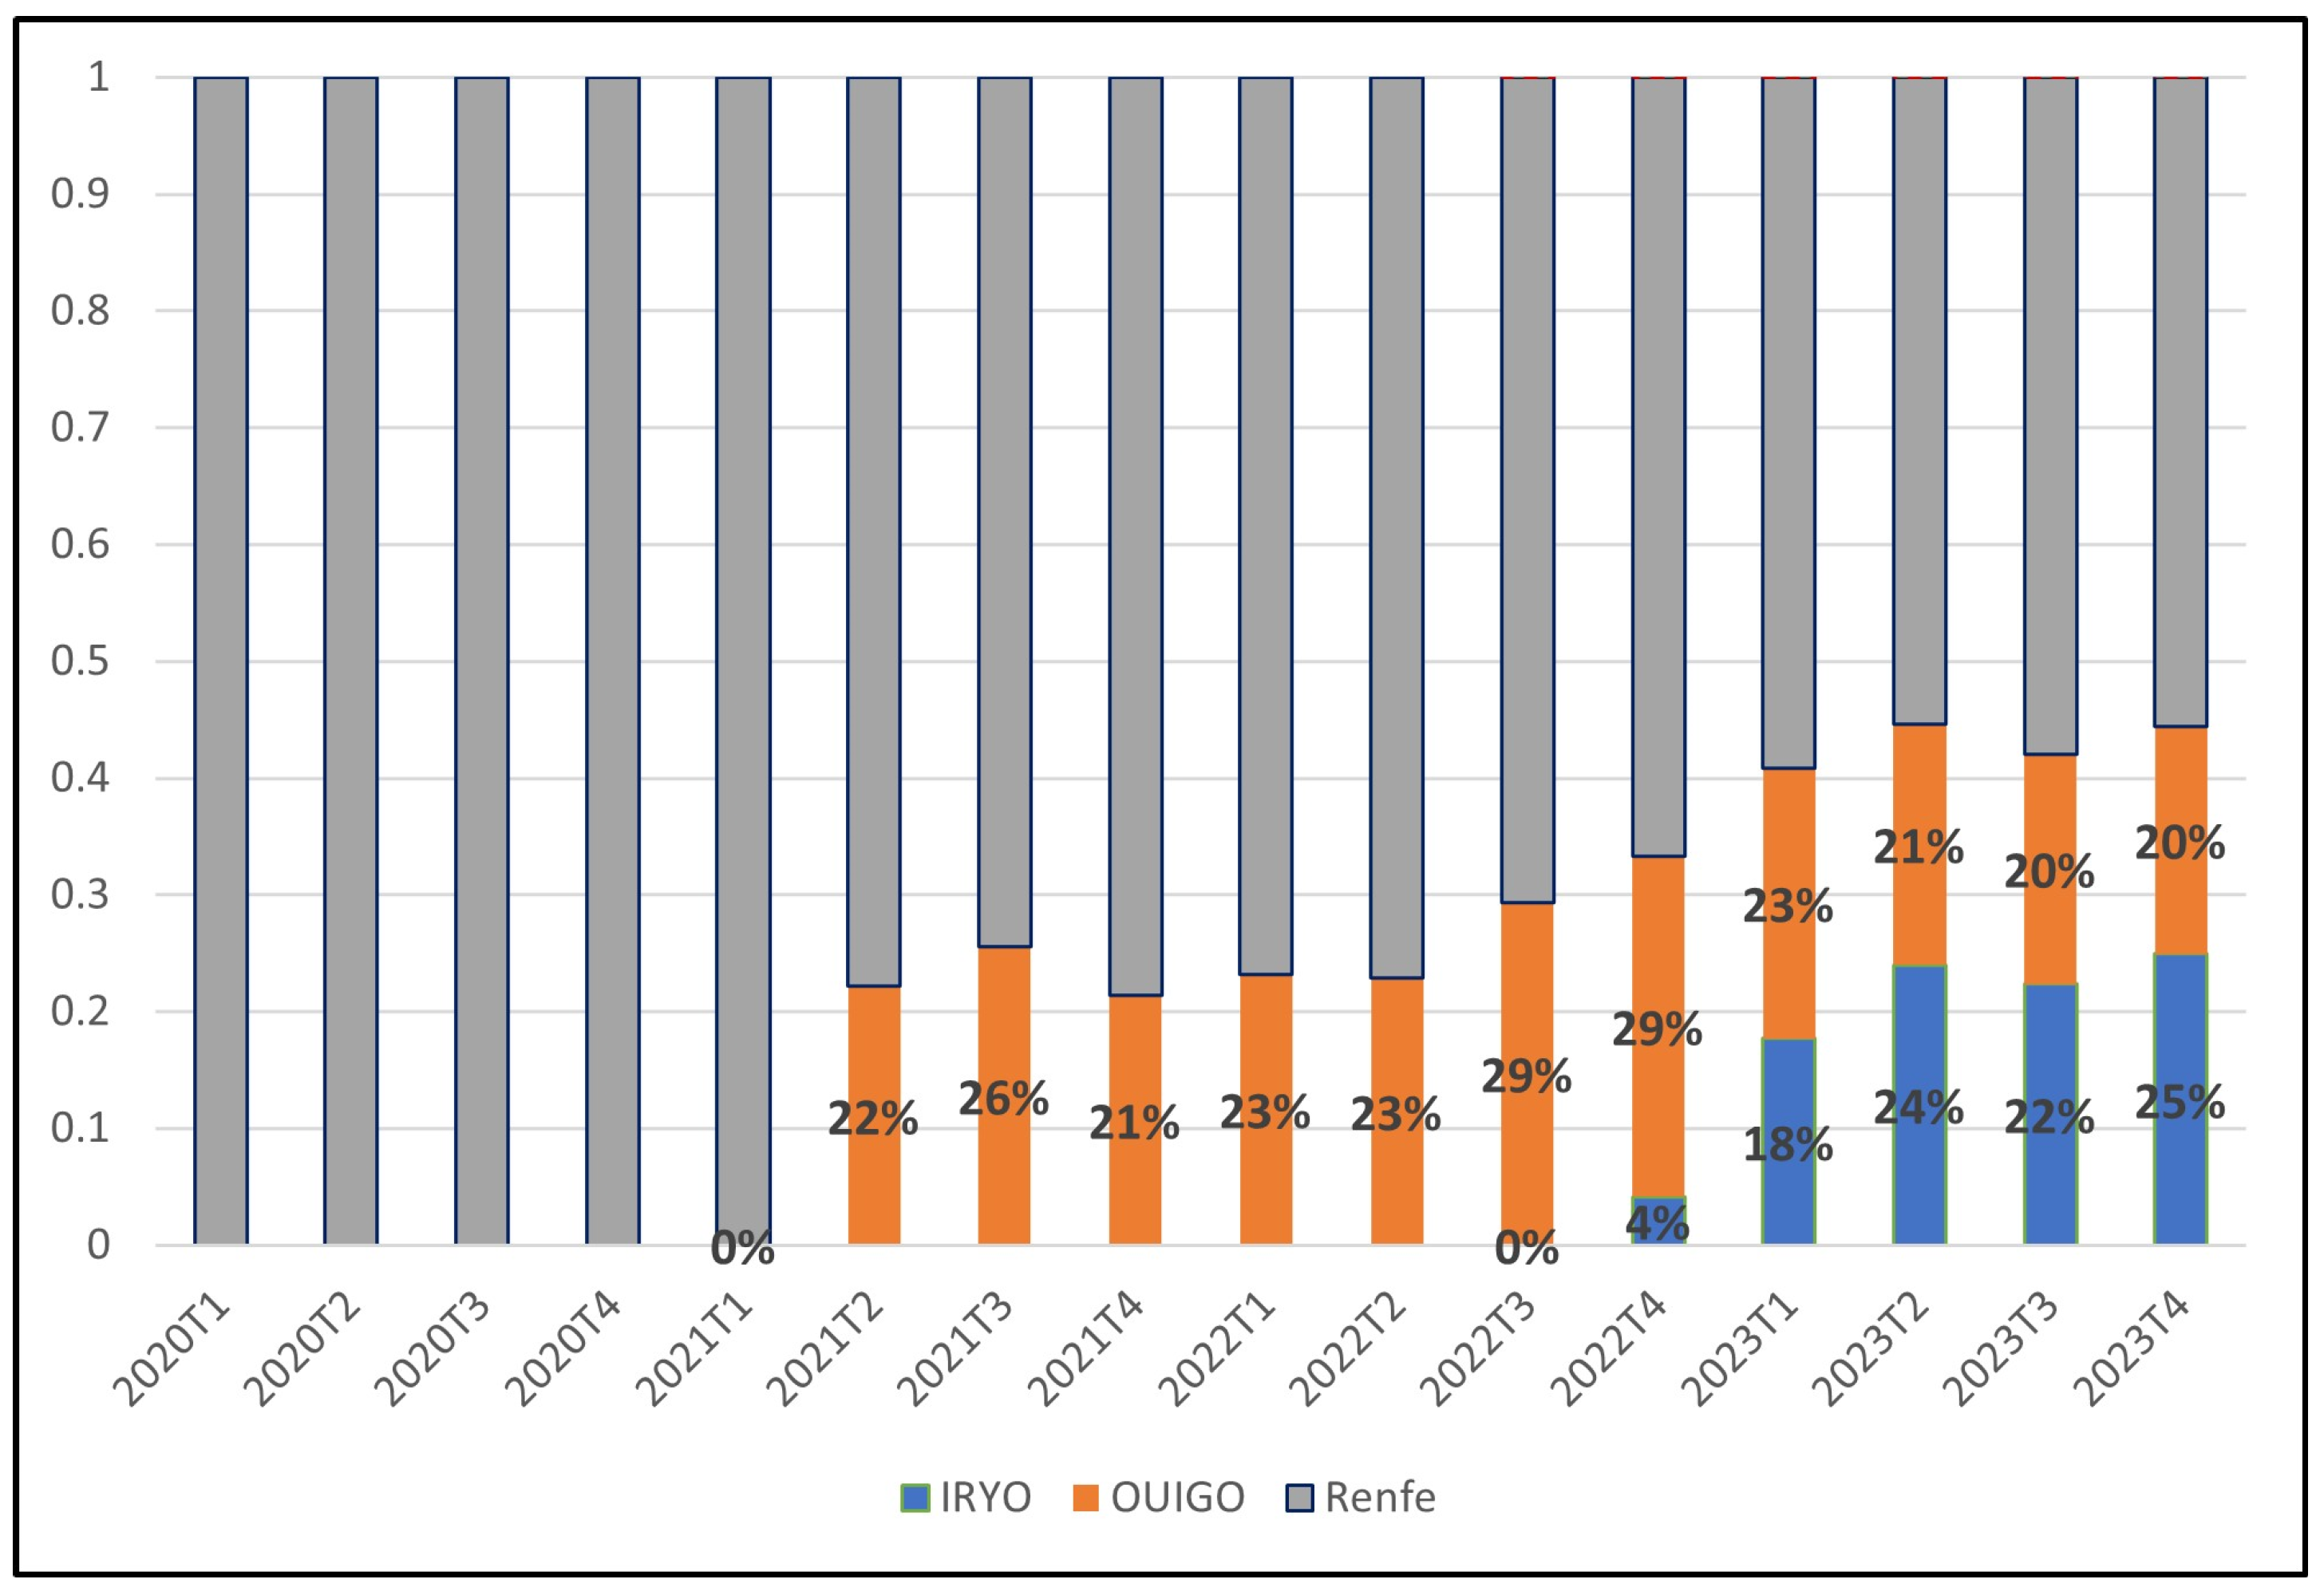
The busiest intercity route in Spain in terms of trains and passengers remains the Madrid–Barcelona corridor. In fact, CNMC data show that more than 43% of the total number of HSR passengers in Spain in 2023 will be between these two cities. Between Madrid and Barcelona, Renfe currently competes with both Ouigo and Iryo. In fact, the effects of competition in terms of market share are more pronounced in this intercity corridor. The two new entrants now have about 45% of the market share in terms of total passengers (see Figure 3).
As a result, this corridor is the one whose passengers have benefited the most from the opening of the market, as it has seen the greatest increase in demand and the sharpest fall in average prices [9]. This is clearly reflected in the frequency of trains. In this corridor, ADIF now offers 106 daily potential trips in both directions, while Renfe only used 58 during its monopoly period. Thus, in its latest report, the competition authority argues that the Spanish HSR infrastructure was underused in the pre-competition period. Subsequently, Spanish customers have benefited from a decrease in prices and an increase in frequencies [10].

2.2. Liberalisation Results in Other Countries: Theoretical and Empirical Effects on Prices

The liberalisation of railway markets has prompted a growing body of theoretical research investigating how the entry of competing train operators affects equilibrium prices, patterns of competition, and consumer welfare. Central to this literature are formal economic models that analyse the implications of entry under a range of competition formats (such as Bertrand or Cournot), account for consumer heterogeneity, and consider both static and dynamic market settings. The present survey reviews work that explicitly addresses these core issues, focusing on papers employing formal analytic or structural modelling within the context of liberalised or deregulated railway sectors.
Foundational models in this domain typically adopt static oligopoly frameworks to examine price competition following entry. Ruiz-Rua and Palacin [11] developed a two-stage entry-pricing game for high-speed rail, capturing both the fixed investment decisions of entrants and subsequent Bertrand pricing by incumbent and entrant operators. Integrating a discrete-choice demand system, their analysis yielded equilibrium outcomes for entry, prices, and market shares while incorporating consumer heterogeneity through modal (rail versus air) substitution. Similarly, Cherbonnier et al. [12] constructed and calibrate a differentiated-products Bertrand oligopoly model for French long-distance passenger railways, explicitly considering business and leisure passenger segments and contrasting open-access with franchise-based entry regimes. Both studies demonstrated that entry reduced fares and impacted the competitive structure, with the extent of price reduction shaped by the degree of consumer heterogeneity and service differentiation.
Complementing these theoretical frameworks, Ivaldi and Vibes [13] simulated static inter- and intra-modal competition along a key German corridor, combining Nash equilibrium pricing with a heterogeneous consumer demand model spanning rail, air, and road travel modes. Their results further confirmed that market entry—particularly by low-cost rail operators—lowers equilibrium prices and redistributes market shares in the passenger transport sector.
Dynamic perspectives are more limited but are exemplified by Coublucq et al. [14], who simulated a multi-period model for U.S. freight rail. Incorporating both static Bertrand pricing and dynamic investment decisions in network quality, their findings highlighted a static–dynamic trade-off: entry reduces incumbent markups but also dampens long-term investment in network quality.
Other contributions extend these core approaches to accommodate variations in competition formats, regulatory regimes, and modal structures. For instance, Spulber andSidak [15] analysed alternative access-pricing policies and competition models (Bertrand, Cournot, Chamberlin) in a general network-industry framework, showing how regulated access fees can support efficient entry and influence price competition.
Taken together, this theoretical literature employs a range of formal economic models—static, dynamic, and regulatory—to rigorously evaluate the impact of entry on pricing in railway markets, consistently identifying entry as a driver of lower equilibrium prices and increased market contestability. However, comprehensive dynamic models with fully integrated consumer heterogeneity remain scarce, and the effects of regulatory design and network-wide competition continue to motivate ongoing research.
In particular, from an empirical point of view, Lérida-Navarro et al. [16] showed that the EU regulatory process for rail liberalisation has, in general, had a positive impact on the efficiency of the rail markets of member economies. The authors concluded that liberalisation of rail markets is, on average, associated with enhanced efficiency gains for the rail system in most EU economies. The most significant factor in promoting efficiency seems to be the establishment of an “effective competition”, which is gauged through a competition index encompassing various elements, including the number of market entrants and shifts in the incumbent’s market share [17].
Esposito et al. (2017) [18] also conducted an empirical study on the impact of market opening on quality, prices, and infrastructure investment for European economies. However, their findings indicated that liberalisation did not appear to exert a discernible influence on quality or prices. However, the evidence suggested that it had contributed significantly to an increase in infrastructure investment.
In another study of competition in the European rail passenger industry, Beria et al. (2016) [19] discussed two different expected scenarios in terms of pricing behaviour at the end of the monopoly. As shown in Figure 4, using a simplified difference-in-difference representation, the authors theorised two different possible behaviours in the price response to entry. They presented a first scenario in which the effect is reflected in a “sudden” price decrease, and a second scenario in which this effect is transitory or “delayed”. This second scenario, the authors explained, can occur, for example, if the incumbent strategically anticipates the competition and decides to cut prices some periods before entry. This type of analysis was performed by Brenna (2024) [20], who assessed the impact of the competition price on the Madrid–Alicante and Madrid–Málaga routes using confidential data, which we cannot replicate.
As previously stated, our analysis will disaggregate most of the data by fare type (economy vs. business) to evaluate whether the incumbent has treated all customer segments equitably. Some previous researchers have already addressed this aspect in their research. For example, Froidh and Bystrom (2013) [21] posited that market liberalisation was likely to result in a reduction in the price of economy class fares.
Beria et al. (2022) [22] also considered this disaggregation in their analysis of the Italian rail market. In this pioneering experience, the first new rival, NTV, entered the market in 2012, challenging Trenitalia’s monopoly position until that moment. The authors’ empirical findings revealed that the Italian incumbent did not anticipate entry but reduced low-fare prices by approximately 15% in the year following the introduction of competition. Interestingly, Trenitalia did not adjust its business class prices in response to the entry of NTV. Therefore, there was no discernible impact of competition on these “first-class fares”, while “second-class fares” saw a reduction of between 10% and 20%.
Furthermore, in the most recent articles to date, Laroche (2024) [23] conducted corridor research on the impact of competition in the railway market on frequency and price. They analysed a sample of European intercity corridors and found that competition had a significant impact on frequencies, but not on economy class prices. They attributed this result to the effect of oligopolistic organisations among operators. Similar results were obtained for Serbia by Trifunovic et al. (2024) [24].
On the contrary, for the Spanish case, the regulatory authority, in its latest report on rail markets, quantified the impact of liberalisation in terms of consumer surplus, with gains of around 343 million euros between 2019 and 2023 [9]. The regulator stated that these gains came mainly from the reduction in the average price of the service. However, they showed that passengers on the Madrid–Barcelona corridor have benefited the most, and attribute 25–30% of these gains to increases in demand.

3. Our Results: Identifiable Price Patterns

As discussed above, most of the research conducted on intercity rail fares in Europe following liberalisation has focused on the quantitative aspects of incumbent pricing strategies. However, the results of this research have not always been conclusive. The objective of our research was to provide a more comprehensive understanding of the Spanish case, including qualitative insights into Renfe’s response to competition.

3.1. Data and Methodology

Our research was based on a comprehensive database of rail fares for all daily Renfe HSR rail services on the Madrid–Barcelona corridor, including all fare types, from 12 April 2019 to 24 June 2022. The database contains a significant number of observations. For the sake of simplicity and to facilitate our analysis, the data have been extensively processed and transformed into daily and monthly average prices. In the absence of detailed data on competitors’ prices, our analysis focuses only on Renfe’s pricing strategy in response to the launch of the French private operator Ouigo in May 2021.
In addition, the dataset includes the specific type of fare associated with each observation of train price. Until July 2021, Renfe’s fares were divided into two tiers: Turista (Economy) and Preferente (Business). The former was the cheapest option, while the latter offered enhanced travel features at a premium price. Since then, Renfe has introduced a new fare structure with three fare options. The new fare categories are ‘Básico’, ‘Elige’ and ‘Elige Confort’. The first one corresponds to the former ‘Turista’ fare. The former business fare ‘Preferente’ is now divided into ‘Elige’ and ‘Elige Confort’. The latter is the most expensive and offers the most exclusive features.
This fare restructuring will be crucial for our research and can also be interpreted as Renfe’s response to competition. It will allow us to carry out a very detailed breakdown of the incumbent’s strategies, as our objective was to observe whether Renfe’s pricing strategy in response to competitors was the same for each type of target customer. To achieve this, we assumed that customers with a lower willingness to pay (WTP) buy the economy fares and those with a higher WTP buy the more expensive fares. Consequently, the former ‘Turista’ and the current ‘Básico’ price observations were merged into a single time series of economy fares, called ‘Low WTP’. Conversely, the former ‘Preferente’ was incorporated into the ‘Elige’ and ‘Elige Confort’ observations to form a separate series of business fares called ‘High WTP’, as shown in Table 1.
Although most of our analyses will be descriptive in nature, we can study in detail Renfe’s pricing strategies for its primary services (designated as AVE, or Alta Velocidad Española) in the context of competitive market entry and its low-cost services (named AVLO). We will also examine whether Renfe adjusted prices in anticipation of competition, reacted promptly, or demonstrated a delayed response, and whether Renfe’s behaviour was different according to the type of fare. We also have data from a third ‘competitor’, AVLO, as a low-cost subsidiary of Renfe since June 2021. However, our primary focus is on analysing the main incumbent’s pricing behaviour.
Table 2 summarises the descriptive statistics of the daily average data that we will use. Looking at all the prices for both directions on the Madrid (MAD)–Barcelona (BCN) corridor during this period, the first thing we noticed is that AVE’s average prices are almost double those of AVLO, Renfe’s low-cost operator. We obtained very similar AVE averages, minimums, and maximums for both MAD–BCN and BCN–MAD trains, which seems to indicate that Renfe’s pricing strategy did not differ according to the direction of the route. On the other hand, on the MAD–BCN route, the average price of the business fare was more than EUR 96 during the period analysed. This is, on average, more than 23% higher than the prices observed for economy fares. On the BCN–MAD route, we found similar price levels, with an average monthly price 22% higher for customers with a higher WTP. Similar results were found for monthly prices (by customer type), as summarised in Table 3. The remainder of this section examines in detail the qualitative patterns of the AVE tariffs, in both daily and monthly series.

3.2. Changes in Daily Prices

The initial stage of the analysis will entail a graphical examination of the behaviour of Renfe AVE’s average daily prices over the specified period, without differentiating between fare types. This will enable us to evaluate the incumbent’s pricing strategy. The highest price of the period was observed on 21 April 2019, approximately two years prior to the introduction of competition, reaching an average of more than EUR 127. On the contrary, the lowest price of the period was observed on 14 September 2021, with a daily average of EUR 45, approximately four months after the entry of Ouigo. It is evident that there was a significant price difference in the observed evolution. The price differential (highlighted in Figure 5) began in January 2021 and reached its peak in September of the same year. In fact, the price trajectory (illustrated by the red line within the yellow square) indicated a notable shift in the slope from positive to negative in January 2021. This is an interesting finding that should be taken into account. As previously stated, Ouigo entered the market in May 2021, and thus it may be inferred that Renfe’s pricing strategy in anticipation of competition was to reduce prices approximately four months prior to the entry of the first competitor. Figure 5 illustrates the daily prices for Madrid–Barcelona services.
Figure 6 shows the evolution of the prices in the other direction, the AVE trains from Barcelona to Madrid. With some exceptions, we observed very similar behaviour. During the analysis period, the average daily price paid by all passengers was reached on 14 April 2019, around EUR 130. On the contrary, the day on which prices reached the lowest level observed was 15 September 2021. This was around EUR 43, again around 4 months after the entry of Ouigo. The trend also showed the same gap, confirming that the incumbent’s behaviour did not differ between the two routes.
From these figures, we can determine one of the key contributions to the paper. Our data appeared to indicate that (contrary, for example, to the Italian case), Renfe’s pricing strategy was to anticipate and adjust to competition approximately four months before the entry of the first private competitor. We also used a linear regression of average monthly prices on a demand variable (monthly passengers, as illustrated in Figure 2 and Figure 3), a cost variable (traction power supply, provided by ADIF), and a dummy variable that takes the value 1 if there was competition in the period. Although the regression yielded some non-concluding results, we conducted a Chow test, which assesses the presence of a structural break in any period of the data. The results of this test undoubtedly confirmed the existence of a structural break in January 2021, four months before the entry of Ouigo, which is consistent with the aforementioned descriptive results.

3.3. Changes in the Fare Structure

We are now in a position to analyse in more detail the behaviour of the monthly average prices of AVE services, broken down by tariff type. As previously stated, the term “low WTP” refers to customers who purchase economy fares, while “high WTP” customers are those who opt for business fares. Figure 7 illustrates the monthly averages for business or high WTP segment tariffs. The initial observation was that Renfe’s pricing strategy appeared to be consistent on the MAD–BCN and BCN–MAD routes.
Second, despite the apparent stationarity, we have obtained an interesting result. If we disregard the peaks in stationarity, we can clearly identify a downward trend in prices from the outset of the period until April–May 2021. Prices began in April 2019 at an average of approximately EUR 110–130 per month, and subsequently declined significantly, reaching an average of around EUR 60 in March 2021, which was approximately half of the initial level.
Third, we note that this lowest price level of the higher willingness-to-pay tariffs was reached when the first private competitor entered the market. As noted previously, this may be attributed to Renfe’s anticipation of the new competitor’s market entry. However, following the entry of Ouigo in May 2021, the negative trend was reversed, with prices of these business tariffs rising steadily until the end of the analysis period. This shift in Renfe’s pricing strategy for business tariffs also coincided with the entry of AVLO. As we know, AVLO is Renfe’s low-cost operator, whose average prices typically do not exceed EUR 40 (see Table 2). In addition, Ouigo does not offer special features or alternative business rates. In light of the above, the change in the pricing of business tariffs can be attributed to Renfe’s decision to compete with Ouigo through AVLO, rather than targeting higher-paying passengers. It seems likely that price discrimination was applied towards AVE passengers who were willing to pay the highest fares.
As stated previously, Renfe adjusted prices approximately four months prior to the Ouigo launch, in January 2021. To provide a comprehensive overview, we have included a curve with the average price until December 2020. This allowed us to observe how, following a significant reduction in prices, Renfe increased them to a level that is considerably higher than before the price adjustment. Indeed, the average price for a journey between Barcelona and Madrid was EUR 126 in June 2022, compared to EUR 99 between April 2019 and December 2020. The average price of a journey between Madrid and Barcelona was EUR 110 in June 2022, compared to EUR 99 between April 2019 and December 2020. Furthermore, the estimated second-degree polynomial trend, which is the most appropriate, indicated a perfect U-shaped curve pattern.
From these analyses, we can, therefore, conclude that Renfe’s initial pricing strategy for its ‘higher-tier’ customers was to reduce prices in order to compete with Ouigo’s entry. However, once Ouigo and Renfe’s low-cost operator (AVLO) entered the market, they stopped competing in prices with AVE services for this customer segment, and these types of fares returned to pre-competition levels and increased even higher.
A different scenario was observed in the case of prices for passengers with a lower willingness to pay or economy fares. Figure 8 illustrates the monthly average prices for the most economical fare option on both the MAD–BCN and BCN–MAD routes. As in the previous scenario, Renfe’s pricing strategy remained consistent for these customers.
However, there is now a clear and constant negative linear trend in average prices. Following liberalisation, the prices of the AVE fare type “low WTP” decreased significantly. In fact, in January 2021, there was again a significant discrepancy. This indicates that Renfe, again in anticipation of the impact of competition, adjusted its prices approximately four months before the arrival of Ouigo. It is noteworthy that prices for the “low WTP” consumer segment have remained at this lower level since the entry of Ouigo and AVLO, in contrast to the case of the business travellers’ segment. The initial average price was between EUR 80 and EUR 100. Following the introduction of competition, prices fell to a range between a minimum of EUR 51 and a maximum of EUR 72 until the end of the analysis period, representing a significant reduction. A review of the average price up to December 2020 revealed that it did not even approach this level during the analysis period. Therefore, the findings revealed that Renfe has considerably lowered prices in an effort to attract the lowest-tariff customer segment, commencing the adjustment process approximately four months prior to the competition’s entry. Furthermore, the price reduction of these economy fares was sustained and never reinstated to pre-competition levels.
To gain a final and comprehensive understanding of price trends, we present the average for six months for both customer segments over the initial and concluding six-month periods of the analysis (April to June 2019 and April to June 2022, respectively). The initial period was characterised by a monopoly, while the subsequent period was competitive. Figure 9 appears to corroborate our previous assertions.
Following the introduction of competition, Renfe has maintained a lower price point for AVE services exclusively within the customer segment with the lowest WTP. On the contrary, the segment with the highest WTP exhibited an even higher average price at the end of the period than before competition. This indicates that Renfe did not adjust the prices of the more expensive tariffs in the long term following the commencement of competition. These results are not unreasonable when we consider that Ouigo entered the market as a low-cost operator and, therefore, is expected to compete mainly for the economy tariff customer segment.
To conclude this analysis, Table 4 presents a summary of the evolution of prices in three equivalent periods in 2019 and 2022, disaggregated by tariff type. This enabled us to quantify the absolute and relative changes in prices from the monopoly period to the equivalent post-competition period. The periods under consideration were April, May, and June. Once again, the results demonstrated that Renfe did not consistently reduce prices for the high WTP class. There was no discernible trend in the evolution of prices for this customer segment over comparable periods. We observed a price decrease of 5.5% in the first period, no significant change (0.7%) in the second period, and a significant increase of 9.4% in the third period. It is, therefore, not possible to quantify a consistent effect on the prices of Renfe’s business tariffs. However, it can be confirmed that they were not consistently reduced after the entry of competition. This finding is consistent with the results of the previous descriptive analysis. On the contrary, as previously indicated by graphical analysis, we observed a sustained and significant reduction in prices during the periods under review. The initial price reduction was 19.2%, followed by a further 18.5% in the second period and a more substantial +20% reduction in the third period. Therefore, we can conclude that Renfe reduced its economy class prices by an average of 18% to 20% after market opening. These results for the Spanish incumbent are comparable to those reported by Beria et al. (2016) [19] for the Italian case (see Section 2.2 above).

4. Results: Event Study

Finally, this section outlines the application of the event study methodology to our dataset. This statistical tool, developed by MacKinlay (1997) [25], enabled us to evaluate the impact of a specific event on observed prices. In this instance, the event under analysis was the entry of Ouigo into the Spanish market in May 2021. The event window was two years long, comprising the 12 months preceding and the 12 months following the event date. The price evolution was calculated as the difference between the average monthly price in the 12 months before and after the introduction of competition and the price observed in the month of entry. This allowed us to identify any notable patterns in the evolution of observed monthly average prices in the event window relative to the month of entry. Once again, the analyses were broken down by fare type and route.
The calculations were based on the following definition:
Difference in price = Price tPrice entry
where:
  • Price t: average price in month t,
  • Price entry: average price in the month of entry of competition (20 May 2021).

4.1. Business Fares

We began by conducting a qualitative analysis of the evolution of business tariffs. As expected, the evolution observed for both routes, Madrid–Barcelona and Barcelona–Madrid, was similar. The data in Figure 10 and Figure 11, where the polynomial lines represent the adjusted trend, show a significant price differential in the seventh and eighth months prior to Ouigo’s launch. This may be attributed to the travel restrictions imposed by the pandemic, which led to a decrease in prices. Notwithstanding this outlier, evidence suggests that the average price in most months preceding the entry date was higher than that of the event month. This positive difference tended to decrease in value as the date of entry into the market approached. However, it is evident that as soon as Ouigo entered the market (month 0), the prices of business tariffs increased significantly, and the difference with respect to the month of the event rose steadily. Indeed, it is evident that on the Barcelona–Madrid route, in the year following the introduction of competition, there was no instance where the price was equal to or lower than that observed in the month of the event.
Additionally, it should be noted that the AVE business tariffs for both routes reached their lowest price point during the analysis period in the month preceding Ouigo’s entry (point −1). Furthermore, we can ascertain that in the year following the entry of the first competitor, Renfe had already increased prices for AVE business fares by an average of approximately EUR 50–60 in the Madrid–Barcelona corridor. In other words, the prices of these tariffs increased by a greater amount in the year following entry than they had fallen in the year preceding competition.

4.2. Economy Fares

A shift in focus to the cheapest tariff type revealed a strikingly divergent behavioural pattern (Figure 12 and Figure 13). Prior to Ouigo’s market entry, Renfe’s prices were observed to be between EUR 20 and 40 higher than in the month of entry. The gap began to narrow significantly around four months prior to the introduction of competition, reflecting Renfe’s proactive strategy. This indicated that prices had already been adjusted to the level of competition in the three months preceding the entry of the new competitor. Following the introduction of Ouigo, prices for economy fares continued to decline for another four months. After five months of competition, no significant gaps were observed. Therefore, Renfe appeared to maintain prices at a consistent level, comparable to that observed in the event month, at least until the conclusion of the analysis period. A highly fitting second-degree polynomial equation demonstrated a clear pattern in prices during the event window. This was a clearly negative trend, which stabilised around 0 (no difference and, therefore, similar average prices) one year after the event date.

5. Discussion and Conclusions

The liberalisation of Spain’s high-speed rail market, particularly on the Madrid–Barcelona corridor, has led to increased competition that has clearly benefited consumers, especially through lower prices and greater choice. The entry of Ouigo in May 2021 prompted the incumbent operator, Renfe, to engage in strategic price competition, including anticipatory price reductions for its AVE services even before the competitor’s arrival. However, Renfe’s pricing response was not uniform across all fare types. While economy AVE fares saw substantial and sustained reductions—averaging 18% to 20% lower than pre-liberalisation levels—a disaggregated analysis showed that business-class fares experienced only temporary price cuts. After an initial reduction following Ouigo’s entry, business fares increased again when Renfe’s own low-cost operator, AVLO, began operating, and continued to rise in the following year. This U-shaped pricing pattern indicates that Renfe focused its competitive efforts on retaining price-sensitive customers, while maintaining higher prices for business travellers, a segment not directly targeted by the new entrant.
For policymakers and stakeholders, these findings highlight several important implications. First, the positive impact of competition on consumer welfare is evident, but there is a risk that benefits may be unevenly distributed, favouring economy passengers over business travellers. This suggests the need for regulatory oversight to ensure that all passenger segments benefit from liberalisation, not just those most sensitive to price. Second, the ability of incumbents to anticipate and strategically respond to new entrants underscores the importance of strong, independent regulation to prevent anti-competitive practices, such as predatory pricing or discriminatory access to infrastructure. Policymakers should ensure a level playing field by enforcing transparent access and fair competition rules, while also monitoring the long-term effects on service quality and investment.
Moreover, the Spanish experience, while similar to that of Italy, revealed unique market dynamics that should inform future liberalisation efforts in other corridors or countries. Policymakers should tailor regulatory frameworks to local market conditions, support continued investment in infrastructure, and consider integrating environmental objectives to maximise the modal shift to rail. Ultimately, liberalisation can deliver substantial consumer benefits and market growth, but only if accompanied by vigilant regulation and policies that promote both competition and equity across all segments of the passenger rail market.

Author Contributions

Conceptualisation, J.C.; methodology, S.G.-S.; data analysis, J.C. and S.G.-S.; writing—review and editing, J.C. and S.G.-S. All authors have read and agreed to the published version of the manuscript.

Funding

This research received no external funding.

Institutional Review Board Statement

Not applicable.

Informed Consent Statement

Not applicable.

Data Availability Statement

Data were provided by a consulting firm, Datamarket.com, Madrid (Spain) under conditions.

Conflicts of Interest

The authors declare no conflicts of interest.

References

  1. García Delgado, J.L. La Industrialización y el Desarrollo Económico en España Durante el Franquismo; Nadal, J., Carreras, A., Sudriá, Y.C., Eds.; La economía española en el siglo XX: Una perspectiva histórica; Ariel: Barcelona, Spain, 1987; pp. 164–189. [Google Scholar]
  2. AIREF. Estudios Sobre Infraestructuras de Transporte. Spending Review. 2020. Autoridad Independiente de Responsabilidad Fiscal. 2020. Available online: https://www.airef.es/en/document-center/studies-document-center/transport-infrastructure-study/ (accessed on 5 May 2025).
  3. UIC. High-Speed Data and Atlas. Union Internationale des Chemins de Fer. 2023. Available online: https://uic.org/passenger/highspeed/article/high-speed-data-and-atlas?recherche=high-speed%20atlas (accessed on 5 May 2025).
  4. European Commission. Eight Monitoring Report on the Development of the Rail Market Under Article 15(4) of Directive 2012/34/EU of the European Parliament and of the Council. 2012. Available online: http://eur-lex.europa.eu/legal-content/EN/TXT/PDF/?uri=CELEX:52023DC0510 (accessed on 5 May 2025).
  5. Joskow, A.; Werden, G.; Johnson, R. Entry, exit, and performance in airline markets. Int. J. Ind. Organ. 1994, 12, 457–471. [Google Scholar] [CrossRef]
  6. Yamawacki, H. Price reactions to new competition: A study of U.S. luxury car market, 1986–1997. Int. J. Ind. Organ. 2002, 20, 19–39. [Google Scholar] [CrossRef]
  7. Campos, J. La Competencia en el Ferrocarril: Un Análisis del Nuevo Marco Institucional en Europa y en España. FEDEA Policy Papers, 2015/12. Madrid. 2015. Available online: https://documentos.fedea.net/pubs/fpp/2015/12/FPP2015-12.pdf (accessed on 5 May 2025).
  8. Campos, J. Efectos de la Introducción de Competencia en el Transporte Ferroviario de Viajeros en España; FUNCAS: Madrid, Spain, 2023; ISBN 978-84-17609-66-5. Available online: https://www.funcas.es/wp-content/uploads/2023/05/Reformas-de-la-competencia__Capitulo-12.pdf (accessed on 5 May 2025).
  9. CNMC. Balance de la Liberalización del Transporte de Viajeros por Ferrocarril. 2024. Available online: https://www.cnmc.es/sites/default/files/5307599.pdf (accessed on 5 May 2025).
  10. Montero, J.; Ramos Melero, R. Competitive tendering for rail track capacity: The liberalisation of railway services in Spain. Compet. Regul. Netw. Ind. 2022, 23, 43–59. [Google Scholar] [CrossRef]
  11. Ruiz-Rua, A.; Palacin, R. Towards a liberalised European high speed railway sector: Analysis and modelling of competition using Game Theory. Eur. Transp. Res. Rev. 2013, 5, 53–63. [Google Scholar] [CrossRef]
  12. Cherbonier, F.; Ivaldi, M.; Muller-Vibes, C.; Van Der Straeten, K. Competition for versus in the market of long-distance passenger rail services. Rev. Netw. Econ. 2017, 16, 203–238. [Google Scholar] [CrossRef]
  13. Ivaldi, M.; Vibes, C. Intermodal and Intramodal Competition in Passenger Rail Transport. 2005. Available online: https://ssrn.com/abstract=637242 (accessed on 5 May 2025).
  14. Coublucq, D.; Ivaldi, M.; McCullough, G. The Static-Dynamic Efficiency Trade-off in the US Rail Freight Industry: Assessment of an Open Access Policy. Rev. Netw. Econ. 2018, 17, 267–301. [Google Scholar] [CrossRef]
  15. Spulber, D.F.; Sidak, G. Network Access Pricing and Deregulation. Ind. Corp. Change 1997, 6, 757–782. [Google Scholar] [CrossRef]
  16. Lérida-Navarro, C.; Nombela, G. Liberalización de los servicios de alta velocidad ferroviaria en España: El proceso de apertura del mercado a la competencia. Stud. Appl. Econ. 2022, 40. [Google Scholar] [CrossRef]
  17. Lérida-Navarro, C.; Nombela, G.; Tranchez-Martin, J.M. European railways: Liberalization and productive efficiency. Transp. Policy 2019, 83, 57–67. [Google Scholar] [CrossRef]
  18. Esposito, G.; Doleschel, J.; Kaloud, T.; Urban-Kozlowska, J. The changing nature of railways in Europe: Empirical evidence on prices, investments and quality. In The Reform of Network Industries; Florio, M., Ed.; Edward Elgar Publishing: Cheltenham, UK, 2017. [Google Scholar]
  19. Beria, P.; Redondi, R.; Malighetti, P. The Effect of Open Access Competition on Average Rail Prices. The Case of Milan—Ancona. J. Rail Trans. Plan. Man. 2016, 6, 271–283. Available online: https://trid.trb.org/view/1429202 (accessed on 5 May 2025). [CrossRef]
  20. Brenna, C. Price impact of high-speed rail competition between multiple full-service and low-cost operators on less congested corridors in Spain. Transp. Policy 2024, 156, 77–88. [Google Scholar] [CrossRef]
  21. Froidh, O.; Bystrom, C. Competition on the tracks—Passenger’s response to deregulation of interregional rail services. Transp. Res. Part A 2013, 56, 1–10. [Google Scholar]
  22. Beria, P.; Tolentino, S.; Shtele, E.; Lunkar, V. A difference-in-difference approach to estimate the price effect of market entry on high-speed rail. Compet. Regul. Netw. Ind. 2022, 23, 183–213. [Google Scholar] [CrossRef]
  23. Laroche, F. Goodbye monopoly: The effect of open access passenger rail competition on price and frequency in France on the high-speed Paris-Lyon line. Transp. Policy 2024, 147, 12–21. [Google Scholar] [CrossRef]
  24. Trifunović, D.; Stojadinović, N.; Ristić, B.; Jovanović, P. Investigating the market share convergence and welfare potentials of asymmetric train access charges for the commercial passenger rail services. Res. Transp. Econ. 2024, 107, 101465. [Google Scholar] [CrossRef]
  25. MacKinlay, C. Event Studies in Economics and Finance. J. Econ. Lit. 1997, 35, 13–39. [Google Scholar]
Figure 1. Evolution of monthly HSR demand in Spain (2015–2024).
Futuretransp 05 00066 g001
Figure 2. Evolution of market shares after HSR liberalisation (monopoly = 1).
Futuretransp 05 00066 g002
Figure 3. Market share of all routes, in passenger km (CNMC data).
Futuretransp 05 00066 g003
Figure 4. Two theoretical scenarios of the expected price effects of competition.
Futuretransp 05 00066 g004
Figure 5. Average daily price of AVE (in EUR), Madrid–Barcelona direction.
Futuretransp 05 00066 g005
Figure 6. Average daily price of AVE (in EUR), Barcelona–Madrid direction.
Futuretransp 05 00066 g006
Figure 7. Monthly average prices of the high WTP segment.
Futuretransp 05 00066 g007
Figure 8. Monthly average prices of the ‘low WTP’ segment.
Futuretransp 05 00066 g008
Figure 9. Evolution of the six-month average price of AVE, by route and client segment.
Futuretransp 05 00066 g009
Figure 10. Differences in AVE business rates since liberalisation (MAD–BCN).
Futuretransp 05 00066 g010
Figure 11. Differences in AVE business rates since liberalisation (BCN–MAD).
Futuretransp 05 00066 g011
Figure 12. Differences in the prices of the AVE economy since liberalisation (MAD–BCN).
Futuretransp 05 00066 g012
Figure 13. Differences in AVE economy prices since liberalisation (BCN–MAD).
Futuretransp 05 00066 g013
Table 1. Renfe’s fare categories before and after July 2021.
Fare TypeTime Series
Before July 2021Turista
Preferente
Low WTP
High WTP
After July 2021Básico
Elige + Elige Confort
Low WTP
High WTP
Table 2. Average daily fares of Renfe (AVE and AVLO). Data in euros.
ServiceObservationsMeanStd. Dev.Min.Max.
AVE MAD–BCN110379.0916.3445.06127.87
AVLO MAD–BCN73441.529.2421.5285.29
AVE BCN–MAD110378.8210.1843.63130.15
AVLO BCN–MAD73441.2011.2419.8783.54
Table 3. Renfe (AVE) average monthly rates by type of customer. Data in euros.
ServiceObservations
(Months)
MeanStd. Dev.Min.Max.
Low WTP
AVE MAD–BCN3996.2221.3856.21160.37
AVE BCN–MAD3995.7119.9458.12133.72
High WTP
AVE MAD–BCN3978.0914.5351.65106.81
AVE BCN–MAD3978.1414.2453.64107.50
Table 4. Evolution of average prices by tariff type. Data in euros.
Time
Period.
2019
Average
2022
Average
Total Change% Change2019
Average
2022
Average
Total Change% Change
Low WTP FaresHigh WTP Fares
1–30 April 90.1572.81−17.3−19.2%129.28122.13−7.15−5.5%
1–30 May84.5968.93−15.6−18.5%110.68109.89−0.80−0.7%
1–30 June88.5170.45−18.06€−20.4%107.52117.6410.129.4%
Disclaimer/Publisher’s Note: The statements, opinions and data contained in all publications are solely those of the individual author(s) and contributor(s) and not of MDPI and/or the editor(s). MDPI and/or the editor(s) disclaim responsibility for any injury to people or property resulting from any ideas, methods, instructions or products referred to in the content.