Article

Google Location History as an Alternative Data Source for Understanding Travel Behavior in Medan, Binjai, and Deli Serdang (Mebidang), Indonesia

by
Arif Wismadi
1,2,*,
Mohamad Rachmadian Narotama
1,*,
Gary Haq
3,
Steve Cinderby
3,
Deni Prasetio Nugroho
1 and
Jan Prabowo Harmanto
1
1
Center for Transportation and Logistics Studies, Universitas Gadjah Mada, Sleman 55281, Indonesia
2
Faculty of Civil Engineering and Planning, Universitas Islam Indonesia, Sleman 55584, Indonesia
3
Stockholm Environment Institute, Environment Department, University of York, York YO10 5DD, UK
*
Authors to whom correspondence should be addressed.
Future Transp. 2025, 5(2), 50; https://doi.org/10.3390/futuretransp5020050
Submission received: 31 December 2024 / Revised: 28 March 2025 / Accepted: 8 April 2025 / Published: 1 May 2025

Abstract

The performance of urban transport is a critical aspect of a city’s functionality, which needs to be supported by innovative data sources to analyze travel patterns. This study explores the use of Google Location History (GLH) as a participatory geographic information system for mobility surveys, offering a cost-effective and more detailed alternative to traditional approaches. GLH is a novel data source with high potential, but still underutilized and underresearched, especially in developing countries. This study uses a new approach in GLH data collection and data processing. Data were collected from 420 respondents in Medan, Binjai, and Deli Serdang (Mebidang) in Indonesia, to examine urban travel patterns, including trip distances, modes, and purposes, while addressing issues of data accuracy, privacy, and representation. GLH provides granular insights into mobility, reducing biases associated with self-reported surveys and identifying discrepancies between stated and actual transport usage. The findings highlight GLH’s potential for understanding spatial mobility patterns linked to demographic characteristics and travel purpose in more detail. However, technical challenges, such as data anomalies and the reliance on two devices for data collection, underscore the need to improve location readings and develop add-on tools capable of direct data export for large-scale mobility surveys. This study advances the application of GLH in mobility research, demonstrating its potential use and challenges for large-scale mobility surveys. Future research should address privacy concerns and optimize data collection to enable more inclusive and sustainable urban mobility strategies.

1. Introduction

Urban mobility and transportation are critical aspects of cities’ functionality, which becomes even more complex in high-density urban areas. Paradoxically, cities with the highest density are predominantly located in the Global South, which is less developed. Cities such as Medan, Jakarta, Dhaka, and Manila have a density of well over 15,000 people/km2, where millions of people move for work, education, and leisure using private vehicles. High use of private vehicles has negative consequences such as traffic jams, loss of productive life, increase risk of accidents, and increased pollutants and emissions. Empirical studies have also confirmed that vehicular emissions accounted for more than 90% of harmful gasses such as CO, VOC, NOX, and PM [1]. The gold standard for urban mobility is a high use of public transport to ensure flows of people are synchronized and orchestrated sustainably [2]. However, cities in the Global South face challenges in reaching this gold standard, as many parts of the cities develop in a sprawl with narrow streets unsuitable for buses, pavements occupied by informal street vendors, and lack resources to provide the much-needed transportation infrastructure.
Understanding current mobility patterns is important to ensure the provision of effective and efficient public transport with high usage. This includes understanding the process of gradually shifting towards public transportation, so citizens can travel more sustainably without much disruption. Mobility patterns can also inform the level and spread of emissions, as most emission models use secondary data [3,4,5,6,7], but can hardly predict emission changes based on complex socioeconomic dynamics.
Alternative data sources are needed to enable efficient mapping of travel behavior [8,9]. Conventional journey mapping involves asking respondents about their daily movement. This can be time consuming and expensive [10,11]. The method also raises questions on the behavioral accuracy since it relies on the memory of travelers and is often biased due to underreported travel [12]. Furthermore, most journey mapping reporting formats only show the modal split as an aggregated figure without providing specific details on how the modal share varies across various distance bands. If detailed data are available, the impact of interventions on the proportion of pedestrians (e.g., 1–3 km) or bicycle users (e.g., 1–5 km) can also be accurately estimated.
This paper discusses a survey using Google Location History (GLH)—a still underresearched innovative data source based on participatory mapping, to understand urban mobility in more detail in one of Indonesia’s growing metropolitan areas, Mebidang, an agglomeration of Medan, Binjai, and Deliserdang.

2. Literature Review

Data from participatory mapping are generally seen as a complimentary to large scale datasets, including data from statistics and origin-destination surveys to gain deeper understanding of citizens’ or the community’s mobility behavior. Participatory mapping is a collaborative process where communities and stakeholders contribute to making a map that reflects their knowledge, experience, and aspirations. Information from participatory mapping can support behavioral change and enable effective provision of transportation systems, and even urban design [13,14,15]. For example, understanding safety concerns in using public transport and walking in certain areas, especially for women and children, can inform local governments to prioritize upgrading pedestrian infrastructure, lights, and security personnel to help citizens transition towards public transportation and active mobility when going to school [16]. Understanding the different distance bands for each vehicle can help the promotion of shifting strategies for each distance band, reduce “car stickiness”—values attached to private vehicles—and provide better public transport for certain routes [17]. The following section discusses current data sources and methods relating to participatory mapping, especially using mobile phone-based GIS tools.

2.1. Participatory Geographic Information Systems (PGISs) on Mobile Phones

PGISs emerged as a response to critiques of traditional GIS, aiming to empower marginalized groups in map-making. Applications under the general term of participatory geographical information systems (PGISs) or public participatory geographical information systems (PPGISs) have been helpful for decision-making in urban planning, environmental management, and disaster management, among other areas [18]. With the development of new technology, there has been a push towards using new digital tools and methods for participatory mapping [19,20]. Examples of interactive mapping tools include Maptionnaire, Citizenlab, and ArcGIS Hub, which allow respondents to manually input spatial information on their usual routes to work or school and locate certain places of interest, using simple location tags or drawn lines. These interactive applications also have options where respondents can prioritize which initiatives should be developed first in which area.
The development of PGIS has also been largely facilitated by the development of mobile phone technology. Mobile applications can utilize built-in GPS and location detection features in smartphones. Some applications have been developed specifically for travel surveys, such as ATLAS, developed for iPhone users [14], the Household Travel Survey (Tennessee), and Future Mobility Sensing (MIT). Respondents are required to download the application that tracks their movement for a certain amount of time, and then the collected data will be sent to the server. For each of the study, less than 10% of interested people sent their data. The low participation rate was linked to a technology familiarity gap, where non-tech-savvy people are not likely to install and operate the app on their mobile phone.
Over the years, mobile phone technology has advanced, with higher location precision. However, studies have also highlighted technical issues regarding travel data collected from mobile phones. Mobile phones require input data from GPS, which are enhanced by location triangulation from BTSs (base transceiver stations), WIFI, and other devices. Depending on the quality of signal, device specification and data traffic, the precision of the location varies [21]. False nodes can be recorded if someone is stuck in a traffic jam; on the other hand, false trips can be recorded during idle time when the device location recording bounces off several WIFI routers or BTSs in the surrounding area. There is also still a possibility of human error, where respondents can forget to turn on the tracking app or run out of data.
Due to the limitation of data precision and granularity, there has also been a wide range of research focusing on mobile data analysis for transport modelling. For example, Coppola et al. [22] used machine learning and clustering algorithms to identify mobility patterns based on travel purpose and travel mode, and to verify nodes and trips. Data analysis is also crucial for differentiating systematic and non-systematic trips. There has also been a greater push towards using AI to better identify patterns systematically, and decrease intervention based on the analyst’s judgement [23]. For researchers, the range of data granularity and depth of data analysis depends on the purpose of the study.
For respondents, there are concerns over data protection; sharing a personal location, including house location, and daily routes through an installed app might be intimidating [24,25,26]. While the apps developed for PGIS may fill in the gap for a more participative survey, developing and operating the app can be costly and it may not be universally available for researchers worldwide. The mentioned challenges also become the reason that despite smartphone-based travel surveys’ great potential, they are still seldom used on a large scale [24]. From a humanistic standpoint, the academic discussion on PGIS also suggests future studies to improve technical, social, and political aspects in the process of data gathering and interpreting the maps.

2.2. Google Maps and Google Location History as a Mobility Survey Tool

Google Maps is a free mobile application ubiquitously installed on smartphones around the world, with an average 1.8 billion monthly users. Users utilize the app for navigation and search locations. The app also allows location tracking; when activated, the movement of the device is recorded and can be accessed through Google Location History. Due to its great potential as a free tool for mobility studies, several studies have tested and used Google Location History for research in areas of mobility, transport, and urban studies, as well as measuring the tool’s accuracy in recording place and time [27,28,29,30,31,32,33]. The previous studies concluded the precision of time is 85% and location 90% at a 100 m radius, and precision of transport mode classification is more than 90% for private transport and active mobility, and 80% for public transport. The findings inform us that GLH has high accuracy at a 100 m radius, which may be more appropriate for city-wide studies rather than smaller-scale areas. However, the accuracy can be maintained with less than 50 m radius when recording slower-pace movements such as walking and cycling, using advanced location setting. Studies have also proven that data accuracy depends on network infrastructure as well as device brand and specification.
Several studies have used GLH as mobility survey tool. In a study by Walker et al. [26], out of 60,000 recruitment letters sent, only 282 location data from participants were able to be used. Participants were required to send the JSON file from Google Takeout, which consists of entire trip journeys recorded on Google Maps. The study was able to produce detailed spatial and tabular data on number of trips, distance per mode, and heatmaps. Li et al. [33] used a similar method but required participants to upload only seven days of data in the KML format, downloaded from the desktop version of Google Maps. The KML file is then uploaded to the Travel and Activity Internet Survey Interface (TRAISI) survey platform, where participants can validate their travel data, such as place, time, and mode. This study captured 956 weeklong travel data with a similar analysis method. Other studies rarely obtained more than 200 respondents [25,26,28]. These empirical studies highlight consistently different results compared to conventional survey methods, with a higher number of trip legs and higher frequency of shorter distances, indicating that the GLH method recorded more trips. While evidently being more effective than conventional methods, survey participants require multiple devices and basic understanding of technology to participate, hence the low participation rate. Previous studies have provided evidence that GLH is a valuable tool for mobility surveys, but also has a deficiency in terms of ease of use and exclusion of certain participants. Tools used for analysis in previous studies were also universally accessible programs.
This study used GLH as a tool for a mobility survey with adjusted approaches in participant engagement and data analysis to make it more universal and inclusive, especially as the survey was conducted in Medan, Binjai, and Deli Serdang Cities, in North Sumatera, Indonesia—a developing country with lower infrastructure and technology adoption than the Global North. The survey seeks to gain more granular data of urban mobility, including the current level of usage of transportation modes at different distance bands and preferred routes tied to respondents’ demographic data. These types of data are useful for transport models, and support programs that focus on shifting private vehicle use towards public transportation and active mobility.
These data were compared to results from other studies in the area, mainly the Sustainable Urban Mobility Plan (SUMP) document published in 2022. It is currently considered the most comprehensive source of data. It brings together information from interviews, manual vehicle counts on major streets, and movement patterns supplied by a mobile telecommunication data provider. However, this conventional approach does not provide the modal share for each distance band and lacks detailed spatial data which can potentially help understand mobility patterns in first and last mile travel for more detailed transportation models.

3. Materials and Methods

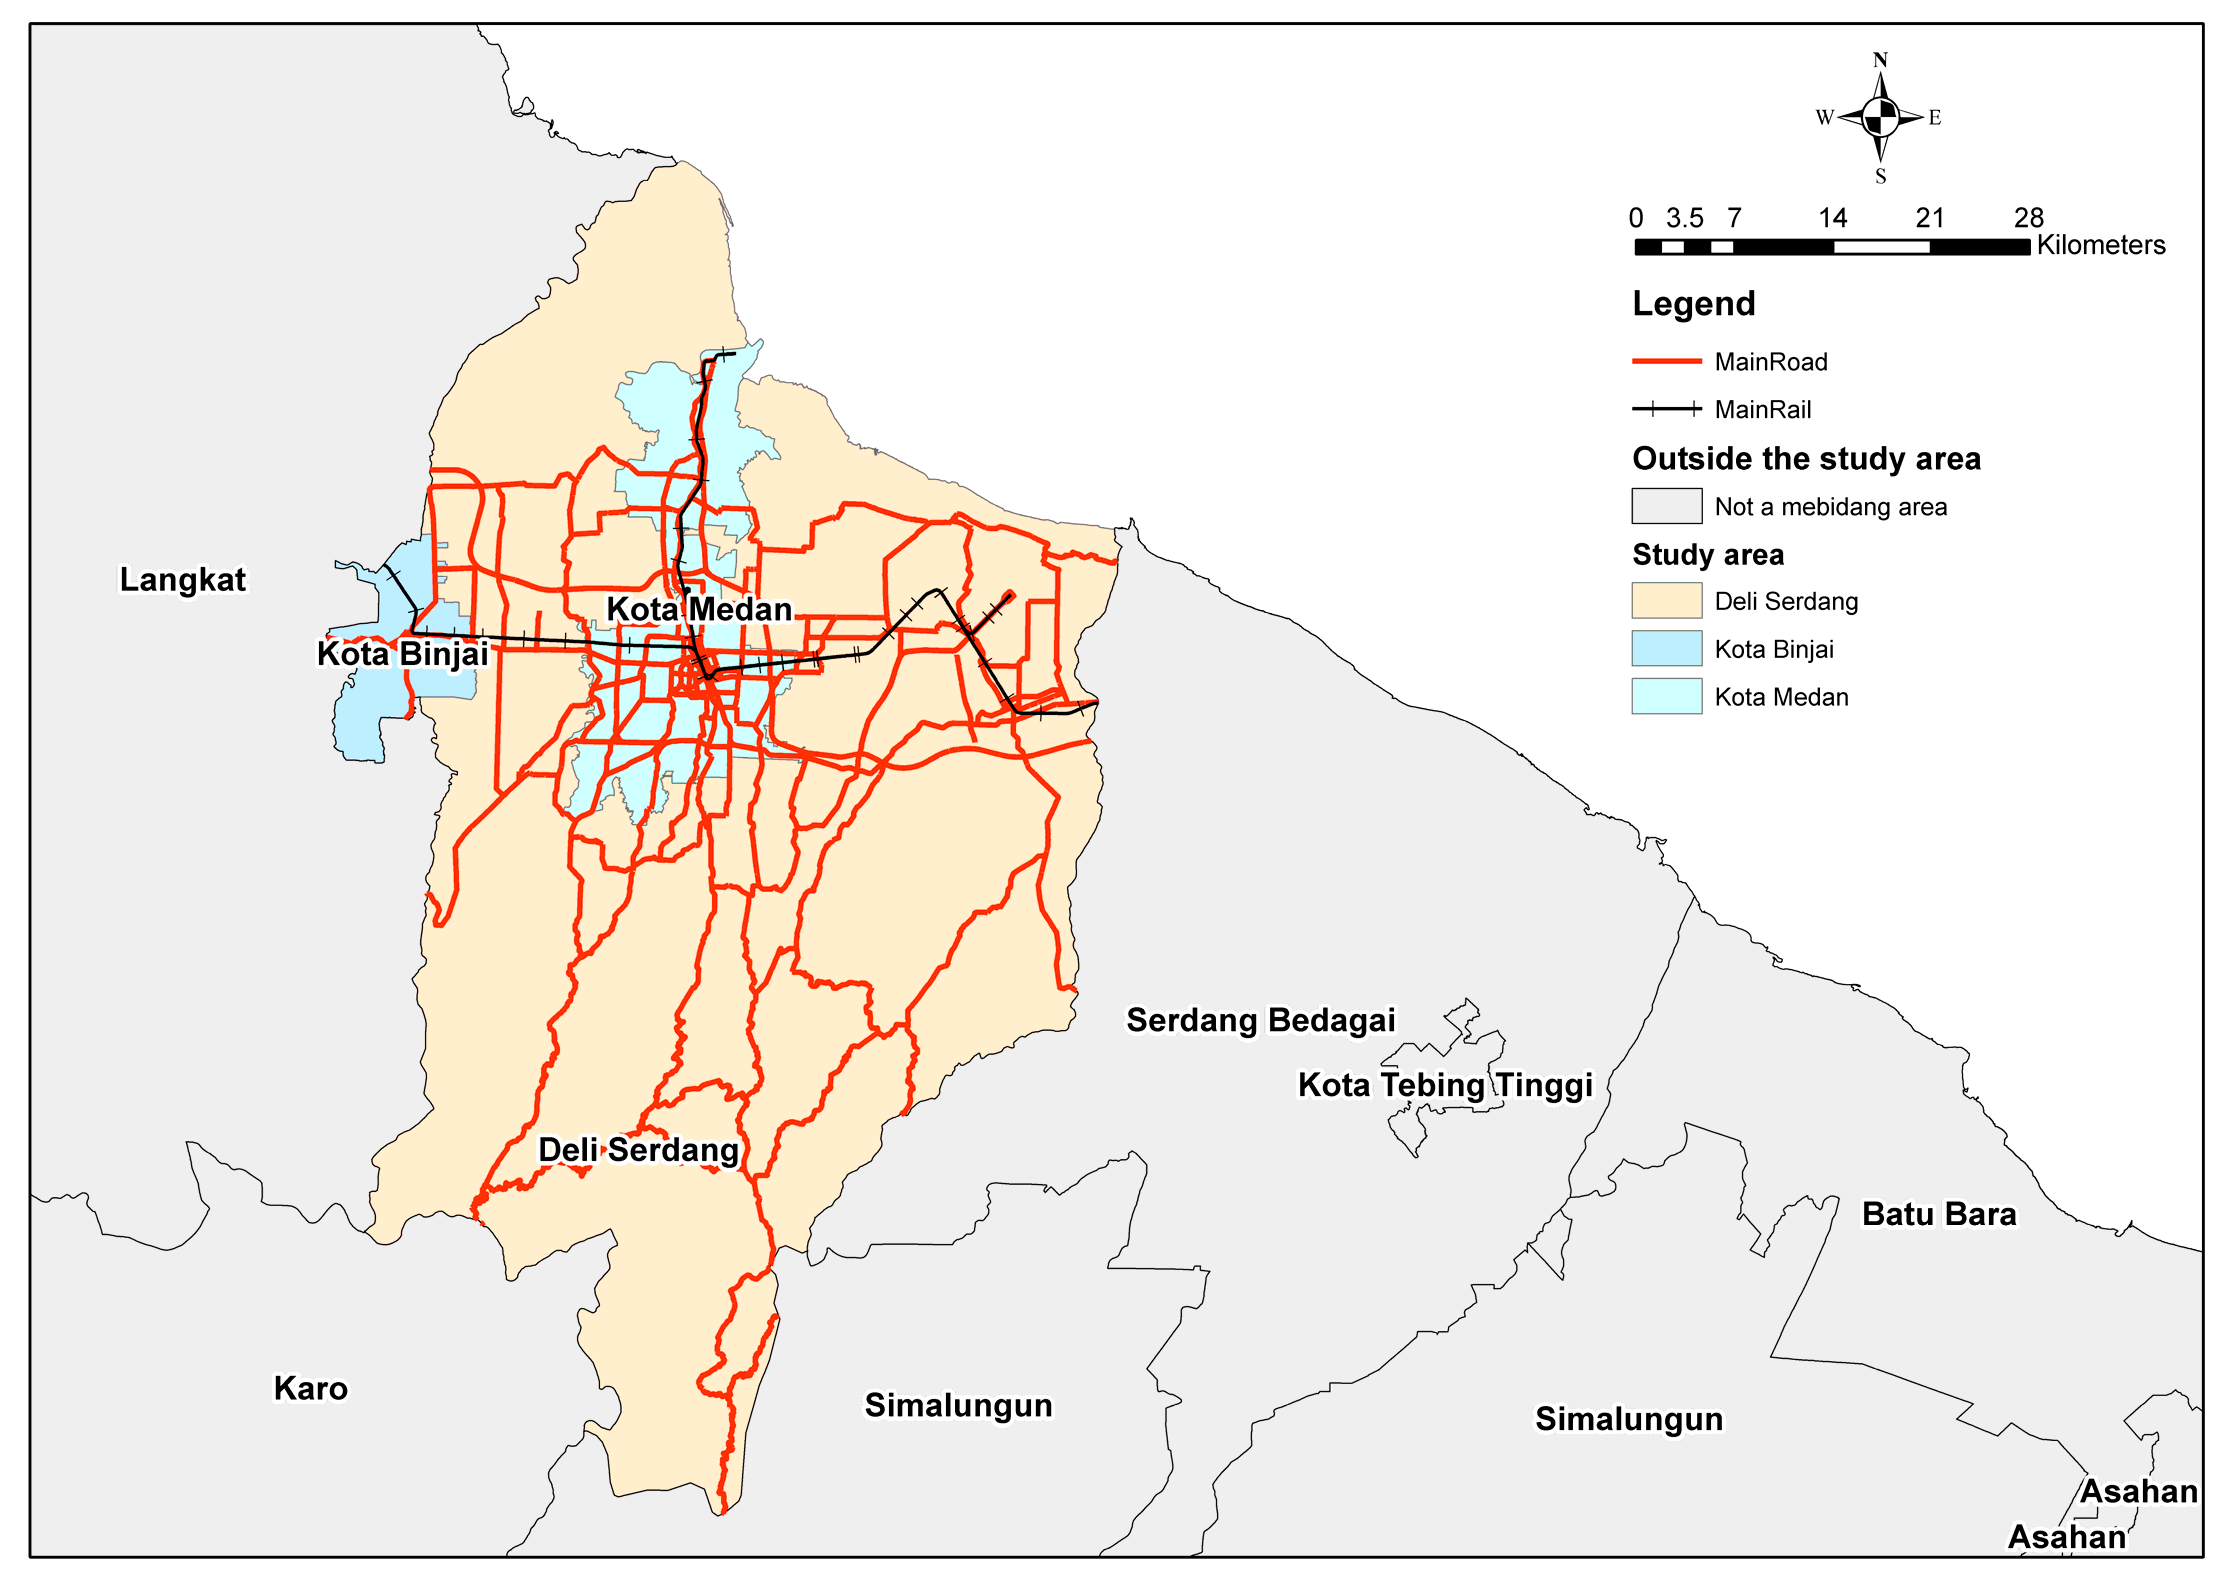
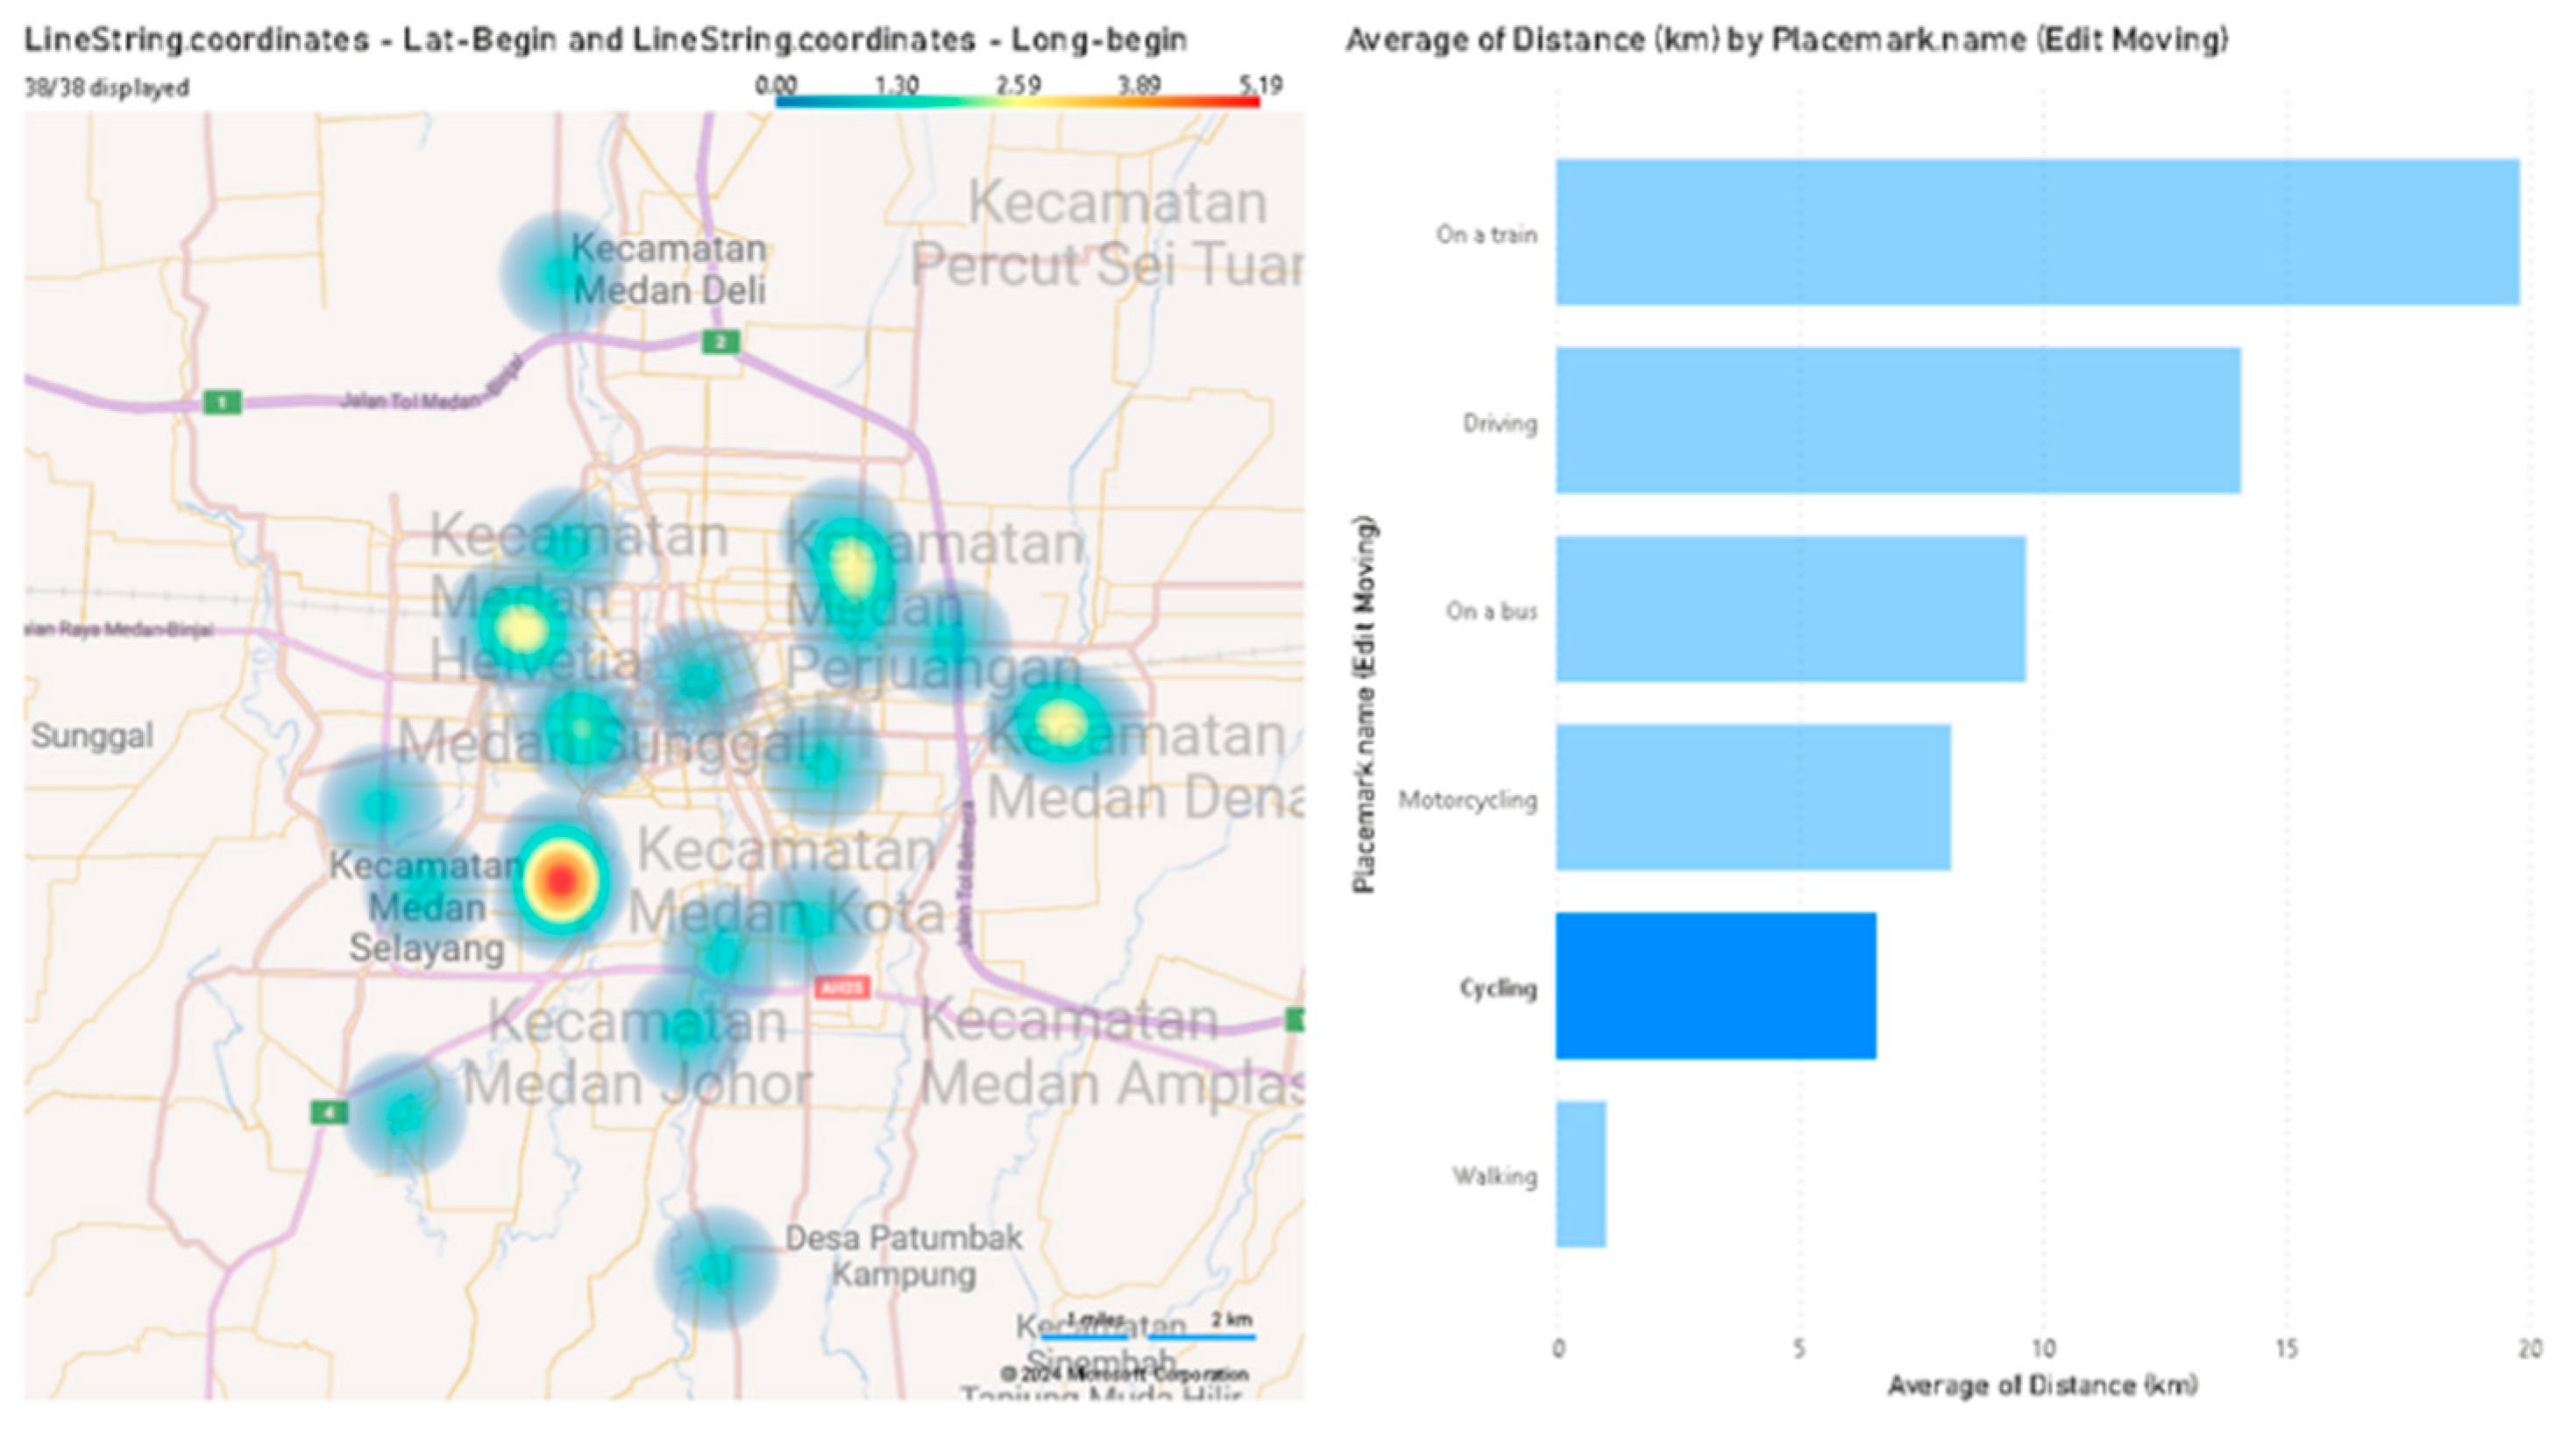
We undertook the mobility survey in the agglomeration area of Medan, Binjai, Deli Serdang (Mebidang), a growing metropolitan in North Sumatera, Indonesia, which urgently needs to develop public transportation (Figure 1). The aim of the survey was to collect mobility data from smartphone GPS that could then be analyzed in terms of total and average trip distance, travel time, type of vehicle, and location of occurring visits; workplace, schools, and bus stops. To understand mobility based on characteristics, each type of the data above is needed including demographics; trip purpose, age, education, occupation, and similar factors.
Considering concerns over security in sharing personal location data, the technical practicality, and file size per participant, we decided that participants only needed to share 7 days of travel data in KML format. To obtain the KML data, respondents needed to download them from a PC or laptop by exporting a selected travel date from Google Maps, as the mobile app version did not have an export feature. A similar method was used by Li et al. [33], who extracted KML data, whereas other publications on Google Location History (GLH) surveys required respondents to download JSON file (a simple text file used to store and share structured data) downloaded from Google Takeout, which is a record of all travel data recorded on Google Maps, and is significantly larger than KML files collected in this survey [26]. The KML data were then uploaded to a Google Form, which was compiled and analyzed by the data collection team.
Clear information about the survey’s purpose and data collection was given to participants to ensure ethical considerations and privacy protection. Participants also received the option to opt out or decline participation. We took measures to ensure secure data storage and prevent disclosure to third parties without explicit participant consent. The University of York Ethics Board also approved the survey.
We carried out a pilot survey before the main survey to test the data collection process and assess data suitability for the research. The pilot survey took place in December 2023, with a target of 50 respondents. We disseminated survey information through local newspapers, radio, and social media. We held a session with students at Universitas Sumatera Utara (USU) to promote the survey. As an incentive, we entered participants into a prize draw for a new mobile phone. Respondents took part by completing a Google Form, which included sections for consent, demographic information, and uploading KML data. The form also provided a link to a step-by-step guide on how to record, download, and upload KML data from Google Maps. By the end of the pilot survey, data from 49 respondents had been collected.
The pilot survey highlighted several important lessons. First, the demographic spread was overly homogenous, with most respondents being university students, particularly from USU. Only 12.26% of respondents had learned about the program through the media used for promotion. This lack of diversity in respondents was not representative of the general population of Mebidang, limiting the survey’s ability to capture a broad range of mobility patterns. Despite using various channels to promote the survey, participation rates were low. The low participation in the pilot survey resembled that of previous surveys using GLH and other PGIS tools. Second, although we provided the survey information, including a step-by-step guide on the required data, 34.7% of submissions did not meet the criteria. Some participants uploaded less than seven days of travel data, while others submitted files in incorrect formats, such as screenshots of their travel history or corrupt files. These challenges underscored the need for improved communication and support to ensure accurate and complete data collection.
We adjusted the data collection process based on lessons from the pilot survey, then recruited surveyors to find respondents and collect their travel data in KML format, blending new survey tools with traditional face-to-face engagement. We split the Google Form in two to be inclusive and account for participants who might be less tech-savvy or had not enabled location recording on Google Maps. The first form was used to collect personal data- age, sex, education, occupation, main purpose of travel, and perception of comfort and safety of the daily travel, while the second form was used to upload the KML data. By using this approach, it was possible for surveyors to find participants who would take part, and ask them to turn on their location recording, then collect data in the next week. Surveyors had an active role in maintaining communication with the participant. By using surveyors, participants who did not have access to a personal computer/laptop to export their KML data could be paired with survey facilitators equipped with laptops.

3.1. Data Collection

We employed stratified random sampling. Key considerations for grouping included ensuring a proportional distribution of respondents across the cities of Medan, Binjai, and Deli Serdang (Mebidang) and including vulnerable groups, in alignment with gender equality and social inclusion (GESI) principles. The target sample size was set at 400 respondents, calculated based on Cochran’s sampling formula with a 5% margin of error. This sample size ensures robust statistical analysis. In comparison, other surveys involved sample sizes with less than 200 respondent data, with only Li et al. [33] successfully achieving more than 500 respondents. This study used a respondent distribution of 60% from Medan, 20% from Binjai, and 20% from Deli Serdang, with vulnerable groups comprising at least 15% of the total sample.
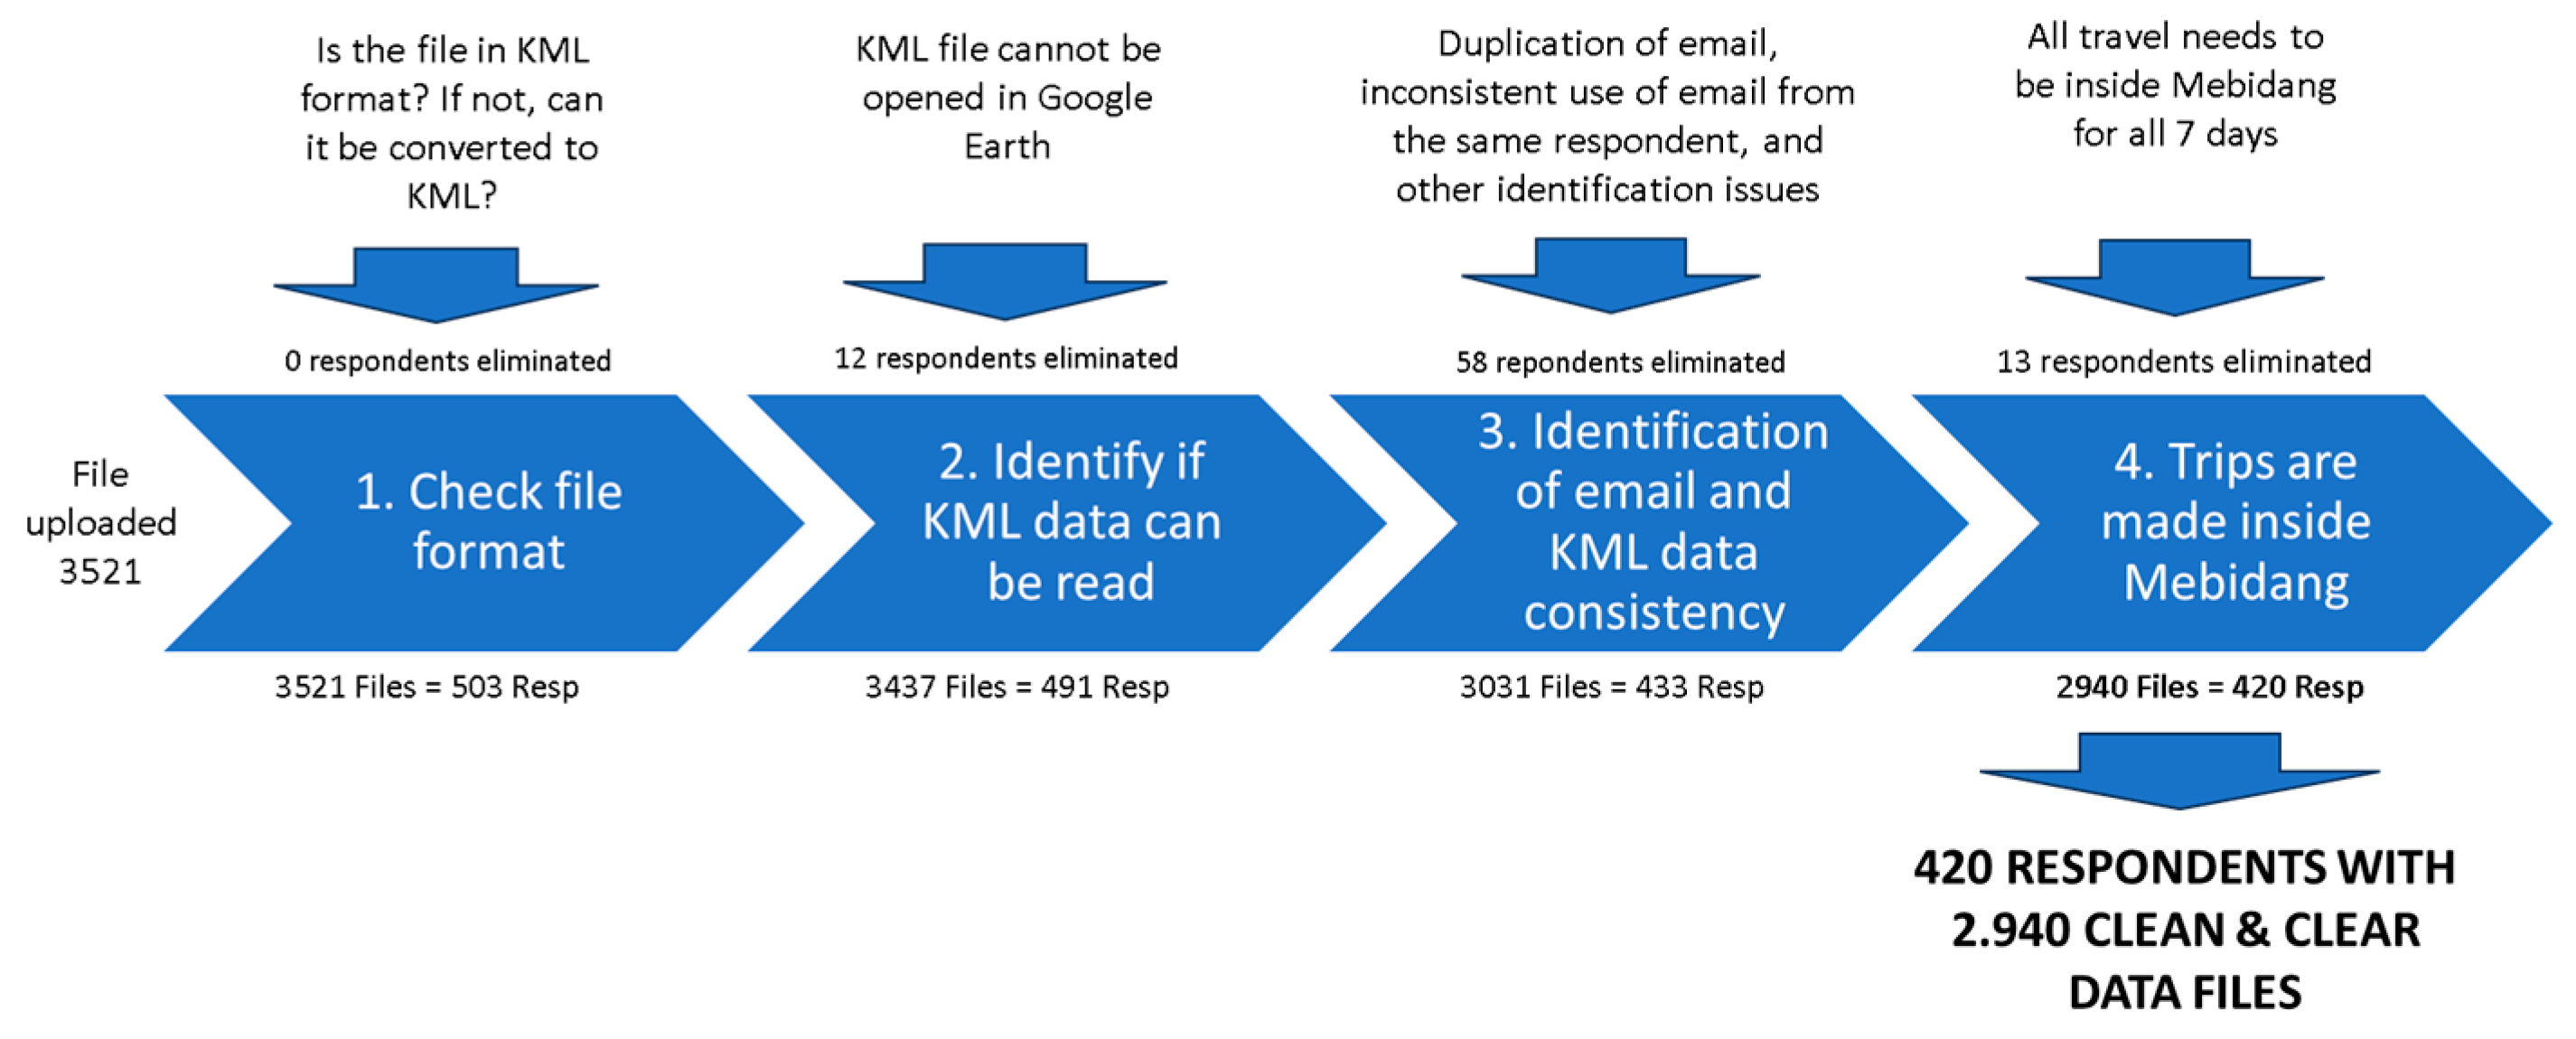
We conducted the survey between 1 August 2023 and 30 October 2023, successfully collecting 420 valid weeklong travel data, exceeding the minimum target of 400. There were four steps of initial data cleaning involved, as shown in Figure 2. The first was to check the correct file format, and all 503 respondents’ data were valid. The process was continued by individually checking the KML files were readable, eliminating email duplication or other identification issues due to wrong uploading process, and finally eliminating trips made outside Mebidang. At the end of the cleaning process, 420 valid travel data were ready to be analyzed.
We divided the analysis into two components: descriptive statistical analysis and modelling, based on KML files capturing respondents’ journeys over one week’s travel within the Mebidang area. The dataset included 62% of respondents from Medan City, 15% from Binjai City, and 23% from the Deli Serdang region. Sixteen percent of respondents represented vulnerable groups, ensuring inclusivity in line with the study’s objectives. There were 2940 KML files collected, comprising 9918 lines and 16,573 nodes. To comply with ethical and confidentiality guidelines, respondent email data were removed during data cleaning prior to analysis. This ensured the protection of participant information while enabling robust data analysis.
This study used Power BI to extract data from KML files; alternatively, this process can also be conducted in MS Excel. Prior to analysis, the data required cleaning to address errors resulting from issues such as low internet connectivity, poor GPS accuracy of mobile devices, and the nature of how the devices interacted with surrounding WIFI, telecommunication towers, and other devices, as mentioned in previous studies [21,22,24,27,32]. These errors led to the following challenges:
a.
Inaccuracies in the recorded spatial and temporal data for nodes and travel;
b.
Difficulty in accurately predicting the mode of travel based on the spatial data provided.
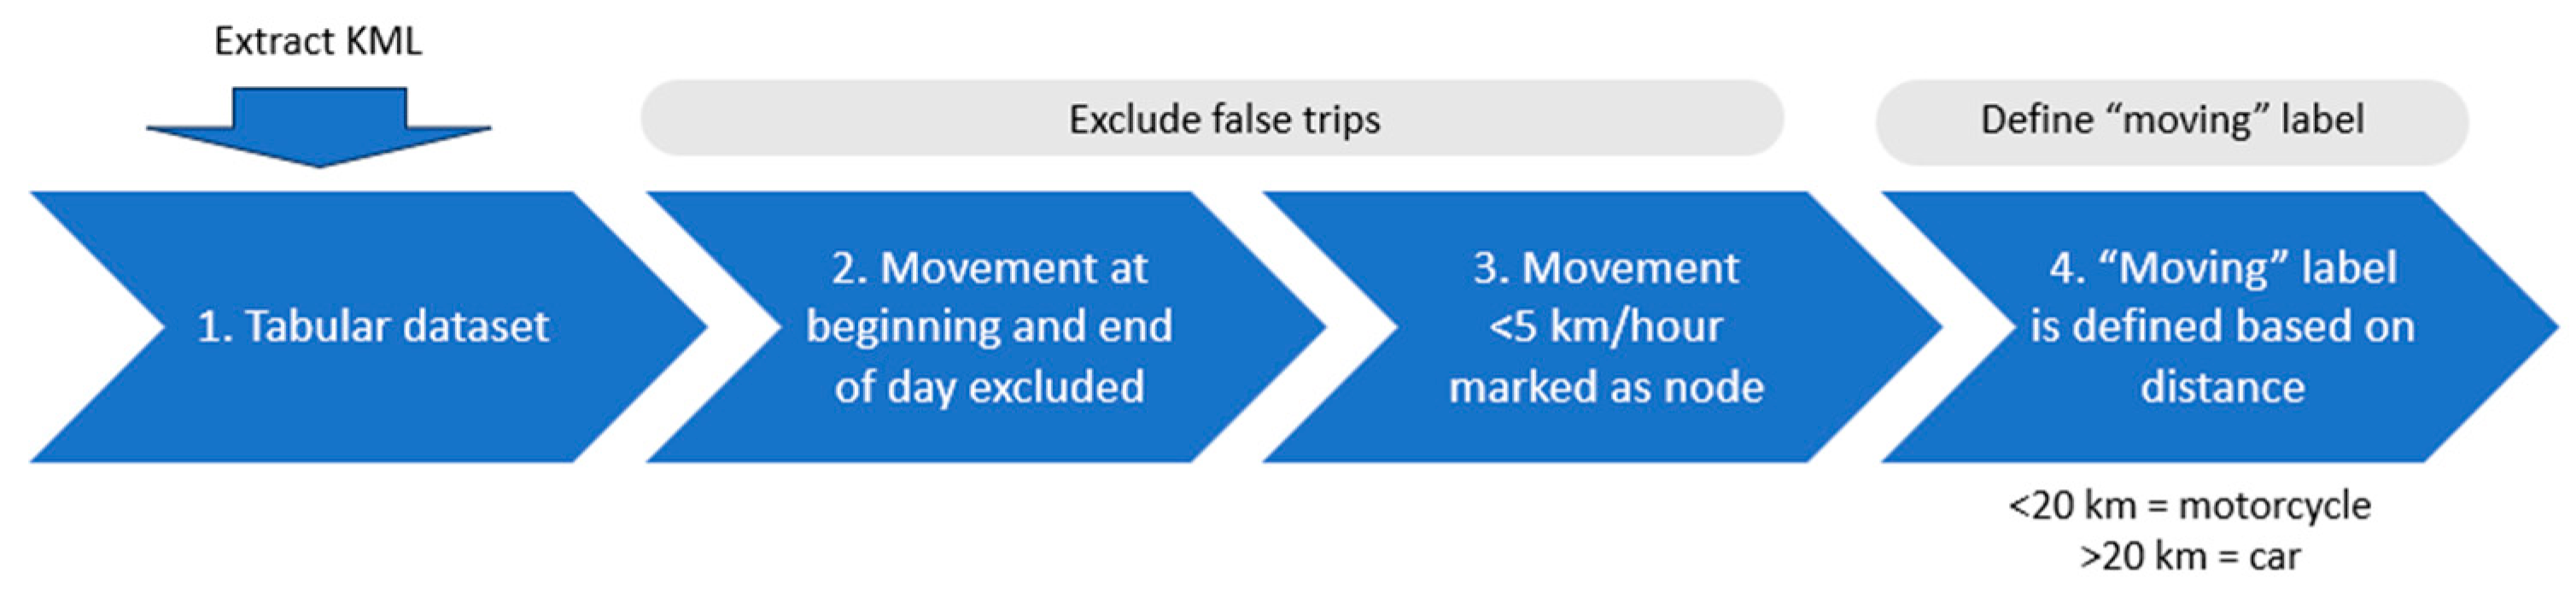
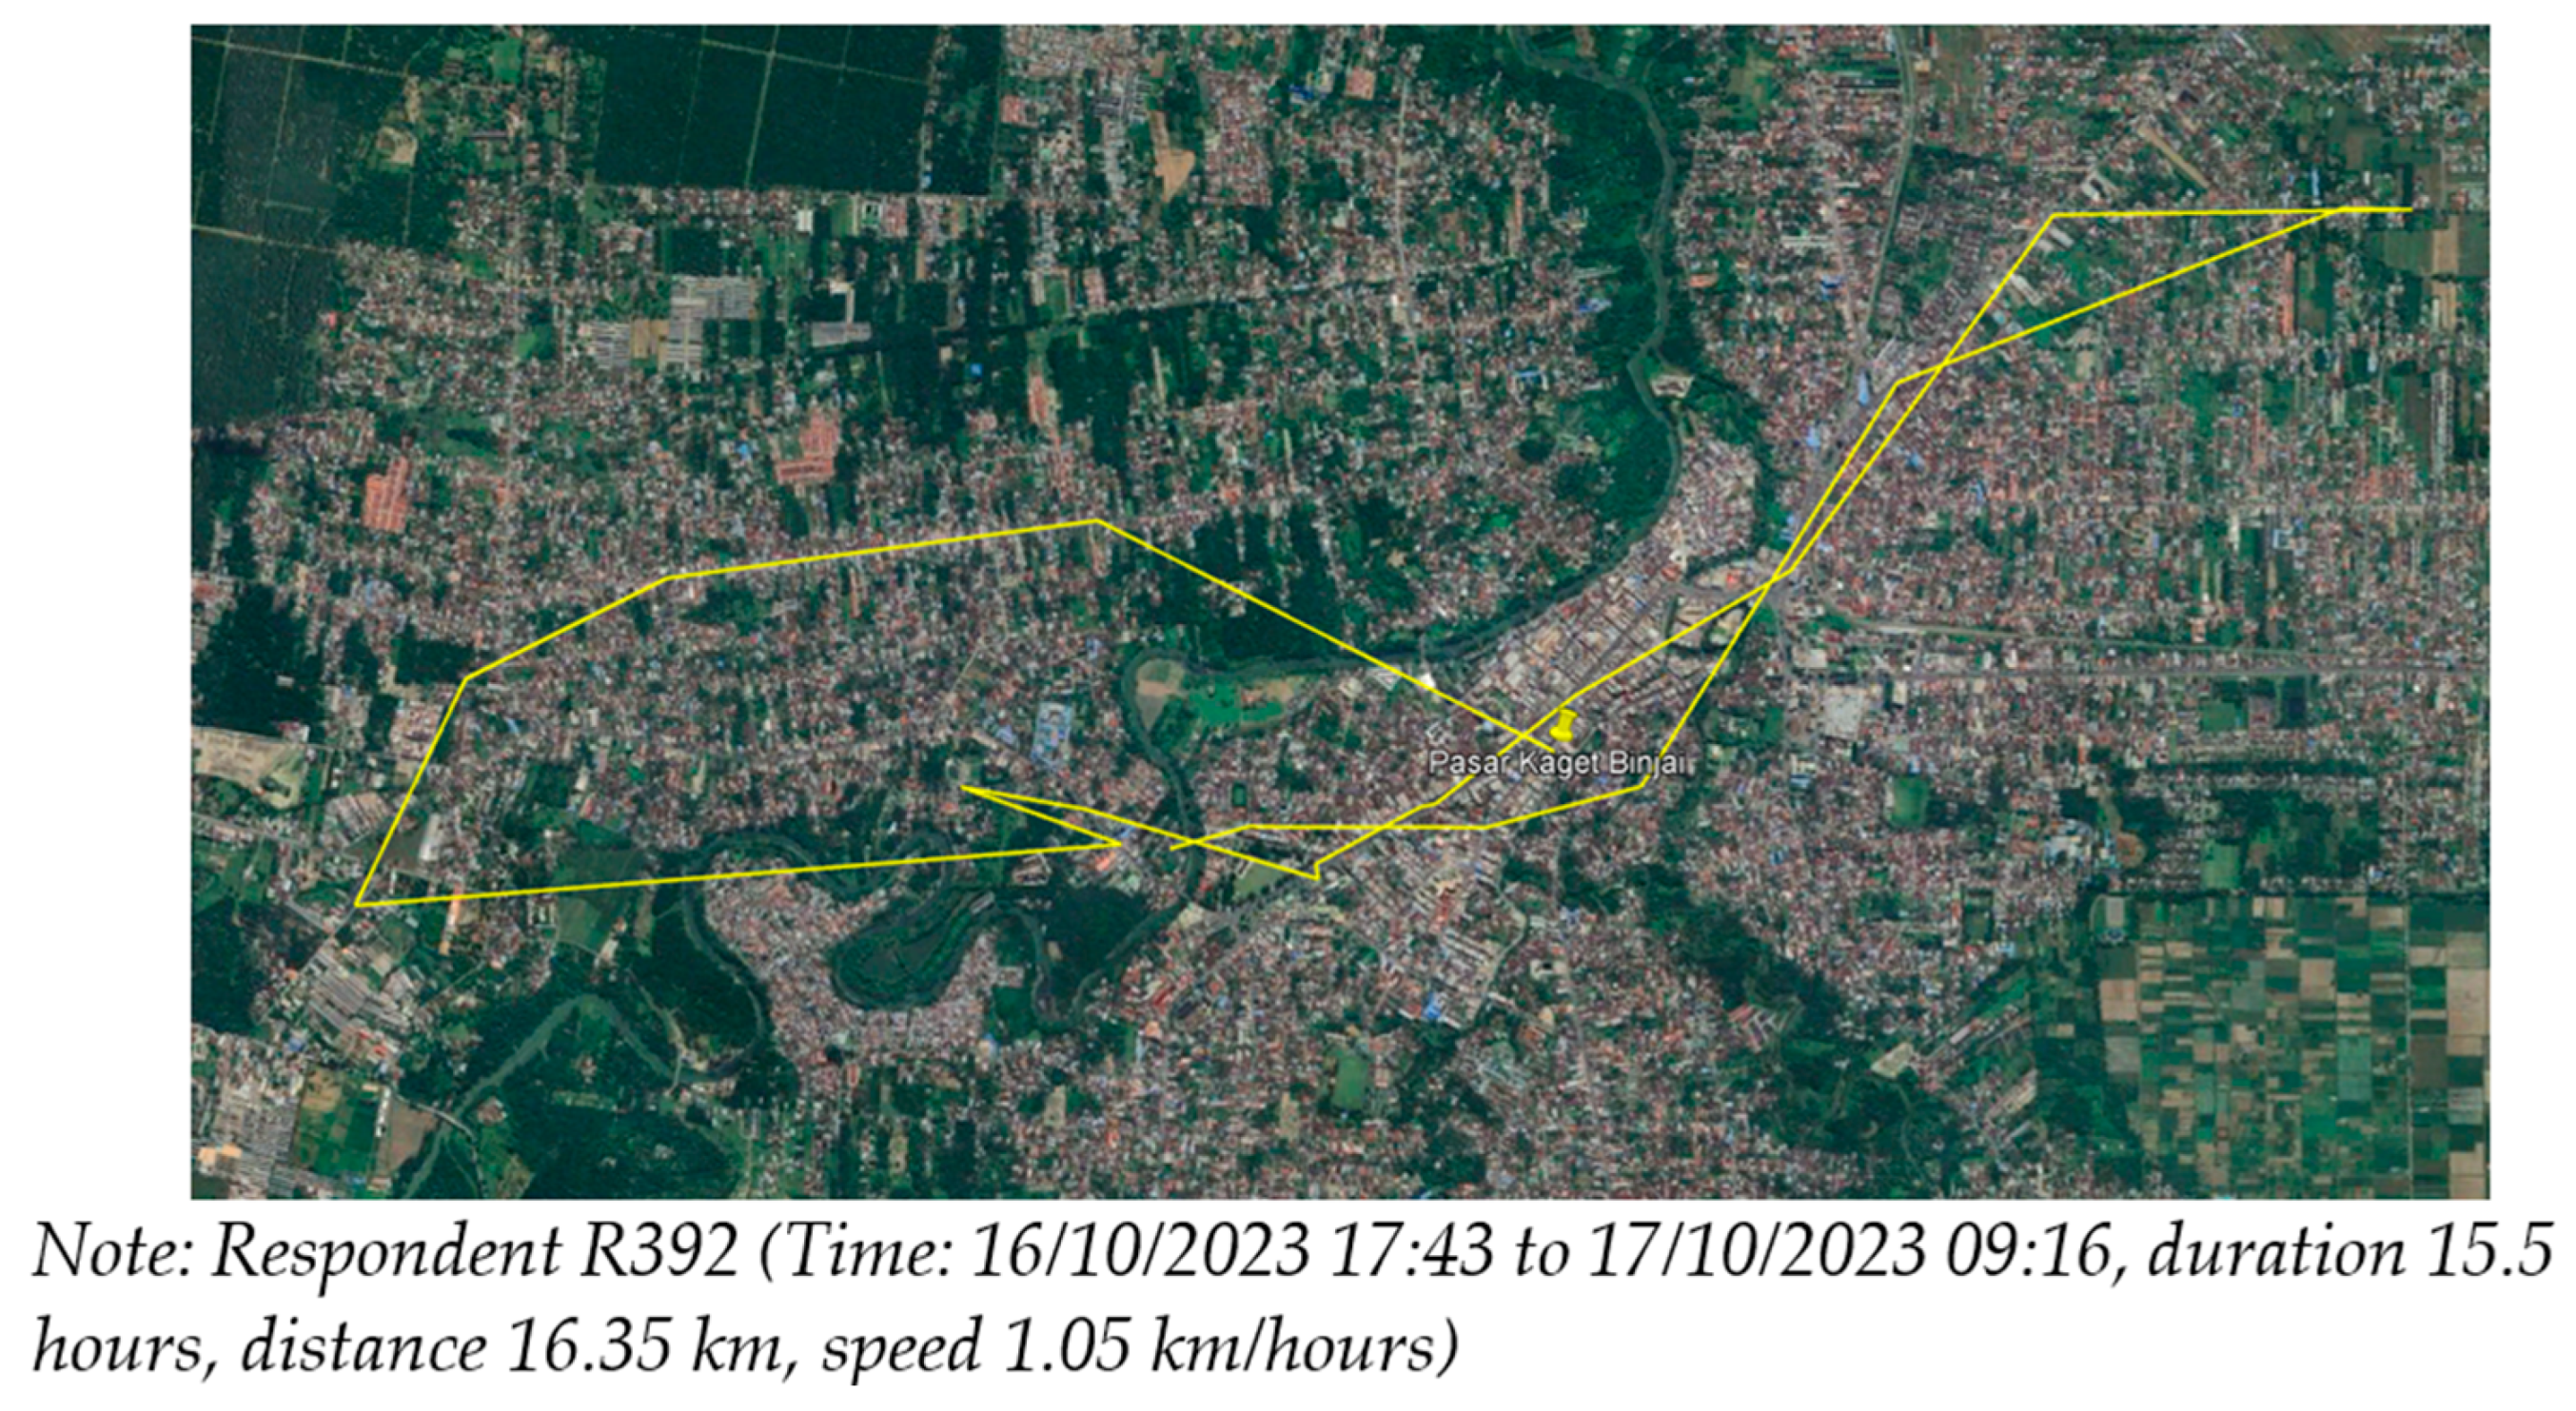
Because of these factors, raw KML data from GLH required additional cleaning. Examples include trips labelled solely as “moving”, with no assigned transport mode, and instances where trips were recorded despite the respondent remaining stationary. The latter issue was identifiable when data showed respondents moving at very low speeds in a pattern circulating around nearby points. Sometimes, data showed respondents returning to their usual starting point but being recorded as continuously moving around that point from night until morning. Such anomalies required resolution through academic assumptions and expert judgement. Previous studies have used predefined criteria for what is considered a node or place, depending on the context and scope of the study; for example, continuous movement in a 1 km radius can be considered a node. Figure 3 outlines the data cleaning steps in this study, including assumptions for determining travel modes based on average speed and distance patterns observed in the dataset. Trips labelled “movement” in between two trips with the same transport mode were labelled the same. For example, in a series of trips labelled motorcycle “movement”, a motorcycle was assumed to be fully made by motorcycle. The data cleaning process was followed by the extraction of demographic and travel-related variables for analysis.

3.2. Method for Analysis

Power BI application was used to transform the data from KML files into tabular format, and to extract the following information (see Table 1):
We then integrated the tabular data with the personal data collected through Form 1, which contained respondent characteristics. We analyzed this combined dataset using pivot tables to explore mobility patterns. Demographic data were essential for describing the travel behavior of different groups or clusters, such as the movement patterns of students on weekdays. The Power BI dashboard facilitated the visualization of heatmaps and movement patterns, enabling the overlay of travel routes for further analysis.

4. Results

4.1. Data

Before further discussing the data, it is necessary to disclose the comparison of the proportion of the sample size compared to the overall population proportion to limit generalization of results (See Table 2). The sample proportion for each area did not precisely reflect the population, and the sample size was only 0.009% of the population. The GLH data in this study serve as an additional insight regarding vehicle mode in each distance band, confirm general mobility patterns shown by the SUMP, and reduce bias from self-reported travel logs in traditional surveys.
The demography of respondents from Form 1 is shown in Table 3, where the proportion of male and female in the sample is balanced and resembles the proportion of the population. Most respondents were young and productive in the age range of 20–39 (78.6%) with a balanced distribution in terms of occupation between students, employees, self-employed, and entrepreneurs. People with disability accounted for 3.6% of the sample. The data on main travel purpose reflect the respondents’ occupation: 24% were for education, and the majority for work. Based on self-report inputs in Form 1 regarding the most dominant used vehicle for daily travel, most respondents answered motorcycle (45.2%), followed by public transportation (35%) (See Table 4).
Figure 4 provides a visual representation of a sample KML dataset, as viewed in both Google Earth and Power BI, illustrating the spatial and temporal dimensions of the travel data.

4.2. Analysis

The cross-tabular analysis indicates that trips for business and work purposes constituted the highest number of trips per person per day (See Table 5). In terms of transport modes, motorcycles were the most used vehicles, followed by private cars (See Table 6). Overall, motorcycles were the predominant mode of travel across all trip purposes (See Table 7).
Regarding travel distance by mode, Table 8 illustrates that each mode was used within specific distance intervals. Cars were most frequently used for distances of 5–10 km, although usage remained relatively consistent across intervals, even for journeys exceeding 20 km. In contrast, motorcycles were significantly more common for shorter distances of 0–2.5 km, with usage declining as distance increased.
People primarily used trains for long-distance travel, while they most often used buses for medium distances, particularly 5–10 km and 10–20 km. Cycling and walking were predominantly used for short distances of 0–2.5 km. Figure 5 and Figure 6 present examples of travel mode heatmaps from the Power BI dashboard, with red and yellow colors showing areas with the highest concentration of driving and cycling activity.

5. Discussion

By adopting the GLH as a tool for a mobility survey in Mebidang to provide an innovative data source, we gained insight regarding the implementation of the survey design and how it may be replicated in other places. In this section, we also discuss how GLH data can complement data from SUMP, and address how this study has handled privacy concerns and the issue of inclusive representation, as well as possible policy implication of this study.

5.1. Data Collection Challenges and Data Quality

Building on insights from previous studies, we recognize that while Google Timeline offers potential as a free and widely accessible tool, it also has notable limitations. Currently, the mobile app lacks a feature to export travel data directly, making it necessary to use a laptop or personal computer to download data via the desktop version. This additional step poses a challenge to data collection, as the complexity of the technical process contributes to low participation rates. This was evident in previous GLH surveys, and confirmed again during this study. This survey also reaffirms the technical dependencies reported in previous literature, with data accuracy influenced by factors such as the quality and settings of mobile phone GPS, internet connectivity, and the availability of surrounding Wi-Fi networks. The accuracy varies depending on the travel mode [27,28,30,32,34]. While this study did not directly examine accuracy, we assume the margin of error is consistent with that reported in earlier research.
In undertaking this mobility survey, two primary challenges were encountered:
a.
Use of two online forms: Using two online forms aimed to accommodate participants who took part but had not yet enabled location tracking. To link Form 1 and Form 2, respondents were required to use the same email address, a requirement communicated both in writing and by the facilitators. However, some respondents used different email addresses for the two forms. In certain instances, respondents were unwilling to use their primary Google account, did not have an existing account, or had forgotten their passwords. A lack of understanding of the step-by-step guide led some respondents to create a new account for each form.
The more steps involved, the greater the likelihood of error. Despite these risks, we adopted this approach to ensure the survey remained inclusive, accommodating participants with varying levels of technological literacy and those from vulnerable groups. Establishing trust with participants regarding the use of their personal travel information also posed challenges. We assisted each participant, setting up their Google location tracking and conducting a follow-up the following week. Despite the challenges in data collection, this approach yielded better results than the pilot survey, achieving a wider and more inclusive demographic spread, including travel data from vulnerable groups.
b.
Data anomalies: Some anomalies observed in this survey were consistent with those reported in previous studies, such as GPS drift and sudden location jumps spanning miles within seconds [26]. In this survey, we identified instances where, during idle periods at night, multiple locations were recorded with an average speed below 5 km/h (See Figure 7). We addressed these anomalies using a cleaning process, as illustrated in Figure 3. This process was like the approach described by Gillis et al. [35], which involved eliminating false starts, false stops, and trips exceeding 100 km in length.
We identified an additional error, not reported in previous publications: inaccuracies in location and time readings affected the algorithm used to predict travel modes. Table 9 below illustrates the number of trips categorized as “moving”, without assignment to any specific transport mode. To address this, we made assumptions to classify the travel mode, primarily based on speed and trip continuity (see Figure 3). For example, if a trip included four segments, with the first and last segments recorded as motorcycle trips and one middle segment labelled “moving”, we assumed the entire trip used a motorcycle.
The research team managed the data cleaning for the 420 collected datasets. While the data collection method could be refined to optimize the acquisition of data in the correct format, the accuracy of the spatial data remains a concern. This study still relied on a manually predefined definition of what is considered idle, and classified vehicle mode based observed patterns of speed and distance in the overall dataset to fill in the gaps. This stage was time consuming and relied heavily on analysts’ knowledge and capacity. Improvements could come from future Google Maps updates or from more advanced data processing techniques to systematically detect and correct anomalies. Machine learning and cluster analysis, such as conducted by Coppola et al. [22], can enhance data quality, as well as support predictions of trip purpose, trip mode, and differentiate between routine commute and incidental travels. An alternative approach is the use of a prompted recall (PR) method to enhance the accuracy of recorded data. This involves respondents reviewing their mobility data daily to verify its accuracy [34]. However, the feasibility of this method depends on the type of survey being conducted, as it requires a certain level of respondent understanding or additional facilitator support, which can be time-consuming and resource intensive.

5.2. Mobility Patterns

By comparing the data obtained in this survey to the Mebidang SUMP, we saw that the number of trips per day recorded in this GLH survey was higher than that reported in the SUMP, aligning with the findings of GLH survey by Gillis et al. [35]. The SUMP recorded an average of 2.5 trips per person per day whereas the average trip recorded in this survey was 3.6 trips per person per day. The higher trip count in this survey is attributed to its more detailed approach to data collection, which used digital location data rather than relying solely on respondents’ recall. For instance, in a conventional travel survey, a respondent may report travelling from home to work in the morning and back in the evening, resulting in two recorded trips. However, intermediate stops at locations such as a bookstore, petrol station, or a friend’s house are often omitted. If trips are defined solely as journeys to primary destinations, this approach may suffice. However, the Google-based survey used in this study does not distinguish between primary and secondary destinations, resulting in all stops being recorded as separate trips. On the other hand, GLH does not distinguish between private vehicles and taxi. The modal split of passenger kilometers in the SUMP was 42% for motorcycles, 4% motorcycle taxis, and 30% for private cars. This GLH survey showed the split of passenger kilometers was 61% for motorcycle, and 38% for cars, a higher number in both modes. In regards to public transport, the SUMP reported a 6% modal share, whereas this survey reported less than 1%.
Cross-tabulation analysis revealed higher trips per day per person among specific age groups (20–24) and for certain purposes—work and education. The survey also provides insights into average trip distances by mode, which can be further disaggregated by age group and trip purpose. These insights are valuable for planning interventions to reduce private vehicle use. The data capture spatial mobility patterns by vehicle type, age group, and trip purpose, as well as comparisons between weekday and weekend travel. This detailed dataset serves as complementary information that can be used in transportation modelling.
The GLH survey in Mebidang confirmed key mobility patterns along main arterial roads, as reported in the SUMP, while providing enhanced granularity on first- and last-mile mobility. The survey data highlight discrepancies between self-reported travel modes and those recorded by Google Maps. Table 10 shows that, based on self-reported data from Form 1, 35.09% of trips were reported as using a bus, whereas the GLH data shows that only 0.74% of trips were made using a bus. This discrepancy underscores the advantages of this method over conventional journey-mapping surveys.
As with previous GLH surveys, the main limitation of this study is the small sample size. The challenge in collecting KML data is especially due to requiring access to a desktop computer or laptop as well as having a mobile phone. In developing countries such as Indonesia, the technology adoption gap is wider, and many people have only mobile phones without access to desktop computers or laptops. Even though this survey collected more GLH data than most previous studies, the sample size is still significantly smaller compared to data collected for the SUMP, and less than 1% of the population size. Hence, this study is not meant to generalize mobility patterns at the metropolitan scale, but to provide data for deeper network analysis and travel. With a small sample size, GLH surveys can target a smaller survey area, or observe more detailed movements of certain respondents, based on age, occupation, or travel purpose. Table 11 below provides a summary of advantages and disadvantage of GLH data collection for large scale travel surveys.
In summary, this study builds upon previous literature regarding data collection from mobile phones, especially using GLH data. The survey conducted in this study is the first in Indonesia that we know of, and among the first conducted in developing countries. Therefore, it provides new insights regarding the potential and challenges to conduct similar surveys in developing countries. This study used simple analysis to acquire data on travel mode per distance band, which could be further processed using cluster analysis for deeper understanding of variance and similarities of variables in the dataset [22].

5.3. Privacy and Representation

Privacy and data protection are critical concerns in surveys using detailed travel data. Some participants declined to take part, citing complexity or data privacy concerns, while others created new Google accounts specifically for the survey. Although this survey did not quantify these concerns, prior studies, such as that by Hystad et al. [25], found that 34% of non-participants cited data privacy as their reason. Servizi et al. [24] emphasized the importance of standardized privacy measures to protect respondents and foster trust, given the utility of detailed travel data for analysis.
Compared to similar studies, this survey adopted enhanced privacy protections. Typical GLH surveys require respondents to download their entire Google Takeout history as JSON files, which are then uploaded to a database with usage declarations [26,27,29,31]. Even when only a week of data are permitted for use, months or years of history are often inadvertently shared. This survey required only seven days’ worth of KML data, which did not need to be consecutive and could be sampled from any month. This approach balanced data security with respondent flexibility. Similarly, studies by Li et al. [33] and Cools et al. [30] employed a restricted approach using KML data and demographic inputs.
We agree with Sieg et al. [36] that high standards of privacy protection must be maintained, including withholding raw data and employing visualization techniques like macro-scale maps and heatmaps to obscure identifiable information. Guidelines for privacy operations in smartphone-based surveys, such as those compiled by Pennekamp et al. [37], offer useful frameworks for implementing these measures.
Respondent representation is also a concern with a survey using GLH or other smartphone-based surveys. Previous publications have explained that recruitment is by random sampling, sending letters and emails to previous census respondents. On the other hand, there were also small-scale surveys such as that by Hystad et al. [25], which conducted a survey in health research, by sampling only people who participated in previous research. Random sampling, often used in larger studies, cannot capture less educated or technologically skilled populations, exacerbating representation gaps, particularly in regions with significant inequalities like Indonesia. This issue was clear in our pilot survey, where university students were overrepresented. Maruyama et al. [38] noted that younger respondents are more motivated by incentives, whereas older individuals are less influenced by such measures. To achieve balanced demographic representation, random sampling strategies must incorporate targeted outreach and tailored recruitment approaches.

5.4. Policy Implication

Detailed travel data from GLH can support evidence-based infrastructure development and public transit optimization. For example, Figure 5 provides information on driving patterns around bus corridors, which can be used to decide locations for park and ride facilities and policy formulation on electronic road pricing (ERP), whereas Figure 6 can support policies for better cycling infrastructure provision. Selected GLH data on education trips can be used to better facilitate safe pedestrian infrastructure and public transportation. Quantitative data mined from GLH, which are not available in traditional travel surveys, are the distance band for each transport mode. For instance, Table 8 shows that motorcycles were mostly used for trip legs up to 10 km, whereas cycling was mostly used for travel up to 2.5 km. This can inform policymakers to improve cycling infrastructure 2.5 km around dense housing areas to strengthen active mobility, and make intervention to reduce reliance on motorcycles for travel up to 10 km, especially for daily trips such as for education.

6. Conclusions

This study demonstrates the potential of GLH as an innovative and cost-effective tool for mobility surveys. By using the widely available Google Maps application, this method eliminates the need for bespoke survey software and additional downloads, making it more accessible for participants while reducing costs.
However, GLH presents technical challenges that require attention. These include inaccuracies in identifying travel modes and false short trips caused by Wi-Fi and telecommunications network interference [27,28,29,39]. While these issues were manageable for this survey’s dataset of 420 respondents, larger datasets may require automated cleaning processes to maintain data quality. Developing a mobile application capable of direct data export could streamline the reliance on two devices—a smartphone for data collection and a computer for exporting KML files. Privacy concerns remain critical; strong measures to protect confidentiality and assure participants of data security are essential to encourage participation and ensure reliable data collection.
This survey showed GLH’s ability to provide deeper insights into mobility patterns compared to conventional surveys conducted in Mebidang. By recording detailed trips tied to respondent characteristics and travel modes, GLH offers rich data that can inform transport planning and analysis. For instance, GLH data revealed discrepancies between public transport trips self-reported by participants and those recorded by the system, highlighting its potential to reduce reporting bias. GLH data supports transport modelling by identifying linked spatial mobility patterns and travel modes at different distance bands, which can better inform policies, regulations, and infrastructure development.
While this study contributes valuable insights, future research should explore GLH data further through advanced data science techniques, such as demographic modelling and automated processing. Changes in Google’s data storage policies should also be monitored, as local storage and direct data export capabilities could enhance practicality.
In conclusion, GLH offers a promising, cost-effective solution for mobility research, with significant potential to advance urban planning, emissions analysis, and sustainable transport strategies. Continued development to address its technical and privacy challenges will further strengthen its utility and application.

Author Contributions

Conceptualization, A.W.; methodology, M.R.N. and D.P.N.; software, A.W. and J.P.H.; validation, M.R.N. and J.P.H.; formal analysis, M.R.N. and D.P.N.; data curation, M.R.N. and J.P.H.; writing—original draft preparation, A.W., M.R.N. and S.C.; writing—review and editing, A.W., M.R.N. and G.H.; visualization, J.P.H.; supervision, A.W. All authors have read and agreed to the published version of the manuscript.

Funding

This research was funded by UK FCDO Project Number 301495, through UKPACT project.

Institutional Review Board Statement

The study was conducted in accordance with the Declaration of Helsinki, and approved by the Institutional Review Board (or Ethics Committee) of University of York on 8 November 2022, project code: DEGERC/Res/11082022/1.

Informed Consent Statement

Informed consent was obtained from all subjects involved in the study.

Data Availability Statement

Due to confidentiality of personal travel data, only anonymous and processed data are shared. These data can be accessed at http://ugm.id/glhdatamebidang (accessed on 1 November 2023).

Acknowledgments

This research was sponsored by UK FCDO through UKPACT Future Cities Project, a consortium comprising University of York, Centre for Transportation and Logistics Studies, Universitas Gadjah Mada and Clean Air Asia (CAA). The survey facilitators were provided and managed by a local university, Universitas Sumatera Utara.

Conflicts of Interest

The authors declare no conflicts of interest. The funders had no role in the design of the study; in the collection, analyses, or interpretation of data; in the writing of the manuscript; or in the decision to publish the results.

References

  1. Khazini, L.; Kalajahi, M.J.; Rashidi, Y.; Ghomi, S.M.M.M. Real-world and bottom-up methodology for emission inventory development and scenario design in medium-sized cities. J. Environ. Sci. 2022, 127, 114–132. [Google Scholar] [CrossRef] [PubMed]
  2. Brand, C.; Anable, J.; Morton, C. Lifestyle, efficiency and limits: Modelling transport energy and emissions using a socio-technical approach. Energy Effic. 2019, 12, 187–207. [Google Scholar] [CrossRef]
  3. Zhang, S.; Lei, L.; Sheng, M.; Song, H.; Li, L.; Guo, K.; Ma, C.; Liu, L.; Zeng, Z. Evaluating Anthropogenic CO2 Bottom-Up Emission Inventories Using Satellite Observations from GOSAT and OCO-2. Remote Sens. 2022, 14, 5024. [Google Scholar] [CrossRef]
  4. Ibarra-Espinosa, S.; Rehbein, A.; Dias de Freitas, E.; Martins, L.; Andrade, M.d.F.; Landulfo, E. Changes in a Bottom-Up Vehicular Emissions Inventory and Its Impact on Air Pollution During COVID-19 Lockdown in São Paulo, Brazil. Front. Sustain. Cities 2022, 4, 883112. [Google Scholar] [CrossRef]
  5. Singh, N.; Mishra, T.; Banerjee, R. Emission inventory for road transport in India in 2020: Framework and post facto policy impact assessment. Environ. Sci. Pollut. Res. 2022, 29, 20844–20863. [Google Scholar] [CrossRef] [PubMed]
  6. Lopes, D.; Rosa, M.; Graça, D.; Rafael, S.; Ferreira, J.; Lopes, M. Enhancing multi-mode transport emission inventories: Combining open-source data with traditional approaches. Urban Clim. 2024, 57, 102097. [Google Scholar] [CrossRef]
  7. Institute for Transportation and Development Policy. Calculating Greenhouse Gas Benefits of Global Environment Facility Transportation Projects. 2016. Available online: http://documents.worldbank.org/curated/en/585751471511610764/Manual-for-calculating-greenhouse-gas-benefits-of-global-environment-facility-transportation-projects (accessed on 1 November 2023).
  8. Elkafoury, A.; Negm, A.M.; Bady, M.; Aly, M.H.F. Review of transport emission modeling and monitoring in urban areas—Challenge for developing countries. In Proceedings of the 2014 International Conference on Advanced Logistics and Transport (ICALT), Hammamet, Tunisia, 1–3 May 2014; pp. 23–28. [Google Scholar] [CrossRef]
  9. Linton, C.; Grant-Muller, S.; Gale, W.F. Approaches and Techniques for Modelling CO2 Emissions from Road Transport. Transp. Rev. 2015, 35, 533–553. [Google Scholar] [CrossRef]
  10. Svaboe, G.B.A.; Tørset, T.; Lohne, J. A comparative study of national travel surveys in six European countries. Transp. Plan. Technol. 2024, 47, 400–418. [Google Scholar] [CrossRef]
  11. Li, J.; Li, W.; Lian, G. Urban Resident Travel Survey Method Based on Cellular Signaling Data. ISPRS Int. J. Geo-Inf. 2023, 12, 304. [Google Scholar] [CrossRef]
  12. Sammer, G.; Gruber, C.; Röschel, G.; Stark, J.; Herry, M.; Tomschy, R. Underreported trips, a non-negligible empirical effect of traditional survey methods—A new weighting procedure of data enriching to overcome this bias. Transp. Res. Procedia 2024, 76, 183–195. [Google Scholar] [CrossRef]
  13. Qiang, W.W.; Wen, T.; Luo, H.; Huang, B.; Lee, H.F. Does a more compact urban center layout matter in reducing household carbon emissions? Evidence from Chinese cities. Land Use Policy 2024, 146, 107320. [Google Scholar] [CrossRef]
  14. Haffner, M.; Bonin, O.; Vuidel, G. Modelling the impact of urban form on daily mobility energy consumption using archetypal cities. Environ. Plan. B Urban Anal. City Sci. 2024, 51, 870–888. [Google Scholar] [CrossRef]
  15. Qiao, S.; Huang, G.; Yeh, A.G.-O. Mobility as a Service and urban infrastructure: From concept to practice. Trans. Urban Data Sci. Technol. 2022, 1, 16–36. [Google Scholar] [CrossRef]
  16. Kafi, A.; Zakaria, I.H.; Indriya Himawan, A.F.; Hamid, S.R.; Chuah, L.F.; Rozar, N.M.; Razik, M.A.; Ramasamy, R. A conceptual framework for understanding behavioral factors in public transport mode choice in Southeast Asia. J. Infrastruct. Policy Dev. 2024, 8, 1–23. [Google Scholar] [CrossRef]
  17. Stoškus, L.; Gauče, K.; Chrzanowski, P.; Wołek, M.W.; Ancygier, A.; Most, S. Behavioural Changes and Transport Sector Decarbonisation; Climate Analytics: Berlin, Germany, 2023. [Google Scholar]
  18. Nurminen, V.; Rossi, S.; Rinne, T.; Kyttä, M. How has digital participatory mapping influenced urban planning: Views from nine planning cases from Finland. Comput. Environ. Urban Syst. 2024, 112, 102152. [Google Scholar] [CrossRef]
  19. Sammer, G.; Chu, A. Workshop Synthesis: New directions in experimental design. Transp. Res. Procedia 2018, 32, 448–453. [Google Scholar] [CrossRef]
  20. Sammer, G.; Gruber, C.; Roeschel, G.; Tomschy, R.; Herry, M. The dilemma of systematic underreporting of travel behavior when conducting travel diary surveys—A meta-analysis and methodological considerations to solve the problem. Transp. Res. Procedia 2018, 32, 649–658. [Google Scholar] [CrossRef]
  21. Willumsen, L. Use of Big Data in Transport Modelling Discussion Paper. Int. Transp. Forum Discuss. Pap. 2021. Available online: https://www.oecd.org/content/dam/oecd/en/publications/reports/2021/01/use-of-big-data-in-transport-modelling_2cb57797/86a128c7-en.pdf (accessed on 1 November 2023).
  22. Coppola, P.; Silvestri, F.; De Fabiis, F.; Barbierato, L. Disaggregate travel demand analysis using big data sources: Unsupervised learning methods for data-driven trip purpose estimation. Transp. Res. Procedia 2025, 82, 1824–1838. [Google Scholar] [CrossRef]
  23. Akhtar, M.; Moridpour, S. A Review of Traffic Congestion Prediction Using Artificial Intelligence. J. Adv. Transp. 2021, 2021, 8878011. [Google Scholar] [CrossRef]
  24. Servizi, V.; Pereira, F.C.; Anderson, M.K.; Nielsen, O.A. Transport behavior-mining from smartphones: A review. Eur. Transp. Res. Rev. 2021, 13, 57. [Google Scholar] [CrossRef]
  25. Hystad, P.; Amram, O.; Oje, F.; Larkin, A.; Boakye, K.; Avery, A.; Gebremedhin, A.; Duncan, G. Bring Your Own Location Data: Use of Google Smartphone Location History Data for Environmental Health Research. Environ. Health Perspect. 2022, 130, 1–9. [Google Scholar] [CrossRef] [PubMed]
  26. Walker, V.; Black, D.; Belal, S.; Spurlock, C.A. Google Location History Data from the WholeTraveler Transportation Behavior Study Survey. 2020. Available online: https://drive.google.com/file/d/1frFRTJ1k_MNNJyY3JFfvkbFzXzASNIke/view?usp=sharing (accessed on 1 November 2023).
  27. Macarulla Rodriguez, A.; Tiberius, C.; van Bree, R.; Geradts, Z. Google timeline accuracy assessment and error prediction. Forensic Sci. Res. 2018, 3, 240–255. [Google Scholar] [CrossRef] [PubMed]
  28. Yu, X.; Stuart, A.L.; Liu, Y.; Ivey, C.E.; Russell, A.G.; Kan, H.; Henneman, L.R.F.; Sarnat, S.E.; Hasan, S.; Sadmani, A.; et al. On the accuracy and potential of Google Maps location history data to characterize individual mobility for air pollution health studies. Environ. Pollut. 2019, 252, 924–930. [Google Scholar] [CrossRef] [PubMed]
  29. Parady, G.; Suzuki, K.; Oyama, Y.; Chikaraishi, M. The effectiveness of using Google Maps Location History data to detect joint activities in social networks. Third Bridg. Transp. Res. Conf. 2021. [Google Scholar] [CrossRef]
  30. Cools, D.; McCallum, S.C.; Rainham, D.; Taylor, N.; Patterson, Z. Understanding google location history as a tool for travel diary data acquisition. Transp. Res. Rec. 2021, 2675, 238–251. [Google Scholar] [CrossRef]
  31. Parady, G.; Suzuki, K.; Oyama, Y.; Chikaraishi, M. Activity detection with google maps location history data: Factors affecting joint activity detection probability and its potential application on real social networks. Travel Behav. Soc. 2023, 30, 344–357. [Google Scholar] [CrossRef]
  32. Ruktanonchai, N.W.; Ruktanonchai, C.W.; Floyd, J.R.; Tatem, A.J. Using Google Location History data to quantify fine-scale human mobility. Int. J. Health Geogr. 2018, 17, 1–14. [Google Scholar] [CrossRef]
  33. Li, M.; Wang, K.; Liu, Y.; Habib, K.N. Deriving weeklong activity-travel dairy from Google Location History: Survey tool development and a field test in Toronto. Transportation 2024. [Google Scholar] [CrossRef]
  34. Xiao, G.; Cheng, Q.; Zhang, C. Detecting travel modes from smartphone-based travel surveys with continuous hidden Markov models. Int. J. Distrib. Sens. Networks 2019, 15. [Google Scholar] [CrossRef]
  35. Gillis, D.; Lopez, A.J.; Gautama, S. An Evaluation of Smartphone Tracking for Travel Behavior Studies. ISPRS Int. J. Geo-Inf. 2023, 12, 335. [Google Scholar] [CrossRef]
  36. Sieg, L.; Gibbs, H.; Gibin, M.; Cheshire, J. Ethical Challenges Arising from the Mapping of Mobile Phone Location Data. Cartogr. J. 2024, 1–14. [Google Scholar] [CrossRef]
  37. Pennekamp, J.; Henze, M.; Wehrle, K. A survey on the evolution of privacy enforcement on smartphones and the road ahead. Pervasive Mob. Comput. 2017, 42, 58–76. [Google Scholar] [CrossRef]
  38. Maruyama, T.; Sato, Y.; Nohara, K.; Imura, S. Increasing smartphone-based travel survey participants. Transp. Res. Procedia 2015, 11, 280–288. [Google Scholar] [CrossRef]
  39. Linquist, M.; Galpern, P. Crowdsourcing (In) voluntary citizen geospatial data from google android smartphones. J. Digit. Landsc. Archit. 2016, 2016, 263–272. [Google Scholar] [CrossRef]
Figure 1. Map of Mebidang.
Futuretransp 05 00050 g001
Figure 2. Data cleaning process phase 1.
Futuretransp 05 00050 g002
Figure 3. Data cleaning process phase 2.
Futuretransp 05 00050 g003
Figure 4. (a) KML opened in Google Earth; (b) KML opened in Power BI.
Futuretransp 05 00050 g004
Figure 5. Heatmap of driving mode mobility.
Futuretransp 05 00050 g005
Figure 6. Heatmap of cycling mode mobility.
Futuretransp 05 00050 g006
Figure 7. Example of location detection anomaly.
Futuretransp 05 00050 g007
Table 1. Variables extracted from Google Timeline KML data.
VariablesMeasurement
PlaceNode—coordinates
Travel distanceLine length between two coordinates
Travel timeTime stamps difference between two coordinates
Transport modePredictions based on Google Map algorithm
Table 2. Sample size and proportion in comparison with the population.
AreaPopulation SizePopulation ProportionSample SizeSample ProportionSample Size/
Population Size
Medan2,486,28351%26262%0.011%
Binjai307,1706%6215%0.020%
Deli Serdang2,048,48042%9623%0.005%
TOTAL4,841,933100%420100%0.009%
Table 3. Respondent characteristics.
SexMale53.8%
Female46.2%
Age≤195.2%
20–2427.6%
25–2921.9%
30–3418.6%
35–3910.5%
40–448.6%
45–494.0%
50–541.7%
55–591.7%
≥600.2%
DisabilityYes3.6%
No96.4%
OccupationStudent24.3%
Employee17.1%
Self-employed/freelance17.9%
Entrepreneur20.2%
Last EducationSenior high school50.5%
Diploma7.6%
Bachelor or higher36.7%
Table 4. Travel profile.
Travel PurposeWork66%
Education24%
Business4%
Others6%
Daily modeMotorcycles45.2%
Public transport35%
Car9%
Others10.8%
Table 5. Number of trips per day per person based on trip purpose.
Trip PurposeNumber of Trips per Day per Person
All DayWeekdaysWeekends
Work4.264.264.26
Business5.014.656.00
Education3.283.343.09
Shopping2.682.553.00
Holiday/social activity4.003.864.32
Others 2.642.403.25
Table 6. Number of trips per day per person based on trip mode.
Trip ModeNumber of Trips per Day per Person
All DayWeekdaysWeekends
Driving2.712.642.88
Motorcycling3.373.383.36
On a bus1.301.351.00
On a train1.111.171.00
Cycling1.411.172.33
Walking1.181.171.27
Table 7. Trip purpose and travel mode.
Trip PurposeModeTotal
DrivingMotorcyclingBusTrainCyclingWalking
Work18.59%52.23%0.20%0.02%0.33%0.35%71.73%
Business1.35%2.76%0.00%0.02%0.00%0.01%4.15%
Education4.19%13.72%0.47%0.06%0.05%0.39%18.89%
Shopping0.37%1.56%0.05%0.00%0.00%0.01%2.00%
Holiday/social activity1.00%1.82%0.01%0.00%0.03%0.01%2.87%
Others 0.22%0.15%0.00%0.00%0.00%0.00%0.37%
Table 8. Trip distance by travel mode.
Trip ModeDistanceTotal
0–2.5 km2.5–5 km5–10 km10–20 km>20 km
Driving5.29%5.27%5.79%4.70%4.67%25.72%
Motorcycling24.89%15.97%14.81%10.46%6.11%72.25%
Bus0.09%0.11%0.25%0.23%0.05%0.74%
Train0.00%0.00%0.01%0.00%0.09%0.10%
Cycling0.17%0.09%0.05%0.08%0.02%0.41%
Walking0.72%0.02%0.03%0.01%0.00%0.78%
Table 9. Anomaly in Google Maps transport mode prediction.
Number of Trips
Before Data Cleaning
%Number of Trips
After Data Cleaning
%
Driving25.49%Driving25.72%
Motorcycling71.42%Motorcycling72.25%
On a bus0.74%On a bus0.74%
On a train0.10%On a train0.10%
Cycling0.41%Cycling0.41%
Walking0.78%Walking0.78%
Moving1.07%
Table 10. Comparison of self-reported and recorded transport mode.
Self-RecordedTotalGLH-RecordedTotal
Private car8.43%Driving25.72%
Taxi (including online taxi)0.71%
Four-wheeler ridesharing2.41%
Motorcycle44.55%Motorcycling72.25%
Motorcycle taxi (including online motorcycle taxi)4.59%
Two-wheeler ridesharing 1.56%
Three-wheeler motorcycle rickshaw0.57%
On a bus35.09%On a bus0.74%
On a train0.95%On a train0.10%
Cycling0.14%Cycling0.41%
Walking0.99%Walking0.78%
Table 11. Advantages and disadvantages of GLH data collection in large-scale survey.
AdvantagesDisadvantages
  • Digital recording and mode coding: Data were recorded digitally from the outset and coded with transport modes, ensuring objective and accurate information on journey routes and modes of transport.
  • Temporal specificity: Specific dates for recorded journeys can be requested, enabling comparisons between weekday and weekend travel or analysis of the impact of events (e.g., heavy rainfall causing surface water flooding or infrastructure changes).
  • Large data volumes: The method allows for the collection of substantial quantities of data, supporting statistical analyses such as modal split assessments (by demographic groups), route popularity studies, and hotspot mapping.
  • Editable travel logs: Missing travel logs can be corrected within the location history record.
  • Participant recruitment: Achieving significant numbers of participants can be challenging without offering incentives.
  • Technical barriers: Uploading timeline data can be difficult for participants, potentially leading to gaps in the data. This limitation can be mitigated by providing step-by-step videos, written guidance, and surveyor assistance.
  • Digital exclusion: Marginalized groups without access to smartphones may be underrepresented in the dataset.
  • Trust issues: Participants must trust the process to share their individual mobility patterns, which can deter some individuals from taking part.
  • Data processing complexity: Efficiently processing large datasets requires programming skills to fully leverage timeline histories for analysis.
Disclaimer/Publisher’s Note: The statements, opinions and data contained in all publications are solely those of the individual author(s) and contributor(s) and not of MDPI and/or the editor(s). MDPI and/or the editor(s) disclaim responsibility for any injury to people or property resulting from any ideas, methods, instructions or products referred to in the content.

