Abstract
This study evaluates the impact of light-emitting diode (LED) illuminated signs, known as active road signs, on road safety at urban intersections. Transportation safety specialists emphasize the importance of visibility and placement of signage. LED signs are increasingly deployed at accident-prone locations to improve safety and regulate traffic. This study focuses on stop-controlled intersections (SCIs) in Montréal, Québec, to propose a new backlit sign for evaluation. An unbiased experiment utilizing multinomial logistic regression (MNL) was designed to compare drivers’ reactions to different signage. Microscopic models based on observed turning movement counters (TMCs) were calibrated for conflict estimation using a genetic algorithm (GA). Generalized linear models (GLMs) estimated accident and conflict frequencies under different treatment scenarios. The results showed significant conflict reductions at intersections with LED-backlit signs (BLSs), including 65.5% at night and 46.8% in daylight. Pedestrian crossing conflicts decreased by 55.6% and 27.8%. This study introduces an evaluation framework that integrates driver compliance behavior into simulation and crash modeling to assess a newly designed BLS treatment. It provides a framework for assessing safety treatments in contexts where crash data are limited. Findings offer insights for improving SCIs and enhancing transportation safety using LED stop signs.
1. Introduction
Sustainable road and highway safety preventive systems, which are considered as a challenge for transportation professionals, should be developed by continuous improvement efforts. Intersections, as critical road facilities, are identified as the most vulnerable infrastructure, accounting for 45% of total accidents [1]. Night-time accidents account for 55% of all the crashes, although only a quarter of driving occurs at night, representing a significant safety concern [2]. Stop-controlled intersections exhibit the highest rates of fatal and serious injuries compared to other crossing types with different control systems [2].
Some studies found that approximately 21% of accidents at stop-controlled intersections (SCIs) are attributed to the environment surrounding the driver, with inadequate or obstructed signs being frequently cited contributing factors [1,3]. The severity of the situation becomes evident considering that 8% of all the traffic fatalities and 11% of total accidents occur at SCIs. Over a decade (2008–2017), more than 1700 individuals lost their lives at these facilities in Canada [4]. Thus, it can be concluded that the SCI environment at night presents a challenging scenario for many drivers to navigate, leading to traffic injuries and fatalities. Transportation agencies propose the use of LED stop signs in areas with elevated risk to eliminate this obstacle [5]. Among various visibility enhancements, LED flashers and retroreflective sheeting have been commonly used to improve stop sign conspicuity. However, LED-backlit stop signs (BLSs) differ in that they integrate illumination within the sign face itself, directly enhancing legibility under low-light conditions and in adverse weather. While retroreflective signs rely on external lighting (e.g., headlights), and flashers serve more as attention cues, BLSs provide continuous visibility of the regulatory message. Despite their increasing use in several Canadian cities, including Montréal, empirical evaluation of BLS effectiveness remains limited. This study focuses on BLSs to address that gap and isolate their impact on driver behavior and safety outcomes relative to conventional and LED-outlined stop signs.
According to the strategic highway safety plans (SHSPs), the performance of highway safety should be studied for new safety component or treatment [6]. Few studies have been conducted on the safety performance of new regulatory signs without relying on accident records and focusing on surrogate measures of safety (SMoS) using other observable traffic events. Accidents are rare events and this modeling and assessment approach offers the advantage of reviewing traffic safety impacts within a shorter timeframe by leveraging computing power to simulate real-world traffic conditions. In addition, historical data limitations in accuracy and availability have resulted in exploring SMoS [7,8]. The length of time and magnitude of changes necessary for the significant results is regarded as another challenge identified in historical accident for before-after studies [9].
Despite growing interest in active signage systems, few studies have evaluated the safety effectiveness of LED-backlit stop signs using both behavioral compliance data and surrogate safety measures. Existing research has primarily focused on historical crash data or isolated behavioral observations, often overlooking the integration of driver reactions into predictive safety models. Moreover, the combined use of field-collected compliance behavior, calibrated microsimulation, and statistical modeling to assess a newly developed BLS treatment remains largely unexplored. This study addresses this research gap by developing and validating a proactive safety evaluation framework that incorporates real-world driver compliance into crash prediction and conflict analysis.
The objective of this study is to assess the safety performance of a newly developed LED-BLS at urban stop-controlled intersections. Specifically, the study aims to: (1) analyze driver behavior in response to different sign types under varying ambient light conditions, (2) evaluate compliance-based surrogate safety measures, such as TTC and PET, using microsimulation models, and (3) comparing the predictive performance of conflict-based and volume-based crash models, with and without behavioral data. By integrating field data, simulation, and statistical modeling, the study offers a framework for assessing new traffic treatments where long-term crash data may not yet be available and receive limited attention [10].
2. Related Works
The importance of proper signage has long been recognized in transportation safety literature, yet it is often underestimated during day-to-day roadway operation, particularly across urban and interurban environments. Gkyrtis and Pomoni [11] emphasized that signage and lighting improvements are among the most effective and feasible road safety interventions when geometric redesign is not possible. Similarly, Fiolić et al. [12] found that high-quality road markings and signage significantly improve driver behavior and reduce mental workload, especially under night-time conditions. In a simulator-based study, Kunnah and Hassan [13] showed that inadequate signage and lighting at stop-controlled intersections negatively impact surrogate safety measures such as TTC and PET. These findings collectively reinforce the study’s focus on evaluating LED-backlit signage as a behavior-informed safety treatment.
Traffic signs, regulated by the Federal Highway Administration (FHWA) and adapted by authorities around the world, serve to control, warn, and regulate traffic. For instance, several guidelines enable traffic engineers to estimate safety distance based on sign properties and posted speed [5,14,15]. The traffic signs are among the measures to reduce accident frequency and severity [16]. Some researchers measured signage performance criteria such as time intervals for drivers to detect, read, and respond to roadside signs [17,18,19]. Various factors influence drivers’ perception and reactions to signs such as lighting, awareness, sign quality, etc. [20]. Transportation professionals seek to incorporate these variables in their design to ensure effective communication from signage to drivers under different conditions. Many studies have been conducted on challenges related to interpreting signs at night or under adverse weather [21,22], revealing that low-contrast, ambiguity, visual noise, clutter, and the complexity of signs contribute to comprehension issues [21,23]. Transportation professionals proposed the use of new materials such as LED units to improve sign visibility [5], as well as to enhance safety and to reduce accidents [24]. Some researchers assessed driver behavior with different sign materials. Based on the results, embedded LED signs reduced non-stop and blow-through traffic by 28.9% and 52.9%, respectively [8]. In addition, an accident reduction of 40% was reported after upgrading signs with flashing lights, although safety benefits were inconclusive due to limitations such as the lack of direct data on driver alertness and awareness, making it unclear whether the observed reductions were directly caused by the flashers [25]. Despite these promising outcomes, many of the earlier studies relied solely on crash data or aggregated behavior metrics without exploring the nuanced effects of sign type, lighting conditions, or driver-level reactions. Moreover, studies often treat active signage as a single category, not distinguishing between flasher-based systems and embedded LED or backlit configurations. This lack of disaggregation limits the understanding of how each treatment performs under different contexts—an issue this study addresses by isolating LED-backlit signs and evaluating their effectiveness through behavioral modeling and simulation.
A more recent study in North Carolina evaluated overhead flashing beacons at rural intersections, reporting an average of 12% decrease in accidents [26]. The study used 34 SCIs on two-lane roads with no turn lanes and two-way stop control. The authors used the empirical Bayes (EB) method in the before-after study, incorporating using at least three years of post-installation accident data and average daily traffic (ADT). However, the agency deemed the overall reduction modest due to the rarity of accidents and treatment costs [27]. The study did not examine drivers’ behavior with respect to the signs. Performance of overhead and pole-mounted flashing red beacons was investigated for 100 multi-way SCI in North and South Carolina, representing reductions in angle (13.3 ± 4.6%) and injury accidents (10.2 ± 4.9%) [28]. Pole-mounted beacons exhibited higher reductions (58.2 ± 32.6%) than overhead ones (11.9 ± 10.8%). Unlike the previous report, the agency cautiously recommended active signage for rural areas, despite sample size limitations.
Some other studies evaluated the effect of flashing LED signs on drivers’ behavior and revealed an increased in compliance and roll-through maneuvers [29,30,31,32,33]. The roll-through maneuver increased from 13% to 24% after installing the LED sign [33]. The actuated LED warning sign was tested on stop-signs, as well as on speed alert [34] and sharp curve with chevron [35]. Another study focused on pedestrian crossing pavement markings with an embedded LED lighting system. A reduction in the mean speed (19.3%) and deceleration rate (16.4%) was observed when the sponsor module was enabled. However, the test of significance was not reported [36]. A study on flashing stop signs in Minnesota with 3 years of accident data found a 41.5% reduction in average right-angle accidents compared to installations without treatment [37]. However, the limited number of accidents impacted the significance of the estimate which is expected to be at least two times smaller than the intended effect size of a treatment [29].
Artificial Ambient Light Effect
Some researchers focused on the impact of active pedestrian crossing signs on driving factors in rural areas of Texas [38,39]. For this purpose, the 13 sites used in this study exhibited a wide range of driver yield rates varying from 5% to 88%. The authors identified several variables that may influence driver yielding behavior such as intersection configuration, crossing distance, traffic count, posted speed limit, location, sign face, approach side (near or distant), etc. A logistic regression model was applied to establish the relationship between the dependent (yield/not yield) and independent variables, indicating that hourly volumes, operational speed (binary), lane width deviation, and sidewalk presence served as predictors for the log-odds of driver yielding probability. However, the staged pedestrian approach, which required an increase in pedestrian traffic, may not be appropriate for an objective safety assessment. The above-mentioned study continued in a subsequent year to identify statistical interactions between LED treatment types and site characteristics for pedestrian safety. To achieve this, a larger sample size was used, and ANCOVA models were applied to analyze site mean yield rates. Additionally, logistic regression was employed to evaluate individual driver responses to pedestrians. The results represented higher yielding at night and identified various variables influencing driver reactions such as yield lines, speed limits, number of lanes, lane width, and hourly volume. The authors focused on rural areas with moderate traffic counts and ignored accident counts. Limitations included using binomial logistic regression, which made it difficult to address variables with more than two categories such as speed as a continuous variable [38,39]. While many studies have applied statistical or modeling techniques to evaluate specific conditions or treatments, they often lack calibration using real-world behavioral data. Additionally, prior work has typically focused on rural or low-traffic environments, limiting generalizability. The present study builds on these efforts by integrating detailed driver compliance behavior from an urban setting and using it to calibrate microsimulation and crash models—allowing for a more targeted and transferable evaluation of signage effectiveness.
A different modeling approach was proposed by Petrović and Novačko [40], who utilized a driving simulator to review the impact of different stop sign configurations on driving speed at rural intersections. The study involved 32 young volunteers and tested a regular stop sign, one with advance notice, and a fluorescent stop sign with drivers’ right of way. The results revealed that the fluorescent stop sign reduced average speeds by 12.6 km/h for a regular one compared to a fluorescent one, and 9.2 km/h for that with advance notice compared to a fluorescent one [40].
In another study, researchers analyzed SCIs in Montreal compared to uncontrolled approaches applying video data from 100 intersections and 130,000 instances. Stop signs significantly reduced speed approach and variance, despite lacking statistical evidence for reducing vehicle-pedestrian interactions. The authors recommended exploring other interventions, arguing that stop signs might be less effective for pedestrian safety. They employed SMoS such as time to collision (TTC), post-encroachment time (PET), and identified various covariates. Vehicle-vehicle interactions showed improvement in TTC and PET. However, the availability of few significant variables limited the conclusions for pedestrian safety [41].
3. Materials and Methods
Figure 1 shows the effects of active signs on road safety by a traffic microsimulation model, as well as statistical and field studies.
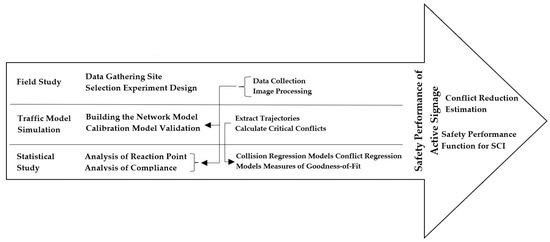
Figure 1.
Study framework.
3.1. Field Study
Previous studies employed either long-term before-after analyses of flashing signs or compared intersections equipped with active signage to those without these signs [7,8,10,37,38]. However, drivers’ reactions to signage, which can be influenced by various factors beyond the type of signage, may vary over time or from site to site. The present study aims to control some of the aforementioned variables considering the others in the performance assessment.
Several SCIs with similar geometric designs, traffic mix, and counts were selected to enable conducting concurrent trials for observation. An urban link in Montréal (Figure 2) was selected for the experiment where the same traffic was exposed to various types of active signage within a few minutes.
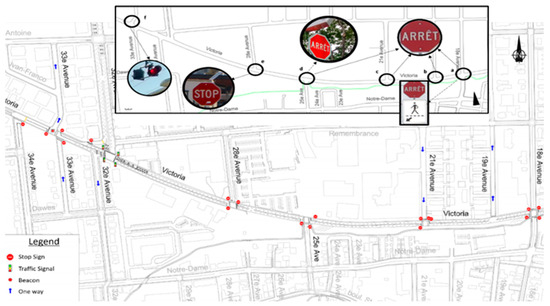
Figure 2.
Study area of Rue Victoria from 18th Avenue to 34th Avenue.
In order to conduct the experiment, two types of signage including standard signs and a new design featuring a uniform LED BLS face were assessed. Initially, the intersections of Victoria Ave with 18th and 25th Ave were equipped with standard stop signs. For the purpose of this study these standard signs were upgraded to BLSs for a duration of 2 months. Data were collected before and after installing the BLS signs to enable a comprehensive cross-reference analysis (Figure 3).

Figure 3.
Sample data collection set-up.
The data collection involved speed and count readings utilizing three stations of high-definition (HD) radars and 189 h of video recording over 10 days. Various image processing techniques were deployed to capture volume, speed, trajectories, compliance, and drivers’ reaction to the signage [42].
Data were collected from intersections and approaches supplemented by data from accident databases, weather conditions, vehicle counts, and intersection drawings. In addition to reading the approaching speed at 30 m markers, the obtained footage was applied to annotate and measure the gap between the point where drivers initiate braking (brake pedal light goes off) and stop-line. Image processing techniques were employed to the intersection footage to identify the drivers’ second reaction at crossing points [42,43]. The driver’s reaction was classified based on the Institute of Transportation Engineers (ITE) manual. The categories were defined as full stop (0–1 km/h), rolled through (1–5 ± 1 km/h), and blew through the stop-sign (more than 5 km/h) [42,43]. Finally, the data collected from the field study were incorporated into the micro-simulation and statistical modeling.
The classification process was based on frame-by-frame annotation of the footage, using spatial markers to determine vehicle positions and braking points. All compliance events were manually labeled and validated through inter-rater reliability checks among trained observers to ensure consistency and reduce subjectivity. This classification was later integrated into statistical modeling and simulation calibration steps to reproduce observed behavior accurately (see Figure 4 for an example annotation layout).

Figure 4.
Example of spatial distance markers and braking reaction point annotated during video processing. Markers were established using flashlight references and frame-by-frame image analysis to determine driver behavior and compliance.
3.2. Simulation
To evaluate the challenge related to infrequent accidents for measuring road safety performance, researchers often turn to alternate approaches such as conflict analysis, which serves as a reliable indicator of road safety [42]. A significant correlation was identified between conflicts and accidents at unsignalized intersections [44,45,46]. Here, a microsimulation model in VISSIM was calibrated to achieve conflict counts using the SMoS assessment model (SSAM). The car-following model was modified to include safe-to-stop breaking distance constraints. Lane-changing was restricted, resulting in disallowing vehicles from changing lanes while queuing up for through and turning movements. However, the above-mentioned model failed to replicate the same driver’s behavior at the stop sign as observed in the experiment. In the default VISSIM model, all vehicles are programmed to make a complete stop at stop signs, with no built-in parameters to allow behavioral deviations. To eliminate this obstacle, two dummy links were added to the approaches, enabling travelers to violate the stop rules while reducing their speed. The odds ratio for distribution was determined from qualitative and statistical analyses, resulting in generating three alternative results at the stop line including full-stop, roll-through, and blow-through as expected from the experiment. The treatment type at each approach during different times of the day determined the utilization ratio of these dummy links. Data from the experiment and vehicle counts from the city for four different time intervals were examined and incorporated into the model, as depicted in Figure 5 below.
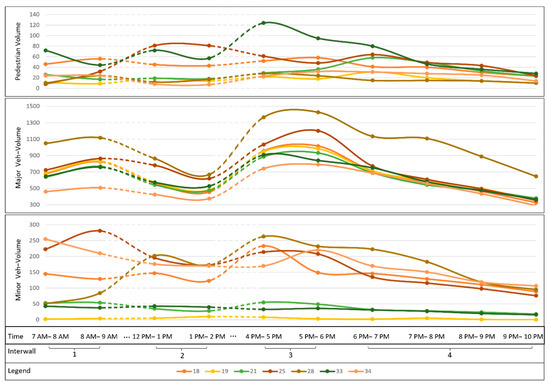
Figure 5.
Hourly traffic counts (major and minor).
The success of a traffic simulation model depends on its calibration, which is obtained utilizing vehicle counts and average speeds. Here, this factor played a critical role in validating the model against the observed conflicts. Unfortunately, existing microsimulation platforms such as Paramics, VISSIM, or Aimsun fail to provide conflict estimates as output. A surrogate safety assessment model relied on simulation results was applied to estimate the conflicts. The model was calibrated employing turning movement counts (TMCs) as an alternative objective function due to the aforementioned limitation and small size of network. Heuristic methods are considered as appropriate for calibration given the stochastic nature of microsimulation and complex relationship between model parameters and objective function [47,48,49,50,51]. The genetic algorithm (GA) is regarded as advantageous due to its ability to perform multiple point searches, resulting in reducing the number of steps needed to determine the optimal set of parameters. This approach is considered appropriate for discrete data such as turning movement counts due to the lack of reliance on gradient information. In contrast, Artificial Neural Networks have demonstrated better performance in predicting and optimizing continuous data, such as vehicle speed variations. However, GAs remains a stable and widely used approach for similar optimization problems, particularly when discrete decision-making is required [47,52].
Figure 6 illustrates the model calibration procedure. The trajectory data from only a few sessions were extracted from video footage to validate the microsimulation output of conflicts considering budgetary limitations.
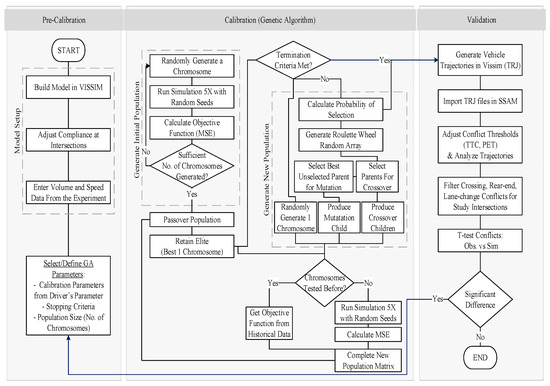
Figure 6.
Microsimulation set-up procedure using GA.
The present study focuses on driving behavior parameters and their significant impact on stop behavior. A sensitivity analysis was conducted utilizing ANOVA, resulting in the identification of key parameters in VISSIM including max_deceleration_own, accepted_deceleration_own, deceleration_reduction_distance, deceleration_reduction_distance, max_look_ahead_distance, average_standstill_ditance_for_Wiedemann, min_clearance, additive_part_of_safety_distance, and multiplicative_part_of_safety_distance. To calibrate these parameters effectively, the mean square of errors (MSE) is adopted as a goodness-of-fit measure. It compares model estimates with real-world observations, with the particular focus on TMCs (Equation (1)). Some studies propose alternative metrics such as traffic speed or travel time. However, the decision to apply MSE for TMCs was based on the critical role of vehicle turns at intersections in influencing drivers’ reactions to stop signs. The reason for squaring the difference between the observed and simulated values is twofold. First, a higher penalty is imposed on larger errors, ensuring that significant deviations have a stronger influence on optimization. Second, squaring the differences prevents errors of opposite signs from canceling each other out, which ensures a more accurate calibration of the model.
where i and n indicate cross-reference number for turn and number of TMCs, while and represent observed and simulated volumes for a turn, respectively.
Here, GA-adjusted values of the model parameters (e.g., look_ahead_distance) are represented as genes on a chromosome. The initial chromosomes were randomly generated with fitness investigated based on the objective function from simulation runs. GA iterations involve selecting parents with lower fitness values for breeding employing elitism and roulette wheel selection until termination criteria are met. No further improvements are reported for four consecutive generations or a maximum of 15 iterations (Figure 7a). The final calibrated parameters were extracted and the simulated turning counts were validated against observed data using the GEH parameter, indicating an appropriate representation of the observed counts (Figure 7b). Conflict criteria were set at 1.5 s, 5 s, and 30 degrees, and 80 degrees for TTC, PET, as well as rear-end and crossing angles. A two-sample test was conducted utilizing the Mann–Whitney U-Test to validate the simulation results against the observed data. The nonparametric Mann–Whitney U-Test serves as an equivalent to the t-test in this context because the conflict data are considered as discrete, which not normally distributed (Figure 8).
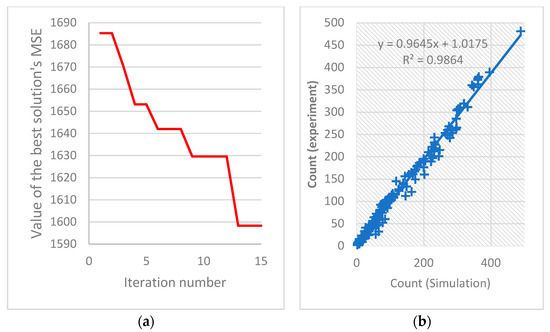
Figure 7.
(a) Calibration optimization process, (b) turning movement simulation vs. observations.
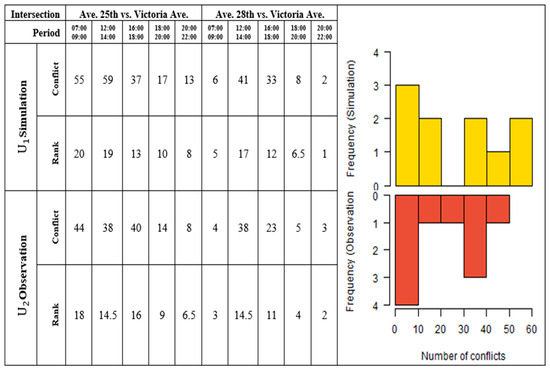
Figure 8.
Conflict validation simulation vs. observations.
The Mann–Whitney U-Test involves calculating the Z value based on the sample sizes ( and ) and the sum of ranks for each group (). In this case, the calculated Z value is 0.454, falling within the 95% region of acceptance, which is [−1.96, 1.96]. Additionally, the p-value for a two-tailed test was determined to be 0.65. Based on the p-value, which is greater than the significance level (α), no significance difference is identified between the randomly selected values, meaning that the validation process is deemed complete.
3.3. Data Processing
The modeling methodology employed generalized linear models (GLMs) to estimate accidents and conflicts, as well as addressing model performance. Accidents are regarded as well-known indicators for road safety assessment and conflicts are used as a SMoS in the absence of accident data.
The geospatial accident data were viewed, filtered, and reviewed here. During 2012–2018, 114 accidents were identified at the intersections, among which 71 ones (62%) occurred during the four-time intervals. The Poisson distribution was utilized to estimate the expected accident frequency. GLMs were applied, hypothesizing that (Equation (2)) and represent the number of accidents at intersection i and its Poisson parameter during the observation time interval (2012–2018), respectively.
where is considered as the vector related to flow of motorist and non-motorist, while and β are regarded as vectors of explanatory variables and regression parameters, respectively. A non-linear relationship is found between flow and number of accidents at intersections. Thus, Equation (2) can be expanded as follows.
Log-likelihood can construct a linear function for β, which is manipulated easily for its estimation. The maximum likelihood estimate generates Poisson parameters, which are considered as consistent and asymptotically efficient.
The Poisson model is regarded as vulnerable to over-dispersion, especially with a high proportion of zero accidents [53]. The Poisson–Gamma (negative binomial) method is employed to eliminate this obstacle [54]. This approach, which is used to estimate conflicts as the dependent variable [55], involves modifying Equations (2) and (4) [56].
The term represents the gamma probability distribution with parameters α > 0, which accounts for variance from the mean. Maximum likelihood estimation for Equations (4) and (6) involves iterative or numerical methods such as Newton–Raphson. Commonly used goodness-of-fit statistics such as Chi-square Pearson and Deviance are utilized to analyze model performance. The Akaike information criterion (AIC) is considered as another widely employed test, which compares models considering the log-likelihood and number of coefficients (β, α).
where k is regarded as the total number of parameters in the model.
4. Results
A conflict-based accident-prediction model was developed and goodness-of-fit tests were conducted to assess its relationship strength. Further, a traditional traffic volume-based accident-prediction model was created with and without driver behavior as posterior data. This comparison allowed evaluating the accident-prediction capabilities of the conflict-based model in comparison to the traffic volume-based model. Furthermore, a model was developed to predict conflict applying traffic volume and drivers’ behavior as posterior data. This model estimated the expected number of the BLS countermeasure. The iteratively reweighted least squares method was applied to optimize the log-likelihood function from Equations (4) and (6). Figure 9 demonstrate the correlation and direction of covariates used in the GLM.
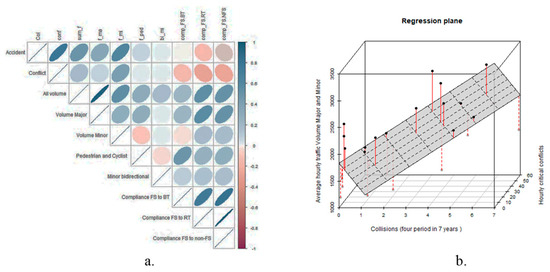
Figure 9.
(a) Correlation between variables and skewness of correlation, (b) regression plane displaying the correlation between accidents at intersections, traffic volume, and conflict from simulation with red lines as residuals.
As shown in Figure 9a, an inverse correlation is observed between drivers’ compliance with accidents and conflicts, with a stronger link to the latter. In addition, a direct correlation is reported between conflicts, volume, and accidents (Figure 9b). In order to consider the lower occurrence of accidents during 4 h in the evening (18:00–22:00) compared to the peak periods, the authors selected a dummy variable (Dum), which takes value 1 for the time intervals in the evening and 0 elsewhere. Table 1 and Table 2 present the estimates for six regression models, including the associated parameters, regression coefficients, and their significance levels. The corresponding model equations are provided below as Equations (9)–(14), each representing a different specification for modeling accident and conflict frequencies.

Table 1.
Regression models for accidents as a function of traffic volumes, drivers’ compliance, and conflict.

Table 2.
Regression models for conflict as a function of traffic volumes and drivers’ compliance.
The regression model includes several explanatory variables. Variable 1 a dummy variable indicating the presence of specific categorical effects, such as the type of signage or control measure, taking the value of 1 when the effect is present and 0 otherwise. Variable 2 represents the ratio of full-stop compliance to non-full-stop behavior, capturing driver compliance with signage. Variable 3 represents the hourly traffic volume on the major road (e.g., Victoria Avenue). Variable 4 represents the hourly traffic volume on the minor road (e.g., connecting roads). Finally, variable 5 represents the impact of critical interactions between vehicles requiring evasive actions, used as a surrogate measure for collision risk.
In Table 2, variable 1 is a binary indicator for the evening period, assigned a value of 1 during the evening and 0 otherwise. Variable 2 presents the proportion of full-stop behaviors relative to non-full-stop behaviors. Variable 3 measures the ratio of full-stop behaviors to roll-through behaviors, while variable 4 reflects the ratio of full-stop behaviors to blow-through behaviors. Lastly, variable 5 represents the total traffic volume at the intersection.
Models (1–3) establish relationships between accidents and traffic volumes, accidents as a function of conflicts and drivers’ compliance odds-ratio, as well as a combination of traffic volumes, conflicts, and compliance odds-ratios for predicting accidents. The Pearson chi-square and Deviance p-values represent significant similarity between observations and estimations, suggesting a good fit with the Poisson model. Likelihood ratio tests show significant covariates in models (1) and (2), supporting their significance. However, entering traffic volume in model (2) does not significantly improve the log-likelihood. As evidenced by a lower AIC value, model (2) which is based on conflicts performs better than model (1) which depends on traffic volumes. Models (4–6) utilize drivers’ compliance odds-ratios and traffic volumes to predict conflicts. Overdispersion in these models is examined using Poisson/Gamma or negative binomial (NB) models. The AIC performs better for model (6) even though it has a lower log-likelihood in model (5). This is because model (6) includes an additional covariate that model (5) lacks.
Based on the models (1) and (2), high flow and conflict increase the total number of accidents, which aligns with other findings. Introducing drivers’ reaction to signage with the presence of opposing traffic as an independent variable enhances the accuracy of accident estimates. Model (6) reveals that high flow or a decrease in drivers’ respect for the signage leads to an increase in conflicts.
During peak hours, the simulated conflicts and expected conflict frequency from the generalized linear model were remarkably close (50.33 vs. 51.49), suggesting a negative binomial distribution with parameters μ = 51.48 and α = 0.198 for conflicts at intersections with a regular stop signs. In contrast, the mean conflicts during night-time were 30.1, while the expected frequency was 36.71, indicating the effectiveness of the BLS sign in reducing conflicts. Table 3 presents the conflict and reduction rates with and without the BLS sign, serving as an alternative measure to the crash modification factor in the absence of accident data for this countermeasure.

Table 3.
Expected frequency of conflict with and without treatment (mean conflict derived from the simulation).
The reported conflict reduction percentages (65.5% at night and 46.8% during daylight) are derived from simulated average conflict values. These results are based on a calibrated microsimulation model incorporating field-observed speeds, volumes, and compliance behavior. The validity of the simulation was confirmed through a Mann–Whitney U-test comparing observed and simulated conflict values (p = 0.65), supporting the statistical reliability of the modeled estimates even in the absence of explicit confidence intervals.
5. Discussion
This study investigated the safety performance of LED-backlit stop signs compared to standard and conventional LED stop signs at urban SCIs. Using a hybrid approach combining field data, image processing, microsimulation modeling, and statistical analysis, the study aimed to assess the potential of BLSs to enhance driver compliance and reduce traffic conflicts.
To enhance model calibration, constraints based on signage compliance and recorded approach speeds from the field study were incorporated. A conflict-based accident-prediction model was developed for an urban three-way unsignalized stop intersection, leveraging reliable conflict and compliance data. This model proposed a safety performance function quantifying intersection safety based on observed conflicts and compliance data.
Figure 10 presents the comparison between fitted values of various models and the recorded accident data. Conflict-based models outperformed volume-based models in predicting accidents. Additionally, traffic flow and compliance were not significant when conflicts were included as covariates. The results indicate that an increase in conflicts led to more accidents, while a higher compliance odds-ratio reduced crash frequency.
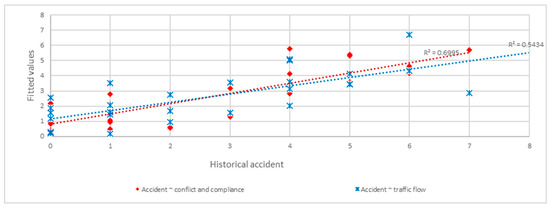
Figure 10.
Performance of predictive models.
The discussion of model performance confirms that behaviorally informed models—those accounting for full stops, roll-throughs, and blow-throughs—provide a better understanding of how signage influences driver decisions and, ultimately, safety outcomes. The integration of observed compliance rates into the microsimulation model allowed for more realistic replication of traffic flow and conflict patterns. As a result, surrogate safety indicators such as TTC and PET were more accurately estimated.
By addressing the challenge of limited crash data for new treatments, this study demonstrates the value of using surrogate safety measures and behavioral modeling to evaluate interventions proactively. It also underscores the importance of driver behavior in safety analysis and policy recommendations.
6. Conclusions
This study provides empirical and simulation-based evidence that LED-backlit stop signs improve safety performance at urban SCIs. By leveraging field-collected behavioral data and incorporating it into microsimulation and statistical models, the study achieved the following:
- Demonstrated that BLS treatments lead to a significant reduction in vehicle and pedestrian conflicts.
- Showed that driver compliance rates vary notably across sign types and lighting conditions, with BLS signs achieving the highest compliance.
- Validated the use of driver behavior data in enhancing the predictive performance of crash models.
- Introduced a modeling framework that allows safety evaluation of new treatments without the need for long-term crash records.
These findings support the deployment of BLS in urban intersections with known visibility and compliance issues. The methodology proposed here can assist transportation agencies in evaluating similar treatments in a cost-effective and timely manner, while minimizing public exposure to untested interventions. Transportation agencies can use the proposed framework to identify high-risk intersections, simulate the expected safety impact of BLS treatments before deployment, and prioritize implementation based on conflict reduction potential and driver compliance improvements.
The expected frequency of conflicts at intersections with BLS stop signs followed a negative binomial distribution and decreased by 65.5% at night and 46.8% during daylight compared to regular stop sign. For pedestrian crossing signs, the reductions were 55.6% at night and 27.8% during daylight. Based on the literature, overall accident prediction reduction for flashing LED stop signs and beacons were estimated at 41% and 58.2%, respectively [7,8].
This study presents an approach for safety assessment using conflicts and compliance. However, caution is needed in generalizing the results to overall accident reduction. These findings highlight the potential of conflicts and compliance as valuable safety measures, particularly when accident data are unavailable, warranting further investigation.
While this research focused on SCIs, the findings may have broader implications for other unsignalized intersections. One such example is roundabouts, where confusion over priority rules can often lead to traffic incidents. In these settings, conspicuous and attention-capturing signage like BLS could help reinforce correct yielding behavior and reduce misunderstanding. Future studies could explore the effectiveness of BLSs in enhancing compliance and reducing conflicts at roundabouts and similar intersection types where priority misinterpretation is a known issue.
It is also important to acknowledge a key limitation of this study, the absence of real-scale, long-term implementation data. While simulation-based surrogate safety analysis offers a cost-effective and proactive method to estimate safety impacts, it cannot fully replicate the complexity and variability of real-world traffic environments. The use of field-collected driver behavior data enhances the reliability of the findings; however, full-scale deployments across diverse locations and extended durations are necessary to validate the long-term effectiveness of BLS installations. Future research should consider pilot implementations and real-world evaluations to complement simulation-based insights. Additionally, the applicability of these findings to other regions may be influenced by differences in road design, driver behavior, and environmental conditions, and thus local calibration is recommended.
Author Contributions
M.L.: Conceptualization, validation, writing—original draft, and writing—review and editing; C.A.: conceptualization, methodology, supervision, validation, and writing—review and editing; M.G.F.: data curation, formal analysis, methodology, software, and validation. All authors have read and agreed to the published version of the manuscript.
Funding
This research was supported in part by the Natural Sciences and Engineering Research Council of Canada (NSERC), grant number RGPIN-2020-06760. The authors would also like to thank Orange Traffic for their valuable support and collaboration throughout this study.
Institutional Review Board Statement
Not applicable.
Informed Consent Statement
Not applicable.
Data Availability Statement
The data supporting the reported results are available upon request whenever needed.
Conflicts of Interest
The authors declare no conflicts of interest.
Abbreviations
| Abbreviation | Description |
| LED | Light-emitting diode |
| SCI | Stop-controlled intersection |
| MNL | Multinomial logistic regression |
| TMCs | Turning movement counts |
| GA | Genetic algorithm |
| GLMs | Generalized linear models |
| SHSP | Strategic highway safety plan |
| BLS | Backlit sign |
| SMoS | Surrogate measures of safety |
| FHWA | Federal highway administration |
| EB | Empirical bayes |
| ADT | Average daily traffic |
| TTC | Time to collision |
| PET | Post-encroachment time |
| HD | High-definition |
| ITE | Institute of transportation engineers |
| SSAM | Surrogate safety assessment model |
| MSE | Mean square of errors |
| AIC | Akaike information criterion |
| NB | Negative binomial |
References
- HSIS. Data Request. [Internet]. Available online: https://www.hsisinfo.org/datarequest.cfm (accessed on 16 August 2020).
- American Association of State Highway and Transportation Officials (AASHTO). A Policy on Geometric Design of Highways and Streets, 7th ed.; AASHTO: Washington, DC, USA, 2018. [Google Scholar]
- Tucker, C.; Tucker, R.; Zheng, J. StopWatcher: A stop sign awareness mobile application for driving safety. In Proceedings of the 2012 12th International Symposium on Pervasive Systems, Algorithms and Networks, San Marcos, TX, USA, 13–15 December 2012; pp. 122–127. [Google Scholar] [CrossRef]
- Transport Canada. Canadian Motor Vehicle Traffic Collision Statistics: 2017; Government of Canada: Ottawa, ON, Canada, 2018. [Google Scholar]
- Federal Highway Administration (FHA). Manual on Uniform Traffic Control Devices (MUTCD); FHA: Washington, DC, USA, 2012. [Google Scholar]
- American Association of State Highway and Transportation Officials (AASHTO). AASHTO Strategic Highway Safety Plan (SHSP); AASHTO: Washington, DC, USA, 2005. [Google Scholar]
- Davis, G.A.; Hourdos, J.; Xiong, H. Estimating the Crash Reduction and Vehicle Dynamics Effects of Flashing LED Stop Signs; Minnesota Department of Transportation: Saint Paul, MN, USA, 2014. [Google Scholar]
- Gates, T.J.; Carlson, P.J.; Hawkins, H.G., Jr. Field evaluations of warning and regulatory signs with enhanced conspicuity properties. Transp. Res. Rec. 2004, 1862, 64–76. [Google Scholar] [CrossRef]
- Hauer, E.; Garder, P. Research into the validity of the traffic conflicts technique. Accid. Anal. Prev. 1986, 18, 471–481. [Google Scholar] [CrossRef] [PubMed]
- Gates, T.J.; Hawkins, H.G., Jr.; Chrysler, S.T.; Carlson, P.J.; Holick, A.J.; Spiegelman, C.H. Traffic Operational Impacts of Higher-Conspicuity Sign Materials; The National Academies of Sciences: Washington, DC, USA, 2003. [Google Scholar]
- Gkyrtis, K.; Pomoni, M. Use of Historical Road Incident Data for the Assessment of Road Redesign Potential. Designs 2024, 8, 88. [Google Scholar] [CrossRef]
- Fiolić, M.; Babić, D.; Babić, D.; Tomasović, S. Effect of road markings and road signs quality on driving behaviour, driver’s gaze patterns and driver’s cognitive load at night-time. Transp. Res. Part F Traffic Psychol. Behav. 2023, 99, 306–318. [Google Scholar] [CrossRef]
- Abdu Kunnah, H.; Hassan, H.M. An exploration of the effects of various street lighting conditions on driver behaviors and safety at stop-controlled intersections: A driving simulator experiment. J. Transp. Saf. Secur. 2024, 16, 611–632. [Google Scholar] [CrossRef]
- Tageldin, A.; Sayed, T.; Zaki, M.H.; Azab, M. A safety evaluation of an Adaptive Traffic Signal Control system using Computer Vision. Adv. Transp. Stud. 2014, 2, 83. [Google Scholar]
- Goswamy, A.; Hallmark, S.; Litteral, T.; Pawlovich, M. Safety evaluation of destination lighting treatment at stop controlled cross-intersections. Transp. Res. Rec. 2018, 2672, 113–121. [Google Scholar] [CrossRef]
- Lord, D.; Geedipally, S.R.; Persaud, B.N.; Washington, S.P.; van Schalkwyk, I.; Ivan, J.N.; Lyon, C.; Jonsson, T. NCHRP Web-Only Document 126: Methodology to Predict the Safety Performance of Rural Multilane Highways; Transportation Research Board of the National Academies: Washington, DC, USA, 2008. [Google Scholar]
- Schieber, F. Optimizing the legibility of symbol highway signs. In Vision in Vehicles VI; Elsevier: Amsterdam, The Netherlands, 1998; pp. 163–170. [Google Scholar]
- Altamira, A.L.; Marcet, J.E.; Graffigna, A.B.; Gómez, A.M. Assessing available sight distance: An indirect tool to evaluate geometric design consistency. In Proceedings of the 4th International Symposium on Highway Geometric Design, Valencia, Spain, 2–5 June 2010; pp. 2–5. [Google Scholar]
- Awadallah, F. Intersection sight distance analysis and guidelines. Transp. Policy 2009, 16, 143–150. [Google Scholar] [CrossRef]
- Montella, A.; Mauriello, F. Procedure for ranking unsignalized rural intersections for safety improvement. Transp. Res. Rec. 2012, 2318, 75–82. [Google Scholar] [CrossRef]
- Gettman, D.; Pu, L.; Sayed, T.; Shelby, S.G.; Energy, S. Surrogate Safety Assessment Model and Validation; Turner-Fairbank Highway Research Center: McLean, VA, USA, 2008. [Google Scholar]
- Freedman, M. Traffic Signal Brightness Requirements for the Nighttime Driving Environment; The National Academies of Sciences, Engineering, and Medicine: Washington, DC, USA, 1985. [Google Scholar]
- Industry, J. Vehicle Traffic Control Signal Heads-Light Emitting Diode (LED) Circular Signal Supplement; Institute of Transportation Engineers: Washington, DC, USA, 2005. [Google Scholar]
- Mazzotta, F.; Vignali, V.; Irali, F. Evaluation of the readability of road signs and roadside elements using Mobile Eye tracking device. InBo 2014, 7, 253–260. [Google Scholar] [CrossRef]
- Stackhouse, S.; Cassidy, P. Warning Flashers at Rural Intersections; Minnesota Department of Transportation: Saint Paul, MN, USA, 1996. [Google Scholar]
- Murphy, B.G.; Hummer, J.E. Development of crash reduction factors for overhead flashing beacons at rural intersections in North Carolina. Transp. Res. Rec. 2007, 2030, 15–21. [Google Scholar] [CrossRef]
- Vogt, A.; Bared, J. Accident models for two-lane rural segments and intersections. Transp. Res. Rec. 1998, 1635, 18–29. [Google Scholar] [CrossRef]
- Srinivasan, R.; Carter, D.; Persaud, B.; Eccles, K.; Lyon, C. Safety evaluation of flashing beacons at stop-controlled intersections. Transp. Res. Rec. 2008, 2056, 77–86. [Google Scholar] [CrossRef]
- Hauer, E. Observational Before/After Studies in Road Safety. Estimating the Effect of Highway and Traffic Engineering Measures on Road Safety; The National Academies of Sciences, Engineering, and Medicine: Washington, DC, USA, 1997. [Google Scholar]
- Kwon, T.M.; Weidemann, R. Advanced LED Warning Signs for Rural Intersections Powered by Renewable Energy; University Digital Conservancy: Minneapolis, MN, USA, 2010. [Google Scholar]
- Lund, V.; Kwon, T.M.; Ismail, H.I. Evaluation of the ALERT System, a Rural Intersection Conflict Warning System; The National Academies of Sciences, Engineering, and Medicine: Washington, DC, USA, 2015; No. 15-1599. [Google Scholar]
- Weidemann, R.; Kwon, T.M.; Lund, V.; Boder, B. Determining the effectiveness of an advance led warning system for rural intersections. Transp. Res. Rec. 2011, 2250, 25–31. [Google Scholar] [CrossRef]
- Arnold, E.D.; Lantz, K.E. Evaluation of Best Practices in Traffic Operations and Safety: Phase I: Flashing LED Stop Sign and Optical Speed Bars; Virginia Transportation Research Council: Charlottesville, VA, USA, 2007. [Google Scholar]
- Jomaa, D.; Yella, S.; Dougherty, M. Review of the Effectiveness of Vehicle Activated Signs. J. Transp. Technol. 2013, 3, 123–130. [Google Scholar] [CrossRef][Green Version]
- Monsere, C.M.; Nolan, C.; Bertini, R.L.; Anderson, E.L.; El-Seoud, T.A. Measuring the impacts of speed reduction technologies: Evaluation of dynamic advanced curve warning system. Transp. Res. Rec. 2005, 1918, 98–107. [Google Scholar] [CrossRef]
- Patella, S.M.; Sportiello, S.; Carrese, S.; Bella, F.; Asdrubali, F. The effect of a LED lighting crosswalk on pedestrian safety: Some experimental results. Safety 2020, 6, 20. [Google Scholar] [CrossRef]
- Davis, G.A. Estimating traffic accident rates while accounting for traffic-volume estimation error: A Gibbs sampling approach. Transp. Res. Rec. 2000, 1717, 94–101. [Google Scholar] [CrossRef]
- Rista, E.; Fitzpatrick, K. Comparison of LED-embedded pedestrian crossing signs with rectangular rapid flashing beacons and pedestrian hybrid beacons. Transp. Res. Rec. 2020, 2674, 856–866. [Google Scholar] [CrossRef]
- Fitzpatrick, K.; Park, E.S. Nighttime effectiveness of the pedestrian hybrid beacon, rectangular rapid flashing beacon, and LED-embedded crossing sign. J. Saf. Res. 2021, 79, 273–286. [Google Scholar] [CrossRef]
- Petrović, M.; Novačko, L. (Eds.) Transformation of Transportation; Springer International Publishing: Berlin/Heidelberg, Germany, 2021. [Google Scholar]
- Stipancic, J.; St-Aubin, P.G.; Ledezma-Navarro, B.; Labbe, A.; Saunier, N.; Miranda-Moreno, L. Evaluating safety-influencing factors at stop-controlled intersections using automated video analysis. J. Saf. Res. 2021, 77, 311–323. [Google Scholar] [CrossRef] [PubMed]
- Foomani, M.G.; Li, C.; Alecsandru, C. Investigating Safety of Different Treatments at Stop-Controlled Intersection Using Driver Behavior Analysis. In Proceedings of the 95th Annual Meeting of Transportation Research Board, National Research Council, Washington, DC, USA, 10–14 January 2016. [Google Scholar]
- Foomani, M.G.; Alecsandru, C.; McConnell, L. A Safety Assessment of Backlit Pedestrian Crossing Sign on Stopping Characteristics. In Proceedings of the 96th Annual Meeting of Transportation Research Board, National Research Council, Washington, DC, USA, 8–12 January 2017. [Google Scholar]
- Hummer, J.E.; Robertson, H.D.; Nelson, C.D. Manual of Transportation Engineering Studies; Institute of Transportation Engineering, by Prentice-Hall, Inc.: Englewood Cliffs, NJ, USA, 1994. [Google Scholar]
- Essa, M.; Sayed, T. Simulated traffic conflicts: Do they accurately represent field-measured conflicts? Transp. Res. Rec. 2015, 2514, 48–57. [Google Scholar] [CrossRef]
- El Basyouny, K.; Sayed, T. Conflicts-Based Safety Performance Functions; The National Academies of Sciences, Engineering, and Medicine: Washington, DC, USA, 2011. [Google Scholar]
- Caliendo, C.; Guida, M. Microsimulation approach for predicting crashes at unsignalized intersections using traffic conflicts. J. Transp. Eng. 2012, 138, 1453–1467. [Google Scholar] [CrossRef]
- Ma, J.; Dong, H.; Zhang, H.M. Calibration of microsimulation with heuristic optimization methods. Transp. Res. Rec. 2007, 1999, 208–217. [Google Scholar] [CrossRef]
- Barcelo, J. Microscopic Traffic Flow Simulator VISSIM. Fundamentals of Traffic Simulation (International Series in Operations Research Management Science); Springer: New York, NY, USA, 2010. [Google Scholar]
- Li, C.; Karimi, M.; Alecsandru, C. Microscopic Simulation-Based High Occupancy Vehicle Lane Safety and Operation Assessment: A Case Study. J. Adv. Transp. 2018, 2018, 5262514. [Google Scholar] [CrossRef]
- Habtemichael, F.; Picado-Santos, L. Sensitivity analysis of VISSIM driver behavior parameters on safety of simulated vehicles and their interaction with operations of simulated traffic. In Proceedings of the 92nd Annual Meeting of the Transportation Research Board, Washington, DC, USA, 13 January 2013; pp. 1–17. [Google Scholar]
- Allison, P.D. Measures of fit for logistic regression. In Proceedings of the SAS Global Forum 2014 Conference, Washington, DC, USA, 23–26 March 2014; SAS Institute Inc.: Cary, NC, USA, 2014; pp. 1–13. [Google Scholar]
- Hauer, E. Overdispersion in modelling accidents on road sections and in Empirical Bayes estimation. Accid. Anal. Prev. 2001, 33, 799–808. [Google Scholar] [CrossRef]
- Persaud, B.; Lan, B.; Lyon, C.; Bhim, R. Comparison of empirical Bayes and full Bayes approaches for before–after road safety evaluations. Accid. Anal. Prev. 2010, 42, 38–43. [Google Scholar] [CrossRef]
- Caliendo, C.; Guida, M.; Parisi, A. A crash-prediction model for multilane roads. Accid. Anal. Prev. 2007, 39, 657–670. [Google Scholar] [CrossRef]
- Washington, S.; Karlaftis, M.G.; Mannering, F.; Anastasopoulos, P. Statistical and Econometric Methods for Transportation Data Analysis; Chapman and Hall/CRC: Boca Raton, FL, USA, 2020. [Google Scholar] [CrossRef]
Disclaimer/Publisher’s Note: The statements, opinions and data contained in all publications are solely those of the individual author(s) and contributor(s) and not of MDPI and/or the editor(s). MDPI and/or the editor(s) disclaim responsibility for any injury to people or property resulting from any ideas, methods, instructions or products referred to in the content. |
© 2025 by the authors. Licensee MDPI, Basel, Switzerland. This article is an open access article distributed under the terms and conditions of the Creative Commons Attribution (CC BY) license (https://creativecommons.org/licenses/by/4.0/).