How Can I Find My Ride? Importance of User Assistance in Finding Virtual Stops for Shared Autonomous Mobility-on-Demand Services


Abstract
1. Introduction
2. Materials and Methods
2.1. Choice-Based Conjoint Analysis
2.2. Selection of Attribute Levels
2.3. Survey
2.4. Data Analysis
2.5. Sample
3. Results
3.1. Model Specification
3.2. Parameter Estimation
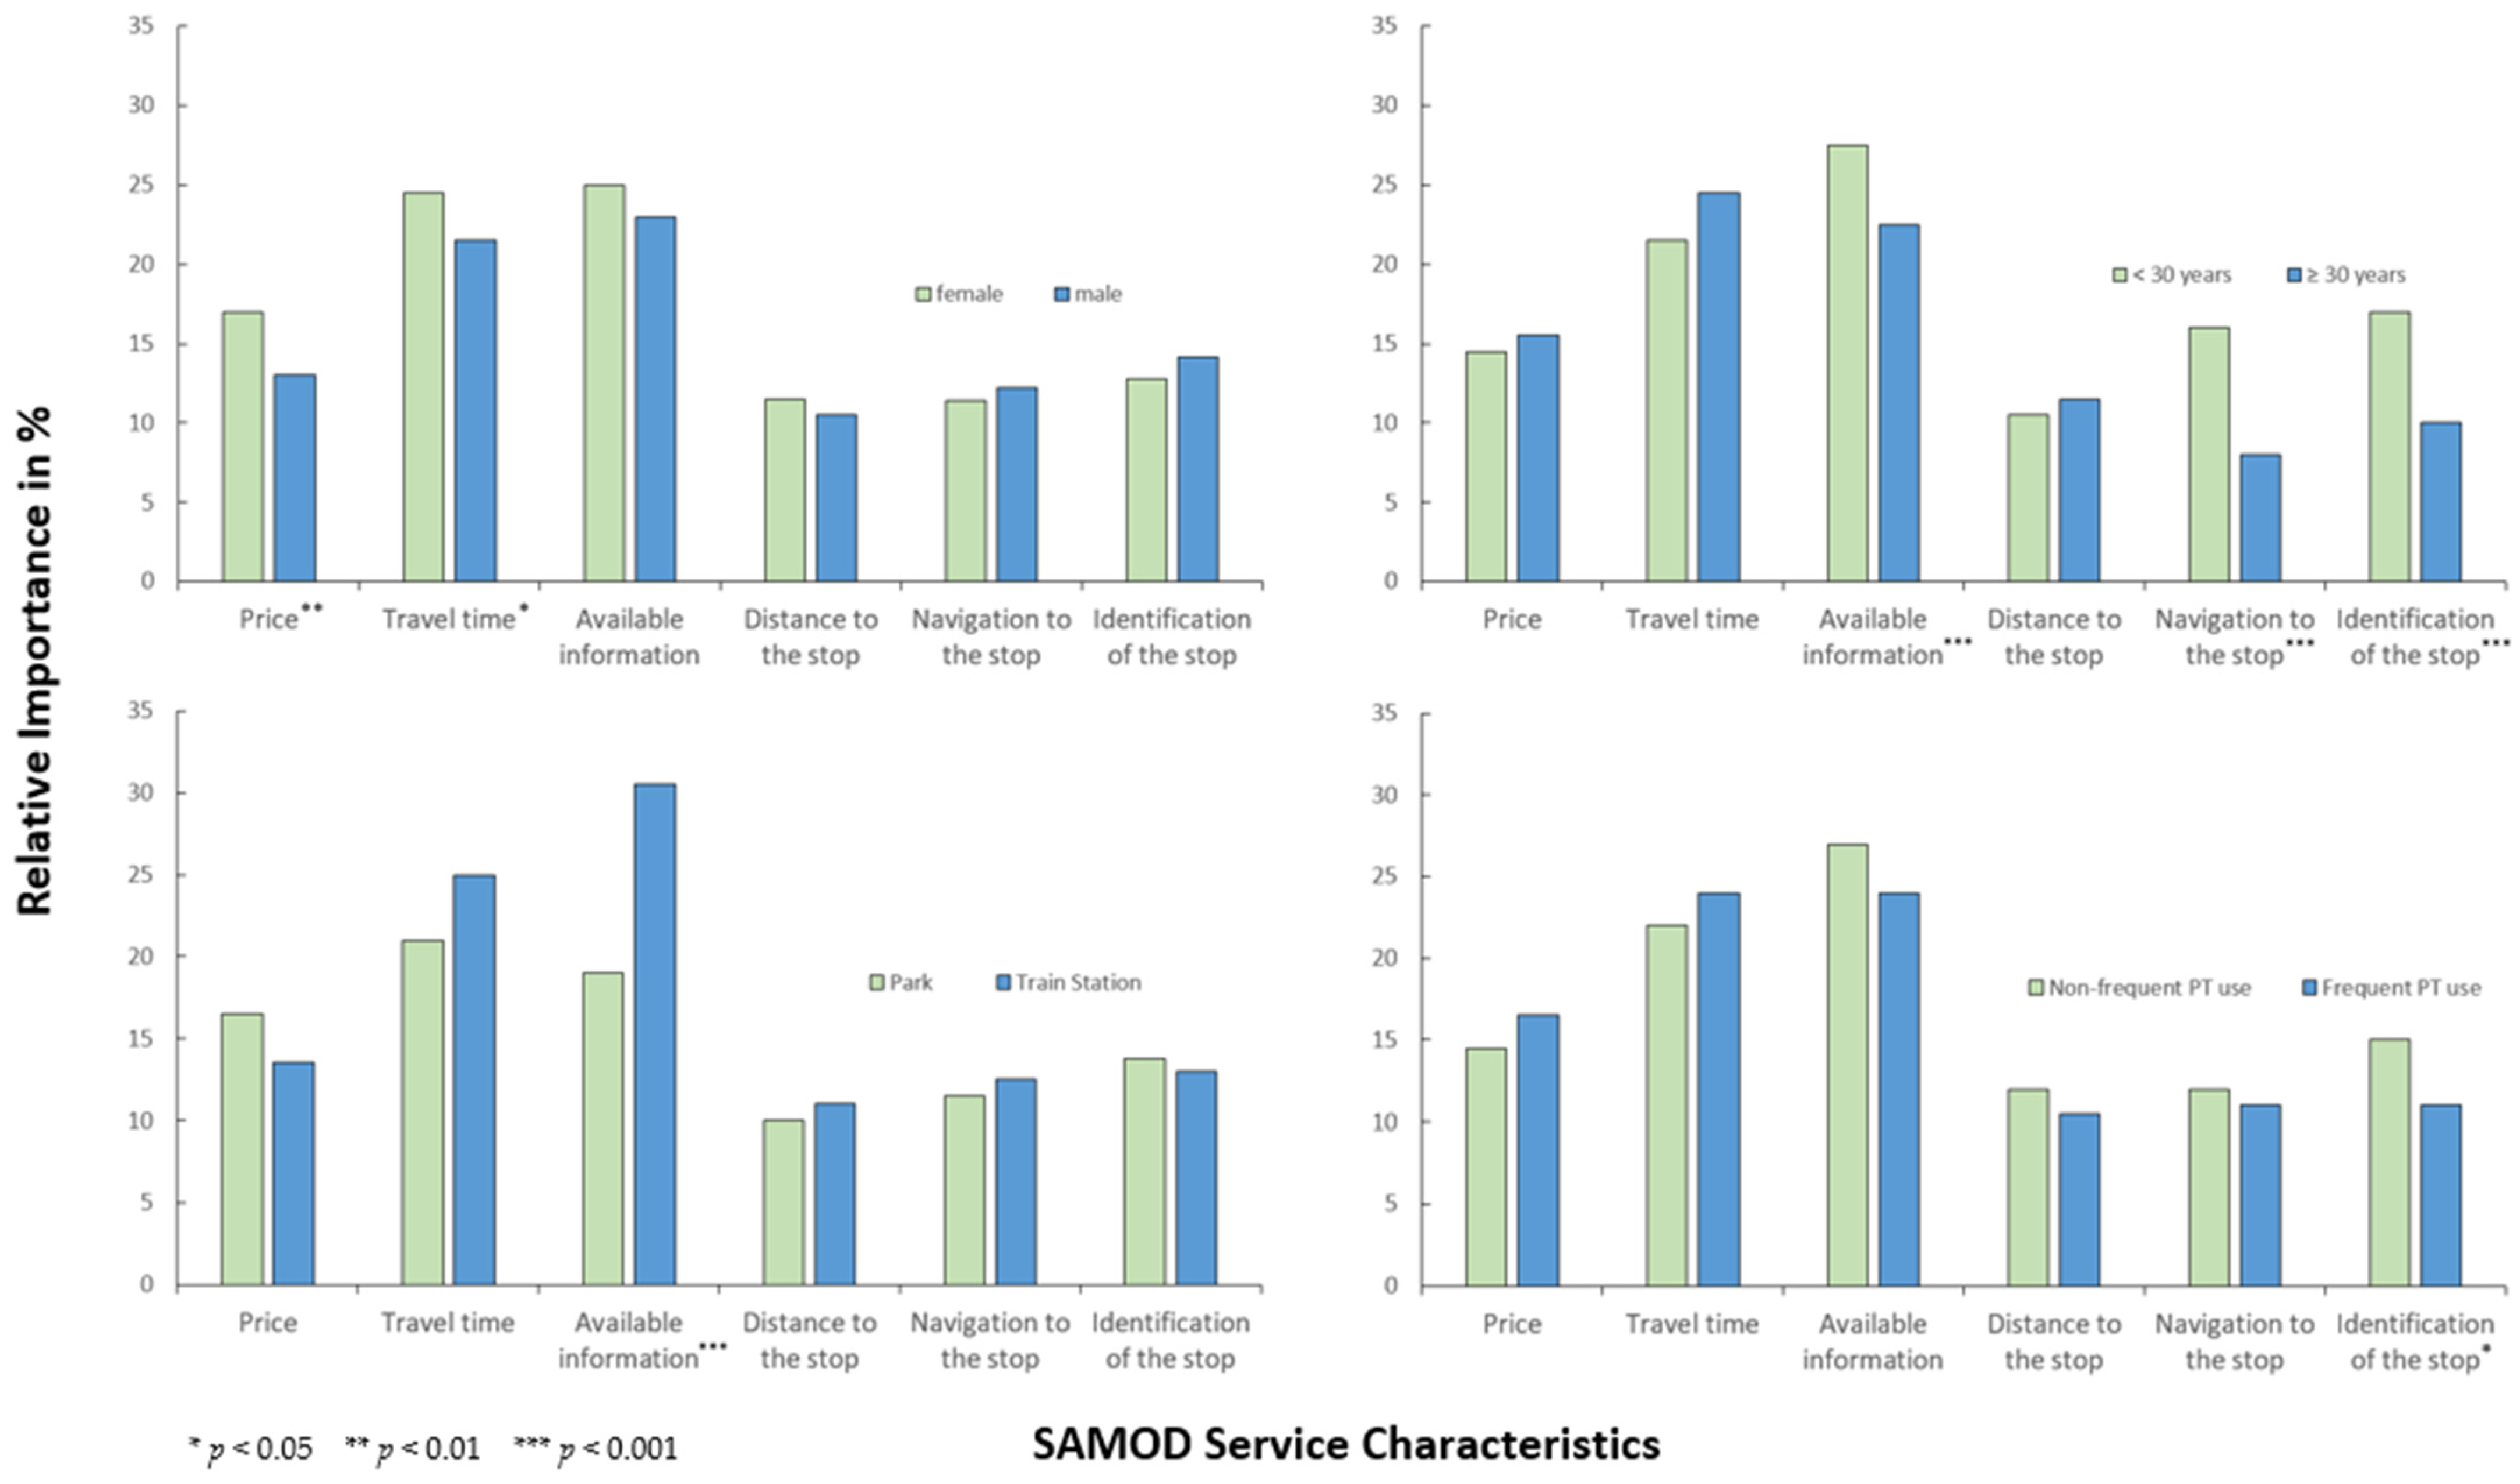
3.3. Interaction Effects
4. Discussion
Summary and Interpretation of Results
5. Conclusions
5.1. Research Objective 1: Main Attributes
5.2. Research Objective 2: Demographic Variables and Mobility Behavior
5.3. Research Objective 3: Context of the Trip
5.4. Recommendations for Transport Companies and City Planners
5.5. Limitations and Further Research Needs
Author Contributions
Funding
Institutional Review Board Statement
Informed Consent Statement
Data Availability Statement
Conflicts of Interest
References
- Mageean, J.; Nelson, J. The evaluation of demand responsive transport services in Europe. J. Transp. Geogr. 2003, 11, 255–270. [Google Scholar]
- Shaheen, S.; Chan, N. Mobility and the Sharing Economy: Potential to Facilitate the First- and Last-Mile Public Transit Connections. Built Environ. 2016, 42, 573–583. [Google Scholar] [CrossRef]
- King, D.A.; Conway, M.W.; Salon, D. Do For-Hire Vehicles Provide First Mile/Last Mile Access to Transit? Transp. Find. 2020, 14, 12872. [Google Scholar] [CrossRef]
- Geržinič, N.; van Oort, N.; Hoogendoorn-Lanser, S.; Cats, O.; Hoogendoorn, S. Potential of on-demand services for urban travel. Transportation 2023, 50, 1289–1321. [Google Scholar] [CrossRef]
- Liu, Y.; Bansal, P.; Daziano, R.; Samaranayake, S. A framework to integrate mode choice in the design of mobility-on demand systems. Transp. Res. C Emerg. Technol. 2019, 105, 648–665. [Google Scholar] [CrossRef]
- Frei, C.; Hyland, M.; Mahmassani, H.S. Flexing service schedules: Assessing the potential for demand-adaptive hybrid transit via a stated preference approach. Transp. Res. C Emerg. Technol. 2017, 76, 71–89. [Google Scholar] [CrossRef]
- Yan, X.; Levine, J.; Zhao, X. Integrating ridesourcing services with public transit: An evaluation of traveler responses combining revealed and stated preference data. Transp. Res. C Emerg. Technol. 2019, 105, 683–696. [Google Scholar] [CrossRef]
- Ryley, T.J.; Stanley, P.A.; Enoch, M.P.; Zanni, A.M.; Quddus, M.A. Investigating the contribution of Demand Responsive Transport to a sustainable local public transport system. Res. Transp. Econ. 2014, 48, 364–372. [Google Scholar] [CrossRef]
- Young, M.; Allen, J.; Farber, S. Measuring when Uber behaves as a substitute or supplement to transit: An examination of travel-time differences in Toronto. J. Transp. Geogr. 2020, 82, 102629. [Google Scholar] [CrossRef]
- Erhardt, G.D.; Roy, S.; Cooper, D.; Sana, B.; Chen, M.; Castiglione, J. Do transportation network companies decrease or increase congestion? Sci. Adv. 2019, 5, eaau2670. [Google Scholar] [CrossRef]
- Rodier, C.; Michaels, J. The Effects of Ride-Hailing Services on Greenhouse Gas Emissions. National Center for Sustainable Transportation. Policy Briefs 2019. [Google Scholar] [CrossRef]
- Bischoff, J.; Kaddoura, I.; Maciejewski, M.; Nagel, K. Simulation-based optimization of service areas for pooled ride-hailing operators. Procedia Comput. Sci. 2018, 130, 816–823. [Google Scholar] [CrossRef]
- Millonig, A.; Fröhlich, P. Where autonomous buses might and might not bridge the gaps in the 4 A’s of public transport passenger needs: A review. In Proceedings of the AutomotiveUI ’18: Proceedings of the 10th International Conference on Automotive User Interfaces and Interactive Vehicular Applications, Toronto, ON, Canada, 23–25 September 2018; pp. 291–297. [Google Scholar] [CrossRef]
- Bösch, P.M.; Becker, F.; Becker, H.; Axhausen, K.W. Cost-based analysis of autonomous mobility services. Transp. Policy 2018, 64, 76–91. [Google Scholar] [CrossRef]
- Hyland, M.; Mahmassani, H.S. Operational benefits and challenges of shared-ride automated mobility-on-demand services. Transp. Res. A Policy Pract. 2020, 134, 251–270. [Google Scholar] [CrossRef]
- Alonso-Mora, J.; Samaranayake, S.; Wallar, A.; Frazzoli, E.; Rus, D. On-demand high-capacity ride-sharing via dynamic trip-vehicle assignment. Proc. Natl. Acad. Sci. USA 2017, 114, 462–467. [Google Scholar] [CrossRef] [PubMed]
- Wen, J.; Zhao, J.; Jaillet, P. Rebalancing shared mobility-on-demand systems: A reinforcement learning approach. In Proceedings of the 2017 IEEE 20th International Conference on Intelligent Transportation Systems (ITSC), Yokohama, Japan, 16–19 October 2017; pp. 220–225. [Google Scholar] [CrossRef]
- Trommer, S.; Kolarova, V.; Fraedrich, E.; Kröger, L.; Kickhöfer, B.; Kuhnimhof, T.; Lenz, B.; Phleps, P. Autonomous Driving: The Impact of Vehicle Automation on Mobility Behaviour. Project Report 2016. Available online: https://www.ifmo.de/publications.html?t=45 (accessed on 22 January 2025).
- Mantouka, E.G.; Fafoutellis, P.; Vlahogianni, E.L.; Oprea, G.-M. Understanding user perception and feelings for autonomous mobility on demand in the COVID-19 pandemic era. Transp. Res. Interdiscip. Perspect. 2022, 16, 100692. [Google Scholar] [CrossRef]
- Krueger, R.; Rashidi, T.H.; Rose, J.M. Preferences for shared autonomous vehicles. Transp. Res. C Emerg. Technol. 2016, 69, 343–355. [Google Scholar] [CrossRef]
- de Oña, J.; de Oña, R.; Eboli, L.; Mazzulla, G. Perceived service quality in bus transit service: A structural equation approach. Transp. Policy 2013, 29, 219–226. [Google Scholar] [CrossRef]
- König, A.; Grippenkoven, J. Modelling travelers’ appraisal of ridepooling service characteristics with a discrete choice experiment. Eur. Transp. Res. Rev. 2020, 12, 1. [Google Scholar] [CrossRef]
- Moavenzadeh, J.; Lang, N.S. Reshaping Urban Mobility with Autonomous Vehicles: Lessons from the City of Boston. World Economic Forum 2018. Available online: https://www3.weforum.org/docs/WEF_Reshaping_Urban_Mobility_with_Autonomous_Vehicles_2018.pdf (accessed on 22 January 2025).
- König, A.; Grippenkoven, J. Travellers’ willingness to share rides in autonomous mobility on demand systems depending on travel distance and detour. Travel Behav. Soc. 2020, 21, 188–202. [Google Scholar] [CrossRef]
- König, A.; Wirth, C.; Grippenkoven, J. Generation Y’s Information Needs Concerning Sharing Rides in Autonomous Mobility on Demand Systems. Sustainability 2021, 13, 8095. [Google Scholar] [CrossRef]
- Choi, J.K.; Ji, Y.G. Investigating the Importance of Trust on Adopting an Autonomous Vehicle. Int. J. Hum.-Comput. Interact. 2015, 31, 692–702. [Google Scholar] [CrossRef]
- Buckley, L.; Kaye, S.; Pradhan, A.K. Psychosocial factors associated with intended use of automated vehicles: A simulated driving study. Accid. Anal. Prev. 2018, 115, 202–208. [Google Scholar] [CrossRef] [PubMed]
- Jing, P.; Xu, G.; Chen, Y.; Shi, Y.; Zhan, F. The Determinants behind the Acceptance of Autonomous Vehicles: A Systematic Review. Sustainability 2020, 12, 1719. [Google Scholar] [CrossRef]
- Salonen, A.O.; Haavisto, N. Towards autonomous transportation. Passengers’ experiences, perceptions and feelings in a driverless shuttle bus in Finland. Sustainability 2019, 11, 588. [Google Scholar] [CrossRef]
- Guo, J.; Susilo, Y.; Antoniou, C.; Pernestål Brenden, A. Influence of individual perceptions on the decision to adopt automated bus services. Sustainability 2020, 12, 6484. [Google Scholar] [CrossRef]
- Fraedrich, E.; Cyganski, R.; Wolf, I.; Lenz, B. User Perspectives on Autonomous Driving. A Use-Case-Driven Study in Germany, Humboltd-Universität zu Berlin. Project Report. 2016. Available online: https://www.geographie.hu-berlin.de/de/institut/publikationsreihen/arbeitsberichte/download/Arbeitsberichte_Heft_187.pdf (accessed on 22 January 2025).
- Chng, S.; Cheah, L. Understanding Autonomous Road Public Transport Acceptance: A Study of Singapore. Sustainability 2020, 12, 4974. [Google Scholar] [CrossRef]
- Kettles, N.; Van Belle, J. Investigation of the Antecedents of Autonomous Car Acceptance using an Enhanced UTAUT Model. In Proceedings of the International Conference on Advances in Big Data, Computing and Data Communication Systems, Winterton, South Africa, 5–6 August 2019; pp. 1–6. [Google Scholar]
- van Soest, D.; Tight, M.R.; Rogers, C.D. Exploring the distances people walk to access public transport. Transp. Rev. 2020, 40, 160–182. [Google Scholar] [CrossRef]
- Tennøy, A.; Knapskog, M.; Wolday, F. Walking distances to public transport in smaller and larger Norwegian cities. Transp. Res. D Transp. Environ. 2022, 103, 103169. [Google Scholar] [CrossRef]
- Stiglic, M.; Agatz, N.; Savelsbergh, M.; Gradisar, M. The benefits of meeting points in ride-sharing systems. Transp. Res. B Methodol. 2015, 82, 36–53. [Google Scholar] [CrossRef]
- Fielbaum, A.; Bai, X.; Alonso-Mora, J. On-demand ridesharing with optimized pick-up and drop-off walking locations. Transp. Res. C Emerg. Technol. 2021, 126, 103061. [Google Scholar] [CrossRef]
- Zwick, F.; Kuehnel, N.; Moeckel, R.; Axhausen, K.W. Agent-based simulation of city-wide autonomous ride-pooling and the impact on traffic noise. Transp. Res. D Transp. Environ. 2021, 90, 102673. [Google Scholar] [CrossRef]
- Czioska, P.; Mattfeld, D.C.; Sester, M. GIS-based identification and assessment of suitable meeting point locations for ride-sharing. Transp. Res. Procedia 2017, 22, 314–324. [Google Scholar] [CrossRef]
- Armellini, G.; Banse Bueno, O.A.; Bieker-Walz, L.; Erdmann, J.; Flötteröd, Y.-P.; Rummel, J. Brunswick simulation scenario for virtual-stops based DRT service with SUMO. In Proceedings of the 10th International Congress on Transportation Research, Rodos, Greece, 2–3 September 2021. [Google Scholar]
- Harmann, D.; Yilmaz-Niewerth, S.; Jacob, C. Methodological distribution of virtual stops for ridepooling. Transp. Res. Procedia 2022, 62, 442–449. [Google Scholar] [CrossRef]
- Harmann, D.; Yilmaz-Niewerth, S.; Häbel, R.; Vinke, V.; Kögler, S.; Friedrich, B. Development of an evaluation system for virtual ridepooling stops: A case study. In Proceedings of the 12th International Scientific Conference on Mobility and Transport, Singapore, 5–7 April 2022; pp. 245–262. [Google Scholar] [CrossRef]
- Hub, F.; Heß, S.; Wilbrink, M.; Oehl, M. Is this my ride? AV braking behavior from the perspective of waiting ride hailing customers. In Proceedings of the 24th International Conference on Human Computer Interaction, Virtual Event, 26 June–1 July 2022; pp. 375–382. [Google Scholar] [CrossRef]
- Hub, F.; Wilbrink, M.; Kettwich, C.; Oehl, M. Designing ride access points for shared automated vehicles—An early stage prototype evaluation. In Proceedings of the 22nd International Conference on Human Computer Interaction, Copenhagen, Denmark, 19–24 July 2020; pp. 560–567. [Google Scholar] [CrossRef]
- Hub, F.; Oehl, M. How to find my ride? Results of an HCI expert workshop for AR-aided navigation. In Proceedings of the 23rd International Conference on Human Computer Interaction, Virtual Event, 24–29 July 2021; pp. 535–542. [Google Scholar] [CrossRef]
- Hub, F.; Oehl, M. Design and field test of a mobile augmented reality human–machine interface for virtual stops in shared automated mobility on-demand. Electronics 2022, 11, 2687. [Google Scholar] [CrossRef]
- Eboli, L.; Mazzulla, G. A Stated Preference Experiment for Measuring Service Quality in Public Transport. Transp. Plan. Technol. 2008, 31, 509–523. [Google Scholar] [CrossRef]
- dell’Olio, L.; Ibeas, A.; Cecin, P. The quality of service desired by public transport users. Transp. Policy 2011, 18, 217–227. [Google Scholar] [CrossRef]
- Gkartzonikas, C.; Gkaritza, K. What have we learned? A review of stated preference and choice studies on autonomous vehicles. Transp. Res. C Emerg. Technol. 2019, 98, 323–373. [Google Scholar] [CrossRef]
- Rao, V.R. Applied Conjoint Analysis; Springer: Berlin, Germany, 2014. [Google Scholar] [CrossRef]
- König, A.; Bonus, T.; Grippenkoven, J. Analyzing Urban Residents’ Appraisal of Ridepooling Service Attributes with Conjoint Analysis. Sustainability 2018, 10, 3711. [Google Scholar] [CrossRef]
- An, A.; Nam, D.; Jayakrishnan, R.; Lee, S.; McNally, M.G. A Study of the Factors Affecting Multimodal Ridesharing with Choice-Based Conjoint Analysis. Sustainability 2021, 13, 11517. [Google Scholar] [CrossRef]
- Li, H.; Gao, K.; Tu, H. Variations in mode-specific valuations of travel time reliability and in-vehicle crowding: Implications for demand estimation. Transp. Res. A Policy Pract. 2017, 103, 250–263. [Google Scholar] [CrossRef]
- Shelat, S.; Cats, O.; Van Lint, J.W.C. Quantifying travellers’ evaluation of waiting time uncertainty in public transport networks. Travel Behav. Soc. 2021, 25, 209–222. [Google Scholar] [CrossRef]
- Aizaki, H.; Nishimura, K. Design and analysis of choice experiments using R: A brief introduction. Agric. Inf. Res. 2008, 17, 86–94. [Google Scholar] [CrossRef]
- Therneau, T.M.; Grambsch, P.M. Modeling Survival Data: Extending the Cox Model; Springer: New York, NY, USA, 2000. [Google Scholar]
- Avsar, H.; Böhm, M.; Dreßler, A.; Fischer, M.; Steinberger, U. User Experience of an Automated On-Demand Shuttle Service in Public Transportation. In Proceedings of the AHFE International Conference Human Factors in Transportation, New York, NY, USA, 24–28 July 2022; AHFE Open Access: New York, NY, USA, 2022; Volume 60, pp. 237–251. [Google Scholar]
- Mulley, C.; Ho, C.; Ho, L.; Hensher, D.; Rose, J. Will bus travellers walk further for a more frequent service? An international study using a stated preference approach. Transp. Policy 2018, 69, 88–97. [Google Scholar] [CrossRef]


| Attribute | Levels |
|---|---|
| Price | EUR 2.50 EUR 3.00 EUR 3.50 |
| Travel time | 10 min 20 min 30 min |
| Distance to the stop | 100 m 200 m 300 m |
| Available information | Departure time Departure time + arrival time Departure time + arrival time + route + delay |
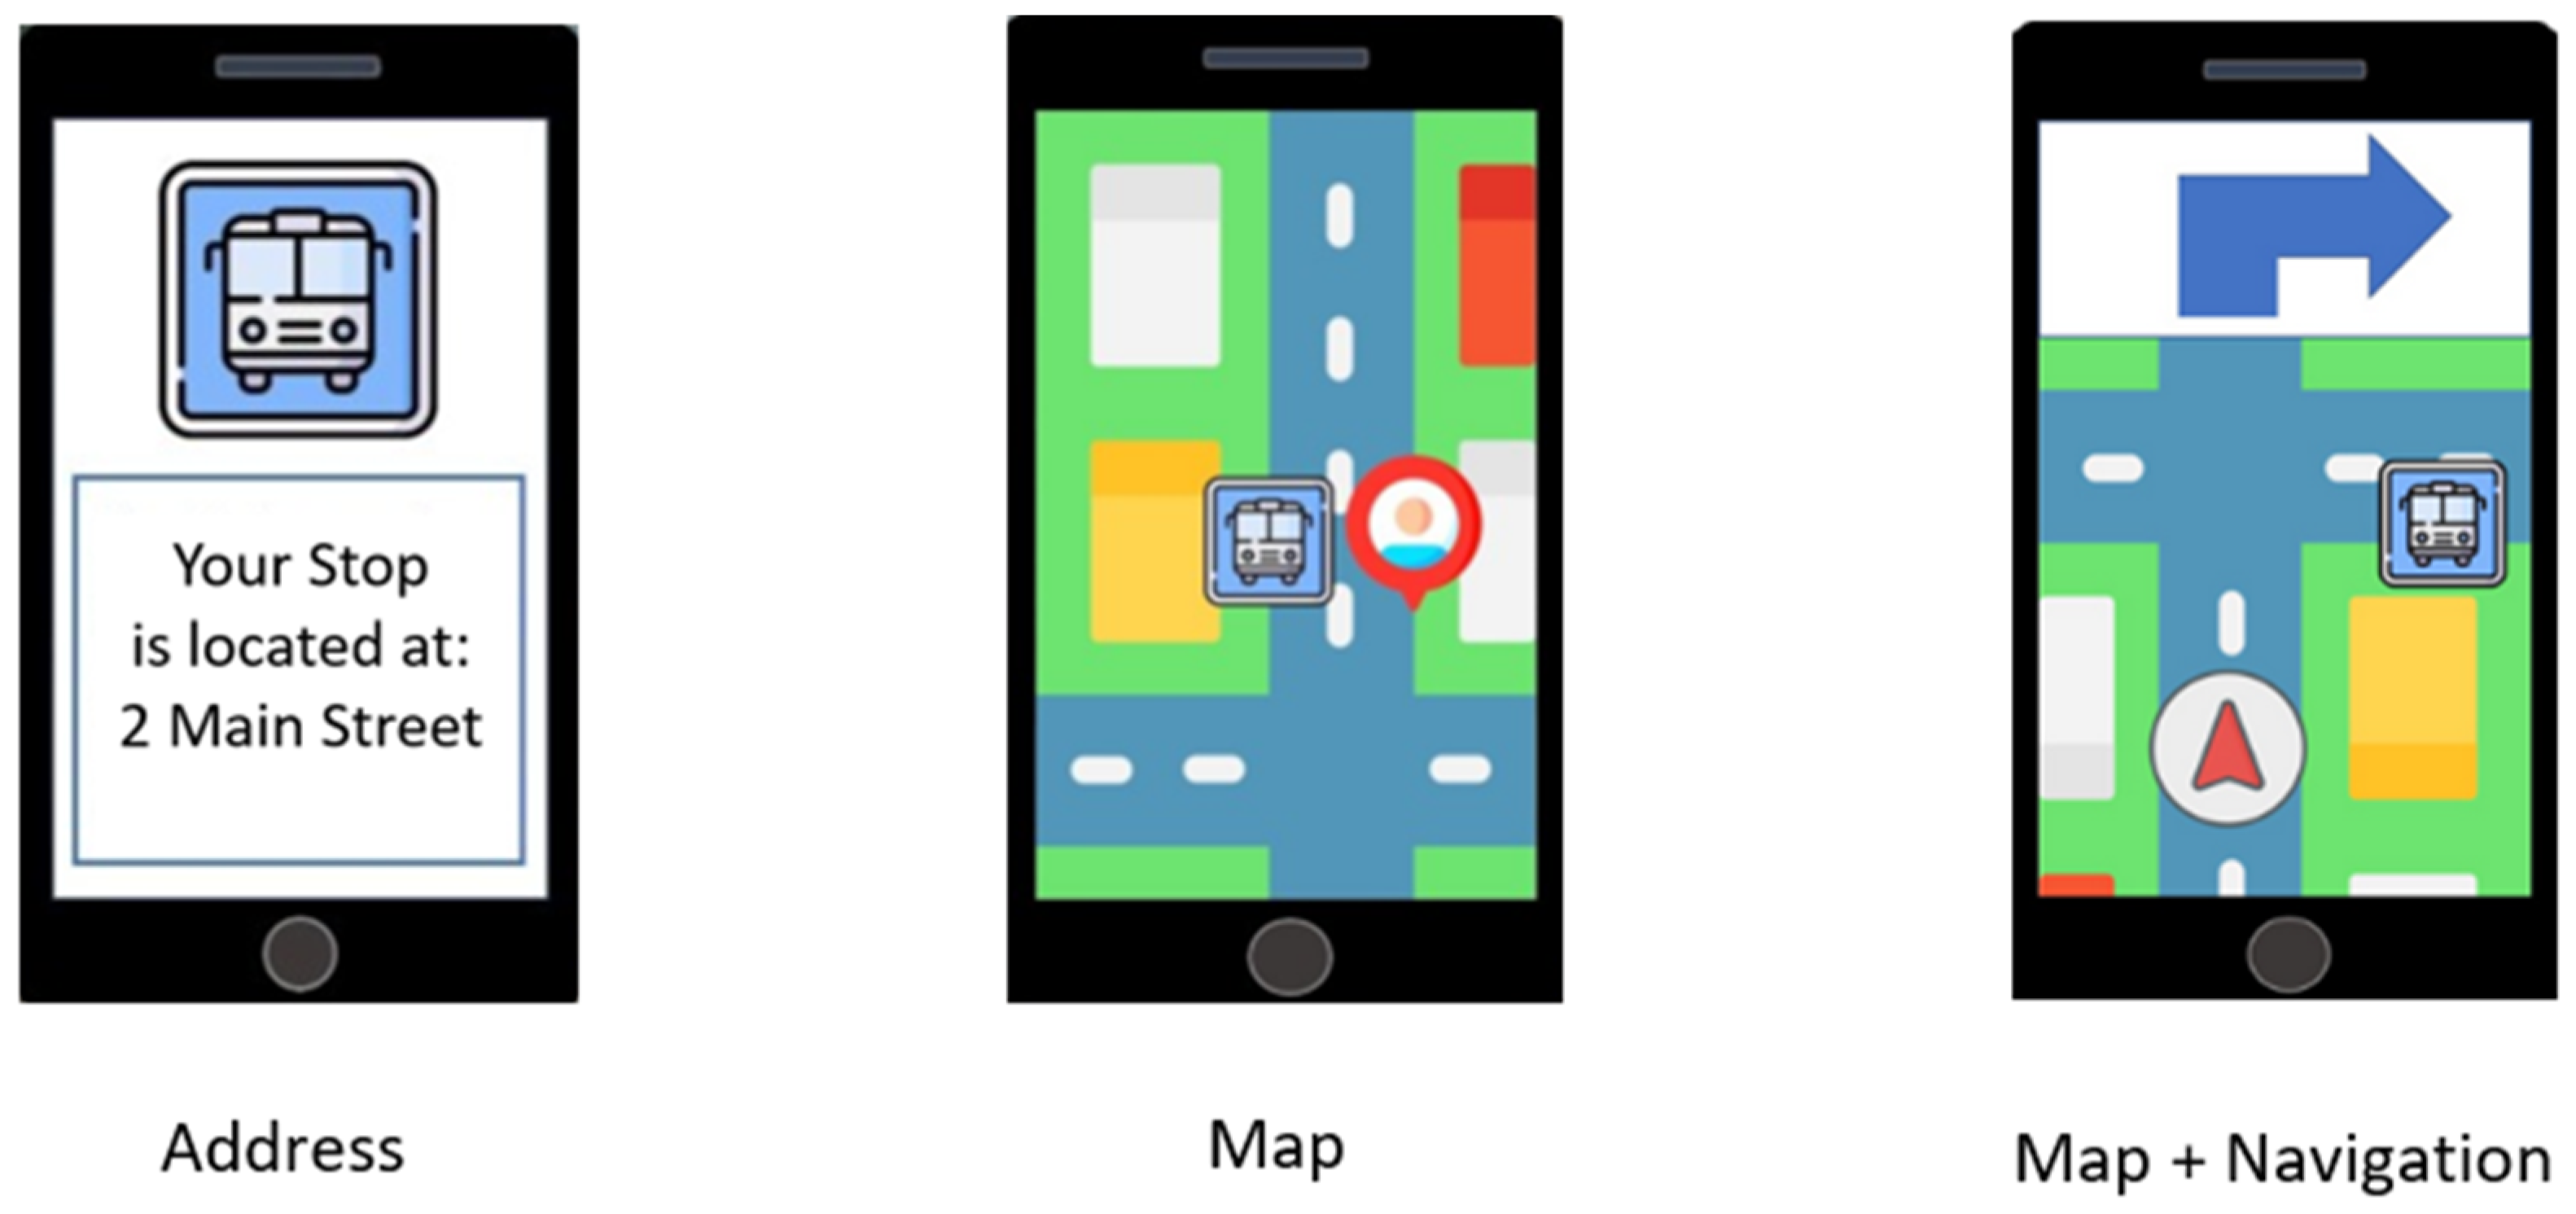
| Navigation to the stop | Address Map Map + navigation |
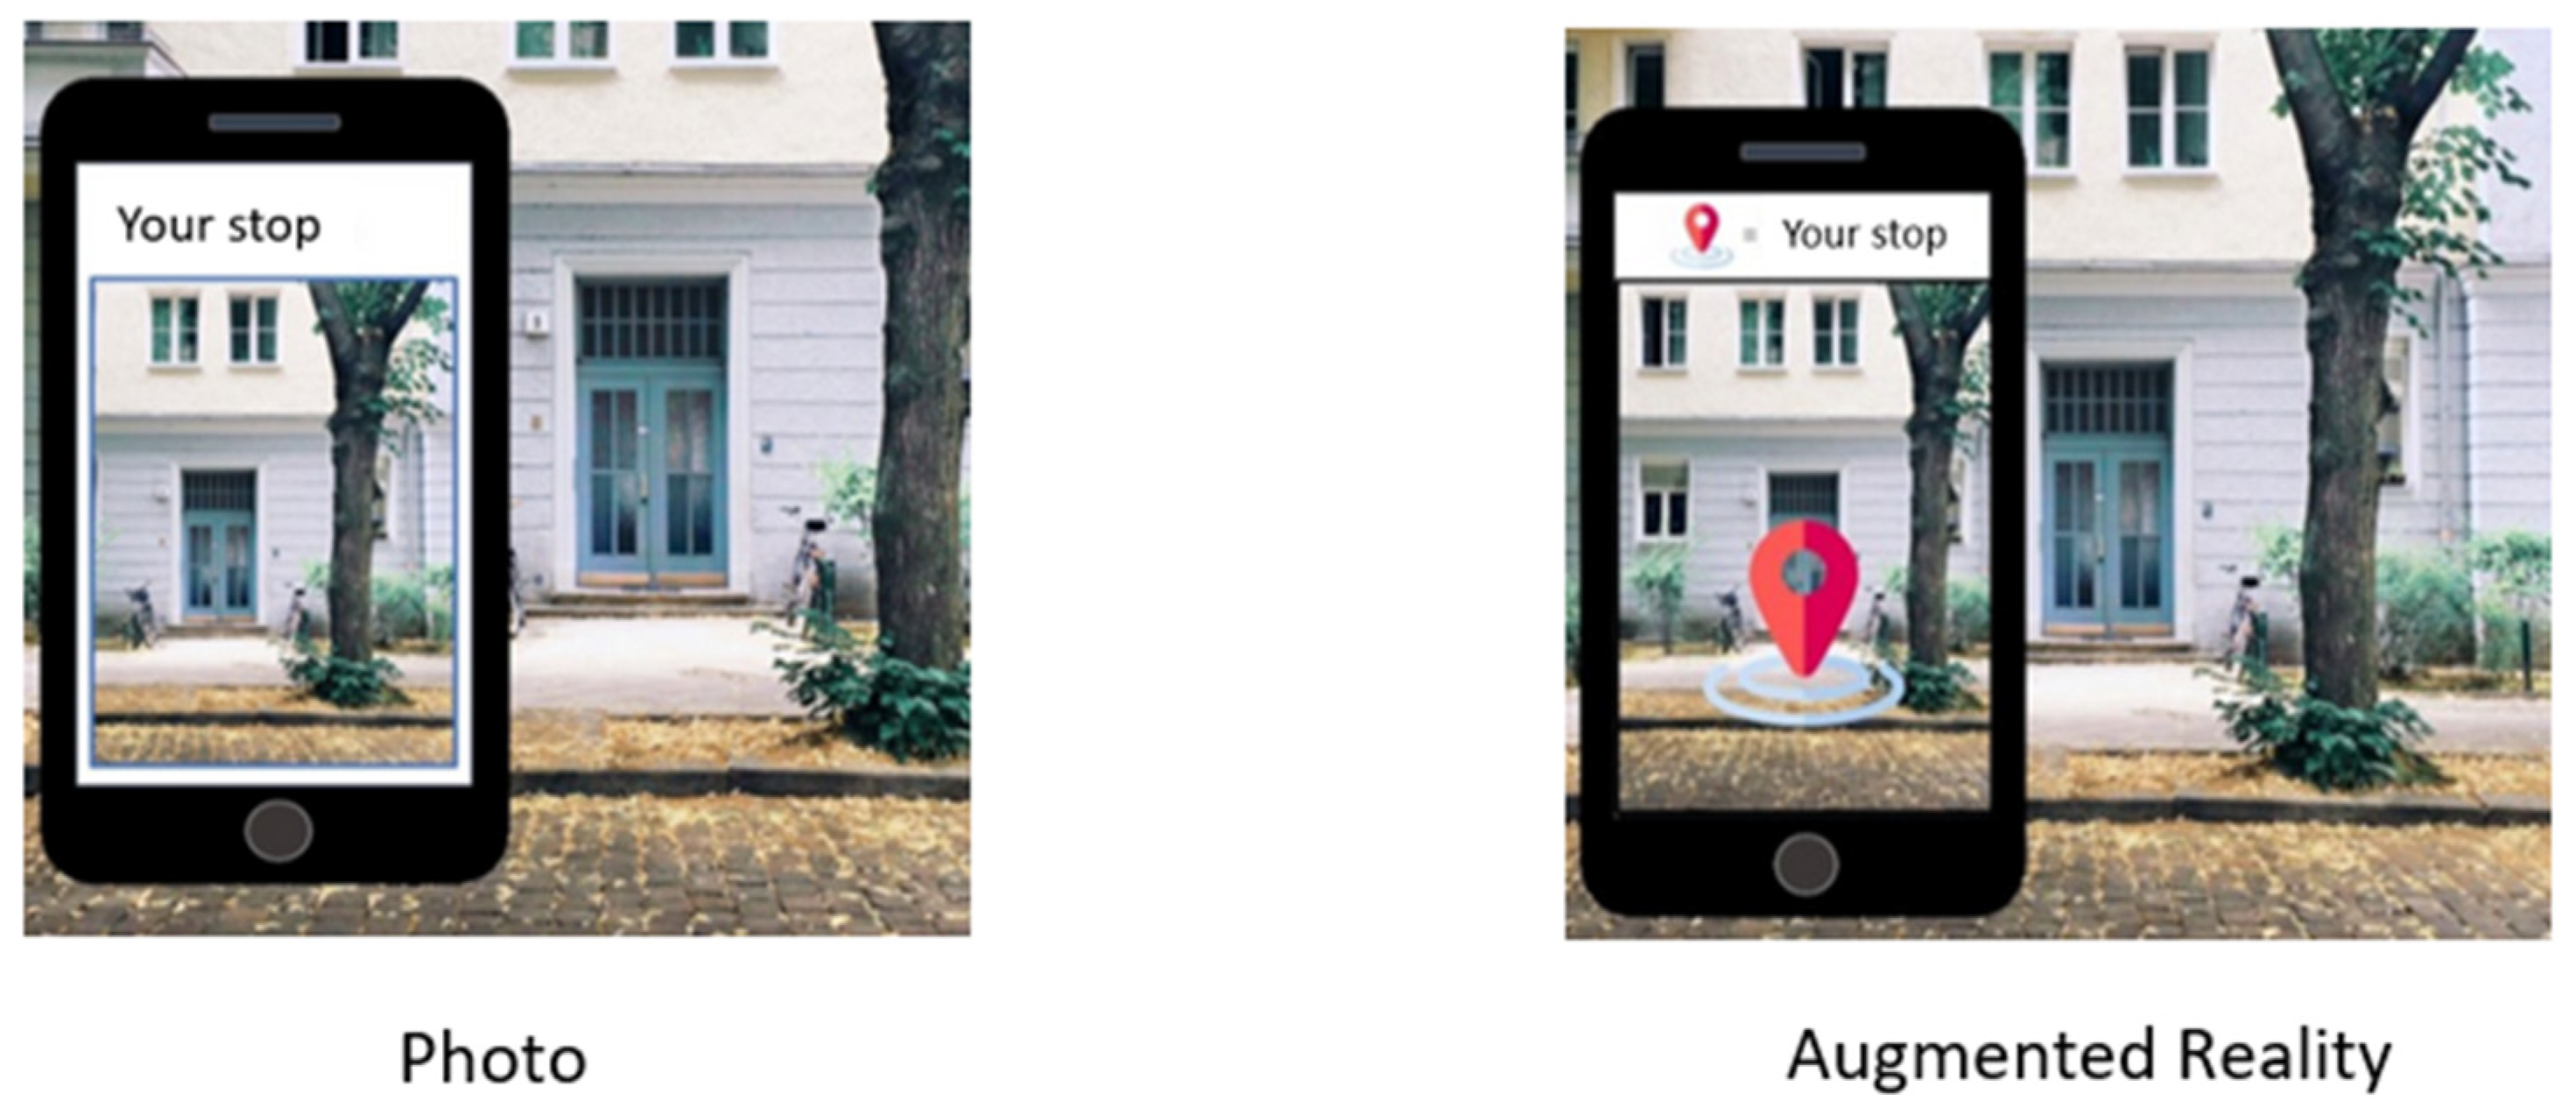
| Identification of the stop | No feature Photo Augmented reality |
| Demographic Variable | Categories | % | N |
|---|---|---|---|
| Gender | Male | 57.7 | 266 |
| Female | 41.2 | 190 | |
| Non-binary | 1.1 | 5 | |
| Age | <21 years | 5.2 | 24 |
| 21–30 years | 48.2 | 222 | |
| 31–40 years | 19.1 | 88 | |
| 41–50 years | 10.8 | 50 | |
| >50 years | 16.7 | 77 | |
| Size of city of residence (number of inhabitants) | <2000 | 6.3 | 29 |
| 2000–5000 | 6.3 | 29 | |
| 5000–20,000 | 12.4 | 57 | |
| 20,000–100,000 | 18.7 | 86 | |
| 100,000–1,000,000 | 36.9 | 170 | |
| >1,000,000 | 19.5 | 90 | |
| Highest educational qualification | No educational qualification/still in education | 17.8 | 82 |
| Secondary school certificate | 5.2 | 24 | |
| High school graduation | 17.1 | 79 | |
| Completed vocational training | 8.2 | 38 | |
| University degree | 51.6 | 238 | |
| Frequency of usage of the following: | |||
| Individual motorized transport | <2 times a week | 53.8 | 248 |
| At least 2 times a week | 46.2 | 213 | |
| Public transportation | <2 times a week | 62.9 | 290 |
| At least 2 times a week | 37.1 | 171 | |
| Individual non-motorized transport | <2 times a week | 30.6 | 141 |
| At least 2 times a week | 69.4 | 320 |
| Attribute | Interaction with |
|---|---|
| Price | Gender |
| Travel time | Gender Frequent use of non-motorized individual transport |
| Distance to the stop | Frequent use of non-motorized individual transport |
| Available information | Age Context |
| Navigation to the stop | Age Frequent use of motorized individual transport |
| Identification of the stop | Age Frequent use of motorized individual transport Frequent use of public transportation |
| Attribute | Attribute Level | β | OR | SE (β) | z | p |
|---|---|---|---|---|---|---|
| Price | EUR 2.50 EUR 3.00 EUR 3.50 | - −0.78 −1.06 | - 0.46 0.35 | - 0.09 0.14 | - −8.56 −7.60 | - <0.001 *** <0.001 *** |
| Travel time | 10 min 20 min 30 min | - −0.92 −1.59 | - 0.40 0.20 | - 0.08 0.15 | - −10.88 −10.83 | - <0.001 *** <0.001 *** |
| Available information | Departure time Departure time + arrival time Departure time + arrival time + route + delay | - 0.68 1.78 | - 1.97 5.91 | - 0.10 0.16 | - 6.98 11.43 | - <0.001 *** <0.001 *** |
| Distance to the stop | 100 m 300 m 500 m | - −0.39 −0.77 | - 0.68 0.46 | - 0.06 0.07 | - −6.58 −10.87 | - <0.001 *** <0.001 *** |
| Navigation to the stop | Address Address + map Address + map + navigation | - 0.23 0.82 | - 1.26 2.27 | - 0.07 0.09 | - 3.31 9.25 | - <0.001 *** <0.001 *** |
| Identification of the stop | No feature Photo Augmented reality | - 0.69 0.93 | - 1.69 2.53 | - 0.06 0.10 | - 10.72 9.58 | - <0.001 *** <0.001 *** |
| Attribute | Range of Regression Coefficients | Relative Importance (%) |
|---|---|---|
| Available information | 1.78 | 25.6 |
| Travel time | 1.59 | 22.9 |
| Price | 1.06 | 15.2 |
| Identification of the stop | 0.93 | 13.4 |
| Navigation to the stop | 0.82 | 11.8 |
| Distance to the stop | 0.77 | 11.1 |
| Attribute | Interaction Factor | β | OR | SE (β) | Z | p |
|---|---|---|---|---|---|---|
| Price | Gender | −0.13 | 0.88 | 0.05 | −2.83 | 0.005 ** |
| Travel time | Gender Non-motorized individual transport | −0.11 −0.08 | 0.90 0.93 | 0.05 0.05 | −2.34 −1.59 | 0.019 * 0.111 |
| Distance to the stop | Motorized individual transport | −0.07 | 0.93 | 0.04 | −1.66 | 0.096 |
| Available information | Age Context | −0.18 −0.30 | 0.83 0.74 | 0.05 0.04 | −3.83 −6.80 | <0.001 *** <0.001 *** |
| Navigation to the stop | Age Motorized individual transport | −0.26 −0.06 | 0.77 0.94 | 0.05 0.05 | −5.56 −1.35 | <0.001 *** 0.176 |
| Identification of the stop | Age Motorized individual transport Public transportation | −0.23 −0.05 −0.10 | 0.79 0.95 0.91 | 0.04 0.05 0.05 | −5.41 −1.08 −2.12 | <0.001 *** 0.281 0.034 * |
Disclaimer/Publisher’s Note: The statements, opinions and data contained in all publications are solely those of the individual author(s) and contributor(s) and not of MDPI and/or the editor(s). MDPI and/or the editor(s) disclaim responsibility for any injury to people or property resulting from any ideas, methods, instructions or products referred to in the content. |
© 2025 by the authors. Licensee MDPI, Basel, Switzerland. This article is an open access article distributed under the terms and conditions of the Creative Commons Attribution (CC BY) license (https://creativecommons.org/licenses/by/4.0/).
Share and Cite
Petersen, M.; Zuck, A.; Dreßler, A. How Can I Find My Ride? Importance of User Assistance in Finding Virtual Stops for Shared Autonomous Mobility-on-Demand Services. Future Transp. 2025, 5, 35. https://doi.org/10.3390/futuretransp5020035
Petersen M, Zuck A, Dreßler A. How Can I Find My Ride? Importance of User Assistance in Finding Virtual Stops for Shared Autonomous Mobility-on-Demand Services. Future Transportation. 2025; 5(2):35. https://doi.org/10.3390/futuretransp5020035
Chicago/Turabian StylePetersen, Malte, Andreas Zuck, and Annika Dreßler. 2025. "How Can I Find My Ride? Importance of User Assistance in Finding Virtual Stops for Shared Autonomous Mobility-on-Demand Services" Future Transportation 5, no. 2: 35. https://doi.org/10.3390/futuretransp5020035
APA StylePetersen, M., Zuck, A., & Dreßler, A. (2025). How Can I Find My Ride? Importance of User Assistance in Finding Virtual Stops for Shared Autonomous Mobility-on-Demand Services. Future Transportation, 5(2), 35. https://doi.org/10.3390/futuretransp5020035