Article

Assessment of Personal Rapid Transit System Configurations Regarding Efficiency and Service Quality

Department of Mobility Systems Engineering, School of Engineering and Design, Technical University Munich, Boltzmannstraße 15, 85748 Garching b. München, Germany
*
Author to whom correspondence should be addressed.
Future Transp. 2022, 2(3), 734-752; https://doi.org/10.3390/futuretransp2030041
Submission received: 20 June 2022 / Revised: 9 August 2022 / Accepted: 1 September 2022 / Published: 6 September 2022
(This article belongs to the Special Issue Future Mobility and Transport Applications)

Abstract

:
In order to transform cities into more liveable, safe, and sustainable places, we must shift our mobility paradigms. As one auspicious concept amongst novel intelligent transportation systems, personal rapid transit (PRT) disaggregates urban transportation into small, electric vessels that are centrally operated on dedicated infrastructure, yielding the potential to make public transit more convenient, affordable, and sustainable all at once. In light of this, we examined the potential performance of PRT in a medium-sized German city. Utilizing the traffic simulator SUMO, as well as a specifically developed open source mobility scenario consisting of infrastructure and travel demand, we assessed the level of service and efficiency. We found that a fleet of 30 vehicles can serve the mobility demand of the chosen city while passenger waiting times are guaranteed to stay below three minutes. Vehicle occupancies can be doubled when coordinating vehicles between stations instead of letting them idle randomly. Furthermore, our results show that different combinations of system designs and operating strategies succeed in meeting typical performance requirements—for instance, an operating strategy where unoccupied vehicles idle randomly can effectively compensate for a reduced fleetsize. Depending on the preliminaries of specific cities, such as the availability of space, travel behavior, political background, or acceptable investment and operational costs, a matching transportation system can be designed around the quantitative findings obtained in this study.

1. Introduction

Recent developments require fundamental shifts in the way we transport persons and goods in cities. Environmental aspects such as air pollution or greenhouse gas emission catalyzed by sociodemographic trends leading to increased urbanization call for new mobility concepts. Although approaches such as gradual electrification or the launch of small-scale sharing offerings pose a promising and practicable solution for the mid-term future, they ultimately do not suffice. In order to transform cities into more liveable, safe, and sustainable places, we must shift our mobility paradigms. PRT poses a promising solution for the future of transportation. PRT is based on small electric vehicles with a capacity of two to six persons that operate on demand and are centrally organized on dedicated infrastructure, grade-separated from any other traffic, with speeds of up to 60 km h−1 and capacities of up to 10,000 passengers per hour [1,2,3]. The highest comfort and privacy are achieved by assigning vehicles to single users or groups of users on demand. The trip times are short as there are no intermediate stops between the origin and destination of a trip and there is no inference with other traffic. Through the omission of staffing costs for drivers as well as significant reductions in capital expenditures for infrastructure compared to light rail transit (LRT), the launch and operation of PRT systems is financially attractive for municipalities and fares can be kept low [4]. Grade-separated guideways can either be achieved by elevating them or by repurposing existing road infrastructure by erecting separations. Both options yield noteworthy amounts of flexibility regarding installation requirements (curvatures typically less than 10 m [4]), as well as the possibility of an extension of the network at a later point in time [5].
The general idea of PRT dates back to 1964 [6] and the aforementioned variety of potential merits is well known. However, only a handful of systems are operational today and the concept’s breakthrough has not yet happened as many projects are disregarded due to uncertainties concerning this new technology, flawed designs, skyrocketing development costs, political issues, or regulatory hurdles [4,7,8].
Within the last decades, circumstances have changed drastically. Major technical advances such as the advent of autonomous vehicle (AV) or the widespread availability of fast wireless communication combined with a societal awareness of the necessity to implement more sustainable transportation systems have created a starting position better than ever for PRT. Therefore, this work opts to provide insights into PRT technology by utilizing state-of-the-art methodology and parameters. Utilizing the traffic microsimulation Simulation of Urban Mobility (SUMO), we conducted a case study for the city of Bad Hersfeld in Germany. We set up a simulation allowing for the automated variation of multiple parameters defining the system components infrastructure, vehicles, and operations. We thereby relied on an open source simulation scenario. The novelty and contribution of this study is a comprehensive analysis of a variety of PRT system parameters and their interconnections, including infrastructure and operational organization. This analysis was conducted using a real-life case study. In contrast to previous studies aiming to find the singular best overall solution for a respective problem, we show that comparable results regarding efficiency and service quality can be obtained utilizing different configurations (e.g., number of vehicles vs. number of berths at stations). While trends such as the proportionality of the vehicle number and quality of service are known, our results shed new light on the topic by quantifying them within a typical application scenario. The produced findings allow for a better understanding of the complex transportation system, yielding a large number of input parameters regarding vehicles, infrastructure, and operational organization, and serves as a basis for future research.
The remainder of this article is structured as follows. First, Section 1.1 provides a comprehensive overview on PRT literature. Section 2 gives an overview of the considered case study with all facts relevant to the design and evaluation of a PRT system for Bad Hersfeld, Germany. Subsequently, a simulation environment for the modeling of PRT systems based on the existing SUMO simulator is introduced in Section 3, before Section 4 presents the obtained simulation results for a variation in possible system design parameters, including variations in the fleet size and operational strategies. This work is concluded by a discussion and conclusion on the matter in Section 5.

1.1. Related Literature

As PRT research has been ongoing for over five decades, there is extensive literature with differing focuses. Our goal in this study is to gain insights into the manifold interactions of PRT system parameters, including, e.g., infrastructure, fleet composition, and operational strategy. We conducted a case study to demonstrate the applicability of the results. In order to allow for a substantiated understanding and placement of the present study, we provide a comprehensive literature review, including case studies, investigations of specific components, and economic as well as comprehensive system analyses.
Different authors conducted case studies examining the feasibility of such concepts in specific environments. Those studies usually provide an overview of the cost and system performance. However, case studies focus on one single system configuration (usually the proposed system of a company) with singular adaptions, e.g., fleetsizing, and do not vary parameters such as the operational organization. Castangia et al. [9] simulated a PRT system for the whole Middle Eastern city of Masdar, which was designed on the drawing board. They developed a suitable concept mainly focusing on the level of service, which was eventually implemented. A case study on PRT at the harbor area of Rotterdam was conducted by Li et al. [10]. By means of a cost-effectiveness analysis, they optimized the trade off between the customer waiting time and system costs. Four municipalities in the San Francisco area recently conducted a comprehensive analysis on the feasibility of PRT [11]. They developed a conceptual system based on the product of Glydways, which they examined in detail with respect to technology readiness, scalability, costs, and return on investment. Among the study’s results, the authors named environmental sustainability and cost effectivity as well as congestion relief. Muller et al. [12] directly compared PRT to LRT. The PRT system outperformed the existing LRT solution regarding the level of service and trip times, as well as capital and operational costs, which could be fully amortized by fare-box revenues. In a report for the New Jersey Department of Transportation [13], the results stated that PRT could potentially improve the quality and quantity of public transport (PT) services while reducing the costs, congestion, and environmental impact. However, major challenges to its implementation, such as a lack of engineering experience and expertise, open technology development, and missing standards, were identified. In another study on the viability of personal rapid transit in New Jersey [14], a demonstrated full-scale deployment was identified as the missing piece to showcase the benefits of PRT, conduct further research, and establish technology readiness. They estimate the costs as USD 50–100. Sarkar and Jain [15] utilized inputs in the form of demand, operational, and financial parameters in order to perform a sensitivity analysis, assess the financial viability of projects, and benchmark their approach on data from Amritsar and Trivandrum. Singh and Gupta [16] critically reviewed the ability of PRT to solve present challenges in urban mobility, such as the sustainability, congestion, road safety, and economic viability of PT systems. They concluded with the recommendation of deploying PRT as a feeder for longer distance modes of transport, such as railways.
Another large branch of publications aims to develop optimal solutions to particular system components, such as stations and intersections, operational organizations, such as vehicle assignment or empty vehicle management; as well as vehicle development. Arslan et al. [17] identified the main guideway capacity and fleetsize, as well as station capacity, as key elements for the capacity of PRT systems. Using the microscopic traffic simulation Vissim, they investigated a total of five station layouts, respectively, with different parameters, such as the number of berths. They found that serial station designs yield the highest capacity despite their comparatively simple concept. Another analysis of station capacity was conducted by Schweizer et al. [18]. The authors compared serial and sawtooth configurations and provided specific recommendations for different space constraints and demand scenarios. Lowson [19] examined the throughput of PRT stations under peak demand conditions by researching the UlTra PRT system at London Heathrow. He concluded that, with an optimized design, a five-berth station can serve up to 600 vehicles hourly. Grabski and Daszczuk [20] identified the network structure, maximum velocity, and number of vehicles as key elements that decide the capacity of PRT. Their goal was to quantify the impact of intersection priority rules on the passenger waiting time, which they used as a metric for the overall system capacity. Their results showed that intersection management is relevant in congested conditions. Shiao et al. [21] presented a technical implementation of vehicle-to-vehicle communication specific to PRT vehicles used to realize cruise control and merging. Operational organization was proven to be important in centrally controlled vehicular systems. Schweizer et al. [22] developed a method to route empty and occupied vehicles in a PRT based on linear programming models. They proved how their method is useful when trying to identify network bottlenecks by benchmarking it with a microsimulation. An optimal heuristic for empty vehicle management in the specific case of PRT was also investigated by Daszczuk [23]. Their solution can be applied to further applications in transport systems, such as the matching of vehicles and requests or making space for arriving occupied vehicles. Vehicles themselves have been thoroughly studied as well. Kozowski et al. present a multi-body simulation used to perform parametric sensitivity analysis [24], as well as a specific recommendation on the development of vehicles with rubber tyres running on dedicated guideways [25]. The interactions of PRT vehicles and the infrastructure was modeled and simulated in depth by Choromanski et al. [26]. They derived concrete requirements for vehicles, as well as guideway infrastructure. A system optimal for covering distances too long to walk but too short to use motorized modes of transport in the form of PRT is presented by Hollar et al. [27]. They described how they developed the effective and low-cost automated transport solution, including detailed solutions for navigation, collision avoidance, and further mechanical parts of the vehicle and guideway. Others emphasize the cost assessment of PRT or PRT systems, as well as business models suitable for the concept of the system. Mittelman et al. [28] performed a detailed techno-economic analysis of PRT, focusing on capital costs as well as operating costs based on tractive, auxiliary, and parasitic energy requirements. They calculated an energy consumption of 0.08kw h per person-kilometer and energy costs of USD 0.031 per person-kilometer. Focusing on possible business models specifically suitable for the characteristics of PRT, Liu et al. [29] presented a detailed review. The authors identify several relevant stakeholders that must be accounted for: local authorities, operating company, technology developer, supplier, infrastructure supplier, managing consultants, and, finally, the government, all of whom are important in this complex kind of private–public partnership. Tahmasseby and Kattan [30] identified PRT as a prospectively sustainable transport solution due to its low energy consumption and noise pollution, and therefore conducted a comprehensive comparison of the system with gondolas in Vissim. They calculated the business cases for a span of 30 years and found that the examined systems differed widely in terms of their capital cost, maintenance and operating cost, capacity, and their anticipated benefits. Literature assessing PRT systems in a broader context serves as a foundation of the present study. Leveraging state-of-the-art simulation approaches, authors managed to produce valuable insights into techno-economic aspects of PRT transportation systems. Aiming at developing a comprehensive, common benchmarking scheme for PRT, Mascia et al. [31] introduced key performance indicators, such as vehicle utilization, the traveled distance, and the level of service (waiting time and delays), and used them to analyze system parameters such as the fleetsize and headway between vehicles. These can be used to design future transportation systems. Concrete benchmarks for evaluating PRT systems were introduced by Mieścicki and Dszczuk [32]. These were presented in the form of three specifically defined systems that can be used to evaluate the performance of, e.g., algorithms for operational organization (empty vehicle movement, etc.). Developing their own discrete-event PRT simulation model, Müller and Sgouridis [33] managed to estimate the impact of different vehicle allocation algorithms, charging strategies, and vehicle occupancy rates, as well as system behavior in peak load scenarios. Their tool helps in evaluating various assumptions and system designs. El Ayashe et al. [34] used a simulative approach and indicators such as the average waiting time, percentage of people who have to wait for a vehicle, and the occupancy rate to find the parameters that have the biggest impact on the system performance. They identified the vehicle speed and ridership as key factors.

1.2. Research Motivation and Objectives

In the previous paragraph, we provided an overview on existing literature investigating PRT. Related literature can be clustered into four groups: case studies looking at specific systems in specific conditions, work on the optimization of particular system components such as stations or intersections, studies emphasizing the costs of the novel transportation systems, and, finally, studies analyzing PRT in a broader, generalized context. We consider our work to belong to the latter, even though our analysis is based on a case study. We do not aim to develop or present a new transportation system but to provide numerical insights into the effects of different parameters applicable to most PRT systems, independent of their respective final technical designs, which have previously been studied isolated from each other. Although the analysis of specific technical solutions is necessary in order to develop innovative mobility systems and to finally bring them to the market, we believe that it is equally beneficial to establish a broad understanding of a system’s qualities and characteristics in order to facilitate its real-world implementation. We therefore present a generic simulation framework and method for an analysis for said systems. Our goal in this study is to gain insights into the manifold interactions of PRT system parameters, including, e.g., infrastructure, fleet composition, and operational strategy. We conducted a case study on a realistic scenario to demonstrate the applicability of the results and decorate our findings with tangible numbers.

2. Case Study

This work analyzes PRT system designs using a practical case study that is motivated by expected traffic changes in the city of Bad Hersfeld in Hessen, Germany. This section provides a description of this case study with regard to the study area and overall scenario (Section 2.1), the expected travel demand to be met by the system (Section 2.2), and the employed PRT graph (Section 2.3) as considered in the subsequent simulation.
The present study was conducted based on an open source scenario by DLR [35] and an own extension that is also publicly available [36].

2.1. Study Area and Scenario
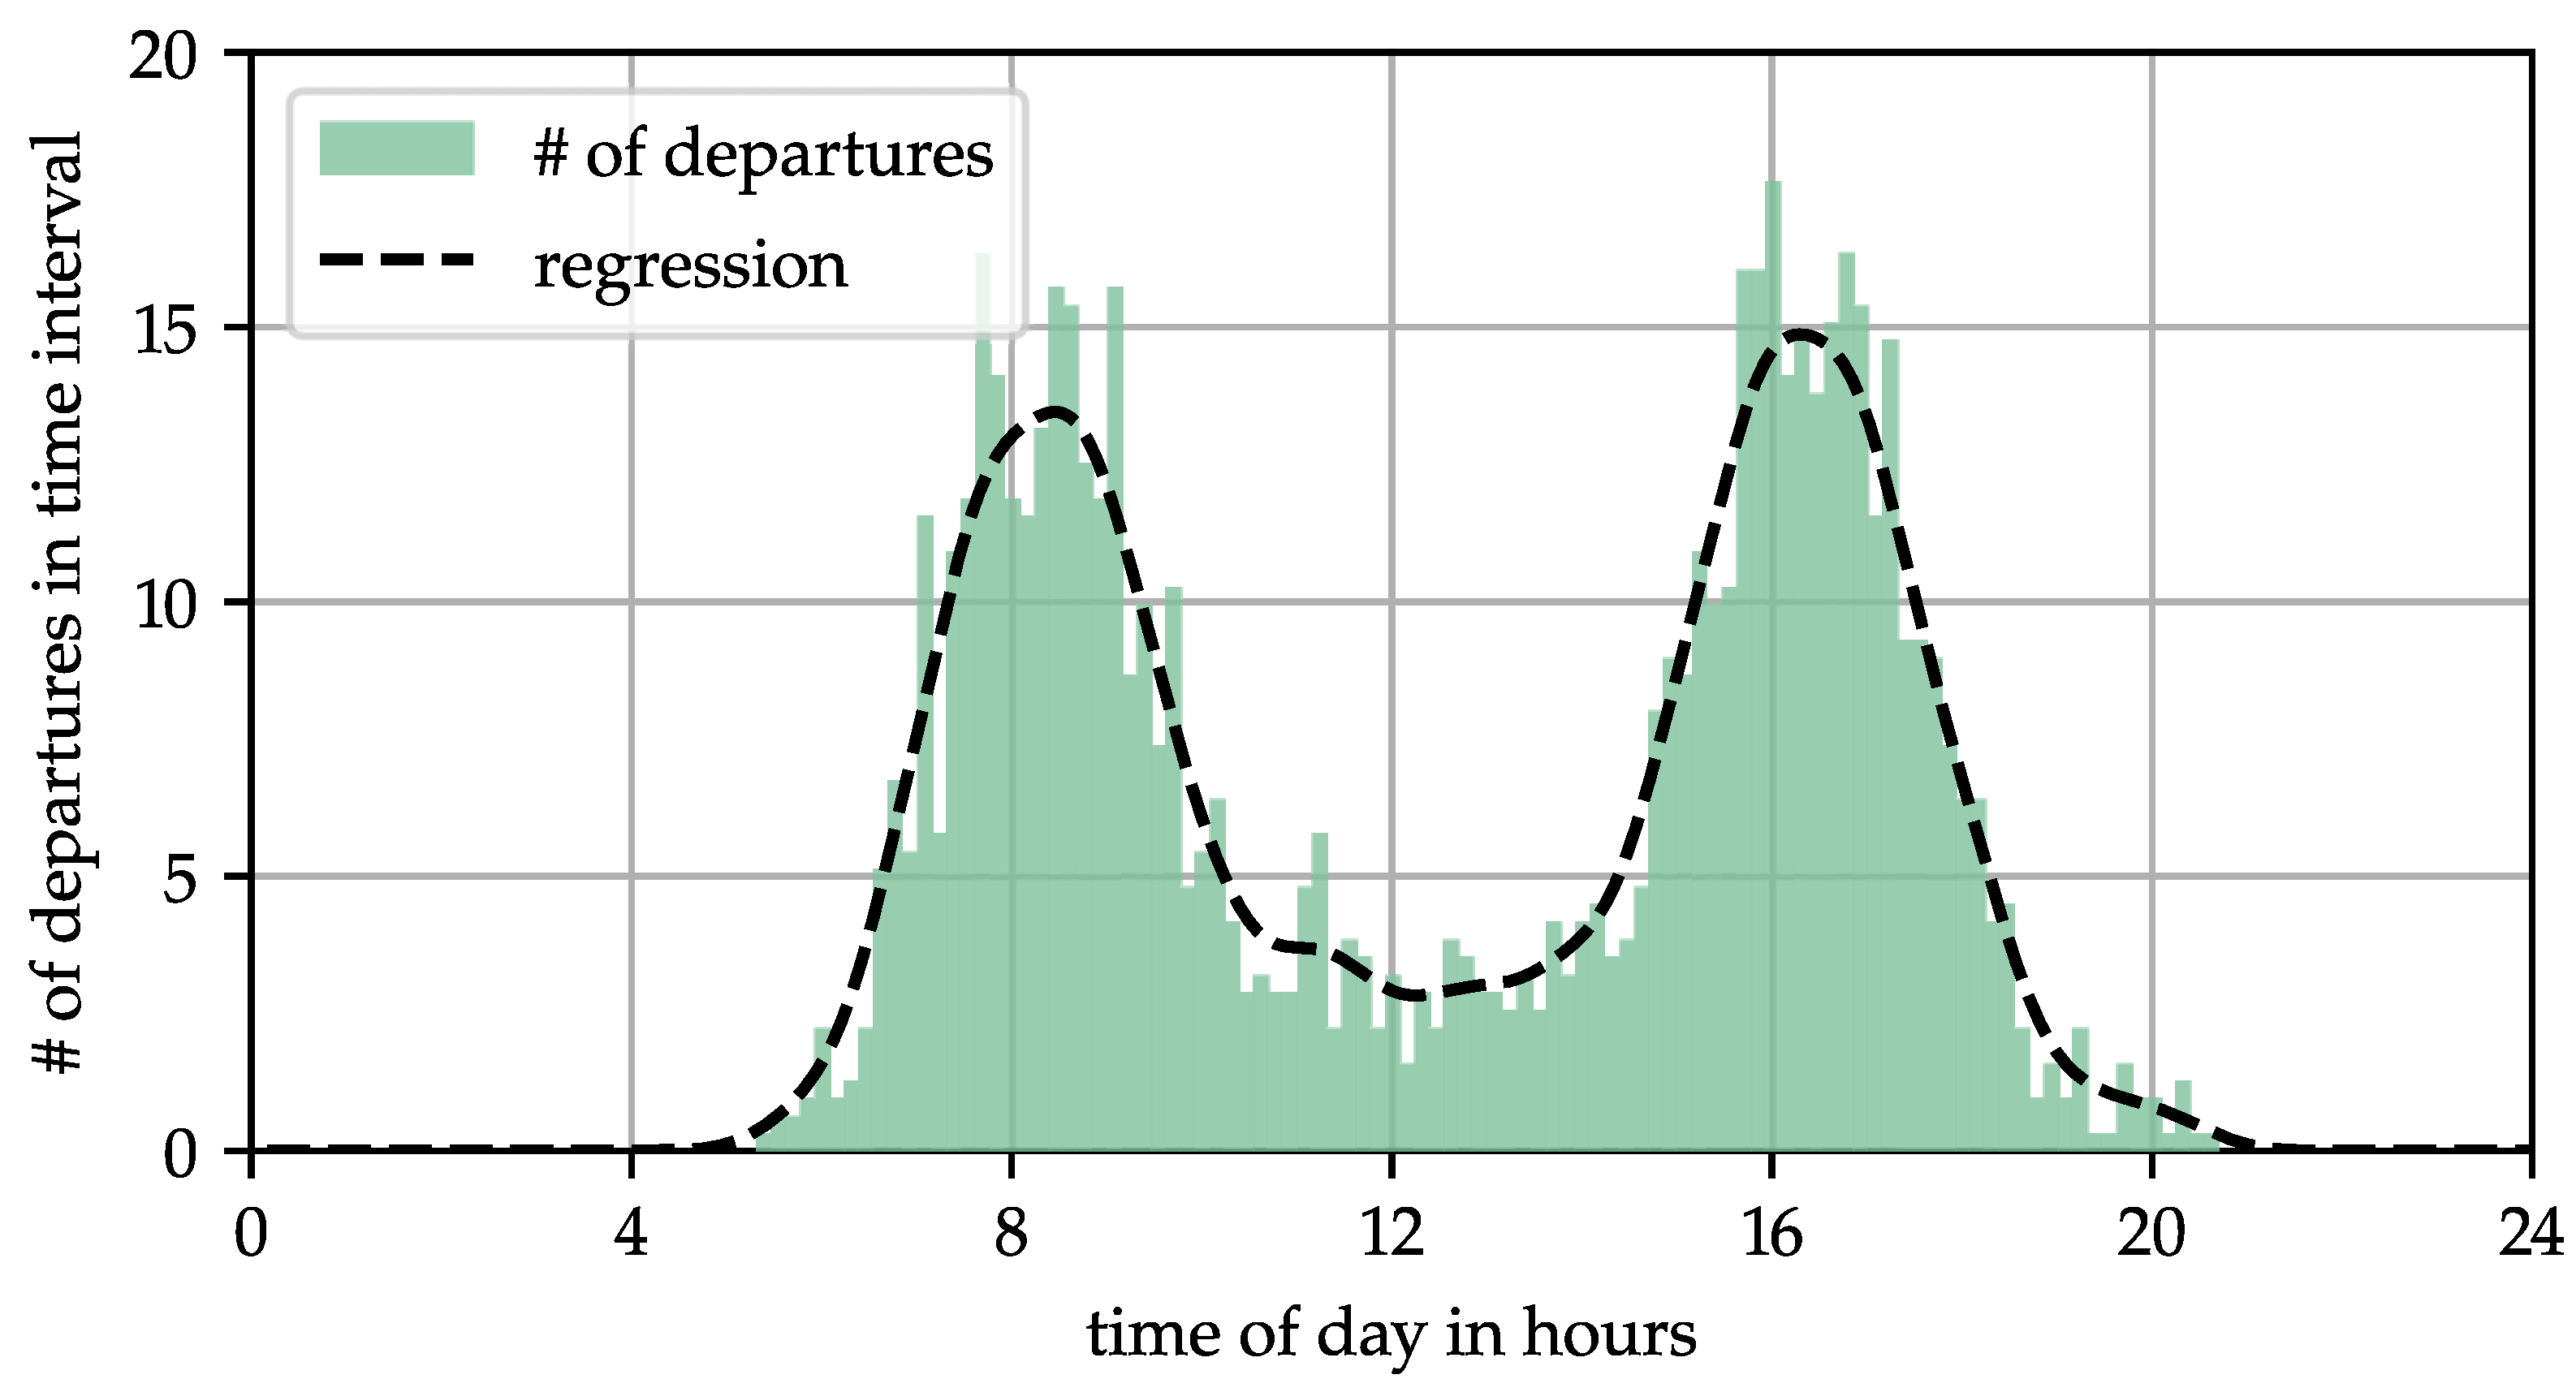
Bad Hersfeld is a medium-sized city located in the center of Germany. It houses approximately 30,000 residents and its surroundings are of a mostly rural characteristic. Despite its comparatively small size, Bad Hersfeld is an important regional center for the surrounding smaller villages and cities. Among other factors, its regional hospital attracts traffic from inside and outside Bad Hersfeld and makes the study region interesting from a transportation engineering perspective. This case study was especially motivated by the planned expansion of the local hospital, which is expected to bring increases in traffic volume of up to 40% [37]. One possible solution to the new situation is posed by PRT, which is considered due to its potential to provide a high-capacity public transport with a high level of service at attractive capital and operational costs. Hence, the meaning of this case study is twofold: first, a possible design solution for Bad Hersfeld was developed and analyzed and, second, general system designs and parameters, as well as their interdependencies, were evaluated, shedding light on similar PRT system designs in a prototypic way.

2.2. Travel Demand

The expected travel demand for this case study was based on works by DLR (Deutsches Zentrum für Luft- und Traumfahrt) as a part of the traffic scenario for Bad Hersfeld [35]. Using the activity-based multi-modal scenario generator SAGA [38], travel patterns specific to PRT on a working day were developed based on the existing and forecasted population and mobility needs. The travel demand consists of employees and visitors of the hospital and accounts for 2024 trips over the course of 24 h. The temporal distribution of trips can be seen in Figure 1. Due to the setup of SAGA, each trip has a corresponding return trip, meaning that there are no secondary activities leading to chained trips. The spatial distribution of the total demand in the form of an origin destination matrix (ODM) is shown in Table 1. The average in-vehicle trip time is 145 s for an average distance of 1630 m , leading to an average speed of 40.5  km h−1. The total distance covered by customers over the course of 24 h amounts to 3300 k m .

2.3. Station Locations and Graph of the Network

In order to serve the expected additional traffic demand due to the extension of the hospital, suitable locations for the PRT stations have to be found. In consultation with the city of Bad Hersfeld, four places for stations were chosen. In addition to one at the hospital itself, there is one next to the train station of Bad Hersfeld in order to realize an easy access to the hospital by public transport. A third one is placed in the north of the city, mainly for people traveling to Bad Hersfeld by car. The last station is near a local park called “Schildepark” in the inner city. The graph implemented in SUMO additionally contains a depot next to the station Schildepark. This depot was utilized as a parking space in the simulation and would, in practice, be used as a workshop and charging facility.
During the design process of the network topology connecting the four stations, two contradicting objective functions were taken into account. The total length of the network was supposed to be minimized, as well as the average traveling time of the customers. As aforementioned, PRT infrastructure can be implemented by repurposing streets or setting up elevated guideways. In both cases, it is reasonable to assume already existing streets for cars, bikes, or pedestrians as potential installation space. In order to optimize the graph of the guideways, a multi-commodity flow problem was developed based on the formulation from Zheng et al. [39]. The respective result was collaboratively modified in an iterative process with the city of Bad Hersfeld to incorporate specific properties of the city that are not modeled in the optimization problem. The final network topology, realized in SUMO, can be seen in Figure 2.
The average distance between two stations is 1.9   k m . Due to the single-lane tracks, the distance between some stations is quite large. The largest one is the track length from the station in the north to the train station with 3.4   k m . In contrast, a vehicle drives only approximately 520 m from Schildepark to the train station.

3. System Simulation

The subsequent section describes the methodology developed and used to conduct the simulation study. We used the microscopic, open source traffic simulation Eclipse SUMO developed by DLR [40,41]. The simulated system consisted of three main components: vehicles, infrastructure, and operations. Those three components, as well as the considered parameterizations, are described in the following paragraph. We evaluated the performance of the configurations resulting from fully factorial combinations of the aforementioned parameters using a specifically modeled synthetic travel demand spanning over a full day.

3.1. Vehicles

The microsimulation of vehicles consists of two main parts: the definition of static vehicle parameters, as well as the car-following model determining the dynamic behavior of the vehicle within the simulation. The parameters used in our simulation are listed in Table 2. The values represent a combination of requirements by ASCE’s APM Standards [42] and values used in previous studies [18], as well as practical figures from existing systems [11]. All PRT vehicles were equipped with SUMO’s taxi device in order to facility the on-demand functionalities [43]. We did not consider ride-sharing, meaning that the vehicles did not make detours or stop to pick up further customers besides the one initially on board. As per the definition of PRT, we assigned a personal vehicle to each person. In practice, each simulated person could also be a group of up to four persons, which is the seat capacity of current PRT vehicles [44,45,46].

3.2. Stations

We approximated the stations as well as the process of boarding and alighting by combining existing components of SUMO, such as bus stops and parking areas. Neglecting the in-detail simulation of different station layouts is reasonable under the assumption that the demand in our scenario constantly stays below worst-case station capacities. PRT station capacities range between 400 and 900 persons per hour [17,18] and therefore exceed the present demand significantly at any time.
The underlying station scheme is similar to previous implementations in SUMO [48]; however, utilizing recently introduced standardized elements is novel and greatly simplifies the simulation process. As depicted in Figure 3, the stations in our simulation consisted of two PT stops, respectively, for arrivals and departures, as well as parking areas in between.
The simulation setup developed for this case study [36] extends an existing open source simulation scenario published by DLR [35], which includes a refined road network of Bad Hersfeld exported from open street map (OSM). The stops are connected to this network exported from OSM via access lanes. This solution allows for the embedding of arbitrary transportation networks without risking interference with exported networks that might occur when, e.g., joining junctions. We left the specified number of berths within the simulation constant over the course of the full factorial simulation to avoid adjustments of the PRT network between simulation runs, but controlled the maximum number of vehicles that were allowed to stop at respective stations using SUMO’s Python interface TraCi [49]. The boarding time was set to 20 s and alighting time to 10 s via the taxi device of the vehicles. Those times exceed the estimates by Schweizer et al. [18], and therefore can be seen as a pessimistic assumption.
Besides stations, the network contained one depot where vehicles could be parked in case they were not needed within the system.

3.3. Merges

By definition, zipper merges are the only type of intersection to be present in a PRT network. This requirement arises from minimal inter-vehicle headways, which are necessary to provide high-capacity transportation systems, as, e.g., four-way intersections, would require a portion of vehicles to stop and cause queues. SUMO allows for the modeling of the PRT merges using its preconfigured intersection type zipper. Dedicated merging control algorithms are potentially necessary once operating at the capacity limit of the network. However, this situation did not occur in the present study due to the underlying demand patterns. Such algorithms can be found within the simulation framework that we published [36] and can be deployed in case of different demand scenarios.

3.4. Fleet Organization/Operation

Fleet operation and organization defines how the vehicles move on the given infrastructure and is, therefore, a key element of an efficient transportation system. Our approach incorporated multiple parameters that are defined and explained in the following paragraph.

3.4.1. Fleetsize

The number of vehicles deployed as part of a transportation system is a key component as it will influence various decisive factors, such as capital costs and the level of service [50]. There are various algorithmic solutions aiming to find the optimal fleetsize for a PRT system [4,51,52,53]. However, we chose a different approach, as optimizing the fleetsize a priori requires us to specify most or all other system parameters beforehand, and, therefore, interactions of said variables cannot be investigated. Instead, we introduced the fleetsize as a variable simulation parameter in order to explore interactions with the other system attributes. Upper and lower boundaries of, respectively, 50 and 15 vehicles, were set empirically and were later verified when analyzing the simulation results.

3.4.2. Dispatching

Matching vehicles to waiting customers is another important aspect of fleet operation as it influences waiting times as well as the operational efficiency [54]. Whilst complex solutions potentially yield improvements in said quantities, they also increase the complexity. Relatively simple heuristic approaches have proven to have a comparable performance under a variety of circumstances [55] and were, therefore, used in the present study. Specifically, two well-analyzed heuristic solutions [56] were used in our simulation:
  • nearest idle taxi (NIT): new requests from customers are assigned to the closest vehicle in a first-in-first-out manner. Implemented in SUMO under the designation greedy [43].
  • nearest open request (NOR): vehicles becoming idle are assigned to the closest open request. Implemented in SUMO under the designation greedyClosest [43].

3.4.3. Empty Vehicle Movement

Once vehicles have dropped off their customers, they either continue to the next waiting customers—in case there are any—or need further instructions on where to go before they are assigned to the next customer. Empty vehicle movement significantly affects key indicators, such as the customer waiting time [57]. We examined a variety of heuristics applicable to PRT systems:
  • random idling (RI): vehicles drive around the network randomly until they are assigned to the next customer (implemented in SUMO [43]).
  • go do depot (GTD): vehicles park in the depot in case they are unassigned.
  • park closest + random idling (PC+RI): vehicles park at the closest station that provides available parking berths. In case all berths are occupied, vehicles will idle randomly.
  • park closest + go to depot (PC+GTD): Vehicles park at the closest station that provides available parking berths. In case all berths are occupied, vehicles go to the depot.

3.5. Simulation Parameters

We aimed to obtain comprehensive insights into interactions of PRT system configurations by varying the parameters described in particular above fully factorial. The parameters and the respective values for the simulation are gathered in Table 3.

3.6. Evaluation

We utilized two main indicators common in the analysis of transportation systems in order to evaluate all configurations [28,31,34]. Due to its importance in mode choice, the customer waiting time was chosen as the first central performance indicator. The waiting time is an extremely important predictor of transit use and has bigger impacts in mode choice than costs [58]. We solely investigated the measured waiting time in order to obtain objective results; however, it is worth mentioning that the perceived waiting time in transportation is even longer and, therefore, increases the importance of the factor further [59]. We defined waiting time as the time passing between calling a vehicle and boarding said vehicle.
The second central indicator used in the present study was the occupancy of vehicles. Occupancy is an important metric that yields insights on service profitability as well as system efficiency [54]. We utilized the distance covered by the vehicles and calculated the occupancy by dividing the driven distance with a passenger on board by the total distance that the vehicle has driven over the complete simulation run.
o c c u p a n c y = d i s t a n c e o c c u p i e d d i s t a n c e t o t a l

4. Results

The following section presents the obtained simulation results for a fully factorial variation in the aforementioned parameters and the presented performance indicators. For the respective visualizations, results of specific parameters can be combined (values are averaged) where needed; hence, the number of data points varies depending on the degree of aggregation. Where applied, regression lines are produced using a one-dimensional Gaussian filter.

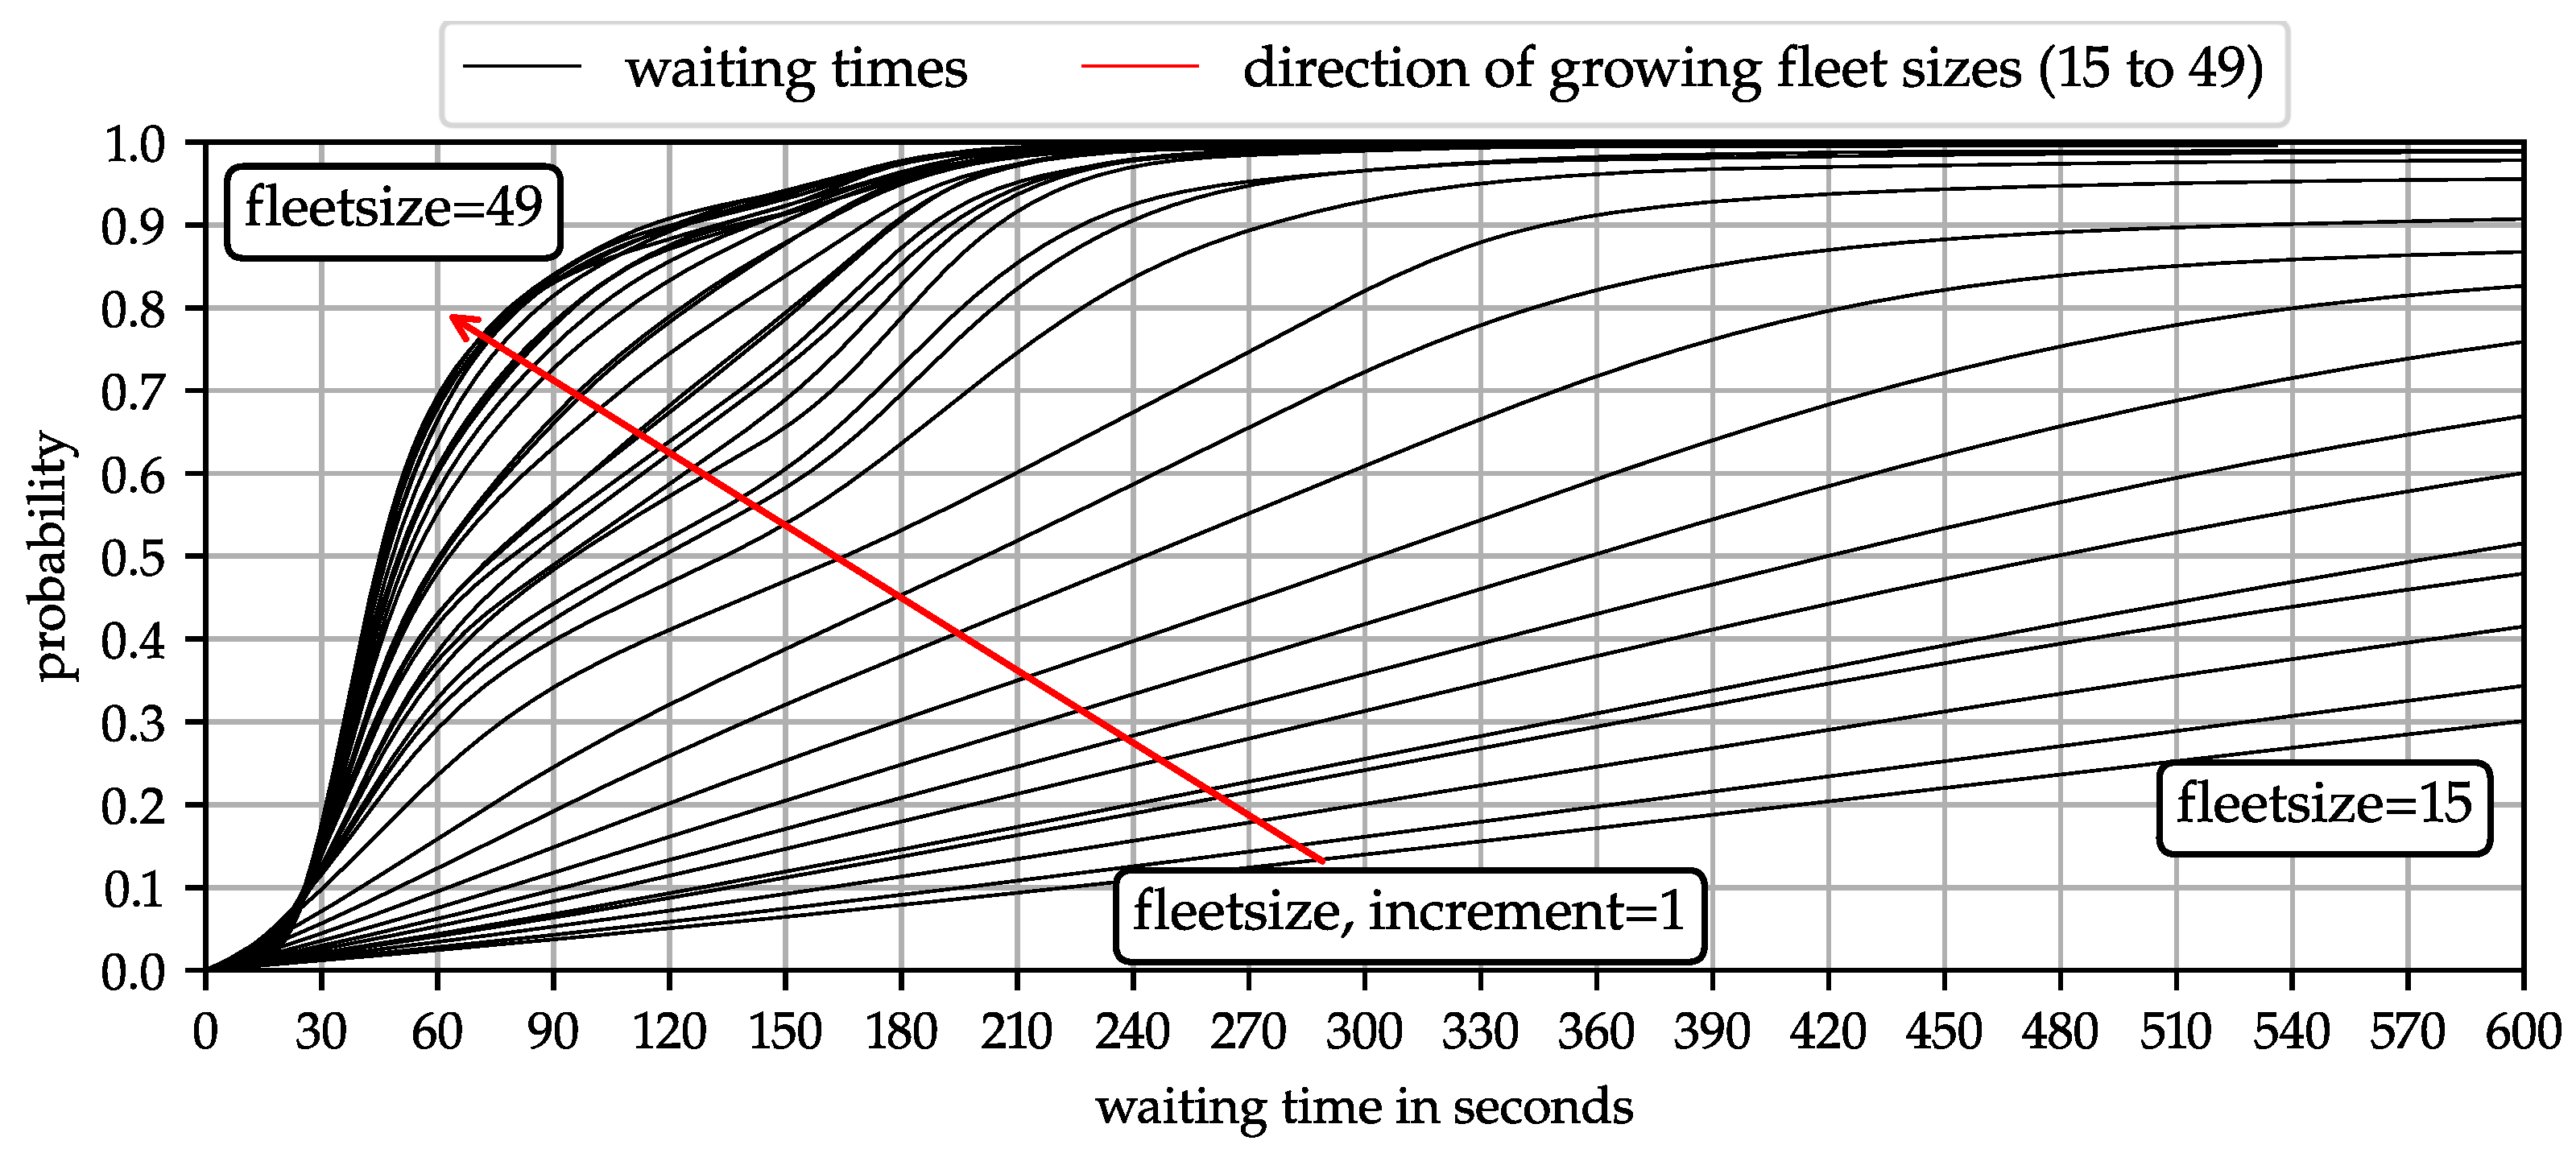
4.1. Fleetsize Effects on Customer Waiting Time

Figure 4 shows the cummulative distribution function (CDF) of customer waiting times for all examined fleetsizes. As expected, the waiting time is generally inversely proportional to the fleetsize, meaning that customers face shorter waiting times with increasing numbers of vehicles. When the fleetsize is small and the average waiting time amounts to several minutes, the relation of the fleetsize and waiting time is linear. Once a certain threshold is reached, an increase in the vehicle number does not yield any further decrease in the travel time. For the present simulation, this point was reached once the 95th percentile of customers waits less than three minutes, which can be achieved with 30 vehicles. Regarding the correlation of the fleetsize and waiting time for vehicle numbers above this threshold, a logarithmic curve occurs. The curve flattens significantly around the 85th percentile of travelers. Deploying a large fleet therefore becomes more important when the mobility service operator aims to guarantee shorter waiting times. In cases where longer waiting times are occasionally acceptable while the majority of customers still experiences a high level of service, a significant smaller amount of vehicles will suffice.
Whilst the finding that a larger fleet benefits the level of service for the user mostly confirms expectations and underlines them with quantities, further insights can be found in the data. In order to quantify the effect of increasing the number of vehicles, we analyze its marginal utility, which is defined as:
m a r g i n a l   u t i l i t y = Δ t w a i t i n g Δ f l e e t s i z e
Looking at the resulting curve in Figure 5, it becomes evident that increasing the number of vehicles is only useful to a certain threshold, after which service quality does not increase any further. Before said threshold, utility decreases roughly linearly. Knowing the course of the graph allows to define an optimal fleetsize for a given scenario.

4.2. Operating Strategy and Fleetsize

The full factorial simulation yields a large amount of differing configurations, which are plotted in hindsight of the occupancy and average waiting time in Figure 6. The respective individual configurations are colored by fleetsize bins of five and each empty vehicle behavior is marked with a different symbol. The parking capacity is not considered in this visualization as the results of the different numbers of berths are averaged here for better comprehensibility.
Regarding the first metric, occupancy, the superiority of strategies without random idling is well visible. Both strategies belonging to said category (PC+GTD and GTD) achieve occupancy values of around 50%. The reason for the ceiling regarding occupancy is to be found in the asymmetric structure of the demand. Employees will travel to (from) the hospital in the morning (evening) but only few trips with opposite directions occur during morning (evening) rush hour. The operating strategies involving random idling (PC+RI and RI) achieve occupancies that are significantly lower, partially dropping down to around 15% over the course of a full day. When the fleetsize decreases, the respective occupancies increase monotonously. However, even with very small fleetsizes, the latter group of policies fails to achieve occupancy values close to 50%. This, again, can be explained by the demand pattern, which is highly variable over the course of the day, so only looking at peak hours could yield substantially different results.
While they are not particularly efficient, operating strategies involving random idling achieve notably shorter overall waiting times. Some achieve average waiting times of merely 50 s . Keeping in mind the CDF shown in Figure 4, the majority of travelers will only face even shorter waiting times due to the logarithmic course of the graph. It is worth noting that PC+RI consistently yields shorter waiting times compared to RI.
Looking at strategies involving parking, the lowest achieved waiting times with a maximum fleetsize range at around 80 s, meaning a 60% increase compared to strategies purely based on random idling. With a reduction in fleetsize, waiting times increase drastically for both groups of strategies. To achieve the same average waiting time of 80 s, around five more vehicles are needed when parking at stations instead of idling randomly. This is an important finding as it means that the operator can achieve the same level of service with different system configurations: they could either deploy a smaller fleet and let vehicles idle randomly or utilize more vehicles but make them park at stations. A complex choice based on a trade-off between capital expenditure for vehicles and running costs arises.

4.3. Number of Berths and Fleetsize

Analyzing the data of strategies involving parking at stations yields further insights into interrelations of the parameters. Figure 7 shows the configurations’ performances regarding fleet occupancy and waiting time. Operational strategies are grouped into strategies involving random idling (RI and PC+RI) and without random idling (PC+GTD and GTD). Data points are colored by the number of berths at the stations. The regression lines through simulation runs with equal numbers of berths growing monotonously show that, for both groups of operating strategies, a larger number of berths decreases the waiting time. In case of strategies involving random idling, both the waiting time and occupancy are inversely proportional to the fleetsize. Depending on the number of berths, the courses of the graphs are approximately parallel but shifted towards lower waiting times and higher occupancies with an increased number of parking spaces. Looking at operational strategies without idling (PC+GTD and GTD), a slight decrease in fleet occupancy is visible for a smaller number of berths (note the different scalings of the vertical axes for better readability). The aforementioned decrease in the marginal utility of larger fleetsizes (Figure 5) can also be observed in this visualization as data points are dense at the smallest achieved waiting times and become sparse for longer ones. Regarding the occupancy of strategies involving idling, the course of the graph is degressive over increasing fleetsizes, meaning that there is a threshold below which a reduction in the number of vehicles will not lead to a further increase in fleet occupancy. Similar to the declining marginal utility of increased fleetsizes, the benefit of more parking berths decreases as the absolute number increases, as the spacing between regression lines shows.

4.4. Dispatching Strategy

We compared two heuristic dispatching strategies, NIT and NOR, and evaluated their effect on the average customer waiting time for the complete range of fleetsizes in Figure 8. Operating strategies and the number of berths were averaged for this visualization to allow for statements focusing on dispatching strategies.
The results show that dispatching strategy NOR outperforms NIT when fleetsizes are below the point where no further decreases in waiting time can be achieved by increasing the number of vehicles (Section 4.1). The difference between dispatching strategies is directly proportional to the waiting times, resulting in fleetsizing. For fleetsizes up to around 20 vehicles, choosing NIT instead of NOR allows the operator to use one less vehicle. However, in those cases, the waiting times are unacceptably long, amounting to far more than five minutes for rides taking around 2.5   min . Once acceptable waiting times of less than three minutes are achieved, the difference between the two dispatching strategies is marginal.

5. Summary and Conclusions

We presented an approach to modeling and analyzing PRT systems with regard to the customer waiting time and fleet occupancy using the microscopic transport simulator SUMO. Within a case study in the city of Bad Hersfeld, we varied multiple key factors defining the system, such as the operational organization and infrastructure design. The underlying demand for the city of Bad Hersfeld was obtained with state-of-the-art methodology and resembles the predicted future passenger demand caused by an expansion of the city’s hospital. We applied the developed simulation to this specific scenario in order to prove the applicability of the approach and obtain meaningful results that can be generalized in the future. We chose the level of service and efficiency as metrics, as those represent the requirements of the customer as well as those of the operator, and are established in the analysis of mobility systems. Our results show that the fleetsize is a decisive factor when designing a PRT system. While the effects on the waiting time are complex, it is evident that there is a threshold above which an increased number of vehicles does not yield further improvements regarding customer waiting times. Generally, a larger fleet becomes less efficient regarding fleet utilization. However, in many cases, there is not one optimal fleetsize, as the requirements and focus of each PRT system vary. Some might favor minimal operational costs, whereas others emphasize capital expenditures or customer satisfaction, and therefore maximize the level of service. Infrastructure, consisting of guideways and stations, is a decisive component of transportation systems. Regarding the number of berths at stations, it can be stated that a higher number of berths increases fleet utilization and decreases waiting time, and is therefore favorable for a PRT system. This is valid independent of the fleetsize. However, the effect of the number of berths is comparably small to that of operating strategies. Strategies allowing the vehicles to roam around the network when unoccupied decrease waiting times by up to 60% compared to those sending vehicles to a station or the depot when unoccupied. As a downside, the former strategies achieve significantly lower fleet utilization rates (25% compared to 50%). This drawback can be compensated by decreasing the fleetsize. Again, the aforementioned trade-off between capital expenditures of fleet acquisition and running costs becomes apparent. Overall, the results prove that, when trying to meet certain target values regarding the chosen performance metrics, similar results can be achieved with different configurations. Quantifying and understanding the interconnections of the parameters is, therefore, highly important, and should be a future research focus. The findings obtained in this specific case study can be generalized by applying the presented methodology to a variety of generic demand patterns and network structures. The key results of this study include:
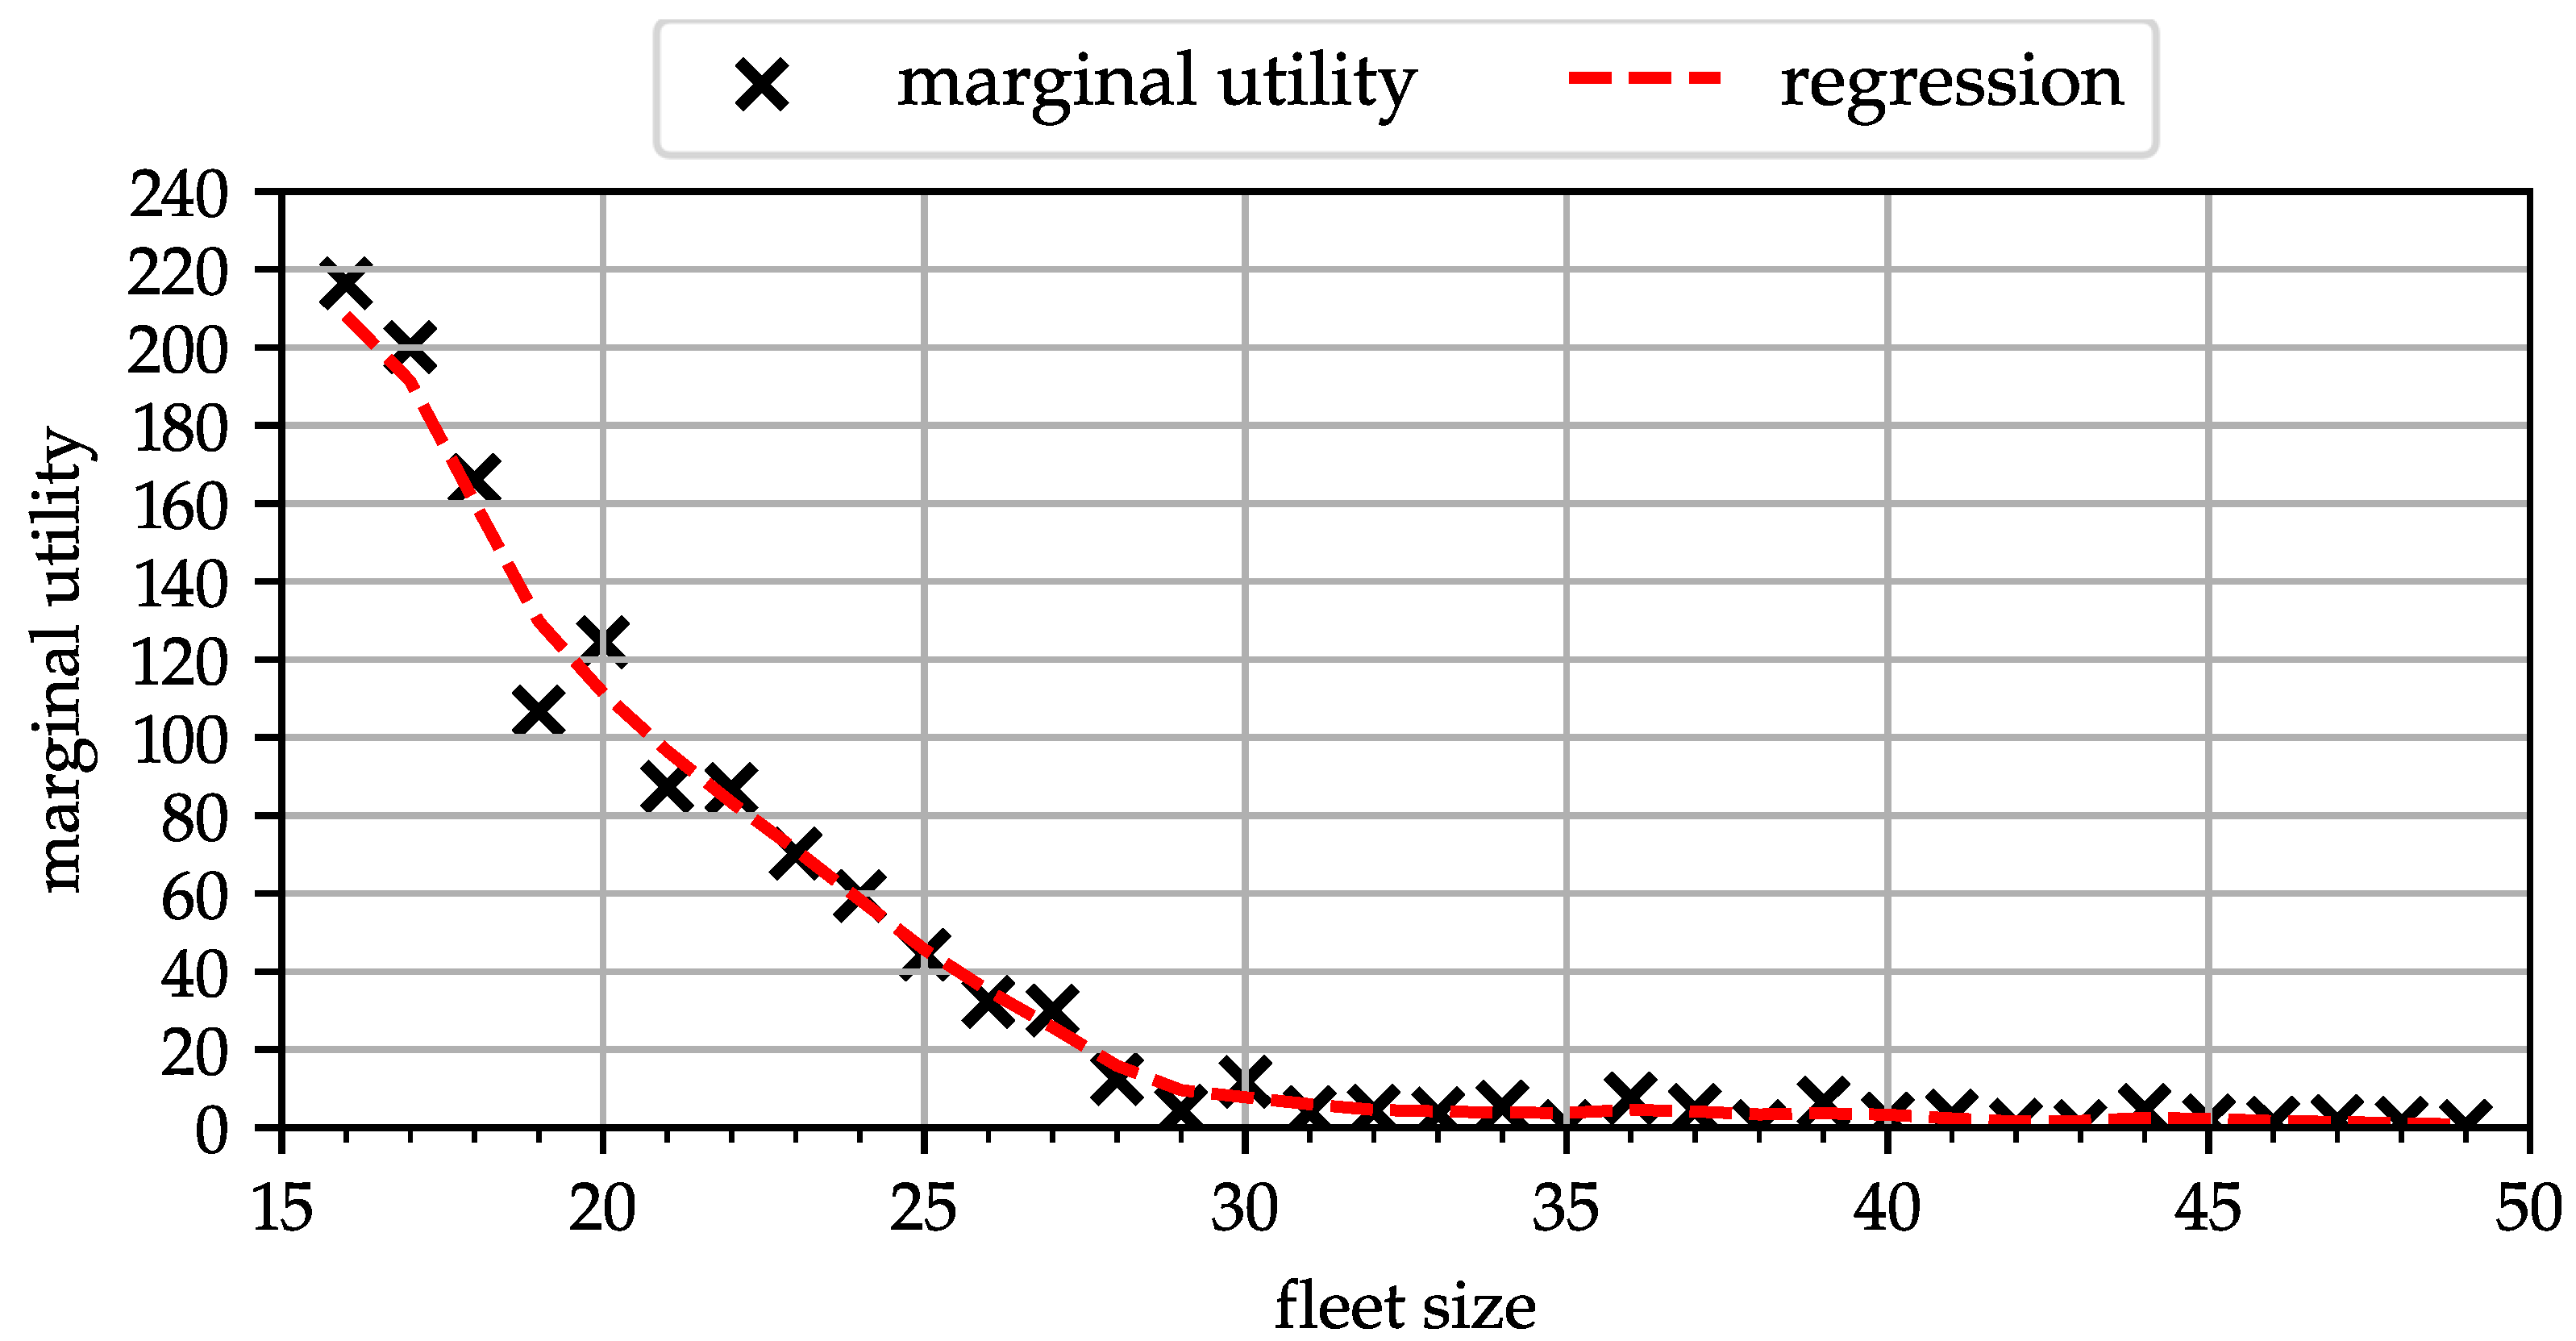
  • The benefit of increasing the fleetsize is limited. The threshold can be assessed by calculating its marginal utility.
  • The number of berths has relatively little impact on the efficiency and service quality compared to the operating strategy and fleetsize.
  • Random idling is necessary when minimal waiting times are a priority.
  • Comparable results regarding the efficiency and service quality can be achieved with different PRT system configurations with regard to the fleetsize, number of berths, and operating strategy.

6. Discussion

While we presented our methodology and results in the previous sections, this section provides a critical discussion of the validity, possible applications, and limitations, as well as advisable future research directions. With regard to the validity, our results are consistent and in line with prior research by other scientists. To the best of the authors’ knowledge, there are no contradictions between our results and those of other researchers. Our simulation was conducted using state-of-the-art, well-established open-source software. In addition, the demand dataset, which serves as a base for our simulation runs, is available open source and was published by a renowned research facility. To assess our results, we used indicators commonly applied in the research field of transportation systems.

6.1. Limitations

As our model is, inherently, a simplification of reality, there are limitations. We aimed to produce generalizable results and therefore renounced the detailed modeling of one manufacturer’s specific system. This means, consequently, that each respective system might exhibit slight deviations from our results; for example, acceleration or maximum speed values of the vehicles might differ. However, the values that we used to parameterize our simulation do not deviate far from the respective manufacturer values and we are therefore convinced that, while slight deviations might occur, the overall conclusions apply to PRT systems currently on the market or under development. The simulation itself, conducted in the proven framework SUMO, entails few limitations. One can be found in the boarding and alighting process, which we modeled statically based on a pessimistic assumption instead of a stochastic process. Moreover, we did not consider the pooling of rides. As with the nature of PRT, passengers travel alone in our model. However, numbers of different ride-hailing platforms show that pooling might be a promising approach to more efficient transportation systems, which might necessitate its consideration in future research. With regard to simulation inputs, the main limitation arises from the demand that our results are based upon. As it dictates the necessary vehicle movements in the simulation, its influence on the results cannot be neglected. While the authors expect the results to be proportionally constant in response to quantitative changes in the demand (down- or upscaling, up to capacity limits of the network), qualitative changes could lead to different results. If, for example, the asymmetric structure of the user demand was changed to be more or completely symmetric, another achievable limit for vehicle occupancy would occur. A systematic, quantitative analysis of the influence of demand structure is therefore a promising research direction. Furthermore, the given demand models an archetypal weekday. It does not include anomalies, special events, or other divergences from day-to-day mobility demand, which would change travel demand punctually (temporal and spatial). The occurrence of such deviations from normal operation could yield implications on the system design and should therefore be researched further. Furthermore, our model is limited to demand situations below the capacity limit, which is expected to be at around 10,000 persons per hour. This is due to the stations, guideways, and vehicle control. Different station designs lead to different person throughputs. Thus, stations should be modeled microscopically once an hourly number of passengers larger than that of the least performant station layout is reached. However, as our underlying demand is distinctively below said limit, we applied a pessimistic assumption for boarding and alighting times and did not model stations in detail. Regarding guideways and vehicle control, both system components must be configured to handle a constant stream of multiple thousand vehicles per hour. This requires a car-following model able to reduce inter-vehicle time gaps to as little as 0.5 s, as well as merges facilitating the seamless joining of two lanes at said inter-vehicle gaps. As our model relies on SUMO’s Krauss car-following model, as well as a junction-type zipper, we expect the simulated PRT system to be unable to reach the calculated maximum capacity. This, however, is reasonable for multiple reasons. Relying on standard SUMO elements allows other researchers to use and modify our framework. Furthermore, any demand leading to problems regarding vehicle and guideways would exceed the station’s limitations significantly. In addition, such numbers are simply unreasonable in our case as a passenger volume of 10,000 passengers per hour would mean that four times the demand that we apply over the course of 24 h ought to occur in just one single hour. Although we used the specific case of Bad Hersfeld to assess different PRT system configurations, we consider our results relevant for other cities. As PRT is, by definition, separated from other traffic, country-specific regulations and traffic conditions do not affect the system performance and a comparable solution could be built in the same manner all over the world. We consider the utilized indicators significant for arbitrary scenarios. While the concrete values of acceptable waiting times or realistic acquisition and running costs might differ in specific situations, the chosen indicators reflecting the efficiency and service quality will always be relevant. Still, our results are limited regarding monetary considerations, as we do not consider the acquisition and running cost in our analysis. Some parameters, such as the number of berths at a station, could lead to nonlinearly increasing costs and would therefore make detailed financial modeling necessary.

6.2. Future Research Directions

The present study enclosed a multitude of relevant insights for the design of PRT systems. Especially valuable is the obtained knowledge on the impact and potential of the respective parameters, as it helps to structure future research accordingly. PRT still offers a variety of directions open for further work. From our perspective, future research should focus on increasing the generalizability of the results and should therefore establish a deeper understanding of how and under which circumstances PRT systems can be built and run efficiently with the goal of creating sustainable transportation systems for liveable cities. This could, for instance, be achieved by applying the presented methodology to generic network structures, such as grids, spiderwebs, etc., and quantifying their impact and demand patterns. Furthermore, the simulation model could be enhanced in different ways; for example, by modeling the process at stations in detail or by implementing more complex dispatching strategies, such as global bipartite matching or reactive and predictive rebalancing strategies. Varying demand patterns as well as vehicle and infrastructure parameterizations could also bring further insights. The range of performance indicators could be increased; for example, by energy consumption or operational costs. The cost for right of way for guideways as well as stations should be considered in the form of internal and/or external costs, as it is a highly complex topic and is expected to impact a PRT system’s feasibility significantly. This could finally lead to a holistic assessment of the complete system.

Author Contributions

The authors acknowledge F.G. as the first author of this paper. Conceptualization, F.G., F.N., L.A.; methodology, F.G.; software, F.G.; validation, F.G.; formal analysis, F.G.; investigation, F.G.; resources, F.G.; data curation, F.G.; writing—original draft preparation, F.G., F.N., L.A.; writing—review and editing, F.G., F.N., L.A.; visualization, F.G., F.N. and L.A.; supervision, L.A.; project administration, F.G.; All authors have read and agreed to the published version of the manuscript.

Funding

This research received no funding.

Data Availability Statement

Publicly available datasets were analyzed in this study. This data and according simulation tooling can be found under the following addresses: https://github.com/DLR-TS/sumo-scenarios/tree/main/BadHersfeld; https://github.com/TUMFTM/sumo-prt (accessed on 19 June 2022).

Acknowledgments

The simulation in SUMO presented in this study was conducted with the technical expertise of Michael Behrisch of DLR.

Conflicts of Interest

The authors declare no conflict of interest.

Abbreviations

  • The following abbreviations are used in this manuscript:
AV   autonomous vehicle
CDF   cummulative distribution function
GTD   go do depot
LRT   light rail transit
NIT   nearest idle taxi
NOR   nearest open request
ODM   origin destination matrix
OSM   open street map
PC+GTD   park closest + go to depot
PC+RI   park closest + random idling
PRT   personal rapid transit
PT   public transport
RI   random idling
SUMO   Simulation of Urban Mobility

References

  1. Edward, A.J. Fundamentals of Personal Rapid Transit; Boston University: New York, NY, USA, 1993. [Google Scholar]
  2. Irving, J.H. (Ed.) Fundamentals of Personal Rapid Transit; Lexington Books-D.C. Heath and Company: Lexington, MA, USA, 1978. [Google Scholar]
  3. Mineta Transportation Institute. Automated Transit Networks: A Review on the State of the Industry and Prospects for the Future; Mineta Transportation Institute: San José, CA, USA, 2014. [Google Scholar]
  4. Schweizer, J.; Parriani, T.; Traversi, E.; Rupi, F. Optimum Vehicle Flows in a Fully Automated Vehicle Network. In Proceedings of the International Conference on Vehicle Technology and Intelligent Transport Systems, Rome, Italy, 23–24 April 2016; SCITEPRESS—Science and and Technology Publications: Setúbal, Portugal, 2016; pp. 195–202. [Google Scholar] [CrossRef]
  5. Kerr, A.D.; James, P.A.; Craig, A.P. Infrastructure Cost Comparisons for PRT and APM: Automated People Movers 2005—Moving to Mainstream. In Proceedings of the 10th International Conference on Automated People Movers, Orlando, FL, USA, 1–4 May 2005; American Society of Civil Engineers: Orlando, FL, USA, 2005. [Google Scholar] [CrossRef]
  6. Fichter, D. Individualized Automatic Transit and the City; B.H. Sikes: Providence, RI, USA, 1964. [Google Scholar]
  7. Latour, B. Aramis, or, the Love of Technology; Harvard University Press: Cambridge, MA, USA, 1996. [Google Scholar]
  8. Burke, C.G. Innovation and Public Policy: The Case of Personal Rapid Transit; Lexington Books Heath: Lexington, MA, USA, 1979. [Google Scholar]
  9. Castangia, M.; Guala, L. Modelling and simulation of a PRT network. In Urban Transport XVII; Pratelli, A., Brebbia, C.A., Eds.; WIT Transactions on The Built Environment; WIT Press: Southampton, UK, 2011; pp. 459–472. [Google Scholar] [CrossRef]
  10. Li, J.; Chen, Y.S.; Li, H.; Andreasson, I.; van Zuylen, H. Optimizing the fleet size of a Personal Rapid Transit system: A case study in port of Rotterdam. In Proceedings of the 13th International IEEE Conference on Intelligent Transportation Systems, Funchal, Portugal, 19–22 September 2010; pp. 301–305. [Google Scholar] [CrossRef]
  11. AMG—Advanced Mobility Group. East Contra Costa County Dynamic Personal Micro Transit Feasibility Study Report; Advanced Mobility Group: Walnut Creek, CA, USA, 2021. [Google Scholar]
  12. Muller, P.J.; Andreasson, I.J. A Light Rail, Group Rapid Transit, Personal Rapid Transit Comparison. In Automated People Movers and Automated Transit Systems 2018; Sproule, W.J., Ed.; American Society of Civil Engineers: Reston, VA, USA, 2018; pp. 1–11. [Google Scholar] [CrossRef]
  13. Meyer, A.M.; Morache, R. Feasibility of Personal Rapid Transit In Ithaca, New York: Final Report; New York State Energy Research and Development Authority: Albany, NY, USA, 2010. [Google Scholar]
  14. Carnegie, J.A.; Voorhees, A.M. Viability of Personal Rapid Transit In New Jersey: Final Report; New Jersey Department of Transportation: Trenton, NJ, USA, 2007.
  15. Sarkar, P.K.; Jain, U. Benchmarking of Personal Rapid Transit System (Dynamic Model). Transp. Res. Procedia 2017, 25, 4207–4218. [Google Scholar] [CrossRef]
  16. Singh, S.K.; Gupta, T. Critical Analysis and Feasibility of PRT for Gurgaon City. Int. J. Sci. Res. Sci. Eng. Technol. 2021, 8, 83–86. [Google Scholar] [CrossRef]
  17. Arslan, O.; Reichert, M.; Sellaouti, A.; Hoffmann, S. Investigation of Personal Rapid Transit Station Capacities using Microscopic Traffic Simulation. In Proceedings of the 2021 7th International Conference on Models and Technologies for Intelligent Transportation Systems (MT-ITS), Heraklion, Greece, 16–17 June 2021; pp. 1–6. [Google Scholar] [CrossRef]
  18. Schweizer, J.; Mantecchini, L.; Greenwood, J. Analytical Capacity Limits of Personal Rapid Transit Stations. In Automated People Movers and Transit Systems 2011; Leder, W.H., Sproule, W.J., Eds.; American Society of Civil Engineers: Reston, VA, USA, 2011; pp. 326–338. [Google Scholar] [CrossRef]
  19. Lowson, M.; Hammersley, J. Maximization of PRT Station Capacity. In Transportation Research Board Paper; Transportation Research Board: Washington, DC, USA, 2011. [Google Scholar]
  20. Grabski, W.; Daszczuk, W.B. Priority Rules on ATN (PRT) Intersections. Autobusy-TEST 2017, 18, 1503–1506. [Google Scholar]
  21. Hoang, T.; Nguyen, T.H.V.; Shiao, Y. Simulation of intelligent merging control for Personal Rapid Transit. In Seventh International Conference on Information Science and Technology; IEEE: Piscataway, NJ, USA, 2017; pp. 340–344. [Google Scholar] [CrossRef]
  22. Schweizer, J.; Danesi, A.; Rupi, F.; Traversi, E. Comparison of static vehicle flow assignment methods and microsimulations for a personal rapid transit network. J. Adv. Transp. 2012, 46, 340–350. [Google Scholar] [CrossRef]
  23. Daszczuk, W.B.; Mieścicki, J.; Grabski, W. Distributed algorithm for empty vehicles management in personal rapid transit (PRT) network. J. Adv. Transp. 2016, 50, 608–629. [Google Scholar] [CrossRef]
  24. Kozłowski, M.; Choromański, W.; Kowara, J. Arametric sensitivity analysis of ATN-PRT vehicle (automated transit network—Personal rapid transit). J. Vibroeng. 2015, 17, 1436–1451. [Google Scholar]
  25. Kozłowski, M. Analysis of dynamics of a scaled PRT (personal rapid transit) vehicle. J. Vibroeng. 2019, 21, 1426–1440. [Google Scholar] [CrossRef]
  26. Choromanski, W.; Kowara, J. PRT-Modeling and Dynamic Simulation of Track and Vehicle. In Automated People Movers and Transit Systems 2011; Leder, W.H., Sproule, W.J., Eds.; American Society of Civil Engineers: Reston, VA, USA, 2011; pp. 294–306. [Google Scholar] [CrossRef]
  27. Hollar, S.; Brain, M.; Nayak, A.A.; Stevens, A.; Patil, N.; Mittal, H.; Smith, W.J. A new low cost, efficient, self-driving personal rapid transit system. In Proceedings of the 28th IEEE Intelligent Vehicles Symposium, Los Angeles, CA, USA, 11–14 June 2017; IEEE: Piscataway, NJ, USA, 2017; pp. 412–417. [Google Scholar] [CrossRef]
  28. Mittelman, G.; Kariv, Y.; Cohen, Y.; Avineri, E. Techno-economic analysis of energy supply to personal rapid transit (PRT) systems. Appl. Energy 2022, 306, 118006. [Google Scholar] [CrossRef]
  29. Liu, R. (Ed.) Automated Transit: Planning, Operation, and Applications; IEEE Press Series on Systems Science and Engineering; IEEE Press Wiley: Hoboken, NJ, USA, 2017. [Google Scholar] [CrossRef]
  30. Tahmasseby, S.; Kattan, L. Preliminary economic appraisal of personal rapid transit (PRT) and urban gondola feeder systems serving a university campus and its surrounding major attractions. Can. J. Civ. Eng. 2015, 42, 67–79. [Google Scholar] [CrossRef]
  31. Mascia, M.; Hu, S.; Han, K.; Sun, A.; North, R.; Lees-Miller, J.D. A holistic approach for performance assessment of personal rapid transit. Res. Transp. Bus. Manag. 2016, 18, 70–76. [Google Scholar] [CrossRef]
  32. Mieścicki, J.; Daszczuk, W.B. Proposed benchmarks for PRT networks simulation. Arch. Transp. 2017, 27–28, 123–133. [Google Scholar] [CrossRef]
  33. Mueller, K.; Sgouridis, S.P. Simulation-based analysis of personal rapid transit systems: Service and energy performance assessment of the Masdar City PRT case. J. Adv. Transp. 2011, 45, 252–270. [Google Scholar] [CrossRef]
  34. el Ayashe, M.; Jawad, D.; Rouhana, F.; Aouad, C. Sensitivity Analysis of Personal Rapid Transit Parameters in Urban Setting: Case Study: Beirut Central District. In Proceedings of the 2019 Fourth International Conference on Advances in Computational Tools for Engineering Applications (ACTEA), Beirut, Lebanon, 3–5 July 2019; IEEE: Piscataway, NJ, USA, 2019; pp. 1–6. [Google Scholar] [CrossRef]
  35. German Aerospace Center. SUMO Scenarios: Bad Hersfeld. 2022. Available online: https://github.com/DLR-TS/sumo-scenarios/tree/main/BadHersfeld (accessed on 5 September 2022).
  36. Felix Gotzler. Bad Hersfeld PRT Extension. 2022. Available online: https://github.com/TUMFTM/sumo-prt (accessed on 5 September 2022).
  37. Meier-Maaz, N. Im E-Mobil zum Klinikum? Autonome Fahrzeuge sollen nach Erweiterung Stau verhindern. Hessische Niedersächsische Allgemeine 2022. Available online: https://www.hna.de/lokales/rotenburg-bebra/bad-hersfeld-ort56532/individuell-unterwegs-zum-klinikum-91430875.html#:~:text=Autonome%20Fahrzeuge%20sollen%20nach%20Erweiterung%20Stau%20verhindern,-Erstellt%3A%2024.03.2022&text=Nach%20der%20geplanten%20Erweiterung%20des,jedenfalls%20tr%C3%A4umt%20B%C3%BCrgermeister%20Thomas%20Fehling (accessed on 5 September 2022).
  38. Codecà, L.; Erdmann, J.; Cahill, V.; Härri, J. SAGA: An Activity-based Multi-modal Mobility Scenario Generator for SUMO; German Aerospace Center: Berlin, Germany, 2020. [Google Scholar]
  39. Zheng, H.; Peeta, S. Network design for personal rapid transit under transit-oriented development. Transp. Res. Part C Emerg. Technol. 2015, 55, 351–362. [Google Scholar] [CrossRef]
  40. Lopez, P.A.; Behrisch, M.; Bieker-Walz, L.; Erdmann, J.; Flötteröd, Y.P.; Hilbrich, R.; Lücken, L.; Rummel, J.; Wagner, P.; Wießner, E. Microscopic Traffic Simulation using SUMO. In Proceedings of the 21st IEEE International Conference on Intelligent Transportation Systems, Maui, HI, USA, 4–7 November 2018. [Google Scholar]
  41. Eclipse Foundation. Simulation of Urban MObility. Available online: https://www.eclipse.org/sumo/ (accessed on 5 September 2022).
  42. American Society of Civil Engineers. Automated People Mover Standards; American Society of Civil Engineers: Reston, VA, USA, 2021. [Google Scholar]
  43. SUMO Documentation: Taxi Device. Available online: https://sumo.dlr.de/docs/Simulation/Taxi.html (accessed on 5 September 2022).
  44. Antje, V.; Martin, D. 21st Century Transport for Smart Cities: High Density Urban Passenger & Freight Transport at Half the Cost/Space/Time and Highest Passenger Convenience; Autonomous Network Transit: München, Germany, 2022. [Google Scholar]
  45. UrbanLoop. La Mobilité Urbaine, Fluide, économoique et Durable. Available online: https://urbanloop.univ-lorraine.fr/ (accessed on 5 September 2022).
  46. Glydways Inc. MAss Transit Ride Hailing: A Revolution in Better Mobility and Public Transportation; Glydways Inc.: San Francisco, CA, USA, 2022. [Google Scholar]
  47. Stefan, K. Microscopic Modeling of Traffic Flow: Investigation of Collision Free Vehicle Dynamics; Deutsches Zentrum für Luft- und Raumfahrt: Cologne, Germany, 1998. [Google Scholar]
  48. Bjärkvik, E.; Fürer, F.; Barthauer, M.; Friedrich, B.; Pourabdollah, M.; Lindenberg, B.; Rieken, J.; Rummel, J.; Flötteröd, Y.P.; Erdmann, J.; et al. SUMO 2017 towards Simulation for Autonomous Mobility; German Aerospace Center: Berlin, Germany, 2017. [Google Scholar]
  49. German Aerospace Center. Introduction to TraCI; German Aerospace Center: Berlin, Germany, 2022. [Google Scholar]
  50. Daszczuk, W.B. Measures of Structure and Operation of Automated Transit Networks. IEEE Trans. Intell. Transp. Syst. 2020, 21, 2966–2979. [Google Scholar] [CrossRef]
  51. Chebbi, O.; Chaouachi, J. An elitist multi-objective genetic algorithm for minimizing vehicle numbers and energy consumption in the context of Personal Rapid Transit. In Proceedings of the 2014 International Conference on Advanced Logistics and Transport (ICALT), Hammamet, Tunisia, 1–3 May 2014; pp. 270–274. [Google Scholar] [CrossRef]
  52. Rezgui, D.; Chaouachi-Siala, J.; Aggoune-Mtalaa, W.; Bouziri, H. Application of a memetic algorithm to the fleet size and mix vehicle routing problem with electric modular vehicles. In Proceedings of the Genetic and Evolutionary Computation Conference Companion, Berlin Germany, 15–19 July 2017; ACM: New York, NY, USA, 2017; pp. 301–302. [Google Scholar] [CrossRef]
  53. Chebbi, O.; Chaouachi, J. Simulated Annealing Approach for Solving the Fleet Sizing Problem in On-Demand Transit System. In Proceedings of the Second International Afro-European Conference for Industrial Advancement AECIA 2015, Villejuif, France, 9–11 September 2015; Abraham, A., Wegrzyn-Wolska, K., Hassanien, A.E., Snasel, V., Alimi, A.M., Eds.; Springer International Publishing: Cham, Switzerland, 2016; Volume 427, pp. 217–226. [Google Scholar] [CrossRef]
  54. Hörl, S.; Ruch, C.; Becker, F.; Frazzoli, E.; Axhausen, K.W. Fleet operational policies for automated mobility: A simulation assessment for Zurich. Transp. Res. Part C: Emerg. Technol. 2019, 102, 20–31. [Google Scholar] [CrossRef]
  55. Bischoff, J.; Maciejewski, M. Simulation of City-wide Replacement of Private Cars with Autonomous Taxis in Berlin. Procedia Comput. Sci. 2016, 83, 237–244. [Google Scholar] [CrossRef]
  56. Maciejewski, M.; Bischoff, J. Large-scale Microscopic Simulation of Taxi Services. Procedia Comput. Sci. 2015, 52, 358–364. [Google Scholar] [CrossRef] [Green Version]
  57. Zhang, R.; Rossi, F.; Pavone, M. Model Predictive Control of Autonomous Mobility-on-Demand Systems. In Proceedings of the 2016 IEEE International Conference on Robotics and Automation (ICRA), Stockholm, Sweden, 16–21 May 2016; pp. 1382–1389. [Google Scholar] [CrossRef]
  58. Frank, L.; Bradley, M.; Kavage, S.; Chapman, J.; Lawton, T.K. Urban form, travel time, and cost relationships with tour complexity and mode choice. Transportation 2007, 35, 37–54. [Google Scholar] [CrossRef]
  59. Cervero, R. Built environments and mode choice: Toward a normative framework. Transp. Res. Part D Transp. Environ. 2002, 7, 265–284. [Google Scholar] [CrossRef]
Figure 1. Temporal distribution of departing trips over the course of 24 h.
Futuretransp 02 00041 g001
Figure 2. Stations and connecting graph of the proposed PRT system in Bad Hersfeld.
Futuretransp 02 00041 g002
Figure 3. Schematic layout of a PRT station using SUMO’s elements.
Futuretransp 02 00041 g003
Figure 4. CDF of average waiting times for increasing fleetsizes.
Futuretransp 02 00041 g004
Figure 5. Marginal utility of increased fleetsizes.
Futuretransp 02 00041 g005
Figure 6. Occupancy of PRT systems with different fleetsizes and operating strategies.
Futuretransp 02 00041 g006
Figure 7. Occupancy of PRT systems with different numbers of berths, fleetsizes and grouped operating strategies.
Futuretransp 02 00041 g007
Figure 8. Comparison of dispatching strategies NIT and NOR regarding average waiting time for different fleetsizes.
Futuretransp 02 00041 g008
Table 1. ODM with complete travel demand of 24 h.
StationHospitalSchildeparkParking North
Station050600
Hospital506045850
Schildepark045800
Parking North05000
Table 2. Parameterization of the vehicles and the corresponding car-following model.
ParameterValue
Vehicle width1 m
Vehicle length 2.5   m
Car-following modelKrauss [47]
Maximum speed 13.89 m s−1
Acceleration 2.5 m s−2
Deceleration 3.5 m s−2
Emergency deceleration 3.5 m s−2
Minimal inter-vehicle gap1 m
Tau1
Sigma0
Vehicle mass500 k g
Table 3. Overview of simulation parameters.
ParameterValues
Fleetsize15 to 49, increment: 1
Number of berths1 to 5, increment 1
Dispatching strategyNIT, NOR
Rebalancing strategyRI, GTD, PC+RI, PC+GTD
Publisher’s Note: MDPI stays neutral with regard to jurisdictional claims in published maps and institutional affiliations.

