
Measuring, Mapping, and Evaluating Daytime Traffic Noise Levels at Urban Road Intersections in Doha, Qatar


Abstract
:1. Introduction
2. Background
2.1. Traffic Noise Level Guidelines
2.2. Measuring Traffic Noise Levels
3. Methods
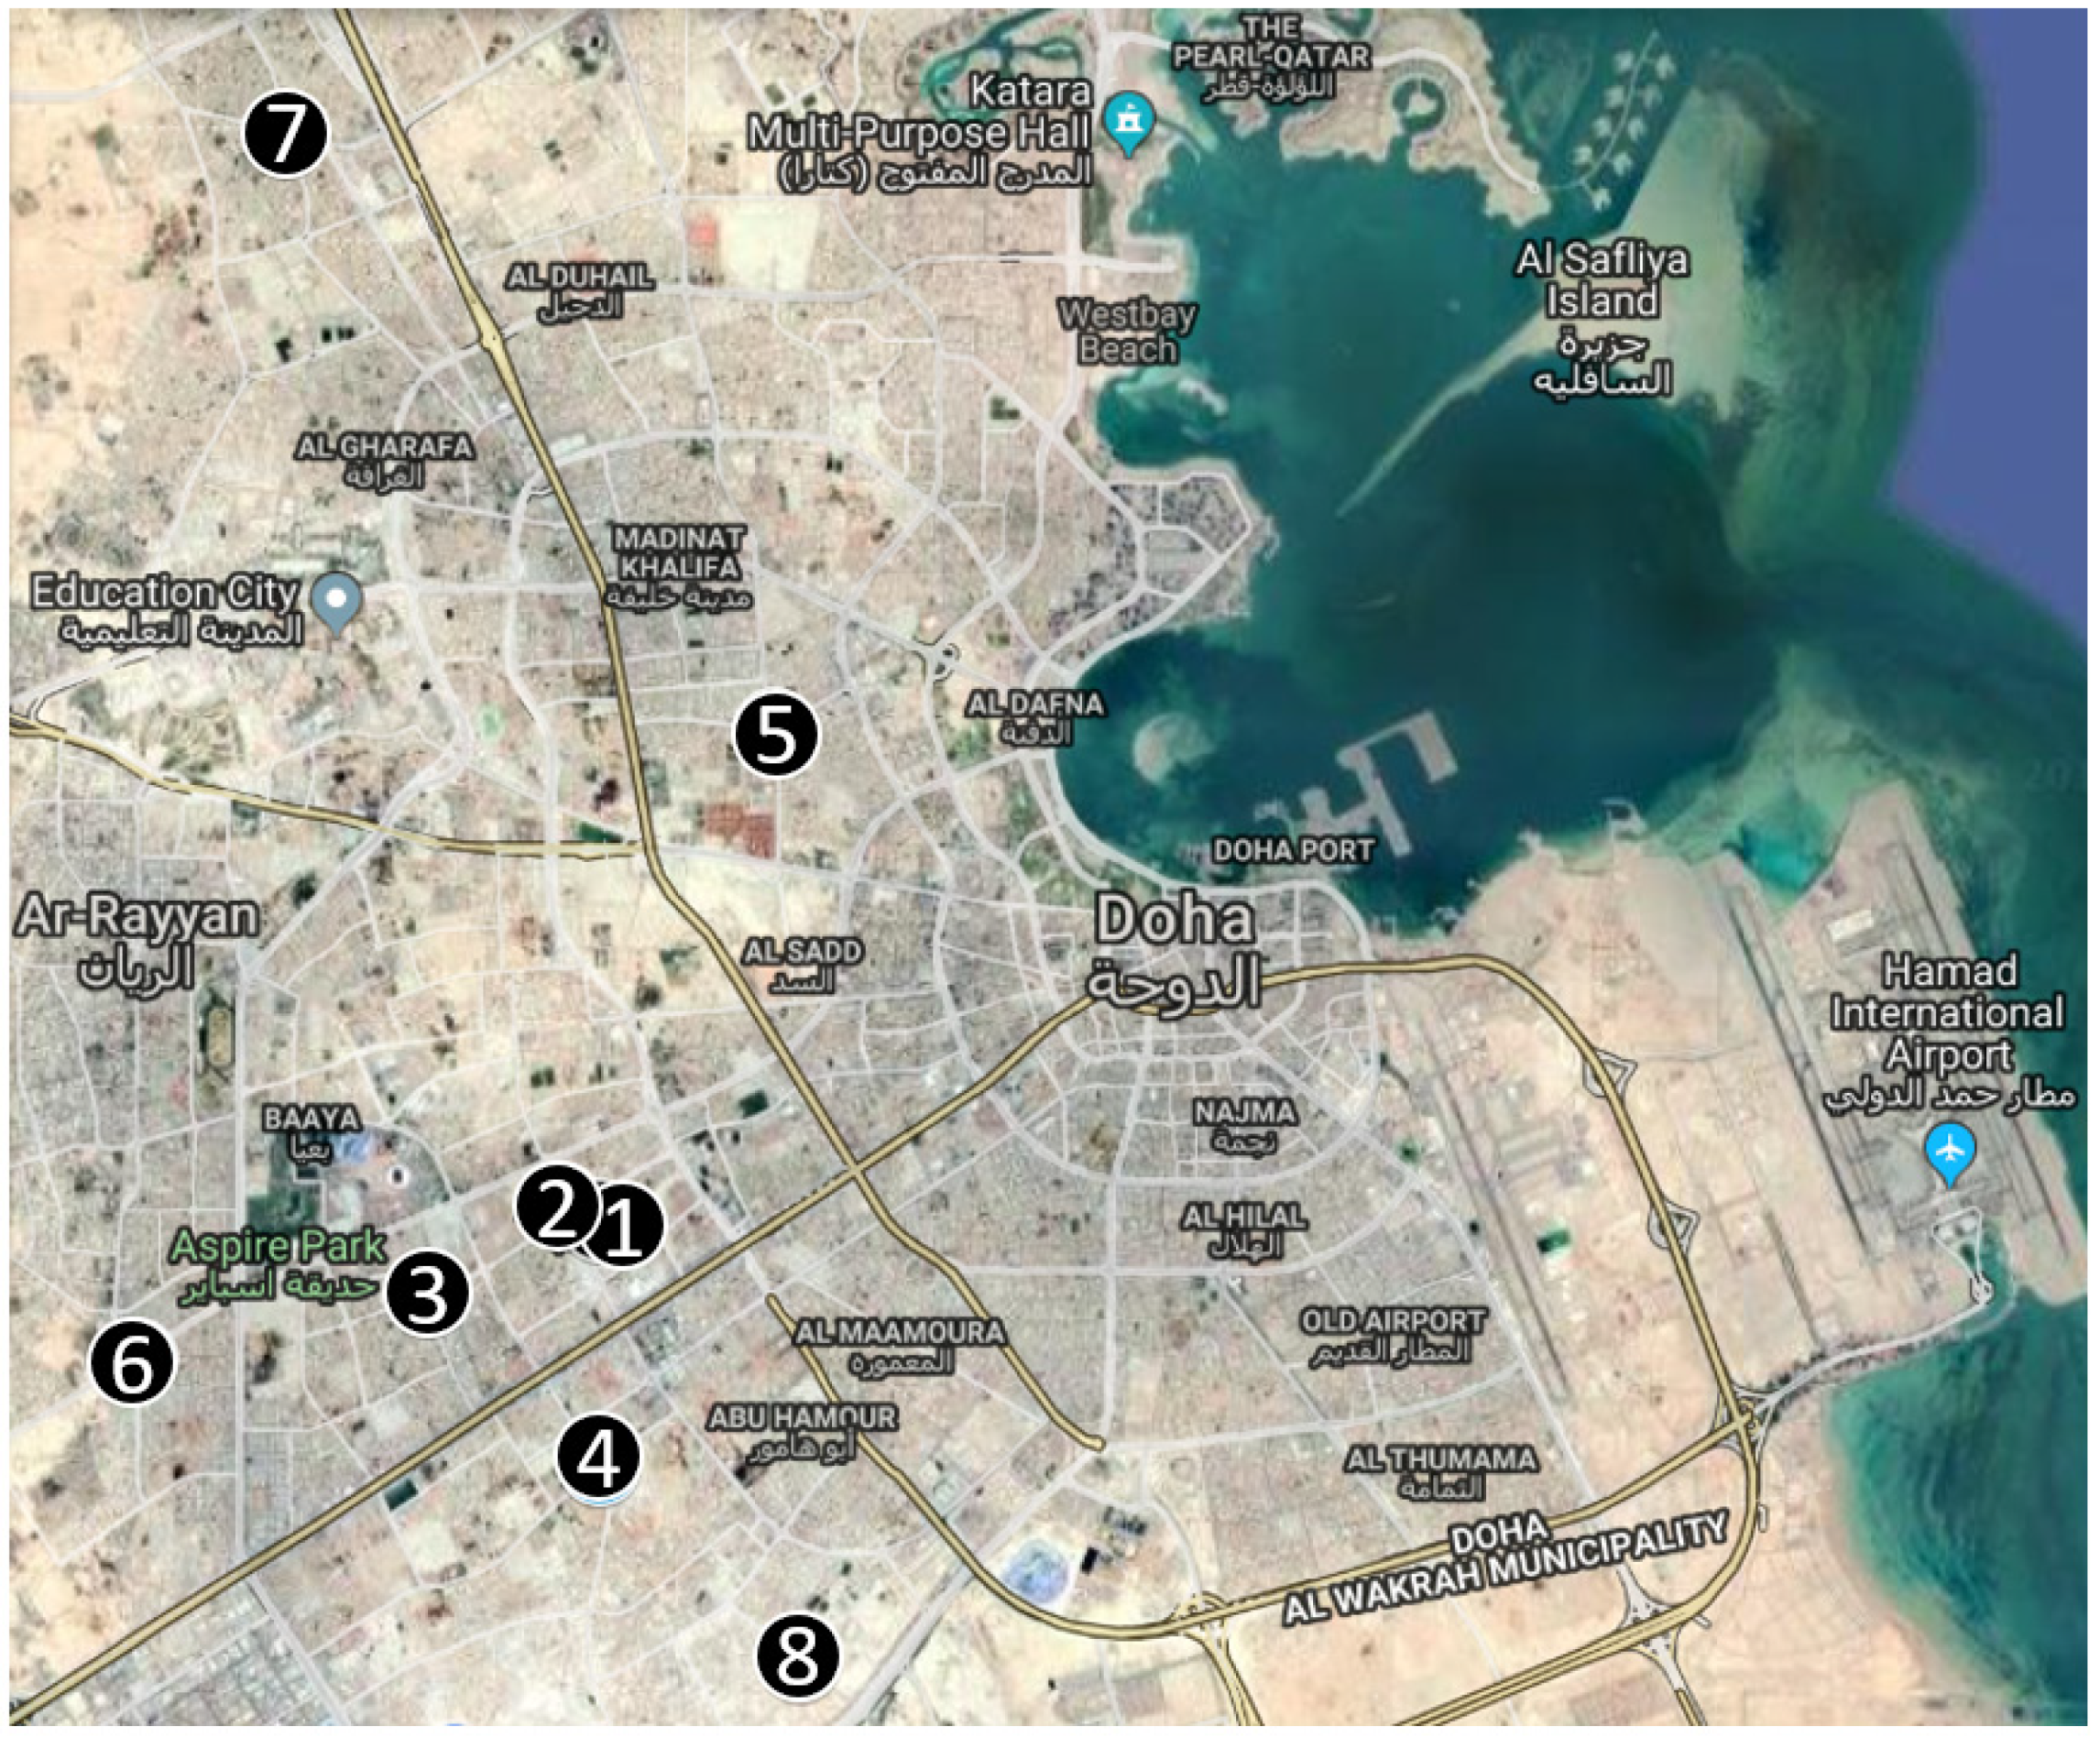
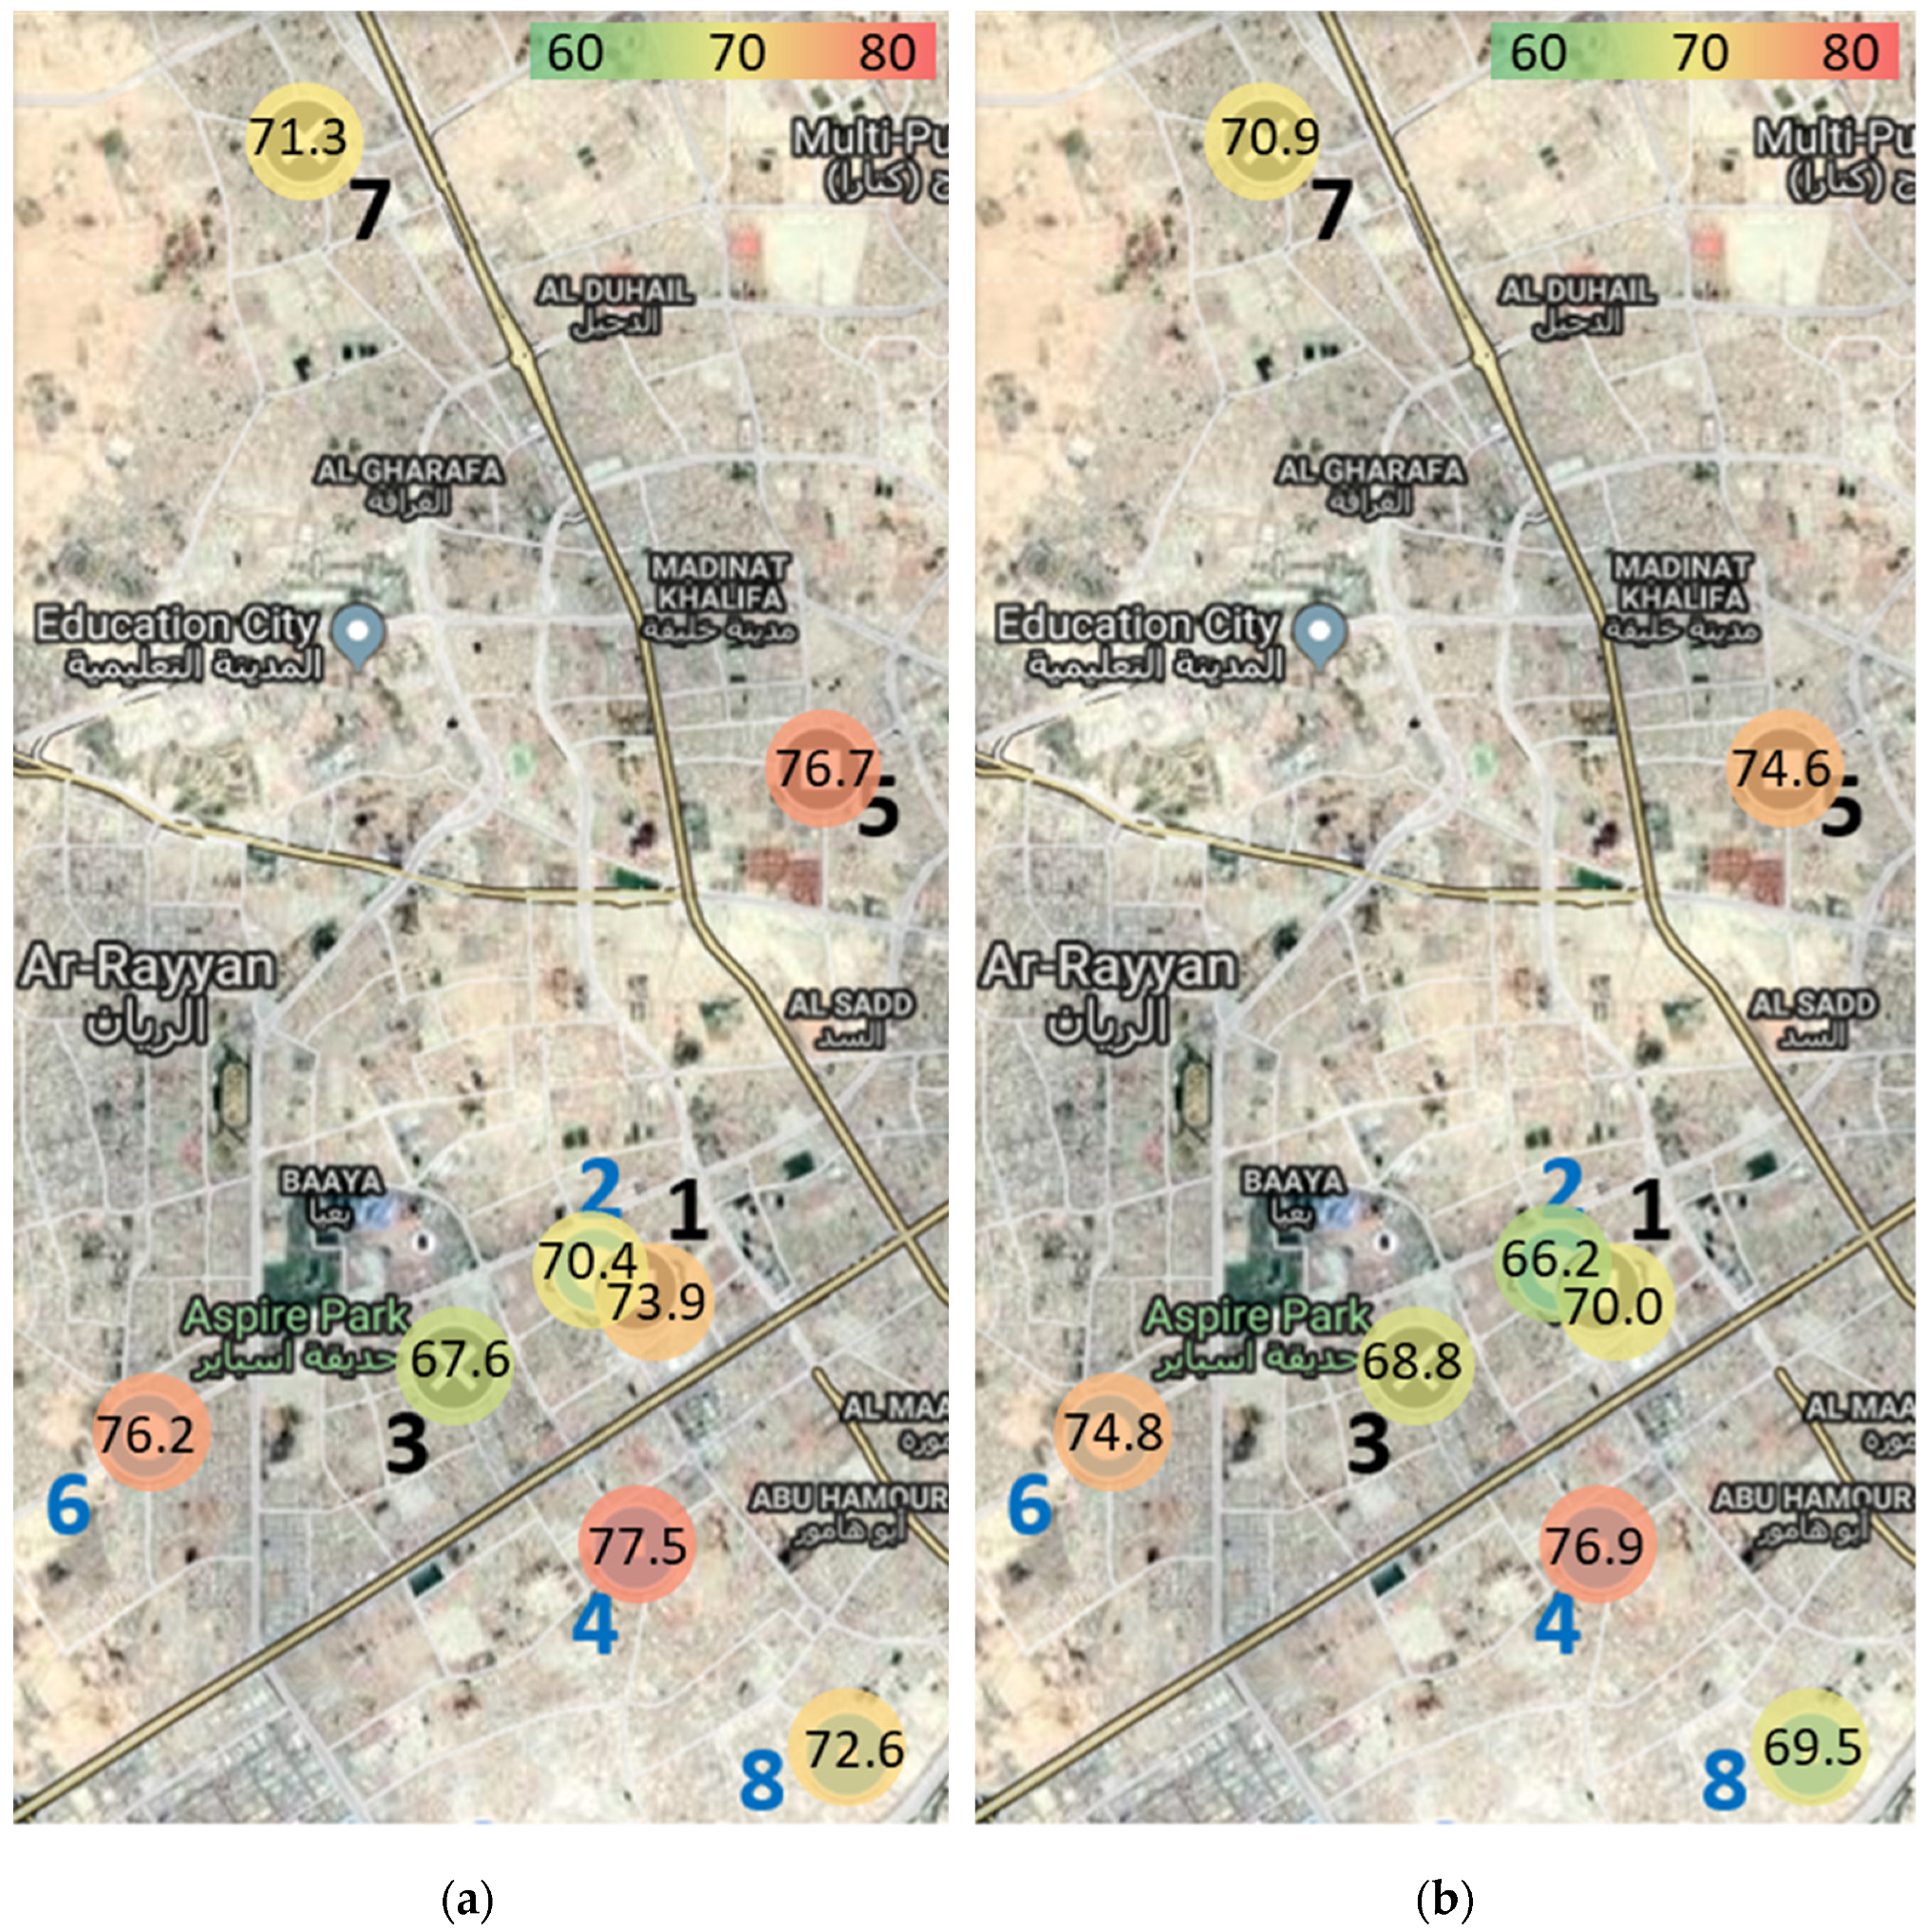
3.1. Study Area
3.2. Traffic Noise Levels
3.3. Field Measurements
4. Analysis
4.1. Descriptive Statistics of Noise Levels
4.2. Hourly Noise Levels
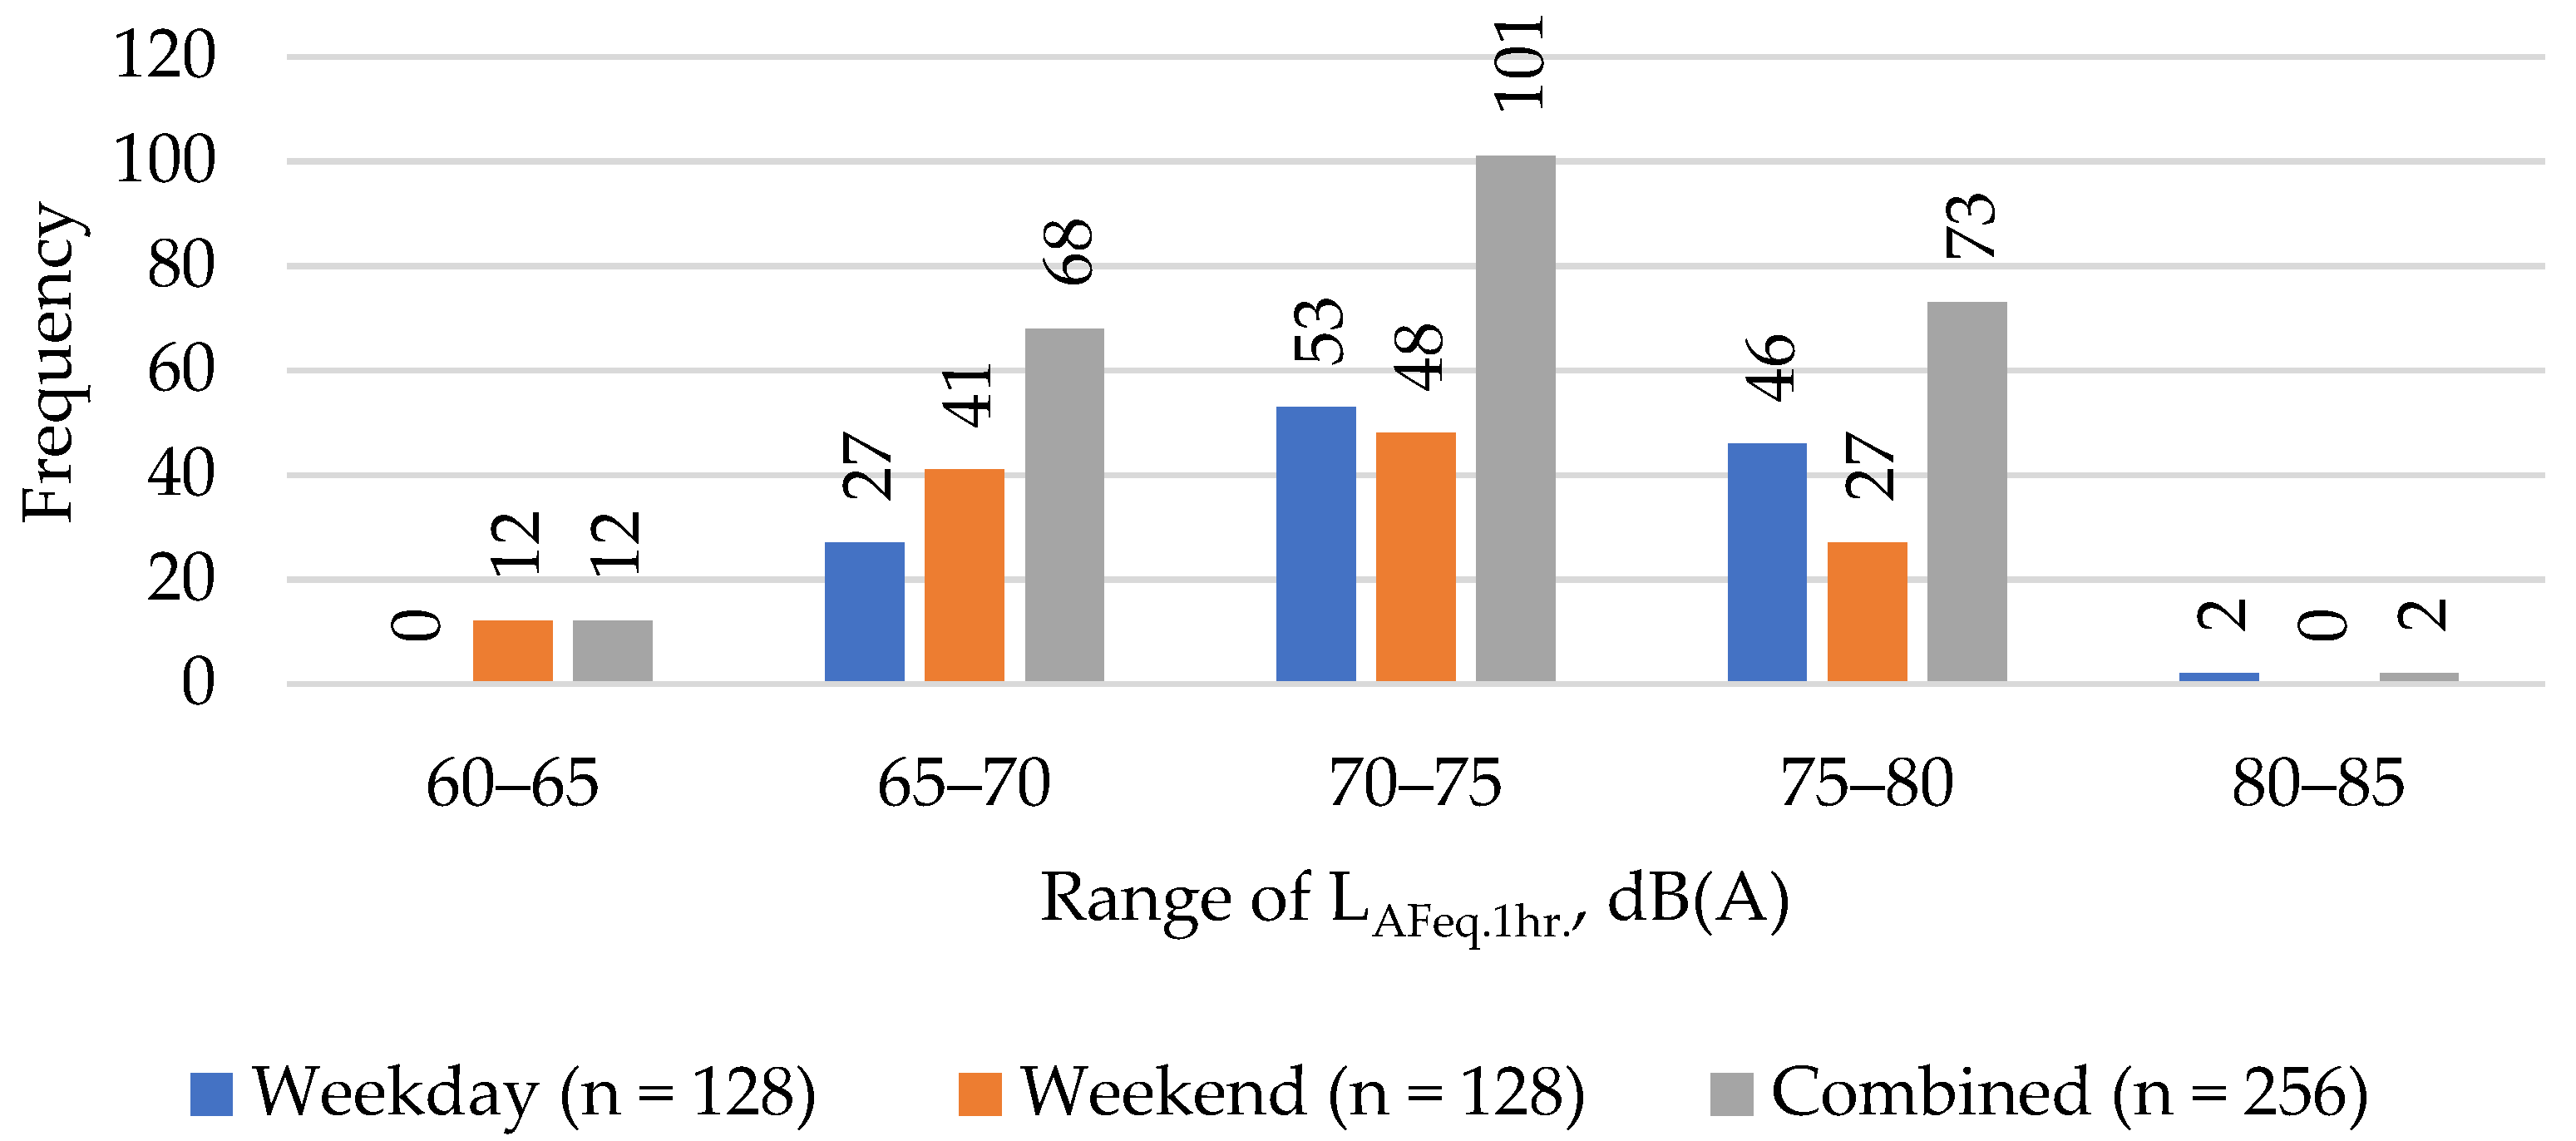
4.3. Distribution of Hourly Noise Levels
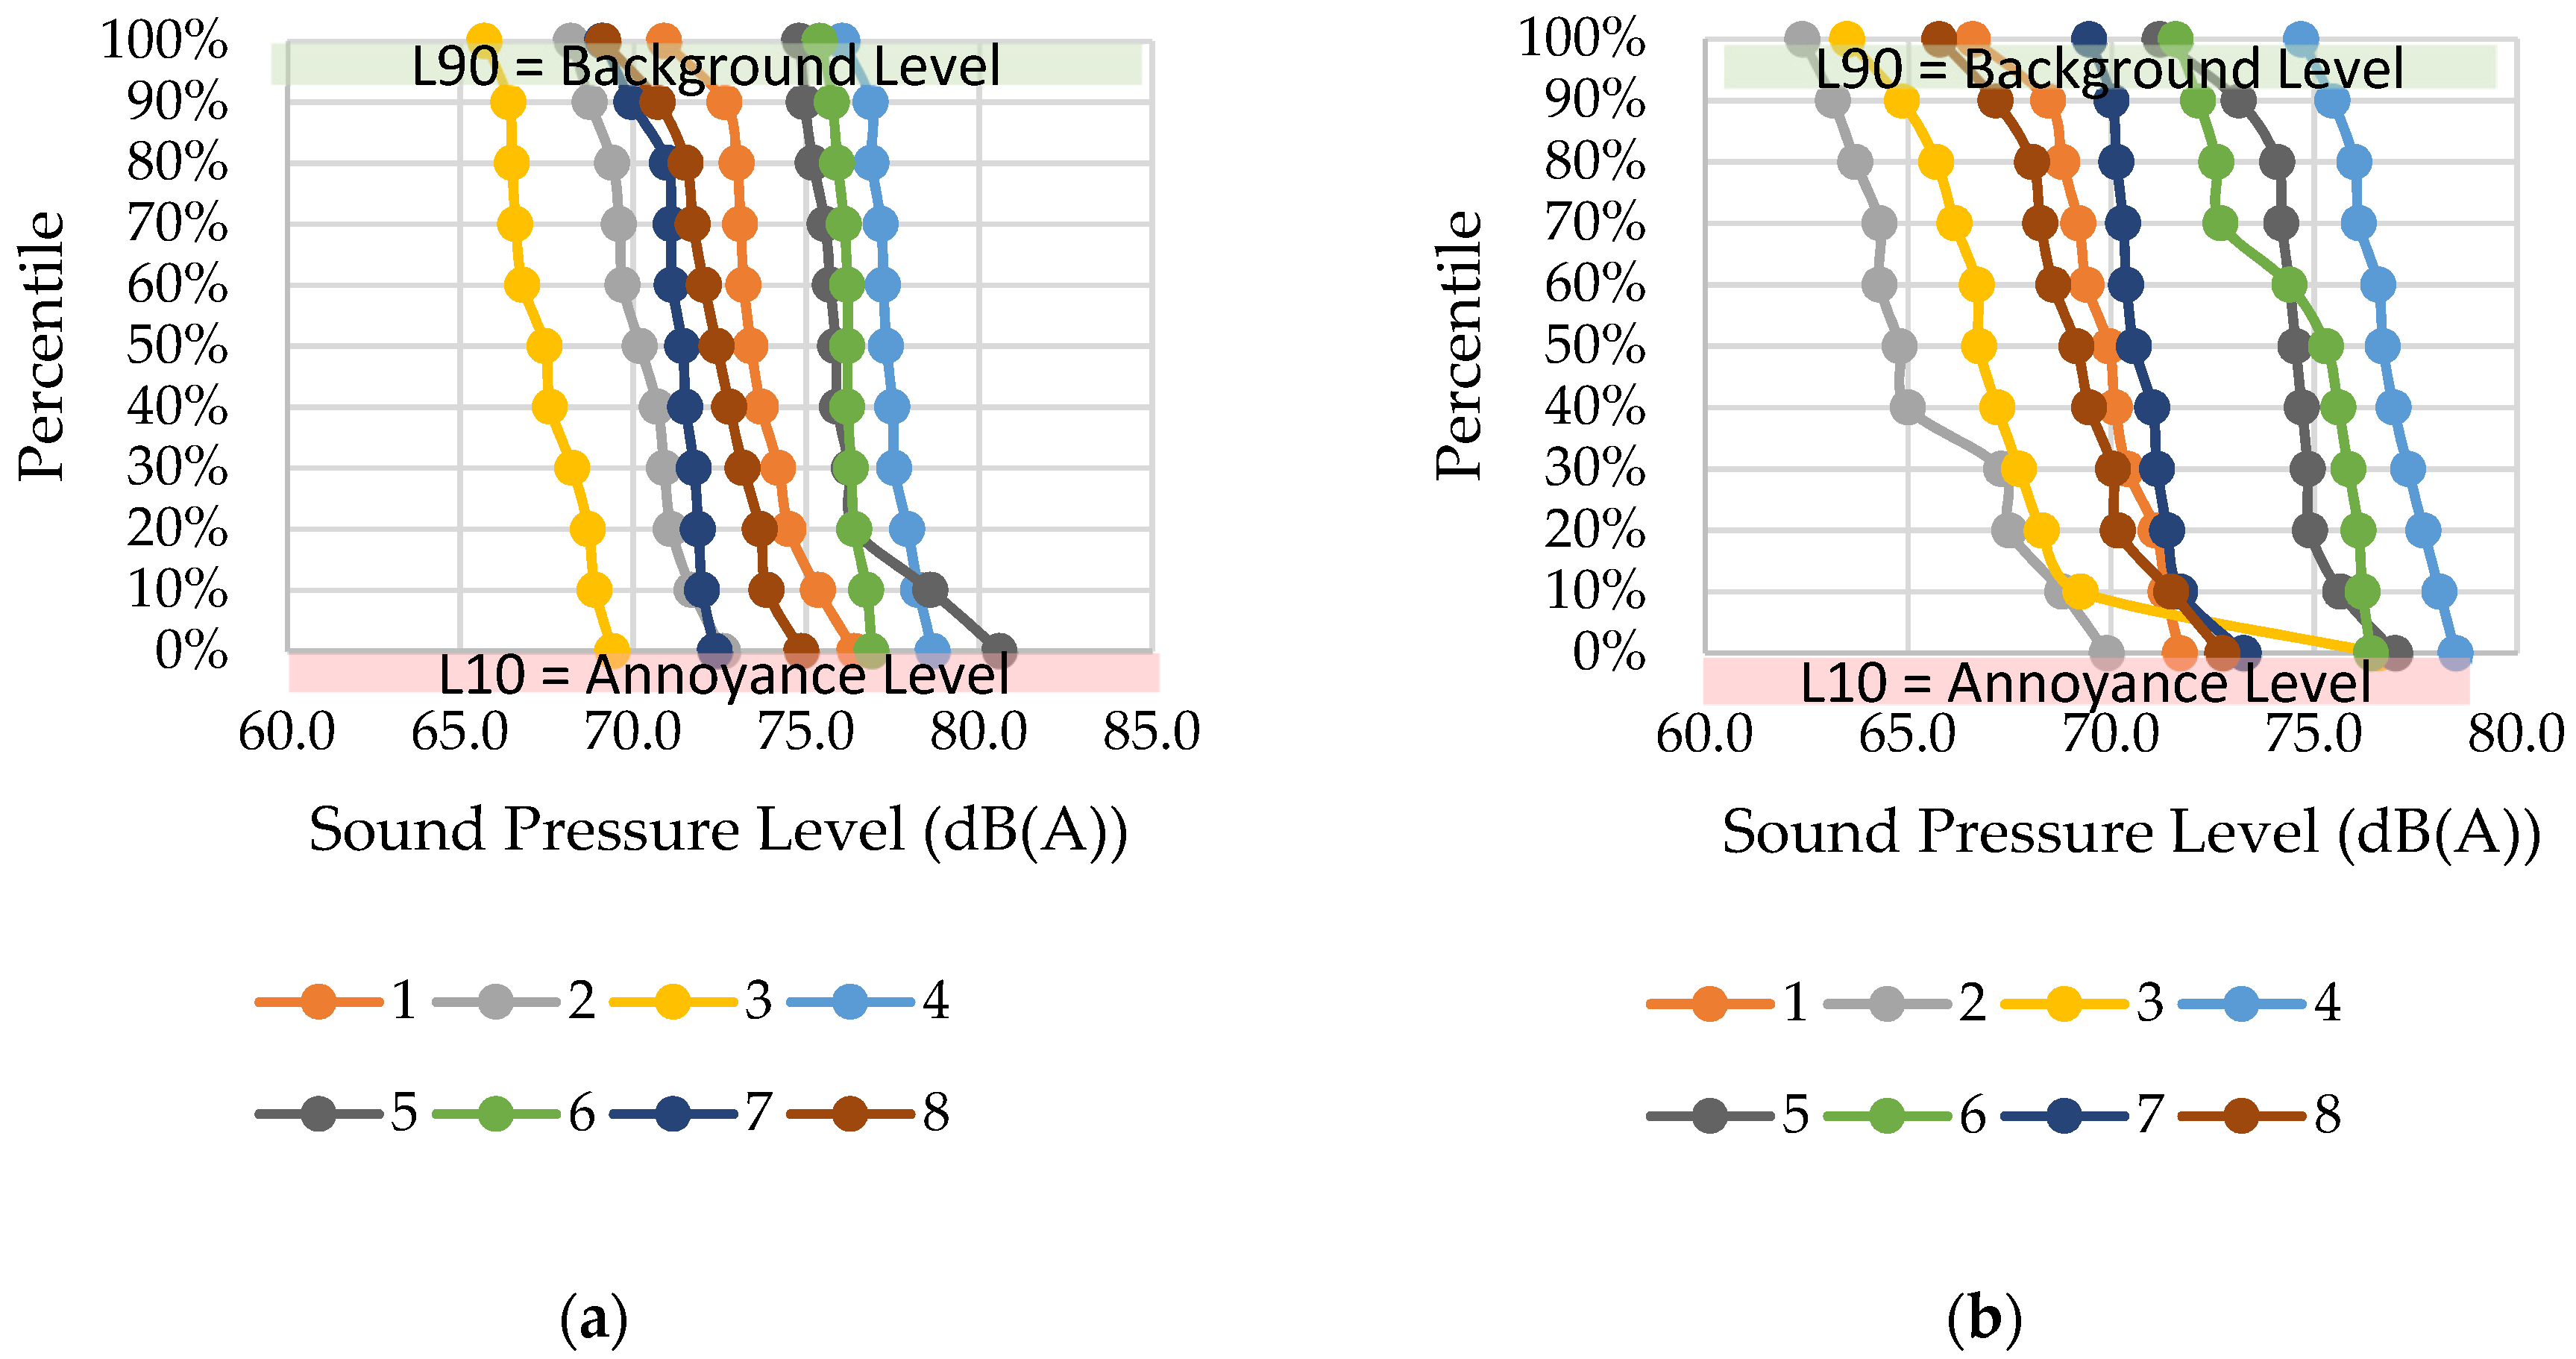
4.4. Noise Pollution Indices
4.5. Mean Morning, Afternoon, and Evening Noise Levels
4.6. Daytime Noise Levels
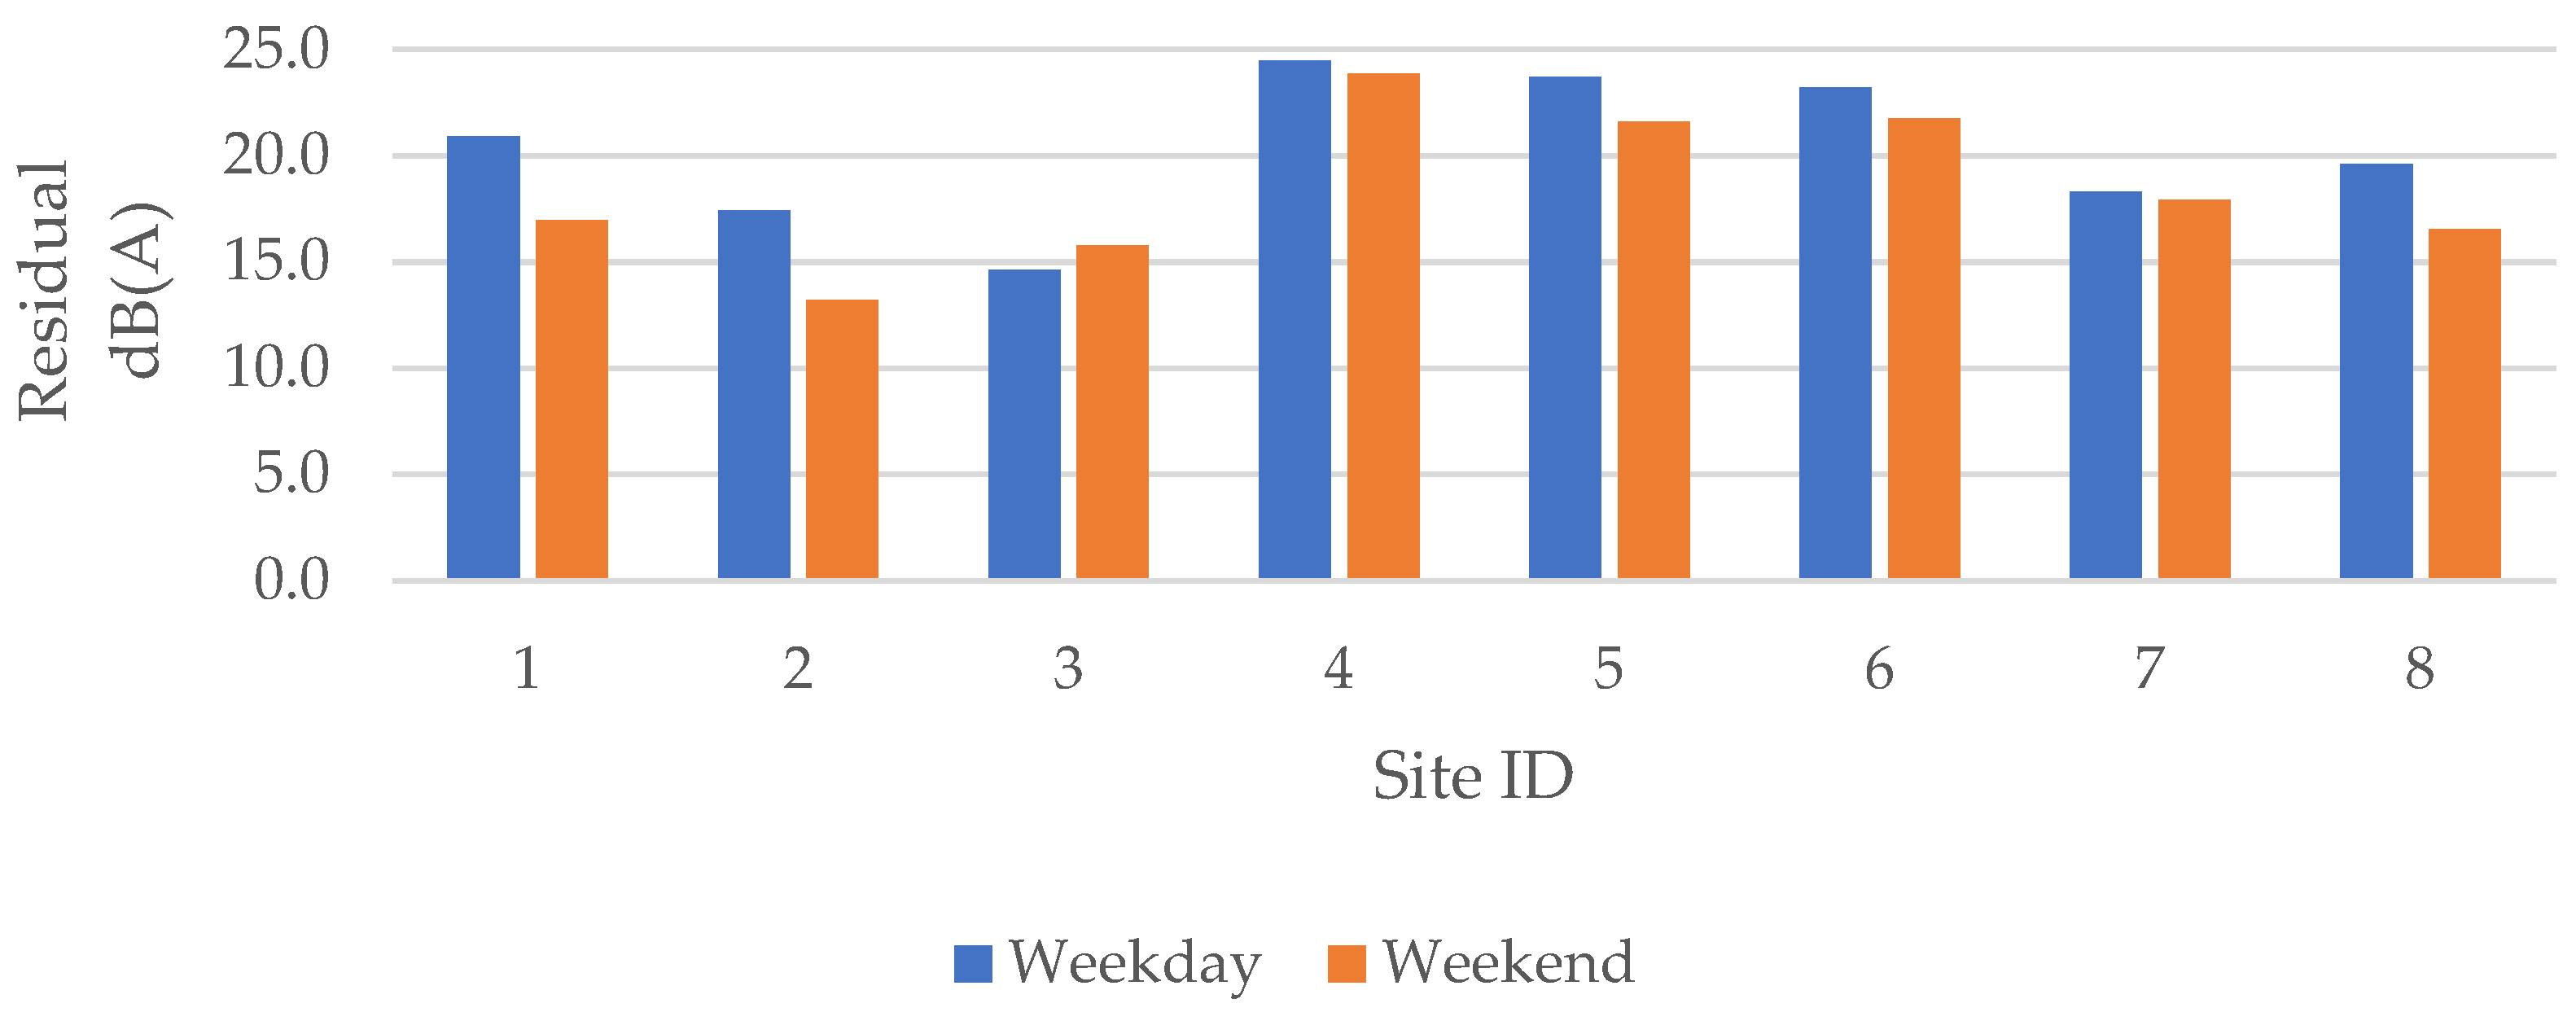
4.7. Daytime Residual Noise Levels
4.8. Noise Levels across Other Major Cities
5. Discussion
5.1. Limitations and Future Research Directions
5.2. Recommendations
Author Contributions
Funding
Institutional Review Board Statement
Informed Consent Statement
Data Availability Statement
Conflicts of Interest
References
- WHO. Environmental Noise Guidelines for the European Region; WHO: Copenhagen, Denmark, 2018. [Google Scholar]
- Raman, M.; Chhipa, R.C. Study of Noise Pollution at Major Intersections in Jaipur City. Int. J. Eng. Sci. Technol. Res. 2014, 3, 74–80. [Google Scholar]
- Ouis, D. Annoyance from Road Traffic Noise: A Review. J. Environ. Psychol. 2001, 21, 101–120. [Google Scholar] [CrossRef]
- Begou, P.; Kassomenos, P. Exposure to the road traffic noise in an urban complex in Greece: The quantification of healthy life years lost due to noise-induced annoyance and noise-induced sleep disturbances. Environ. Sci. Pollut. Res. Int. 2020, 28, 12932–12943. [Google Scholar] [CrossRef] [PubMed]
- Tangermann, L.; Vienneau, D.; Hattendorf, J.; Saucy, A.; Künzli, N.; Schäffer, B.; Wunderli, J.M.; Röösli, M. The association of road traffic noise with problem behaviour in adolescents: A cohort study. Environ. Res. 2022, 207, 112645. [Google Scholar] [CrossRef]
- WHO; Regional Office for Europe. Burden of Disease from Environmental Noise; WHO: Copenhagen, Denmark, 2011. [Google Scholar]
- Cai, Y.; Ramakrishnan, R.; Rahimi, K. Long-term exposure to traffic noise and mortality: A systematic review and meta-analysis of epidemiological evidence between 2000 and 2020. Environ. Pollut. 2020, 269, 116222. [Google Scholar] [CrossRef]
- Hegewald, J.; Schubert, M.; Lochmann, M.; Seidler, A. The Burden of Disease Due to Road Traffic Noise in Hesse, Germany. Int. J. Environ. Res. Public Health 2021, 18, 9337. [Google Scholar] [CrossRef]
- Shaaban, K.; Khalil, R.F. Investigating the Customer Satisfaction of the Bus Service in Qatar. In Proceedings of the 2nd Conference of Trans-portation Research Group of India, Agra, India, 12–15 December 2013; Available online: http://gateway.webofknowledge.com/gateway/Gateway.cgi?GWVersion=2&SrcAuth=ORCID&SrcApp=OrcidOrg&DestLinkType=FullRecord&DestApp=WOS_CPL&KeyUT=WOS:000335889700090&KeyUID=WOS:000335889700090 (accessed on 1 January 2022).
- Shaaban, K. Who Is Going to Ride the Upcoming Metro in Qatar? In Advances in Intelligent Systems and Computing; Springer: Berlin/Heidelberg, Germany, 2019; Volume 786. [Google Scholar]
- Quiñones-Bolaños, E.E.; Bustillo-Lecompte, C.F.; Mehrvar, M. A traffic noise model for road intersections in the city of Cartagena de Indias, Colombia. Transp. Res. Part D Transp. Environ. 2016, 47, 149–161. [Google Scholar] [CrossRef]
- Environment Protection Authority Victoria. EPA Annual Report 2017–18; Sustainability Victoria: Melbourne, VIC, Australia, 2018. [Google Scholar]
- Berglund, B.; Lindvall, T.; Schwela, D.H.; World Health Organization Occupational and Environmental Health Team. Guide-Lines for Community Noise; World Health Organization: London, UK, 1999. [Google Scholar]
- Banerjee, D. Road Traffic Noise and Self-Reported Sleep Disturbance: Results from a Cross-Sectional Study in Western India. Noise Vib. Worldw. 2013, 44, 10–17. [Google Scholar] [CrossRef]
- Acoustic Glossary L-Definitions, Terms, Units, Measurements; Gracey & Associates: Upper Dean, UK. Available online: https://www.acoustic-glossary.co.uk/definitions-l.htm (accessed on 1 September 2018).
- Pandya, G.H. Urban Noise—A Need for Acoustic Planning. Environ. Monit. Assess. 2001, 67, 379–388. [Google Scholar] [CrossRef]
- Banerjee, D.; Chakraborty, S.K.; Bhattacharyya, S.; Gangopadhyay, A. Evaluation and Analysis of Road Traffic Noise in Asansol: An Industrial Town of Eastern India. Int. J. Environ. Res. Public Health 2008, 5, 165–171. [Google Scholar] [CrossRef] [Green Version]
- CPCB. Noise Pollution Regulations in India; CPCB: Delhi, India, 2001. [Google Scholar]
- MAVDT. Resolución 0627 de 2006. Norma Nacional de Emisión de Ruido y Ruido Ambiental; MAVDT: Bogota, Colombia, 2006. [Google Scholar]
- SCENR. Qatar State Environmental Protection Law 2002; SCENR: Doha, Qatar, 2002. [Google Scholar]
- Hammer, M.S.; Swinburn, T.K.; Neitzel, R.L. Environmental Noise Pollution in the United States: Developing an Effective Public Health Response. Environ. Health Perspect. 2014, 122, 115–119. [Google Scholar] [CrossRef] [Green Version]
- US Environmental Protection Agency. EPA Identifies Noise Levels Affecting Health and Welfare; US Government Printing Office: Washington, DC, USA, 1974.
- King, G.; Roland-Mieszkowski, M.; Jason, T.; Rainham, D.G. Noise Levels Associated with Urban Land Use. J. Hered. 2012, 89, 1017–1030. [Google Scholar] [CrossRef] [Green Version]
- Prasanchuk, S. Noise pollution. Its effect on health and hearing—Thailand as a case study. In PDH Informal Consultation on the Prevention of Noise-Induced Hearing Loss; World Health Organization: Geneva, Switzerland, 1997. [Google Scholar]
- Obaidat, M.T. Spatial Mapping of Traffic Noise Levels in Urban Areas. J. Transp. Res. Forum 2011, 47, 1711. [Google Scholar] [CrossRef]
- Ahmed, K.I.; Pandya, G.H.; Stoilova, K.; Stoilov, T.; Babisch, W.; Beule, B.; Kokowski, P. Analysis of traffic noise in a road intersection configuration. Appl. Acoust. 2016, 12, 1–8. [Google Scholar]
- Mehdi, M.R.; Kim, M.; Seong, J.C.; Arsalan, M.H. Spatio-temporal patterns of road traffic noise pollution in Karachi, Pakistan. Environ. Int. 2011, 37, 97–104. [Google Scholar] [CrossRef]
- Vilas, P.; Prashant, N.P. Measurement and Analysis of Noise at Signalised Intersections. J. Environ. Res. Dev. 2015, 9, 662. [Google Scholar]
- Arif, A.M.; Ali, M.A. Differentiating Sources of Noise at Busy Road Intersections in Dhaka City. Int. Proc. Chem. Biol. Environ. Eng. 2014, 78, 6–10. [Google Scholar]
- Lee, E.Y.; Jerrett, M.; Ross, Z.; Coogan, P.F.; Seto, E.Y. Assessment of traffic-related noise in three cities in the United States. Environ. Res. 2014, 132, 182–189. [Google Scholar] [CrossRef] [Green Version]
- McAlexander, T.P.; Gershon, R.R.M.; Neitzel, R.L. Street-level noise in an urban setting: Assessment and contribution to personal exposure. Environ. Health 2015, 14, 18. [Google Scholar] [CrossRef] [Green Version]
- Seong, J.C.; Park, T.H.; Ko, J.H.; Chang, S.; Kim, M.; Holt, J.B.; Mehdi, M.R. Modeling of road traffic noise and estimated human exposure in Fulton County, Georgia, USA. Environ. Int. 2011, 37, 1336–1341. [Google Scholar] [CrossRef]
- Carrier, M.; Apparicio, P.; Séguin, A.M. Road traffic noise in Montreal and environmental equity: What is the situation for the most vulnerable population groups? J. Transp. Geogr. 2016, 51, 1–8. [Google Scholar] [CrossRef]
- Apparicio, P.; Carrier, M.; Gelb, J.; Séguin, A.-M.; Kingham, S. Cyclists’ exposure to air pollution and road traffic noise in central city neighbourhoods of Montreal. J. Transp. Geogr. 2016, 57, 63–69. [Google Scholar] [CrossRef] [Green Version]
- Sommerhoff, J.; Recuero, M.; Suárez, E. Community noise survey of the city of Valdivia, Chile. Appl. Acoust. 2004, 65, 643–656. [Google Scholar] [CrossRef]
- Calixto, A.; Diniz, F.B.; Zannin, P.H. The statistical modeling of road traffic noise in an urban setting. Cities 2003, 20, 23–29. [Google Scholar] [CrossRef]
- Ky, N.M.; Lap, B.Q.; Hung, N.T.Q.; Thanh, L.M.; Linh, P.G. Investigation and Assessment of Road Traffic Noise: A Case Study in Ho Chi Minh City, Vietnam. Water Air Soil Pollut. 2021, 232, 259. [Google Scholar] [CrossRef]
- Abo-Qudais, S.; Alhiary, A. Statistical models for traffic noise at signalized intersections. Build. Environ. 2007, 42, 2939–2948. [Google Scholar] [CrossRef]
- Hamad, K.; Khalil, M.; Shanableh, A. Modeling roadway traffic noise in a hot climate using artificial neural networks. Transp. Res. Part D Transp. Environ. 2017, 53, 161–177. [Google Scholar] [CrossRef]
- Elmehdi, H.M. Using mathematical models to predict annoyance from combined noise sources in the city of Dubai. In Inter Noise; Citeseer: Melbourne, VIC, Australia, 2014. [Google Scholar]
- Abdur-Rouf, K.; Shaaban, K. Comparing Traffic Noise Levels between Signalized Intersections and Roundabouts in an Urban Environment. Transp. Res. Rec. J. Transp. Res. Board 2022, 03611981221088219. [Google Scholar] [CrossRef]
- Abdur-Rouf, K.; Shaaban, K. Development of prediction models of transportation noise for roundabouts and signalized intersections. Transp. Res. Part D Transp. Environ. 2022, 103, 103174. [Google Scholar] [CrossRef]
- Tageldin, A.; Sayed, T.; Shaaban, K. Comparison of Time-Proximity and Evasive Action Conflict Measures: Case Studies from Five Cities. Transp. Res. Rec. J. Transp. Res. Board 2017, 2661, 19–29. [Google Scholar] [CrossRef]
- Shaaban, K.; Gaweesh, S.; Ahmed, M.M. Investigating in-vehicle distracting activities and crash risks for young drivers using structural equation modeling. PLoS ONE 2020, 15, e0235325. [Google Scholar] [CrossRef] [PubMed]
- Ghanim, M.S.; Shaaban, K. A Case Study for Surrogate Safety Assessment Model in Predicting Real-Life Conflicts. Arab. J. Sci. Eng. 2018, 44, 4225–4231. [Google Scholar] [CrossRef]
- Shaaban, K.; Abdelwarith, K. Understanding the association between cell phone use while driving and seat belt noncom-pliance in Qatar using logit models. J. Transp. Saf. Secur. 2020, 12, 292–308. [Google Scholar]
- Elhassy, Z.; Abou-Senna, H.; Shaaban, K.; Radwan, E. The Implications of Converting a High-Volume Multilane Roundabout into a Turbo Roundabout. J. Adv. Transp. 2020, 2020, 5472806. [Google Scholar] [CrossRef]
- Shaaban, K.; Gharraie, I.; Sacchi, E.; Kim, I. Severity analysis of red-light-running-related crashes using structural equation modeling. J. Transp. Saf. Secur. 2019, 13, 278–297. [Google Scholar] [CrossRef]
- Shaaban, K.; Hamad, H. Critical Gap Comparison between One-, Two-, and Three-Lane Roundabouts in Qatar. Sustainability 2020, 12, 4232. [Google Scholar] [CrossRef]
- Shaaban, K.; Shakeel, K.; Rashidi, T.H.; Kim, I. Measuring users’ satisfaction of the road network using structural equation modeling. Int. J. Sustain. Transp. 2021, 1–12. [Google Scholar] [CrossRef]
- Shaaban, K.; Abouzaid, A.; Musleh, A.; Hout, M.F. An Investigation of Traffic Noise Levels Around a Major Hospital in Qatar. In Proceedings of the International Conference on Applied Human Factors and Ergonomics, San Diego, CA, USA, 16–20 July 2020; Springer: Cham, Switzerland, 2020; Volume 1212, pp. 354–360. [Google Scholar] [CrossRef]
- Shaaban, K.; Abouzaid, A. Assessment of Traffic Noise Near Schools in a Developing Country. Transp. Res. Procedia 2021, 55, 1202–1207. [Google Scholar] [CrossRef]
- Sound Level Frequency Weightings—Acoustic Glossary; Gracey & Associates: Upper Dean, UK, 2022.
- U.S. Department of Transportation—Federal Highway Administration. Highway Traffic Noise Analysis and Abatement Policy and Guidance—Noise Fundamentals; U.S. Department of Transportation—Federal Highway Administration: Washington, DC, USA, 2017.
- ISO. Attenuation of Sound during Propagation Outdoors Part 1: Calculation of the Absorption of Sound by the Atmosphere. In Acoustics; International Organization for Standardization (ISO): Geneva, Switzerland, 1993. [Google Scholar]
- ISO. Attenuation of Sound During Propagation Outdoors Part 2: General Method of Calculation. In Acoustics; International Organization for Standardization (ISO): Geneva, Switzerland, 1996. [Google Scholar]
- Debnath, A.; Singh, P.K. Environmental traffic noise modelling of Dhanbad township area—A mathematical based approach. Appl. Acoust. 2018, 129, 161–172. [Google Scholar] [CrossRef]
- Burgess, M.; MacPherson, J. Overview of Australian Road Traffic Noise Policy Acoust. Aust. 2016, 44, 227–234. [Google Scholar] [CrossRef]
- Shaaban, K. Why Don ‘t People Ride Bicycles in High—Income Developing Countries, and Can Bike—Sharing Be the Solution? The Case of Qatar. Sustainability 2020, 22, 1–18. [Google Scholar]
- Shaaban, K. Assessing Sidewalk and Corridor Walkability in Developing Countries. Sustainability 2019, 11, 3865. [Google Scholar] [CrossRef] [Green Version]
- Shaaban, K.; Maher, A. Using the theory of planned behavior to predict the use of an upcoming public transportation service in Qatar. Case Stud. Transp. Policy 2019, 8, 484–491. [Google Scholar] [CrossRef]
- Shaaban, K.; Siam, A.; Badran, A.; Shamiyah, M. A simple method to assess walkability around metro stations. Int. J. Sustain. Soc. 2018, 10, 1–19. [Google Scholar] [CrossRef]
- Ow, L.F.; Ghosh, S. Urban cities and road traffic noise: Reduction through vegetation. Appl. Acoust. 2017, 120, 15–20. [Google Scholar] [CrossRef]
- Van Renterghem, T.; Botteldooren, D.; Verheyen, K. Road traffic noise shielding by vegetation belts of limited depth. J. Sound Vib. 2012, 331, 2404–2425. [Google Scholar] [CrossRef] [Green Version]
- Van Renterghem, T. Towards explaining the positive effect of vegetation on the perception of environmental noise. Urban For. Urban Green. 2019, 40, 133–144. [Google Scholar] [CrossRef]
- Potvin, S.; Apparicio, P.; Séguin, A.-M. The spatial distribution of noise barriers in Montreal: A barrier to achieve environmental equity. Transp. Res. Part D Transp. Environ. 2019, 72, 83–97. [Google Scholar] [CrossRef]
- Lee, H.P.; Lim, K.M.; Kumar, S. Noise assessment of elevated rapid transit railway lines and acoustic performance comparison of different noise barriers for mitigation of elevated railway tracks noise. Appl. Acoust. 2021, 183, 108340. [Google Scholar] [CrossRef]


| Noise Rating Scale [16] | Noise Risk Zone Criteria [17] | ||
|---|---|---|---|
| Day–Night Level dB(A) | Noise Exposure | Noise Level dB(A) | Risk Zone |
| ≤55 | Minimal | ||
| 56–60 | Moderate | ||
| 61–65 | Significant | <66 | Safe |
| 66–70 | Severe | 66–71 | Tolerable |
| 71–76 | Moderately Severe | 71–76 | Low Risk |
| ≥76 | Very Severe | 76–81 | Moderate Risk |
| 81–86 | High Risk | ||
| >86 | Extremely High Risk | ||
| Columbia [19] | India [18] | Qatar [20] | ||||||
|---|---|---|---|---|---|---|---|---|
| Land Use | Day | Night | Land Use | Day | Night | Land Use | Day | Night |
| Hospitals, libraries, public health buildings, etc. | 55 | 50 | Silence zone (areas 100 m around hospitals, educational institutions, and public service buildings) | 50 | 40 | |||
| Residential, hotels, educational institutions, research facilities, parks, etc. | 65 | 55 | Residential | 55 | 45 | Residential and public corporations (schools, hospitals, and mosques) | 55 | 45 |
| Commercial | 65 | 55 | Commercial (department stores, business offices, garages, and places of work) | 65 | 55 | |||
| Commercial and industrial | 75 | 75 | Industrial | 75 | 70 | Industrial facilities | 75 | 75 |
| Site | Intersection Type | Approach | Street Name | Speed Limit, km/h | Total Lanes | Mean Slope, G% |
|---|---|---|---|---|---|---|
| 1 | Siganlized Intersection | NB/SB | Al Sidr St | 80 | 28 | −1.6 |
| EB/WB | Snay bu Hasa St | |||||
| 2 | Roundabout | NB/SB | Al Sidr St | 80 | 11 | −1.6 |
| EB/WB | Snay bu Hasa St | |||||
| 3 | Signalized Intersection | NB/SB | Al-Aziziya St | 50 | 12 | 0.7 |
| EB/WB | Osama Bint Zaid St. | |||||
| 4 | Roundabout | NB/SB | Umm Al Seneem St | 80 | 8 | 1.1 |
| EB/WB | Khaled Bin Ahmed St | 50 | ||||
| 5 | Signalized Intersection | NB/SB | Jasim Bin Hamad St | 80 | 28 | −0.3 |
| EB/WB | Al Jazira Al Arabiya St | |||||
| 6 | Rounabout | NB/SB | Al Sedaira St | 80 | 10 | −0.8 |
| EB/WB | Al Waab St | |||||
| 7 | Signalized Intersection | NB/SB | Al Zaghwa St | 80 | 16 | −0.9 |
| EB/WB | Zekreet St | 60 | ||||
| 8 | Roundabout | NB/SB | Wadi Lubara St | 50 | 8 | −0.4 |
| EB/WB | Rawdat Al Thekhriya St. |
| Weekday Site Avg. (n = 16) | Weekend Site Avg. (n = 16) | Site Avg. (n = 32) | |||||||
|---|---|---|---|---|---|---|---|---|---|
| Site ID | Temp. (°C) | Rel. Hum. (%) | Wind (m/s) | Temp. (°C) | Rel. Hum. (%) | Wind (m/s) | Temp. (°C) | Rel. Hum. (%) | Wind (m/s) |
| 1 | 32.2 | 70.2 | 0.7 | 32.0 | 69.7 | 0.8 | 32.1 | 70.0 | 0.7 |
| 2 | 39.9 | 62.3 | 0.5 | 37.2 | 60.5 | 0.4 | 38.6 | 61.4 | 0.4 |
| 3 | 27.6 | 61.8 | 1.7 | 30.6 | 73.1 | 0.5 | 29.1 | 67.5 | 1.1 |
| 4 | 31.1 | 60.6 | 0.7 | 28.3 | 66.6 | 1.3 | 29.7 | 63.6 | 1.0 |
| 5 | 30.9 | 60.7 | 1.1 | 31.5 | 61.8 | 0.6 | 31.2 | 61.3 | 0.9 |
| 6 | 32.9 | 64.6 | 0.7 | 30.8 | 67.4 | 0.8 | 31.9 | 66.0 | 0.8 |
| 7 | 24.5 | 62.8 | 1.3 | 27.4 | 71.5 | 0.4 | 25.9 | 67.1 | 0.9 |
| 8 | 25.6 | 61.3 | 0.5 | 26.8 | 60.7 | 0.5 | 26.2 | 61.0 | 0.5 |
| Mean | 30.6 | 63.0 | 0.9 | 30.6 | 66.4 | 0.7 | 30.6 | 64.7 | 0.8 |
| LAFeq.1h, dB(A) | Min. | Max. | ||||||
|---|---|---|---|---|---|---|---|---|
| Location | 1 | 2 | 3 | 4 | 5 | 6 | 7 | 8 |
| Weekday | ||||||||
| Mean | 73.7 | 71.7 | 67.5 | 77.4 | 76.1 | 76.2 | 71.2 | 72.4 |
| St. Error | 0.3 | 0.3 | 0.3 | 0.2 | 0.3 | 0.1 | 0.2 | 0.4 |
| Median | 73.4 | 72.0 | 67.5 | 77.3 | 75.9 | 76.2 | 71.4 | 72.4 |
| St. Dev. | 1.3 | 1.2 | 1.1 | 0.6 | 1.4 | 0.4 | 0.9 | 1.5 |
| Variance | 1.8 | 1.4 | 1.3 | 0.4 | 1.8 | 0.2 | 0.8 | 2.1 |
| Range | 5.5 | 3.9 | 3.7 | 2.6 | 5.8 | 1.5 | 3.3 | 5.7 |
| Min. | 70.9 | 69.1 | 65.7 | 76.1 | 74.8 | 75.4 | 69.1 | 69.1 |
| Max. | 76.4 | 73.0 | 69.4 | 78.7 | 80.6 | 76.9 | 72.4 | 74.9 |
| Weekend | ||||||||
| Mean | 69.8 | 74.9 | 67.3 | 76.7 | 74.4 | 74.4 | 70.8 | 69.2 |
| St. Error | 0.3 | 0.1 | 0.7 | 0.3 | 0.3 | 0.4 | 0.2 | 0.5 |
| Median | 70.0 | 75.0 | 66.8 | 76.7 | 74.6 | 75.3 | 70.6 | 69.2 |
| St. Dev. | 1.3 | 0.6 | 2.9 | 1.1 | 1.3 | 1.8 | 0.9 | 1.8 |
| Variance | 1.8 | 0.3 | 8.6 | 1.2 | 1.7 | 3.2 | 0.8 | 3.3 |
| Range | 5.1 | 1.9 | 13.1 | 3.8 | 5.8 | 4.8 | 3.8 | 7.0 |
| Min. | 66.6 | 74.0 | 63.5 | 74.7 | 71.2 | 71.6 | 69.5 | 65.8 |
| Max. | 71.7 | 75.9 | 76.6 | 78.5 | 77.0 | 76.4 | 73.3 | 72.7 |
| Location | 1 | 2 | 3 | 4 | 5 | 6 | 7 | 8 | |
|---|---|---|---|---|---|---|---|---|---|
| Weekday | |||||||||
| Morning | 6:00–7:00 | 73.0 | 68.2 | 67.4 | 77.9 | 75.5 | 76.8 | 72.0 | 73.3 |
| 7:00–8:00 | 72.8 | 71.0 | 66.4 | 76.1 | 75.2 | 76.1 | 71.1 | 73.7 | |
| 8:00–9:00 | 73.1 | 71.6 | 65.7 | 77.3 | 75.8 | 76.1 | 71.9 | 72.8 | |
| 9:00–10:00 | 73.5 | 72.6 | 69.4 | 77.2 | 75.7 | 75.9 | 71.1 | 72.4 | |
| 10:00–11:00 | 74.5 | 70.8 | 68.7 | 77.6 | 76.2 | 75.4 | 71.4 | 73.0 | |
| Afternoon | 11:00–12:00 | 73.3 | 71.1 | 68.6 | 78.3 | 76.4 | 76.2 | 71.9 | 73.8 |
| 12:00–13:00 | 72.5 | 70.6 | 67.9 | 77.4 | 76.3 | 76.4 | 70.3 | 72.4 | |
| 13:00–14:00 | 74.8 | 70.7 | 67.6 | 77.5 | 80.3 | 75.8 | 71.1 | 74.0 | |
| 14:00–15:00 | 73.2 | 71.8 | 66.8 | 76.9 | 76.9 | 76.2 | 72.0 | 74.9 | |
| 15:00–16:00 | 75.9 | 69.8 | 66.6 | 76.9 | 75.9 | 76.3 | 71.6 | 72.1 | |
| Evening | 16:00–17:00 | 76.4 | 69.6 | 66.6 | 78.7 | 75.6 | 76.9 | 72.4 | 71.7 |
| 17:00–18:00 | 73.1 | 69.4 | 67.5 | 78.2 | 75.1 | 76.3 | 71.5 | 71.2 | |
| 18:00–19:00 | 73.7 | 68.4 | 69.1 | 77.5 | 74.8 | 76.2 | 71.0 | 71.8 | |
| 19:00–20:00 | 74.4 | 69.1 | 66.4 | 77.1 | 80.6 | 76.2 | 71.5 | 71.5 | |
| 20:00–21:00 | 70.9 | 69.6 | 68.7 | 77.2 | 74.8 | 76.7 | 69.1 | 70.2 | |
| 21:00–22:00 | 74.0 | 69.7 | 66.5 | 76.9 | 75.9 | 75.7 | 69.6 | 69.1 | |
| Weekend | |||||||||
| Morning | 6:00–7:00 | 66.6 | 62.4 | 63.5 | 74.7 | 71.2 | 71.6 | 70.4 | 65.8 |
| 7:00–8:00 | 68.4 | 63.1 | 64.3 | 75.0 | 72.6 | 71.7 | 70.3 | 66.7 | |
| 8:00–9:00 | 68.8 | 63.2 | 65.4 | 76.7 | 75.6 | 72.7 | 70.1 | 67.6 | |
| 9:00–10:00 | 69.1 | 64.3 | 67.2 | 77.0 | 74.7 | 72.6 | 71.2 | 68.1 | |
| 10:00–11:00 | 69.4 | 63.7 | 66.7 | 77.9 | 74.4 | 72.7 | 70.5 | 68.6 | |
| Afternoon | 11:00–12:00 | 68.5 | 64.9 | 66.2 | 78.3 | 74.9 | 72.6 | 71.4 | 70.0 |
| 12:00–13:00 | 70.1 | 64.7 | 69.1 | 78.5 | 74.2 | 74.4 | 69.5 | 70.1 | |
| 13:00–14:00 | 71.2 | 65.0 | 67.8 | 77.0 | 77.0 | 75.1 | 70.1 | 70.2 | |
| 14:00–15:00 | 71.1 | 64.3 | 76.6 | 76.7 | 74.2 | 75.8 | 70.7 | 71.6 | |
| 15:00–16:00 | 71.7 | 64.3 | 69.4 | 77.7 | 74.8 | 76.1 | 71.9 | 71.3 | |
| Evening | 16:00–17:00 | 71.5 | 67.4 | 68.3 | 76.6 | 75.7 | 76.1 | 73.3 | 69.2 |
| 17:00–18:00 | 70.4 | 69.4 | 66.8 | 77.6 | 74.7 | 76.4 | 71.0 | 68.3 | |
| 18:00–19:00 | 70.4 | 67.5 | 67.7 | 76.1 | 74.4 | 75.5 | 71.5 | 69.5 | |
| 19:00–20:00 | 69.9 | 67.2 | 66.7 | 76.0 | 74.9 | 75.9 | 70.3 | 69.1 | |
| 20:00–21:00 | 70.0 | 68.2 | 66.1 | 76.1 | 74.1 | 75.6 | 71.0 | 68.2 | |
| 21:00–22:00 | 69.3 | 69.9 | 65.7 | 75.9 | 73.7 | 76.3 | 69.9 | 72.7 | |
| Color scales (dB(A)) | ≥53 dB(A), max. allowed | 60.0 | 70.0 | 80.0 | |||||
| Location | Weekday | Weekend | ||||
|---|---|---|---|---|---|---|
| LAFeq.Morning, dB(A) | LAFeq.Afternoon, dB(A) | LAFeq.Evening, dB(A) | LAFeq.Morning, dB(A) | LAFeq.Afternoon, dB(A) | LAFeq.Evening, dB(A) | |
| 1 | 73.4 | 74.1 | 74.1 | 68.6 | 70.7 | 70.3 |
| 2 | 71.1 | 70.8 | 69.3 | 63.4 | 64.6 | 68.4 |
| 3 | 67.7 | 67.6 | 67.6 | 65.6 | 71.6 | 67.0 |
| 4 | 77.3 | 77.4 | 77.6 | 76.4 | 77.7 | 76.4 |
| 5 | 75.7 | 77.5 | 76.7 | 74.0 | 75.2 | 74.6 |
| 6 | 76.1 | 76.2 | 76.4 | 72.3 | 75.0 | 76.0 |
| 7 | 71.5 | 71.4 | 71.0 | 70.5 | 70.8 | 71.3 |
| 8 | 73.1 | 73.5 | 71.0 | 67.5 | 70.7 | 69.8 |
| Color scales (dB(A)) | ≥53 dB(A), max. allowed | 60.0 | 70.0 | 80.0 | ||
Publisher’s Note: MDPI stays neutral with regard to jurisdictional claims in published maps and institutional affiliations. |
© 2022 by the authors. Licensee MDPI, Basel, Switzerland. This article is an open access article distributed under the terms and conditions of the Creative Commons Attribution (CC BY) license (https://creativecommons.org/licenses/by/4.0/).
Share and Cite
Abdur-Rouf, K.; Shaaban, K. Measuring, Mapping, and Evaluating Daytime Traffic Noise Levels at Urban Road Intersections in Doha, Qatar. Future Transp. 2022, 2, 625-643. https://doi.org/10.3390/futuretransp2030034
Abdur-Rouf K, Shaaban K. Measuring, Mapping, and Evaluating Daytime Traffic Noise Levels at Urban Road Intersections in Doha, Qatar. Future Transportation. 2022; 2(3):625-643. https://doi.org/10.3390/futuretransp2030034
Chicago/Turabian StyleAbdur-Rouf, Khadija, and Khaled Shaaban. 2022. "Measuring, Mapping, and Evaluating Daytime Traffic Noise Levels at Urban Road Intersections in Doha, Qatar" Future Transportation 2, no. 3: 625-643. https://doi.org/10.3390/futuretransp2030034
APA StyleAbdur-Rouf, K., & Shaaban, K. (2022). Measuring, Mapping, and Evaluating Daytime Traffic Noise Levels at Urban Road Intersections in Doha, Qatar. Future Transportation, 2(3), 625-643. https://doi.org/10.3390/futuretransp2030034