Article

Effect of COVID-19 on Attitude and Travel Mode Based on Walking Distance—The Moderated Mediation Model

by
Chonnipa Puppateravanit
*,
Kazushi Sano
and
Kiichiro Hatoyama
Graduate School of Engineering, Nagaoka University of Technology, Nagaoka 940-2188, Japan
*
Author to whom correspondence should be addressed.
Future Transp. 2022, 2(2), 365-381; https://doi.org/10.3390/futuretransp2020020
Submission received: 8 March 2022 / Revised: 13 April 2022 / Accepted: 18 April 2022 / Published: 20 April 2022

Abstract

:
This study examines the relationship between travel modes and the attitudes of residents and travelers around mass transit stations. The importance of this study was emphasized by considering that the attitudes toward residence could affect future travel and relocation considerations. In particular, the outbreak of COVID-19 may have a significant effect on their relationship. To investigate the direct and indirect effects before and during the COVID-19 pandemic, a moderated mediation model was used to test the hypothesis of this study by three-step approach analysis. The attitude toward residence was defined to test the hypothesis of the mediator, and the walking distance to the nearest mass transit station was employed to identify the level of the moderator. The results indicated that the attitude toward residence mediated the relationship between the attitude toward travel mode and travel mode behavior. The sensitivity of COVID-19 accurately reflects the various effects on travel mode. Moreover, multi-group analyses show that walking distance moderators have a direct effect on attitudes toward travel mode and travel mode behavior as well as the attitude toward residence.

1. Introduction

The current impact of COVID-19 has illustrated a significant change in behavior and government management in the various disease control sectors, all of which have economic and social impacts. In addition, the effects on the economy, epidemic control policies, and concerns about the pandemic have directly affected people’s daily travel. Travel has influenced the outbreak and spread of infectious diseases. Travelers have been considered a key part of the surveillance process for emerging infections [1]. In the short term, changes in workday travel behavior will gradually occur as a consequence of the pandemic control measures, as well as restrictions on the use of public transportation services. Restricted measures of public transportation services have been implemented in order to avoid or minimize the COVID-19 pandemic. This might result in an increase in the number of people shifting to more frequent private car use and preferring active modes over public transport services [2]. COVID-19’s first wave in Switzerland reportedly led to a reduction in the average daily distance traveled by more than 60% and public transport by more than 90% [3]. Passenger numbers on Hong Kong’s subway declined by 42 percent, 86 percent, 73 percent, and 48 percent for adults, children, students, and senior citizens, respectively [4].
Nonetheless, the characteristics of each area led to different travel patterns. A study that classified the differences in travel behavior across the United States based on demographic characteristics found that people who live in urban areas and those with low incomes were more likely to be public transit riders [5], while the large majority of inner-city residents travel shorter distances than suburban residents [6]. Moreover, the residents’ who preferred traveling by train moved nearer to the stations and became regular passengers [7].
Furthermore, the assumption regarding the impact of COVID-19 on travel modes has not been confirmed in the case of those who live near mass transit stations and who have easy access to the stations as well as a variety of modes of transportation. As specified by the accessibility of mass transit stations, access significantly influences mode choice, and the distance from home to a mass transit station has an influence on the travelers’ mode of choice behavior [8]. In Bangkok, 77% of the population switched to public transport instead of private cars [9]. In contrast, during the COVID-19 pandemic, Thailand’s Department of Rail Transport disclosed that the ridership of mass transit decreased by approximately 80% in April compared to January 2020 [10]. Changes in travel behavior might be a result of socio-economic and psychological changes. Various studies have shown evidence of the psychological impact of travel behavior, such as personal lifestyles and attitudes [11]. In particular, by considering the travel attitudes and motivations for relocation, it was found that the reasons for relocation were travel-related [12]. These studies indicate that travel attitudes are more subject to changes in travel behavior.
Previous studies have demonstrated that travel behavior and mode choice may be differentiated in terms of the difference between walking distance access and mode choice [13]. Therefore, this study aims to explore the causal relationships between travel mode behavior and attitudes toward travel modes based on the relocation hypothesis that attitudes toward different travel modes are an important factor in location choice [14]. The intervention variable of attitude toward residence and the interaction variables of walking distance to the nearest mass transit station examine the direct and indirect effects before and during the COVID-19 pandemic. Moderated mediation models were used in a case study of the Bangkok Metropolitan Areas in Thailand.

2. Theoretical Framework and Hypothesis Development

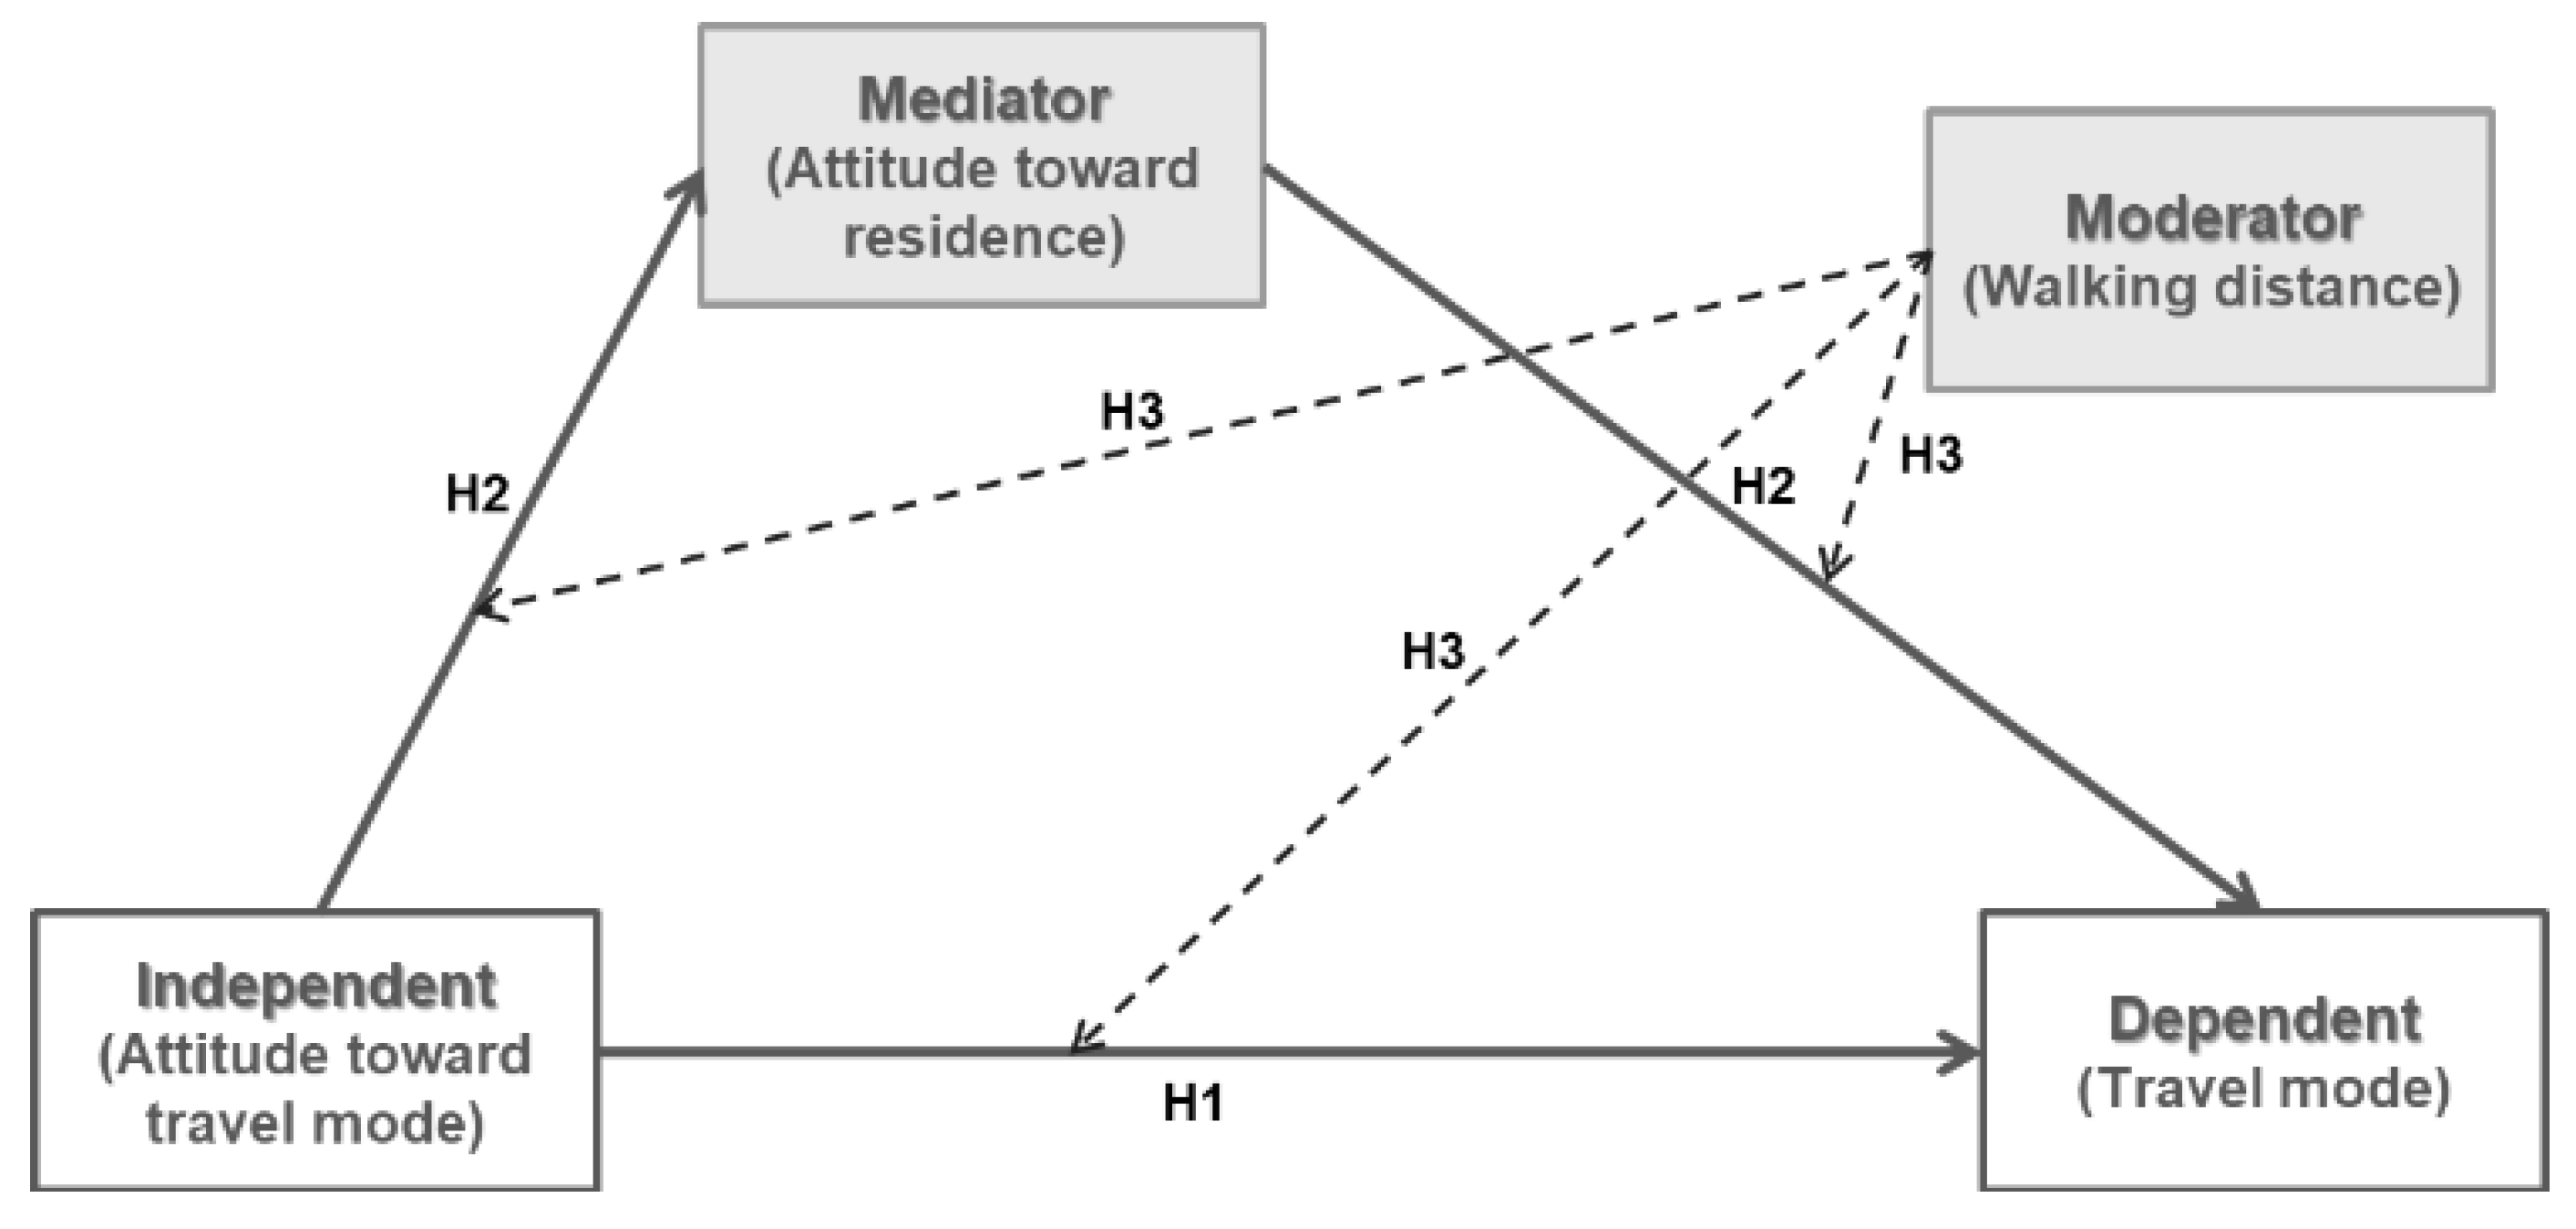
2.1. Mediation and Moderation Analysis

Mediation and moderation analysis are two of the most widely used statistical methods in the social, behavioral, and health sciences, as well as business, medicine, and other fields [15]. The mediation moderation model, or conditional process model, integrates mediation and moderation analysis to estimate and test a variety of hypotheses involving conditional indirect effects [16]. An indirect effect of mediation was defined as a relationship that flowed from an independent variable to a mediator and then to a dependent variable. In addition, a third variable can affect or change the direct influence of an independent variable on a dependent variable, which is referred to as moderation (moderator) [17].
In research studies on travel behavior, mediating effects of perception were employed to explore the relationship between the built environment and travel behavior and to examine the moderating effect of travel attitudes on the relationship [18], as well as to compare mediation and moderation models to test the causal relationship between capability influencing population density and travel time [19]. One study investigates the role played by the moderate-based and mediation-based models in affecting willingness to adopt different environmentally friendly sources of sustainable transportation to understand acceptability toward sustainable transportation behavior [20]. The moderated mediation model was used to study the behavior of tourists to gain insight into social norms of social distancing during the COVID-19 pandemic [21].
By determining the indirect correlation between the interaction factors and intervention effects, the moderated mediation model is appropriate for determining the relationship between factors and testing hypotheses based on latent variables of attitudes. In addition, the model could provide an inside view of various factors and relationships.

2.2. COVID-19 Effect on Travel Behavior

COVID-19 has had a widespread impact on various sectors, including everyday life and travel. A previous study on the relationship between the COVID-19 pandemic and changes in travel behavior found that travel demand was significantly reduced, with only shopping-related travel being undertaken [22]. According to a study of changes in travel behavior caused by the COVID-19 pandemic throughout the world, there was a major shift from public transportation to private cars and non-motorized modes [2]. In the short term, changes in workday travel behavior will gradually occur because of the pandemic control measures, as well as restrictions on the use of public transportation services. Restricted measures of public transportation services have been implemented to avoid or minimize the COVID-19 pandemic. Moreover, during COVID-19, passengers were more concerned about public transportation usage than they were before COVID-19 [23]. Additionally, because public transportation may not fully recover to pre-pandemic levels in terms of daily travel modes, many people will resort to more biking and walking than before [24].
COVID-19 change effects have the potential to influence people’s decision-making on attitudes and behavior. To emphasize the difference between effects before and during COVID-19, it is important to evaluate the influence of COVID-19 on the relationship between travel mode behavior and attitude change before and during COVID-19.

2.3. Relationship of Travel Attitude and Travel Behavior

To understand human behavior, Ajzen (1985) proposed the theory of planned behavior and suggested that behavior is determined by intentions, attitudes, and subjective norms between perceived behavioral control and behavior [25]. Moreover, in travel behavior research, the importance of perceptions and attitudes has been more considered. Perceived behavioral control is hypothesized to influence intention and behavior, whereas attitude is defined as an individual’s overall evaluation of their behavior. According to various studies, psychological factors have been studied to determine people’s decision-making in travel behavior and travel demand to improve the accuracy of forecasting data. Considering their influence on travel behavior, soft factors [11] are implemented in travel behavior research, such as attitudes and preferences for particular modes of travel or neighborhood characteristics [26]. Previous research suggests that attitudes and preferences toward travel, as well as residential neighborhoods, are the true predictors of travel patterns [27]. Furthermore, travel attitudes have been shown to significantly moderate the effects of perceptions on travel behavior [18] and may be related to the mode of transportation they use [11,28], while travel mode and attitude toward using that mode both have an impact [29].
Accordingly, this study focuses on attitudes by considering the relationship between attitudes toward travel mode and travel mode behavior, which might affect decision-making and actual behavior in the future. The attitude was applied to test hypotheses considered from the perspectives of accessibility [30], comfort [31], environment [32], and safety [33] of travel. The proposed hypotheses are as follows:
Hypothesis 1 (H1):
Attitude toward travel mode positively impacts travel mode behavior.

2.4. Mediating Influence of Attitude toward Residence

The relationship between travel behavior and household decisions about location or residential choice is called “residential self-selection.” Studies on residential self-selection frequently emphasize the importance of the built environment on travel behavior. Moreover, many previous studies have examined preferences for travel modes and residential choices. The results show that mode preference seems to be strongly associated with both travel behavior and residential choice [34]. According to a recent study, travel attitudes affect travel behavior and resident location choice. In addition, the residential environment affects attitudes toward specific modes of travel [14]. Residential self-selection, or the decision to live in a certain neighborhood, has an indirect effect on travel attitudes and satisfaction [22,35]. Residential choices are determined by travel attitude. Some research suggests that the type of residential neighborhood affects the choice of commuting mode [36].
However, residence-associated attributes could be split into two categories: housing attributes and others that are related to the location and neighborhood [37]. In addition, travel behavior was influenced by these attitudes and preferences for particular modes of travel or neighborhood characteristics [26]. Furthermore, residents prefer walkable neighborhoods [38] and public transportation [39]. During COVID-19, people’s preferences for housing types may change as a result of COVID-19 effects, and the quality of living environments will likely become more important [40]. Most of the research has demonstrated a correlation between residence choice and travel patterns, as well as attitudes toward travel itself. Neighborhood attitudes that are related to residential location are often considered in travel attitudes. In terms of residential self-selection or relocation, residential attitudes should be taken into more consideration. Separating resident attitudes from travel attitudes allows for a more in-depth study of the relationship between travel attitudes and travel behaviors.
To emphasize attitudes related to residential and travel behavior, this study proposes the attitude toward residence as a mediator to produce interventions on the relationship between the attitude toward travel mode and travel mode behavior. The attitude was applied to test hypotheses from the perspective of neighborhood, accessibility, the environment, and safety of residence. The proposed hypotheses are as follows:
Hypothesis 2 (H2):
Attitude toward residence mediates the relationship between attitude toward travel mode and travel mode behavior.

2.5. Moderating Influence of Walking Distance to Access Station

According to various studies, the built environment has a significant impact on residential choice, travel mode, and travel behavior. Studies on residential self-selection frequently emphasize the importance of the built environment on travel behavior due to the impact of the built environment on travel behavior. Residents who prefer to walk may consciously choose to live in walking-friendly neighborhoods, resulting in more walking [35]. Furthermore, the built environment has a direct and indirect effect on travel mode choice [41]. Because of the residential built environment, walkability, and regional accessibility, all of these things have an effect on the types of active transportation that are available and the distance traveled [42].
Walkability has been associated with physical activity. For example, residential density mediated the relationship between walking and the amount of time spent walking [43]. Nevertheless, none of the correlations between walkability parameters and physical activity outcomes were moderated by car ownership [44]. This demonstrates that the majority of relationships are formed as a result of other modes of travel, such as public transportation, instead of private cars. In the case of Bangkok, the results of comparing the utility of private vehicles and mass transit modes indicated that the distance from home to the mass transit station influenced the travelers’ mode choice behavior [8]. A previous study determining the association between the distance to a transit stop and transit access mode found that a longer distance is correlated with a lower probability of walking to public transit [45].
Generally, the walking distance to access rail transit mode for commuting trips was 1 km or less, and 1–1.6 km for bus transit [46]. In the San Francisco Bay Area, researchers discovered that pedestrians walked an average of 548 m and as far as 1100 m [47]. However, in the United States, the average distance between train stations is half a mile [48]. In Bangkok, the percentage of people who walked less than 400 m dropped after that, and less than 10% of people walked more than 1 km [13].
According to a previous study, the walking distance from a residential area to the nearest mass transit station was classified as less than 400 m, less than 1000 m, and more than 1000 m, which represents the accessibility of mass transit. Furthermore, walking distance variables (i.e., distance from the residence to the nearest mass transit station) are moderators that interact with all relationships, as shown in Figure 1. The proposed hypotheses are as follows:
Hypothesis 3 (H3):
Walking distance moderates the mediation effects of paths of the model on three levels of the moderator.

3. Data Collection

3.1. Survey Instrument

The target population of this study included residents of the current mass transit station and travelers near the mass transit station in the Bangkok metropolitan area. The survey designated an area within 1 km of the station to control the target respondents. The population in this study represents people around stations, mainly in the Bangkok area.
The survey was conducted in the Bangkok metropolitan area, which covers all existing mass transit stations in the area (as shown in Figure 2). In December 2020, the existing mass transit stations had six lines and 125 stations. The participants represented in this study were randomly selected from existing stations in three provinces, including Bangkok, Nonthaburi, and Samut Prakan. However, the pre-survey conducted online received a relatively low response rate. Consequently, data were collected using questionnaires and face-to-face interviews while observing social distancing. In this study, attitudes were divided into two categories: before COVID-19 and during COVID-19, to explore attitudes that may contribute to changes in travel behavior. As of 16 December 2020, there have been 4261 confirmed cases of COVID-19, with 60 deaths. In total, 2463 of these cases were spread by people living in the same area, and there have been 0 new cases of infection in Thailand [49].

3.2. Sample Characteristic

The distribution of questionnaires was conducted on a weekday in December 2020 to explore commuting trips. There was no lockdown on the day of the survey, which was carried out after the first wave of the outbreak. A total of 682 valid questionnaires were obtained. According to the participants’ residence locations, around 72 percent, 14 percent, 12 percent, and 2 percent of those that participated were from Bangkok, Nonthaburi, Samut Prakan, and Pathum Thani, respectively.
The sociodemographic characteristics of the participants are summarized in Table 1. The majority of the respondents were women (63%). Most of the participants were 18–24 years old (25%) and 25–34 years old (26%). In addition, 42% of the respondents had a bachelor’s degree, and 58% were employed. The majority of the households had two (30%) or three (26%) members. Approximately 50% of the respondents did not own a vehicle, and 61% did not have a transport card (e.g., Rabbit, MRT, MRT+, Smart pass, and Mangmoom). Respondents had residences near the mass transit station within 1 km (44%) and 400 m (29%).
According to the population of Bangkok in 2020, the total population was 8,854,718 people, and 52% were women [50]. However, the population in this study represents residents and travelers near the mass transit station area. In comparison to the general population of Bangkok, this may be a different circumstance. Referring to the previous study on data of station-area residents, it found that the respondent characteristics were female, 62.8%, and car ownership, at 58.7% [51]. This research found that the population of residents and travelers around a mass transit station were found to have similar characteristics.
The survey was conducted during the COVID-19 outbreak, and respondents were asked questions concerning their income before and during the pandemic. The COVID-19 pandemic affected the middle and high-income groups, with the range of 0–18,000 THB increasing by 2.9% (see Table 2). The travel mode was divided into four modes based on the main mode of the usual trip. Travel by mass transit was reduced from 72% to 69% during COVID-19. The total travel time increased by 3% in the 0–60 min range, and long trips (>61 min) decreased by 3%. However, the total travel costs decreased by 2% in the 51–100 THB range and increased by 2% in the 0–50 THB range.

4. Data Analysis and Results

To test the hypothesis, this research examined the measurement items to construct latent variables of attitude toward travel mode and attitude toward residence. The attitude items were measured using a five-point Likert scale ranging from 1 (strongly disagree) to 5 (strongly agree). In this study, attitudes toward travel modes were measured using a total of 18 items, and attitudes toward residence were measured using a total of 23 items. Exploratory factor analysis (EFA), confirmatory factor analysis (CFA), and structural equation modeling (SEM) were applied for analysis by SPSS statistical software and the AMOS software package.

4.1. Exploratory Factor Analysis (EFA)

EFA was used to extract measurement variables and to consider the latent variables of the measurement variables. The Kaiser–Mayer–Olkin (KMO) test of sampling adequacy was 0.902 and 0.928 before and during COVID-19, respectively. Nonetheless, the Cronbach’s alpha of each latent factor is higher than 0.7 (the cut-off value of the reliability test) [52]. The maximum likelihood estimate was used to determine the variance and correlation between factors. In the final analysis with Promax rotation, five groups were obtained before and during COVID-19 (see Table 3). According to the results of the factor analysis, the dimension factors of attitude toward travel modes, including attitude toward private cars and attitude toward public transportation, have an impact on this study. In addition, attitudes toward residential neighborhoods, attitudes toward urban areas, and attitudes toward residential locations were determined as the results for attitudes toward residence.

4.2. Confirmatory Factor Analysis (CFA)

After EFA was used to examine all factors, CFA was used to evaluate and confirm the structure of the corresponding factors. Before evaluating the structural model, the validity of the entire dataset of the measurement model must be validated. [53].
The results indicate that all standardized factor loadings of CFA before and during the COVID-19 model (see Figure 3) were significant, and the goodness of fit indicated an adequate fit of the measurement model in CFA, as shown in Table 4. According to the recommended index, the chi-square/degree of freedom (Chisq/df) is in the range of 1–4 [54], the root mean square of error approximation (RMSEA) is lower than 0.07 [55], the goodness of fit index (GFI) is greater than or equal to 0.09 [56], and the comparative fit index (CFI) and Tucker–Lewis Index (TLI) are greater than or equal to 0.09 [57].

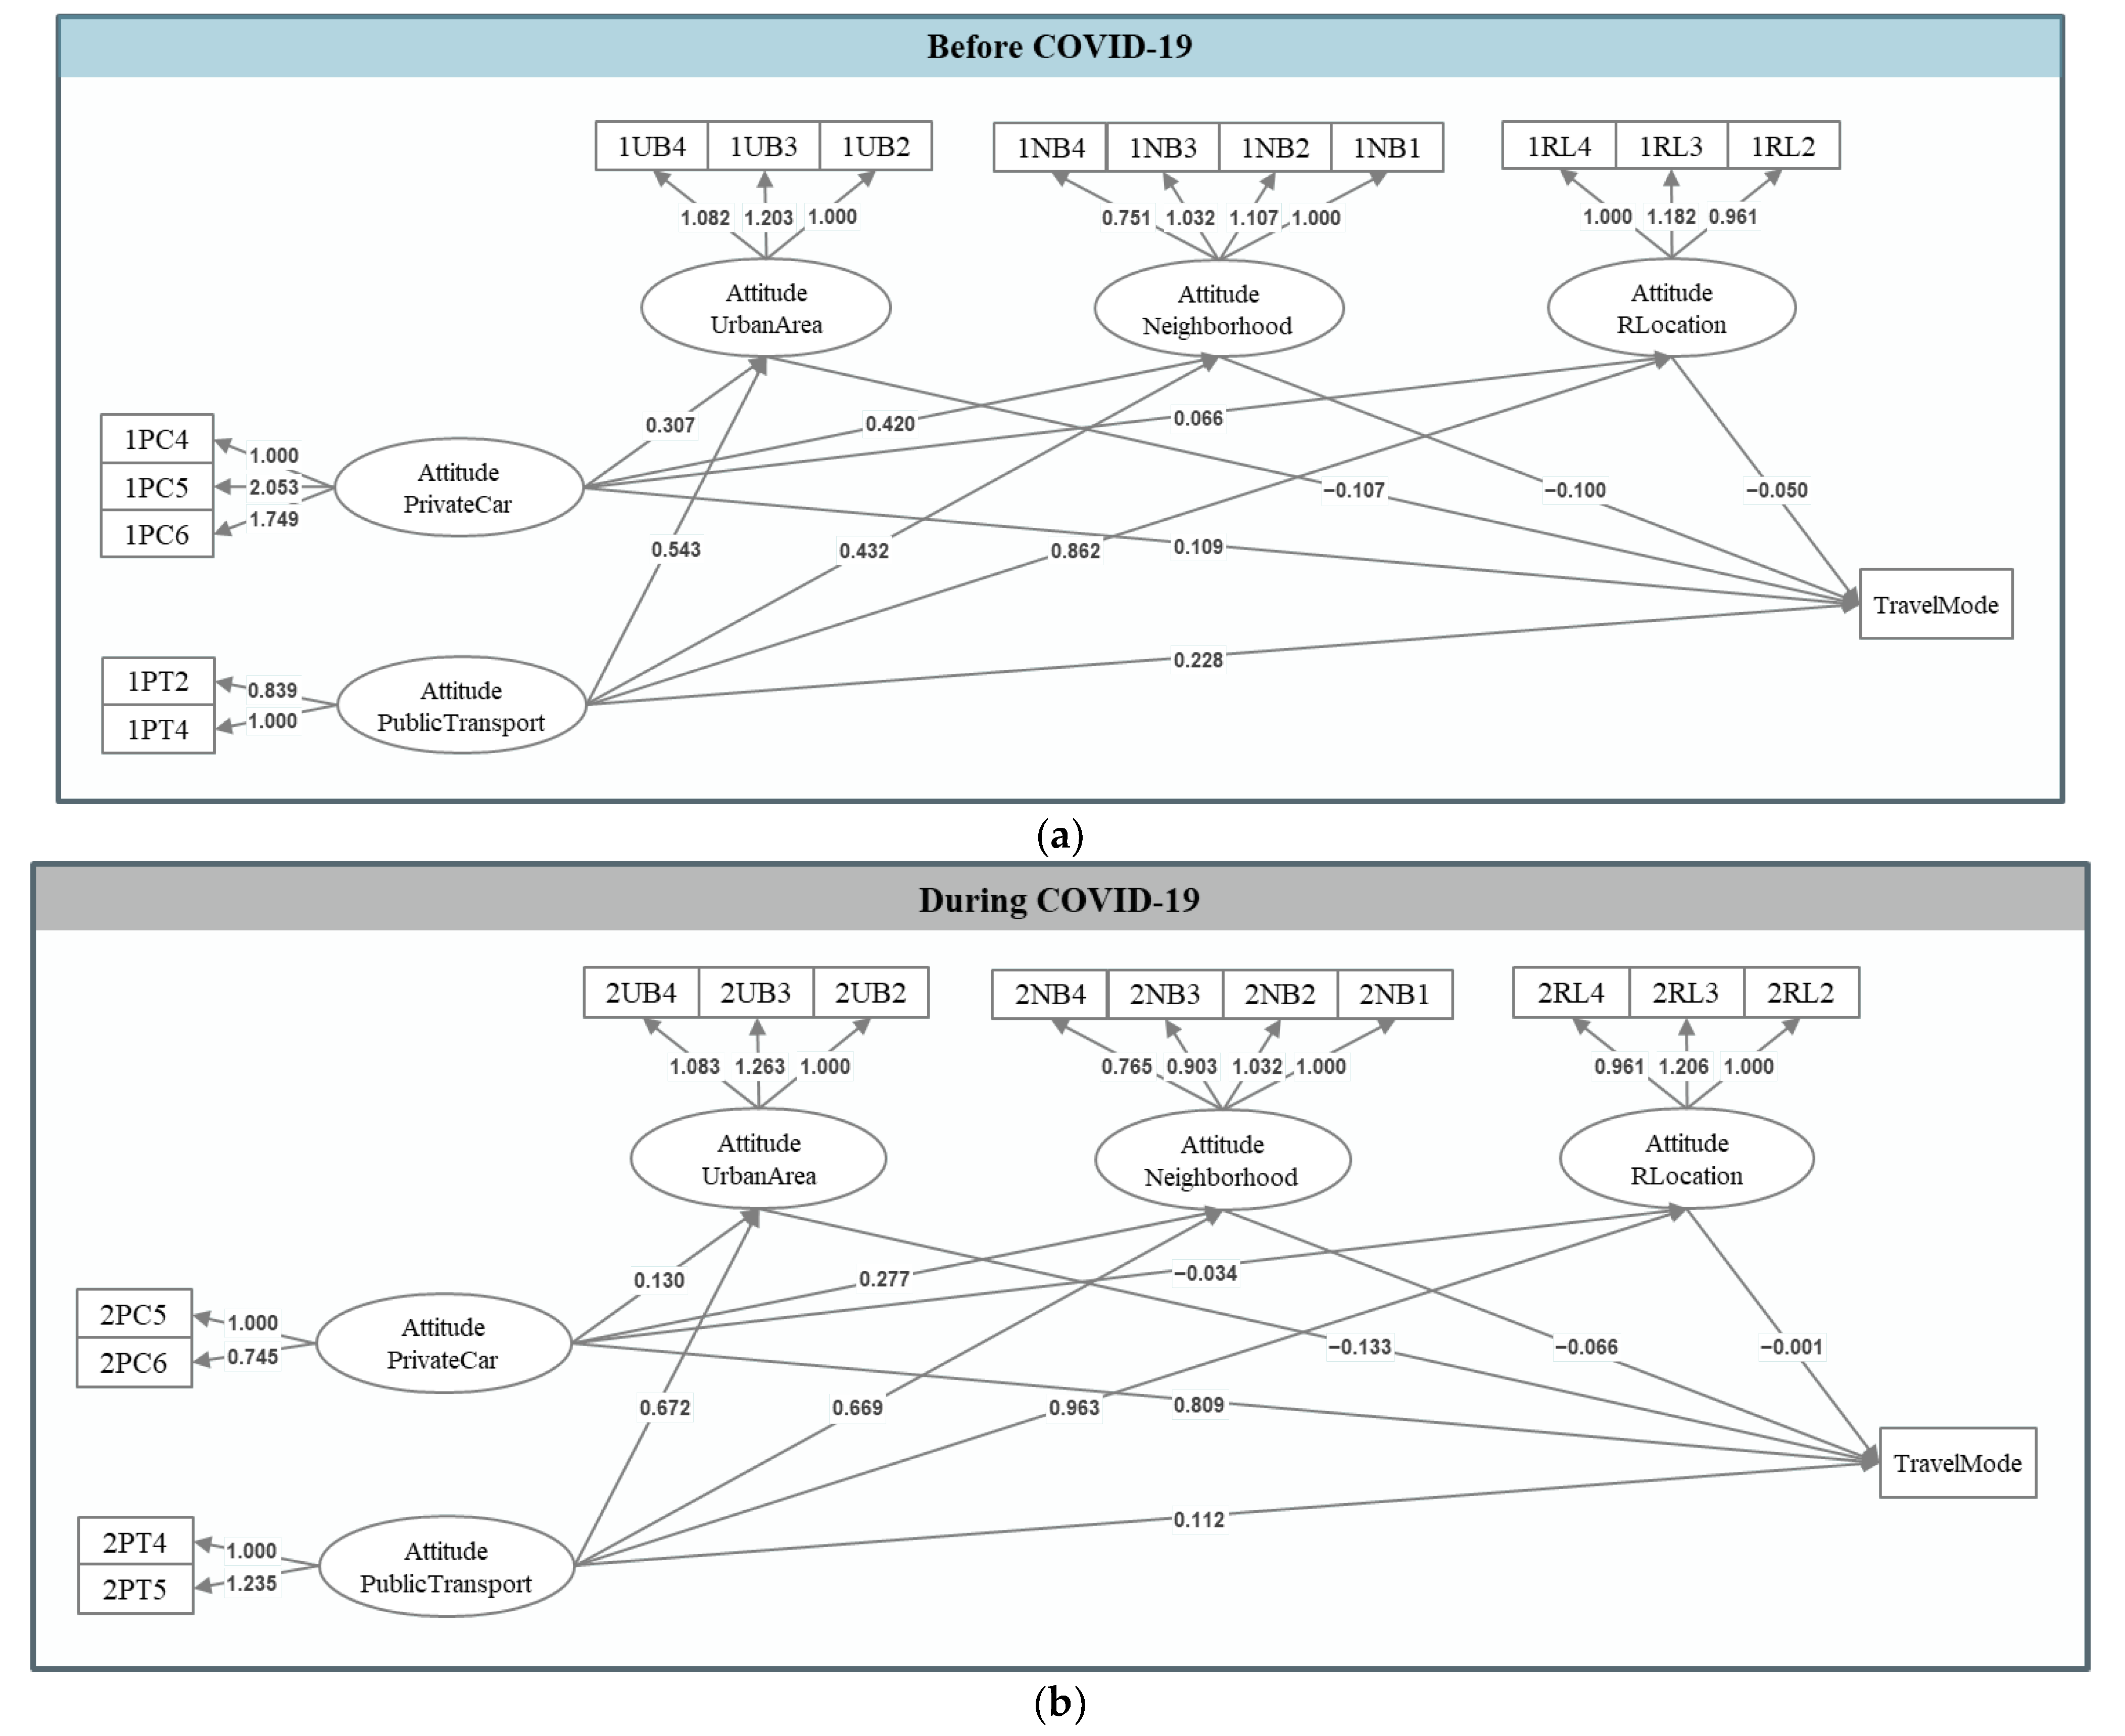
4.3. Structural Model

The structural model was going to be evaluated before hypotheses testing. In order to minimize the structural model’s complexity, second-order factor models were applied to construct it. The proposed structural model is demonstrated in Figure 4. The results of the structural model on path analysis are shown in Table 5, along with the models obtained before and during the COVID-19 model. The SEM results indicated the good fit of the model (as shown in Table 4) before and during the COVID-19 model were significant.
The structural model demonstrated the causal relationship effect of Hypothesis 1 (H1). The results indicate that the attitude toward private cars significantly impacts travel mode behavior, and the outcome supports Hypothesis 1a (H1a) at values of β = 0.109 and 0.089 before and during COVID-19, respectively. However, attitudes toward public transport have an insignificant impact on travel modes and do not support Hypothesis 1b (H1b).

4.4. Mediation Analysis

The bias-corrected bootstrap method was used to examine the significance of the mediation effect, and 95% confidence was defined at a significance level of 0.05. Finally, the mediation model was tested using 5000 bootstraps.
The result of the mediation effect in Hypothesis 2 (H2) was that attitudes toward urban areas, neighborhoods, and residential locations mediated the relationship between the attitudes toward travel modes (attitudes toward public transportation and attitudes toward private cars) and travel mode behavior. The mediated effect is shown in Table 6.
The mediated effect obtained was partially mediated between attitudes toward urban areas and attitudes toward private cars and travel mode behavior (H2a) during COVID-19 with a significant value of β = −0.017. Additionally, the attitude toward neighborhood to attitude toward private cars and travel mode behavior (H2b) was partially mediated at the significant value of β =−0.042 before COVID-19.
According to the causal relationship, the attitude toward public transport does not have a significant impact on travel mode and does support Hypothesis 1b (H1b). The outcome of the mediation effects shows that the relationship between the attitudes toward public transport and travel mode behavior (H2e) was fully mediated by attitudes toward neighborhood before COVID-19, with a significant value of β = -0.043.

4.5. Moderated Mediation Analysis

The moderating effect was evaluated using a multi-group moderation technique, which was divided into three groups: 1. walking distance of less than 400 m; 2. walking distance of less than 1000 m; and 3. walking distance of more than 1000 m from the residence to the nearest mass transit station. The model comparison of df (24) and χ2 (59.76) was significant at p = 0.000. This result revealed the moderating effect of various walking distances. Table 7 shows the standardized factor loading before and during COVID-19, regrading Hypothesis 3 (H3) as the walking distances interacting with all relationships.
Walking distance had a significant moderating effect on attitude toward travel mode and travel mode behavior for the relationship of attitude toward private cars and travel mode behavior (H3a), in which the moderator discovered a positive effect (= 0.231 and = 0.209 before and during COVID-19, respectively). People who walked a lot before and during COVID-19 didn’t see a connection between how they felt about public transportation and how they used public transportation (H3b).
Before and during COVID-19, all moderator groups had a significant direct effect on attitudes toward private cars and attitudes toward neighborhoods (H3d), attitudes toward public transportation and attitudes toward urban areas (H3f), and attitudes toward public transportation and attitudes toward residential locations (H3h). The direct effect of attitudes toward private cars on attitudes toward urban areas (H3c) was significant before and during COVID-19 at walking distances of less than 1000 m and more than 1000 m groups. Furthermore, the relationship between attitudes toward private cars and attitudes toward residential locations (H3e) was significant for both cases (before and during COVID-19) at walking distances of less than 400 m and more than 1000 m. The relationship between attitudes toward public transport and attitudes toward the neighborhood (H3g) was significant at a walking distance of less than 400 m and less than 100 m for both cases. Therefore, for a walking distance of more than 1000 m moderators, the relationship became significant during COVID-19 (β = 0.356).
The results of moderated mediation analysis indicate that the moderator of walking distance was not significant in the relationship between attitudes toward urban areas and travel mode behavior (H3i), attitudes toward the neighborhood of residence and travel mode behavior (H3j), and attitudes toward residence location and travel mode behavior (H3k) before and during COVID-19. The results showed that the indirect effect was insignificant in the moderated mediation analysis.

5. Discussion and Conclusions

This study investigates the hypothesis of the decision on travel mode behavior by considering the psychological factors of attitude. We focused on the main attitude factor based on residential location to determine the effect of walking distance and attitude toward travel mode. A study of residential relocation and travel satisfaction suggested that residential relocation may serve as an opportunity to enhance travel satisfaction [58]. To explore the difference in travel mode behavior based on attitude toward travel modes, the walking distance from the residence to the nearest mass transit station was designed to be a moderator. This study was divided into two categories: before and during COVID-19.
The findings of this research were based on three main hypotheses. First, the causal relationship between attitude toward travel mode and travel mode behavior was found to have a positive impact on attitude toward private cars on travel mode behavior, whereas it was not significant for attitudes toward public transport relationships. This can be explained by how attitude toward travel mode may impact on travel mode depending on the mode considered. Second, according to the findings of the attitude toward residence mediator, attitude toward residence produced a negative indirect effect on travel mode behavior. Moreover, attitudes toward neighborhoods and urban areas were partially mediated by attitudes toward private cars and travel mode behavior before and during COVID-19, respectively. In addition, attitudes toward neighborhoods were significantly mediated by attitudes toward public transport and travel mode behavior before COVID-19. This result confirmed that the attitude toward residence mediated the relationship between the attitude toward travel mode and travel mode behavior. In particular, the indirect effect of the attitude toward neighborhood was of importance before COVID-19. During COVID-19, attitudes toward urban areas were more important than neighborhoods, implying that people were more concerned about living in urban areas.
Lastly, the moderated mediation analysis is given inside all relationship paths as moderated by the walking distance from the residence to the nearest mass transit station. The result proved that walking distance moderated the relationship between attitude toward travel mode and attitude toward residence all along the path by various moderators. During COVID-19, the relationship between attitude toward public transport and attitude toward neighborhood became significant at a walking distance of more than 1000 m, which means people who live more than 1000 m from the station and have a positive attitude toward public transport will more likely consider their attitude toward neighborhood. However, the relationship between the attitude toward private cars and travel mode behavior was moderated by a walking distance of less than 400 m before and during COVID-19. It means that people who drive and live less than 400 m from the station are likely to use the park and ride service to transfer to other modes of transport. The further difference in the moderation effect is defined by an insignificant relationship between attitude toward residence and travel mode behavior.
This research investigated the moderated mediation effect of the causal relationships between travel mode behavior and attitudes toward travel modes based on the relocation hypothesis by defining the intervention variable of attitude toward residence and the interaction variables of walking distance to the nearest mass transit station. The overall result was able to demonstrate significant differences in relationships, and the mediation effect found that during COVID-19, private cars influenced attitudes toward urban areas. Before COVID-19, public transportation seemed to be more important. However, during COVID-19, private cars became the first mode of travel choice. This research provides evidence for an attitude toward resident mediator and a walking distance moderator that the attitude toward residence was influenced by the attitude toward travel mode. The results of this research confirm attitudes and preferences for particular modes of travel or neighborhood characteristics that influence travel behavior [26]. However, attitudes toward residents do not directly impact travel mode behavior. Attitudes toward urban areas and attitudes toward the neighborhood of residence were the main players in the indirect effect of attitudes toward travel mode that influenced the choice of travel mode. As attitude toward the neighborhood residence area confirms, the type of residential neighborhood affects the choice of commuting mode [36]. The hypothesis of the COVID-19 pandemic is effective for attitude and behavior.
However, the influence of COVID-19 on public transportation is not significant. This might be related to the reason cited in the survey that most representative commuters are already regular commuters, even in the case of a pandemic. The outbreak may not have a considerable impact on travel patterns. Second, because public transport is the primary mode of transportation in Bangkok and most people do not own a vehicle, they do not have many options in terms of transport modes. Nonetheless, there is a limitation to this study. The survey did not include the question about residential choice decisions, and the results provided only a travel mode choice and did not offer future residential location choices in the study hypothesis.
The study’s findings implicate critical policies on mode accessibility improvement. According to the study’s findings, public transportation has a strongly significant attitude toward residents and a more negative indirect impact on public transport compared to private cars. Public transport is important in Bangkok, but not efficient. The people who live within 1000 m of the station are the main users. Thus, problems with car use in Bangkok are driven by the insufficient availability of alternative modes of travel and service routes. As a result, public transportation may not fully recover to pre-pandemic levels in terms of daily travel modes [24]. The service provider’s management is key. The strategic planning of the service provider to manage the availability of up-to-date schedules and service frequencies and make available up-to-date information for customers could reduce crowds at the station and in service. A survey of current customer needs and their satisfaction level should be done more often, to make sure that an operation plan is being properly implemented.
The relationship analysis in this study can be utilized in analyzing behavior and making long-term change predictions. In the current situation, there is a tendency for people to stay longer in their homes. Their residences and environment are more important. This study considered only attitude-based, longitudinal data on residential location change, and the model forecast of the integrated discrete choice model should be considered in future research to predict and help with urban policy, working with land use planning to get more accurate forecasts for the future.

Author Contributions

Conceptualization, C.P. and K.S.; methodology, K.H.; software, K.H.; validation, K.S.; formal analysis, K.H.; investigation, K.H.; resources, K.S.; data curation, K.H.; writing—original draft preparation, K.H.; writing—review and editing, K.H.; visualization, K.H.; supervision, K.S. All authors have read and agreed to the published version of the manuscript.

Funding

This research received no external funding.

Institutional Review Board Statement

Not applicable.

Informed Consent Statement

Not applicable.

Data Availability Statement

Not applicable.

Conflicts of Interest

The authors declare no conflict of interest.

References

  1. Chen, L.H.; Wilson, M.E. The Role of the Traveler in Emerging Infections and Magnitude of Travel. Med. Clin. N. Am. 2008, 92, 1409–1432. [Google Scholar] [CrossRef]
  2. Abdullah, M.; Dias, C.; Muley, D.; Shahin, M. Exploring the Impacts of COVID-19 on Travel Behavior and Mode Preferences. Transp. Res. Interdiscip. Perspect. 2020, 8, 100255. [Google Scholar] [CrossRef]
  3. Molloy, J.; Schatzmann, T.; Schoeman, B.; Tchervenkov, C.; Hintermann, B.; Axhausen, K.W. Observed Impacts of the Covid-19 First Wave on Travel Behaviour in Switzerland Based on a Large GPS Panel. Transp. Policy 2021, 104, 43–51. [Google Scholar] [CrossRef]
  4. Zhang, N.; Jia, W.; Wang, P.; Dung, C.H.; Zhao, P.; Leung, K.; Su, B.; Cheng, R.; Li, Y. Changes in Local Travel Behaviour before and during the COVID-19 Pandemic in Hong Kong. Cities 2021, 112, 103139. [Google Scholar] [CrossRef]
  5. Parker, M.E.G.; Li, M.; Bouzaghrane, M.A.; Obeid, H.; Hayes, D.; Frick, K.T.; Rodríguez, D.A.; Sengupta, R.; Walker, J.; Chatman, D.G. Public Transit Use in the United States in the Era of COVID-19: Transit Riders’ Travel Behavior in the COVID-19 Impact and Recovery Period. Transp. Policy 2021, 111, 53–62. [Google Scholar] [CrossRef]
  6. Næss, P.; Peters, S.; Stefansdottir, H.; Strand, A. Causality, Not Just Correlation: Residential Location, Transport Rationales and Travel Behavior across Metropolitan Contexts. J. Transp. Geogr. 2018, 69, 181–195. [Google Scholar] [CrossRef]
  7. Sanit, P.; Nakamura, F.; Tanaka, S.; Wang, R. Assessing Impact of Residential Self-Selection on Travel Choice Behavior in Bangkok, Thailand. J. Jpn. Soc. Civ. Eng. Ser. D3 Infrastruct. Plan. Manag. 2014, 70, I_735–I_746. [Google Scholar] [CrossRef] [Green Version]
  8. Witchayaphong, P.; Pravinvongvuth, S.; Kanitpong, K.; Sano, K.; Horpibulsuk, S. Influential Factors Affecting Travelers’ Mode Choice Behavior on Mass Transit in Bangkok, Thailand. Sustainability 2020, 12, 9522. [Google Scholar] [CrossRef]
  9. BLT. 1 Day in Bangkok What Do I Have to Meet? Available online: https://www.bltbangkok.com/bangkok-update/4343/ (accessed on 11 March 2021).
  10. Thailand Plus. Department of Rail Transport Disclosure of Ridership during the COVID-19 Pandemic. Available online: https://www.thailandplus.tv/archives/315735 (accessed on 26 November 2021).
  11. De Vos, J.; Derudder, B.; Van Acker, V.; Witlox, F. Reducing Car Use: Changing Attitudes or Relocating? The Influence of Residential Dissonance on Travel Behavior. J. Transp. Geogr. 2012, 22, 1–9. [Google Scholar] [CrossRef] [Green Version]
  12. Ettema, D.; Nieuwenhuis, R. Residential Self-Selection and Travel Behaviour: What Are the Effects of Attitudes, Reasons for Location Choice and the Built Environment? J. Transp. Geogr. 2017, 59, 146–155. [Google Scholar] [CrossRef]
  13. Chalermpong, S.; Wibowo, S.S. Transit Station Access Trips and Factors Affecting Propensity to Walk to Transit Stations in Bangkok, Thailand. J. East. Asia Soc. Transp. Stud. 2007, 7, 1806–1819. [Google Scholar] [CrossRef]
  14. De Vos, J.; Cheng, L.; Witlox, F. Do Changes in the Residential Location Lead to Changes in Travel Attitudes? A Structural Equation Modeling Approach. Transportation 2020, 48, 2011–2034. [Google Scholar] [CrossRef]
  15. Hayes, A.F. Introduction to Mediation, Moderation, and Conditional Process Analysis: A Regression-Based Approach; The Guilford Press: New York, NY, USA, 2018; Volume viii. [Google Scholar]
  16. Preacher, K.J.; Rucker, D.D.; Hayes, A.F. Addressing Moderated Mediation Hypotheses: Theory, Methods, and Prescriptions. Multivar. Behav. Res. 2007, 42, 185–227. [Google Scholar] [CrossRef]
  17. Collier, J. Applied Structural Equation Modeling Using AMOS, 1st ed.; Routledge: New York, NY, USA; London, UK, 2020; ISBN 978-0-367-43526-4. [Google Scholar]
  18. Ma, L.; Cao, J. How Perceptions Mediate the Effects of the Built Environment on Travel Behavior? Transportation 2019, 46, 175–197. [Google Scholar] [CrossRef]
  19. Ishikawa, T.; Chikaraishi, M.; Fujiwara, A.; Nguyen, H.T.A. Does Individual Capability Influence Travel Time Expenditure? Mediation and Moderation Modeling Approaches. Asian Transp. Stud. 2019, 5, 736–749. [Google Scholar] [CrossRef]
  20. Waqas, M.; Dong, Q.; Ahmad, N.; Zhu, Y.; Nadeem, M. Understanding Acceptability towards Sustainable Transportation Behavior: A Case Study of China. Sustainability 2018, 10, 3686. [Google Scholar] [CrossRef] [Green Version]
  21. Zhang, H.; Zhuang, M.; Cao, Y.; Pan, J.; Zhang, X.; Zhang, J.; Zhang, H. Social Distancing in Tourism Destination Management during the COVID-19 Pandemic in China: A Moderated Mediation Model. Int. J. Environ. Res. Public Health 2021, 18, 11223. [Google Scholar] [CrossRef]
  22. Yang, Y.; Cao, M.; Cheng, L.; Zhai, K.; Zhao, X.; De Vos, J. Exploring the Relationship between the COVID-19 Pandemic and Changes in Travel Behaviour: A Qualitative Study. Transp. Res. Interdiscip. Perspect. 2021, 11, 100450. [Google Scholar] [CrossRef]
  23. Beck, M.J.; Hensher, D.A. Insights into the Impact of COVID-19 on Household Travel and Activities in Australia—The Early Days under Restrictions. Transp. Policy 2020, 96, 76–93. [Google Scholar] [CrossRef]
  24. Conway, M.W.; Salon, D.; da Silva, D.C.; Mirtich, L. How Will the COVID-19 Pandemic Affect the Future of Urban Life? Early Evidence from Highly-Educated Respondents in the United States. Urban Sci. 2020, 4, 50. [Google Scholar] [CrossRef]
  25. Ajzen, I. From Intentions to Actions: A Theory of Planned Behavior. In Action Control; Springer: Berlin/Heidelberg, Germany, 1985; pp. 11–39. [Google Scholar] [CrossRef]
  26. Klinger, T.; Lanzendorf, M. Moving between Mobility Cultures: What Affects the Travel Behavior of New Residents? Transportation 2016, 43, 243–271. [Google Scholar] [CrossRef]
  27. Mokhtarian, P.L.; Cao, X. Examining the Impacts of Residential Self-Selection on Travel Behavior: A Focus on Methodologies. Transp. Res. Part B Methodol. 2008, 42, 204–228. [Google Scholar] [CrossRef] [Green Version]
  28. Cao, X.J.; Ettema, D.F. Satisfaction with Travel and Residential Self-Selection: How Do Preferences Moderate the Impact of the Hiawatha Light Rail. J. Transp. Land Use 2014, 7, 93–108. [Google Scholar] [CrossRef]
  29. Kroesen, M.; Handy, S.; Chorus, C. Do Attitudes Cause Behavior or Vice Versa? An Alternative Conceptualization of the Attitude-Behavior Relationship in Travel Behavior Modeling. Transp. Res. Part Policy Pract. 2017, 101, 190–202. [Google Scholar] [CrossRef]
  30. Raveau, S.; Álvarez-Daziano, R.; Yáñez, M.F.; Bolduc, D.; De Dios Ortúzar, J. Sequential and Simultaneous Estimation of Hybrid Discrete Choice Models: Some New Findings. Transp. Res. Rec. 2010, 2156, 131–139. [Google Scholar] [CrossRef]
  31. Morikawa, T.; Ben-Akiva, M.; McFadden, D. Discrete Choice Models Incorporating Revealed Preferences and Psychometric Data. Adv. Econom. 2002, 16, 29–55. [Google Scholar] [CrossRef]
  32. Atasoy, B.; Glerum, A.; Bierlaire, M. Attitudes towards Mode Choice in Switzerland. disP-Plan. Rev. 2013, 49, 101–117. [Google Scholar] [CrossRef] [Green Version]
  33. Kim, S.; Ulfarsson, G.F.; Todd Hennessy, J. Analysis of Light Rail Rider Travel Behavior: Impacts of Individual, Built Environment, and Crime Characteristics on Transit Access. Transp. Res. Part Policy Pract. 2007, 41, 511–522. [Google Scholar] [CrossRef]
  34. Van Wee, B.; Holwerda, H.; Van Baren, R. Preferences for Modes, Residential Location and Travel Behaviour: The Relevance for Land-Use Impacts on Mobility. Eur. J. Transp. Infrastruct. Res. 2002, 2, 305–316. [Google Scholar] [CrossRef]
  35. Cao, X.; Mokhtarian, P.L.; Handy, S.L. Examining the Impacts of Residential Self-Selection on Travel Behaviour: A Focus on Empirical Findings. Transp. Rev. 2009, 29, 359–395. [Google Scholar] [CrossRef]
  36. Schwanen, T.; Mokhtarian, P.L. What Affects Commute Mode Choice: Neighborhood Physical Structure or Preferences toward Neighborhoods? J. Transp. Geogr. 2005, 13, 83–99. [Google Scholar] [CrossRef] [Green Version]
  37. Malaitham, S.; Nakagawa, D.; Matsunaka, R.; Yoon, J.; Oba, T. An Analysis of Residential Location Choice Behavior in Bangkok Metropolitan Region: An Application of Discrete Choice Models for the Ranking of Alternatives. J. East. Asia Soc. Transp. Stud. 2013, 10, 989–1008. [Google Scholar]
  38. Levine, J.; Frank, L.D. Transportation and Land-Use Preferences and Residents’ Neighborhood Choices: The Sufficiency of Compact Development in the Atlanta Region. Transportation 2007, 34, 255–274. [Google Scholar] [CrossRef]
  39. Bagley, M.N.; Mokhtarian, P.L. The Impact of Residential Neighborhood Type on Travel Behavior: A Structural Equations Modeling Approach. Ann. Reg. Sci. 2002, 36, 279–297. [Google Scholar] [CrossRef] [Green Version]
  40. Van Wee, B.; Witlox, F. COVID-19 and Its Long-Term Effects on Activity Participation and Travel Behaviour: A Multiperspective View. J. Transp. Geogr. 2021, 95, 103144. [Google Scholar] [CrossRef]
  41. Ding, C.; Wang, D.; Liu, C.; Zhang, Y.; Yang, J. Exploring the Influence of Built Environment on Travel Mode Choice Considering the Mediating Effects of Car Ownership and Travel Distance. Transp. Res. Part Policy Pract. 2017, 100, 65–80. [Google Scholar] [CrossRef]
  42. Hook, H.; De Vos, J.; Van Acker, V.; Witlox, F. Do Travel Options Influence How Commute Time Satisfaction Relates to the Residential Built Environment? J. Transp. Geogr. 2021, 92, 103021. [Google Scholar] [CrossRef]
  43. Forsyth, A.; Oakes, J.; Schmitz, K.; Hearst, M. Does Residential Density Increase Walking and Other Physical Activity. Urban Stud. 2007, 44, 679–697. [Google Scholar] [CrossRef]
  44. Eriksson, U.; Arvidsson, D.; Gebel, K.; Ohlsson, H.; Sundquist, K. Walkability Parameters, Active Transportation and Objective Physical Activity: Moderating and Mediating Effects of Motor Vehicle Ownership in a Cross-Sectional Study. Int. J. Behav. Nutr. Phys. Act. 2012, 9, 123. [Google Scholar] [CrossRef] [Green Version]
  45. Durand, C.P.; Tang, X.; Gabriel, K.P.; Sener, I.N.; Oluyomi, A.O.; Knell, G.; Porter, A.K.; Hoelscher, D.M.; Kohl, H.W. The Association of Trip Distance with Walking to Reach Public Transit: Data from the California Household Travel Survey. J. Transp. Health 2016, 3, 154–160. [Google Scholar] [CrossRef] [Green Version]
  46. Cervero, R. Walk-and-Ride: Factors Influencing Pedestrian Access to Transit. J. Public Transp. 2001, 3, 1. [Google Scholar] [CrossRef] [Green Version]
  47. Kim, H. Walking Distance, Route Choice, and Activities While Walking: A Record of Following Pedestrians from Transit Stations in the San Francisco Bay Area. URBAN Des. Int. 2015, 20, 144–157. [Google Scholar] [CrossRef]
  48. Weinstein Agrawal, A.; Schlossberg, M.; Irvin, K. How Far, by Which Route and Why? A Spatial Analysis of Pedestrian Preference. J. Urban Des. 2008, 13, 81–98. [Google Scholar] [CrossRef]
  49. Department of Disease Control Thailand. Thailand Situation Update on 16 December 2020; DDC Thailand: Bangkok, Thailand, 2020; p. 1. [Google Scholar]
  50. National Statistical Office. Thailand Demography Population and Housing Branch. Available online: http://statbbi.nso.go.th/staticreport/page/sector/en/01.aspx (accessed on 9 April 2022).
  51. Sanit, P.; Nakamura, F.; Tanaka, S.; Wang, R. Analysis of Location Choice Behavior and Urban Railway Commuting of Bangkok’s Households. Urban Reg. Plan. Rev. 2014, 1, 1–17. [Google Scholar] [CrossRef] [Green Version]
  52. Nunnally, J.C. Psychometric Theory; McGraw Hill: New York, NY, USA, 1978; p. 701. [Google Scholar]
  53. Byrne, B.M. Structural Equation Modeling with AMOS, 2nd ed.; Routledge: New York, NY, USA, 2013; ISBN 978-0-8058-6372-7. [Google Scholar]
  54. Wheaton, B.; Muthen, B.; Alwin, D.F.; Summers, G.F. Assessing Reliability and Stability in Panel Models. Sociol. Methodol. 1977, 8, 84. [Google Scholar] [CrossRef]
  55. MacCallum, R.C.; Browne, M.W.; Sugawara, H.M. Power Analysis and Determination of Sample Size for Covariance Structure Modeling. Psychol. Methods 1996, 1, 130–149. [Google Scholar] [CrossRef]
  56. Shevlin, M.; Miles, J.N.V. Effects of Sample Size, Model Specification and Factor Loadings on the GFI in Confirmatory Factor Analysis. Personal. Individ. Differ. 1998, 25, 85–90. [Google Scholar] [CrossRef]
  57. Hu, L.T.; Bentler, P.M. Cutoff Criteria for Fit Indexes in Covariance Structure Analysis: Conventional Criteria versus New Alternatives. Struct. Equ. Model. Multidiscip. J. 2009, 6, 1–55. [Google Scholar] [CrossRef]
  58. Wang, F.; Mao, Z.; Wang, D. Residential Relocation and Travel Satisfaction Change: An Empirical Study in Beijing, China. Transp. Res. Part Policy Pract. 2020, 135, 341–353. [Google Scholar] [CrossRef]
Figure 1. The conceptual moderated mediation model.
Futuretransp 02 00020 g001
Figure 2. Map of the focus study area by buffer zones at 400 and 1000 m.
Futuretransp 02 00020 g002
Figure 3. Confirmatory factor analysis results for (a) before COVID-19; (b) during COVID-19.
Futuretransp 02 00020 g003
Figure 4. Structural model of study for (a) before COVID-19 model; (b) during COVID-19 model.
Futuretransp 02 00020 g004
Table 1. Demographic characteristics of participants.
VariableFrequencyPercent
Gender  
Male24937%
Female43363%
Age (years)  
<18172%
18–2417225%
24–3417626%
35–4412018%
45–549915%
55–647110%
>64274%
Education  
<High school396%
High school22032%
College11717%
Bachelor’s degree28842%
≥Master’s degree183%
Occupation  
Student12017%
Employee39358%
Personal Business9314%
Unemployed6610%
Other jobs101%
Number of households  
18112%
220530%
317626%
411517%
≥510515%
Total vehicle ownership  
No vehicle33950%
122032%
29313%
3183%
≥4122%
Total transport card ownership  
No card41461%
121231%
≥2568%
Walking distance from
residence to nearest station (m)
  
<40020229%
<100029844%
>100018227%
Table 2. Demographic and travel behavior change of participants.
VariableBefore COVID-19During COVID-19
FrequencyPercentFrequencyPercent
Income    
<7500 THB10215%11016%
7501–18,000 THB28642%29844%
18,001–24,000 THB15022%14221%
24,001–35,000 THB8813%8212%
>35,000 THB568%507%
Travel mode    
Walking/biking122%213%
Mass transit48972%47169%
Public transport16724%17626%
Private car142%142%
Travel time (min/day)    
0–30507%578%
31–6021231%22733%
61–9017926%16725%
91–12011717%11116%
121–1808713%8613%
>180376%345%
Travel cost (THB/day)    
0–5019327%20831%
51–10033850%32748%
101–1509915%9614%
>150528%507%
Table 3. Exploratory factor analysis results.
FactorBefore COVID-19During COVID-19
ItemFactor LoadingItemFactor Loading
Attitude toward private car (PC)α = 0.774α = 0.841
Prefer to use private car.1PC10.448--
Accept more travel cost to use private car.1PC20.4852PC20.479
Choose private car because of social image1PC30.4332PC30.431
Prefer private car because of weather condition1PC40.5972PC40.625
Prefer to use private car or public transport to avoid crime of taxi/unfair price1PC50.7782PC50.777
Prefer to use private car to avoid criminal risk.1PC60.8872PC60.896
Avoid pollution by using private car--2PC70.502
Attitude toward public transport (PT)α = 0.788α = 0.848
Prefer to use public transport (Mass transit, Bus, Boat).1PT10.4262PT10.402
Mass transit easy to travel more1PT20.4922PT20.574
If they have online pre-paid fare system, public transport will be preferred1PT30.8282PT30.839
If they have good facility of station (clean, toilet, etc.), mass transit will be preferred1PT40.8392PT40.899
Prefer residential area near bus stop.--2PT50.353
Attitude toward neighborhood of residential area (NB)α = 0.874α = 0.897
Prefer residential area with no crime or less.1NB10.8312NB10.888
Prefer residential area with lighting around.1NB20.9392NB20.998
Prefer residential area near the police station1NB30.7722NB30.738
Not choosing to live in an urban area due to concern about infection.1NB40.6432NB40.690
Attitude toward urban area (UB)α = 0.826α = 0.838
Prefer to live in urban area.1UB20.6542UB20.686
Prefer to live near community/shopping/office/school/hospital1UB30.6712UB30.688
Prefer social image and social environment in urban.1UB40.7392UB40.807
Attitude toward residential location (RL)α = 0.886α = 0.878
Residential areas are easy to use by taxi--2RL10.362
Activity place can walk from home1RL20.7872RL20.829
Residential area is a friendly environment for pedestrians.1RL30.9602RL31.012
Residential area is a friendly environment for cycling1RL40.7842RL40.829
Kaiser-Meyer-Olkin0.8820.928
Bartlett’s Test7120.6529618.719
Significance0.0000.000
Table 4. Fitness index and results of CFA and SEM.
IndexLevel of
Acceptance
CFASEM
Before ModelDuring ModelBefore ModelDuring Model
Chisq/df1–43.3043.8082.0152.052
RMSEA<0.070.0580.0640.0390.039
GFI≥0.900.9410.9200.9080.917
CFI≥0.900.9590.9510.9460.959
TLI≥ 0.900.9490.9410.9300.945
p-value<0.050.0000.0000.0000.000
Table 5. Direct path of structural model.
PathsBefore COVID-19During COVID-19
𝛽SE𝛽SE
PC → Travel mode0.109 *0.0570.089 *0.089
PT → Travel mode0.228 ns0.1280.112 ns0.112
PC → UB0.307 *0.0630.130 *0.036
PC → NB 0.420 *0.0670.277 *0.045
PC → RL0.066 ns0.084−0.034 ns0.045
PT → UB0.543 *0.0750.672 *0.064
PT → NB 0.432 *0.0710.669 *0.070
PT → RL0.862 *0.1060.963 *0.083
UB → Travel mode−0.107 ns0.069−0.133 ns0.072
NB → Travel mode−0.100 *0.047−0.066 ns0.048
RL → Travel mode−0.050 ns0.060−0.001 ns0.059
ns: Not significant; *: p < 0.05.
Table 6. Results of mediation analyses.
PathsBefore COVID-19During COVID-19
βLowerUpperResultβLowerUpperResult
Direct effect        
PC → Travel mode (H1a)0.109 *-0.0200.234Support0.089 *0.0190.173Support
Indirect effect        
PC → UB → Travel mode (H2a) −0.033 ns−0.0860.001No mediation−0.017 *−0.0470.000Partial mediation
PC → NB → Travel mode (H2b)−0.042 *−0.090−0.008Partial mediation−0.018 ns−0.0480.006No mediation
PC → RL → Travel mode (H2c)−0.003 ns−0.0410.009No mediation0.000 ns−0.0100.011No mediation
Direct effect        
PT → Travel mode (H1b)0.228 ns0.0030.590Not support0.112 ns−0.1660.428Not support
Indirect effect        
PT → UB → Travel mode (H2d)−0.058 ns−0.1900.004Not support−0.089 ns−0.2090.006Not support
PT → NB → Travel mode (H2e)−0.043 *−0.111−0.007Full mediation−0.044 ns−0.1130.017Not support
PT → RL → Travel mode (H2f)−0.043 ns−0.2220.060Not support−0.001 ns−0.1440.122Not support
ns: Not significant; *: p < 0.05.
Table 7. Results of moderated mediation analyses.
PathsBefore COVID-19During COVID-19
<400 m<1000 m>1000 m<400 m<1000 m>1000 m
DirectIndirectDirectIndirectDirectIndirectDirectIndirectDirectIndirectDirectIndirect
PC → Travel mode (H3a)0.231 *−0.100 ns0.009 ns−0.059 ns0.288 ns−0.148 ns0.209 *−0.101 ns0.049 ns−0.019 ns0.225 ns−0.116 ns
PT → Travel mode (H3b)−0.540 ns0.266 ns0.177 ns−0.141 ns0.213 ns−0.033 ns0.021 ns−0.140 ns−0.054 ns−0.055 ns0.271 ns−0.110 ns
PC → UB (H3c)0.092 ns0.269 *0.579 *0.123 ns0.239 *0.390 *-
PC → NB (H3d)0.239 *0.264 *0.724 *0.293 *0.313 *0.510 *-
PC → RL (H3e)−0.237 *0.071 ns0.367 *−0.231 *0.066 ns0.405 *-
PT → UB (H3f)0.614 *0.509 *0.308 *0.720 *0.581 *0.511 *-
PT → NB (H3g)0.424 *0.449 *0.010 ns0.519 *0.517 *0.356 *-
PT → RL (H3h)0.805 *0.574 *0.483 *0.771 *0.677 *0.482 *-
UB → Travel mode (H3i)−0.021 ns−0.046 ns−0.101 ns−0.207 ns−0.115 ns−0.092 ns-
NB → Travel mode (H3j)−0.045 ns−0.152 ns−0.124 ns−0.161 ns0.028 ns−0.128 ns-
RL → Travel mode (H3k)0.370 ns−0.085 ns−0.001 ns0.121 ns−0.004 ns−0.037 ns-
ns: Not significant; *: p < 0.05.
Publisher’s Note: MDPI stays neutral with regard to jurisdictional claims in published maps and institutional affiliations.

