1. Introduction
Transport is a crucial part of modern human life. It is a driver of development, connects people and communities to products and services, facilitates trade, and helps build markets [
1,
2,
3]. Although transport has provided a considerable contribution to development, it has also created negative impacts, specifically in relation to climate change and human health. Global emissions due to transportation have grown at a constant rate of about 2% since 1990, where the road subsector accounted for most of the growth since 2010 (+0.9 GtCO2eq, at 1.9% per year), and inland shipping, domestic aviation, and international aviation presented the fastest annual growth rates (+3.2%/year, +2.8%/year, and +2.7%/year, respectively) [
4]. Pollution-related illnesses (e.g., asthma, COPD, and cancer) can have fatal consequences or affect morbidity, and they generate additional economic costs such as hospital admissions, lost workdays, discomfort, and stress [
5,
6,
7].
Currently, we face a situation where we need to expand the transport network, and at the same time address the undesirable consequences of the current transport system. Although efforts have been made to improve the transport system all around the world, there are gaps in every transport subsector, at each level of the transport network [
8], and in terms of accessibility, geographical coverage, and interconnectivity, particularly in poor regions [
9]. On the other hand, the demand for transport keeps increasing; global demand for public transport grew 4% per year between 2012 and 2017 and global air travel increased 4.2% from 2018 to 2019 [
10], with estimates that emissions have increased by a factor of 6.8 between 1960 and 2018 for air travel [
11]. The need to expand the transport network must be addressed ahead of time or anticipated, and with a sustainability approach in mind, in order to prevent the growth of externalities (e.g., health impacts) when embracing new technologies, and to strive to improve climate resilience [
5,
12].
Given the emergence of undesirable impacts from transport and other growth dynamics, both international organizations and national leaders have started defining a path towards more sustainable growth. The 2030 Agenda for Sustainable Development, adopted by all United Nations Member States in 2015 is a call to action to achieve goals that are indispensable for sustainable development [
13]. The Sustainable Development Goals (SDGs) targets are dependent on sustainable transport, and several SDGs such as good health and well-being (SDG 3), zero hunger (SDG 2), affordable and clean energy (SDG 7), responsible consumption and production (SDG 12), industry innovation and infrastructure (SDG 9), climate action (SDG 13), and sustainable cities and communities (SDG 11) are directly or indirectly influenced by the performance of the transport sector [
1]. The concept of sustainable transportation is very well aligned with the concept of sustainable development, as well as with high-level strategies such as the green economy and green growth, in that it considers several indicators across dimensions of development (social, economic, and environmental), of relevance to different economic actors (e.g., highlighting accessibility and affordability), and addresses global concerns and resilience (e.g., climate change and environmental impacts).
This research aims to explore how sustainable transport should be conceptualized, modeled, and assessed. Many definitions and indicators are found in the literature review carried out, but integrated methods and models for quantification that (a) involve the three dimensions (i.e., social, economic, and environmental) of sustainable development, (b) are replicable, (c) are modular, and (d) are customizable, are lacking. We propose to use a systems approach that integrates knowledge across disciplines and provides useful inputs for decision-making for governments, investors, and civil society. Specifically, the methodology proposed and tested by analyzing the three case studies allows for the evaluation of transport in a systemic way, considering economic, environmental, and societal outcomes of project implementation. Combining system dynamics, for a comprehensive assessment of sustainable outcomes, with financial modeling, for a societal economic valuation of the investment, a Sustainable Asset Valuation (SAVi) assessment is performed. The results of the analysis provide stakeholders and decision-makers with the tools to assess transport projects that not only account for direct economic and financial returns but also have societal benefits. Three case studies are proposed as a way to test the method. These case studies were co-developed with local stakeholders and cover three very different areas of sustainable transport: road construction, public bicycle-sharing and bus rapid transport systems.
The paper is organized as follows:
Section 2 presents a literature review of definitions, key indicators, methods, and models to assess sustainable transport projects;
Section 3 describes the assessment of sustainable transport using three case studies;
Section 4 shows the results of the assessments with an emphasis on the societal value of transport assets; and
Section 5 discusses the results regarding the projects assessed and methods used, providing indications on further developments for the analysis performed.
2. Literature Review
2.1. Sustainable Transport Concept
Sustainable transport implies that economic, social, and environmental goals are reached simultaneously. The European Investment Bank states that “A sustainable transport system must meet current requirements by providing the necessary mobility services, but without compromising the ability of future generations to meet their own needs” [
5]. TUMI defines sustainable transportation around three elements: efficiency, referring to the improvement of sustainable mobility technologies and services; equity, referring to supporting the mobility needs of different users; and environment, related to the reduction of the negative effects of mobility [
14].
The definition from the Centre for Sustainable Transportation [
15], adopted by various studies [
16,
17], establishes that a more sustainable transportation system is one that:
Allows the basic access and development needs of people to be met safely and promotes equity within and between successive generations (social dimension).
Is affordable within the limits imposed by the internalization of external costs, operates fairly and efficiently, and fosters a balanced regional development (economic dimension).
Limits emissions of air pollution and GHGs as well as waste and minimizes the impact on the use of land and the generation of noise (environmental dimension).
Is designed in a participatory process, which involves relevant stakeholders in all parts of society (degree of participation).
One of the most summarized and complete definitions is that given by the High-level Advisory Group on Sustainable Transport for the UN: “Sustainable transport is the provision of services and infrastructure for the mobility of people and goods—advancing economic and social development to benefit today’s and future generations—in a manner that is safe, affordable, accessible, efficient, and resilient while minimizing carbon and other emissions and environmental impacts” [
1].
2.2. The Avoid–Shift–Improve Approach
Sustainable transport can be better understood using the avoid–shift–improve approach (A–S–I). The approach focuses on the reduction of GHG emissions, energy consumption, and congestion, with the final objective of creating more livable cities [
18,
19].
The
avoid component seeks to prevent and reduce unnecessary travel via the improvement of the efficiency of the transport system as a whole. In this way, the need for motorized travel and the trip length can be reduced [
18,
19]. Measures for this component include urban planning, managing the use of urban areas from the perspective of transport services, improving infrastructure, and supporting solutions [
20].
The
shift component refers to switching transport modes from a polluting/high-energy-consumption urban transport mode towards more clean options, to improve individual trip efficiency [
18,
19]. Particularly, shifting to active transport (i.e., walking and cycling) and public transport (i.e., bus, rail, and light rail) will generate either zero or lower emissions per passenger-km compared to other modes (e.g., cars). Measures for this component include improving the urban public passenger transport system, promoting walking and cycling, management of the use of various modes of urban transport, and parking management [
20].
The
improve component aims to enhance the environmental, safety, and efficiency performance of transport through technological, operational, regulatory, and infrastructural advances and policies [
18,
19]. Measures for this component include promoting the production and use of clean vehicles and motor fuels/energy sources and improving the current transport technologies and traffic conditions [
20].
The A–S–I framework is part of the pillars of transport management and planning for achieving sustainable development. Additionally, the actions required for its implementation should evolve and be conceived systemically to face the current and future challenges of transportation.
2.3. Challenges
Sustainable transport aims to optimize the current transport infrastructure and to expand the transport network sustainably, based on future needs. Current challenges involve aspects related to access to transport, system costs for current capacity, decarbonization, and other environmental impacts, as well as involving human health impacts including safety. The cost of transportation infrastructure has been growing due to the accumulation of built infrastructure over the years and the increasing exposure of such infrastructure to climate change. In addition, as most often the transport sector relies on fossil fuels whose price is volatile, the affordability of mobility services for the final consumer can be affected. Transport is one of the biggest contributors to negative environmental externalities and health impacts. In 2019, transportation emissions in the United States accounted for the largest portion of GHG emissions, with a 29% share, followed by electricity generation with 25%, and industry with 23% of total emissions [
21]. Transport activities also affect human well-being by generating premature mortality from pollution-related illnesses and around 1.3 million deaths per year as a result of road traffic accidents [
22].
These challenges are connected: greenhouse gas emissions and air pollution cause additional costs (e.g., people’s health deteriorates and unexpected infrastructure damage is more frequent), more costs lead to less budget for investments (e.g., for road safety or a more efficient infrastructure), and less investment leads to a transport sector that is not sustainable, aggravating the environmental and health impacts.
The need for better transportation solutions is particularly evident in rural areas: rural road transport in Africa often costs 3 to 5 times more than main-road transport [
23]. Effective planning is also crucial in urban areas, where most of the transportation demand comes from, and hence there are challenges related to high emission zones, traffic congestion, and road safety.
2.4. Actions for Sustainable Transport Development
Strategies and actions that can be implemented to overcome the mentioned challenges can be clustered using the A–S–I approach described earlier. Actions oriented towards current infrastructure are focused on avoiding inefficient travel, shifting among transportation modes, and improving the efficiency of the system. Actions oriented towards future needs focus on planning for sustainable transportation.
Avoid actions incorporate transport demand management (TDM), which encourages better use of existing infrastructure and promotes public transport, ridesharing, and teleworking through tools including public information campaigns, infrastructure design, and transit-oriented development [
1]. A known case of avoiding non-sustainable transport modes is the city of Amsterdam, with five low-emission zones where vehicles that cause the most pollution are banned [
24]. In terms of planning, transit-oriented development (TOD) is a strategy that can generate more sustainable results. “Well-designed TOD empowers people with the choice to walk, cycle, or take public transportation to meet their daily needs by providing greater transit accessibility and a mix of uses within the community fabric” [
25].
For
shift actions, fewer pollutant options and massive transportation modes are the focus. Shared mobility is more space-efficient and energy-efficient than individual motorized transport, and a modal shift to public transport can reduce the energy used per user even further [
5]. Bus rapid transit (BRT) is a solution that has helped cities to shift transport modes. It is a high-quality bus-based transit system that delivers fast, comfortable, and cost-effective urban mobility through the provision of dedicated right-of-way infrastructure, rapid and frequent operations, and excellence in marketing and customer service [
6]. The use of electric trains is also an effective solution; it offers the lowest marginal operation costs and GHG emissions per transport unit, for both passengers and freight, and is safer than roads [
26]. In the future, the demand for fuel sources for transportation needs to shift to cleaner options. The introduction of emissions taxes, for instance, can be an effective policy for medium- or long-term decarbonization of the transport sector, penalizing polluters and then supporting virtuous investments. Along the same lines, incorporating distance-based fees or rewards for efficient vehicles will stimulate the shift towards more sustainable transport [
27], especially in the private transportation sector.
With regard to
improve actions, zero-emissions strategies for current and new vehicles are crucial for reducing the negative impacts of the transport sector. The replacement of fossil-fuel energy sources with cleaner sources will significantly reduce emissions and air pollution. Some of the available “clean energy” sources that are currently being considered include clean diesel and biodiesel, ethanol, electricity, hydrogen, compressed natural gas, liquefied petroleum gas, and hybrid electric systems [
6,
26]. With regard to planning, improvements must include medium- and long-term policies for energy transitions and research. Energy transitions can be accelerated with policies such as the decision of national governments in Europe to phase out internal combustion engine vehicles, even in hybrid form, where Norway has one of the most ambitious targets for 2050 [
28]. Finally, investment in research for sustainable transport will keep producing improvements that are aligned with the challenges of the moment.
2.5. Key Indicators
When advancing towards sustainable development, measurement is crucial to check how aligned the actions implemented are with the achievement of the targets and to adjust plans if necessary. This section explores a variety of different frameworks that have been proposed in the case of sustainable transport.
The EU Taxonomy Regulation for sustainable transport was created by the European Union to define the criteria that should be applied to identify vehicles and infrastructure as sustainable. It includes time-based targets for private vehicles, light-duty vehicles, motorcycles, and transport infrastructure that can be used as a guideline to measure progress in the net-zero ambition of the EU [
29].
Sustainable Mobility for All (SuM4All) borrows a list of indicators to assess sustainable transport that is found in the Transport Global Tracking Framework 2.0. They established one indicator, with targets and a measurement methodology, for each of the following categories: (i) universal rural access, (ii) universal urban access, (iii) universal access—gender, (iv) efficiency, (v) safety, (vi) green mobility—air pollution, and (vii) green mobility—greenhouse gas emissions [
30].
The Asian Development Bank (ADB) collected indicators for sustainable transport from different sources and presented a final compressed list of the most relevant indicators. ADB grouped the indicators into subcategories and then into nine main categories: (i) infrastructure, (ii) transport activity and services, (iii) access and connectivity, (iv) road safety, (v) air pollution and health, (vi) climate change, (vii) socio-economic indicators, (viii) miscellaneous (including COVID-19 impacts), and (ix) policy [
31].
The United Nations Economic Commission for Europe (UNECE) suggested a list of indicators in its Handbook on Sustainable Urban Mobility and Spatial Planning, that can be used to develop and evaluate policies for sustainable urban transport systems. It categorizes the indicators into three themes with subthemes: environmental (i.e., global climate change, air pollution, and consumption of natural resources), social (i.e., health, equity, opportunities and accessibility, and traffic), and economic (i.e., total net benefit from transport) [
20].
The Victoria Transport Policy Institute created a report that guides the use of indicators for sustainable and effective transport planning, as a result of reviewing several sets of indicators proposed by different programs and organizations. The indicators are divided into the categories: (i) most important, (ii) helpful, and (iii) specialized, where the specialized indicators are general and the other two categories are divided into another three subcategories: economic, social, and environmental [
32].
2.6. Methods
The methods available for assessing transport sustainability can be classified into (i) transport sector sustainability and (ii) infrastructure performance. The first evaluates the overall performance of the transportation systems in terms of access, efficiency, safety, and the environment, usually at a country or large-scale level. The second assesses rail and roads, and the rolling stock of the transport system, mainly by determining the outcomes of a specific investment or more localized dynamics.
Assessments of sector sustainability include the Transport Global Tracking Framework (GTF) 2.0 and the National Air Toxics Assessment (NATA). GTF 2.0 calculates a composite index score from the subscores of the categories (i) universal rural access, (ii) universal urban access, (iii) universal access—gender, (iv) efficiency, (v) safety, (vi) green mobility—air pollution, and (vii) green mobility—greenhouse gas emissions, to track the country’s progress towards sustainable mobility [
33]. NATA is a tool for state, local, and tribal air agencies whose output is a snapshot of the outdoor air quality related to toxic emissions, called the National Emissions Inventory [
34]. In the module for transportation, NATA includes on-road and non-road mobile sources (e.g., cars, trucks, and boats) and their emission source types [
35,
36].
Assessments for infrastructure performance include methods such as the Greenroads Rating System, the Sustainable Transport Appraisal Rating (STAR), GreenLITES, and Sustainable Asset Evaluation (SAVi). The Greenroads Rating System is an independent third-party evaluation focused on the project’s environmental, social, and economic performance [
37]. It offers assessments (snapshots of the project) and certifications (performance tracking through the project development) based on a system of credits that are earned [
38,
39]. STAR is a qualitative method to measure the performance of a project or investment program in contrast to a sustainable transport objective [
40]. The project is evaluated according to its economic, social, and environmental performance, with equal weightings of 30% in the final score. The 10% remaining evaluates the risk to sustainability, assessing the design and evaluation risk, implementation risk, and operational risk [
41].
GreenLITES is a self-certification assessment developed by the New York State Department of Transportation to measure performance, recognize good practices, and identify needs [
42]. GreenLITES includes five categories of evaluation: (i) sustainable sites, (ii) water quality, (iii) material and resources, (iv) energy and atmosphere, and (v) innovation [
43]. Depending on the credits earned (total of 175 credits) GreenLITES provides the following award levels: Certified, Silver, Gold, and Evergreen.
Finally, SAVi provides a comprehensive analysis of how much infrastructure projects and portfolios will cost throughout their life cycles, considering risks that are overlooked in a traditional valuation. SAVi is based on a combination of systems thinking and various modeling methodologies, including spatial modeling, economic multiplier/multicriteria assessments, system dynamics, and project finance modeling [
44]. A typical SAVi assessment output will include (i) financial indicators, (ii) the monetary value of environmental, social, and economic co-benefits of avoided costs, and (iii) scenario analysis and/or technology option comparisons on how the financial performance changes over time due to climate change, population growth, or other drivers.
2.7. Models
Models are tools to assess the performance of a system and support the decision-making processes. In the case of sustainable transport, a review of the models involves (i) sector-level assessments and (ii) assets/infrastructure assessments, as for the review of methods. For sector-level assessments, the reviewed models are the International Energy Agency Mobility Model (IEA MoMo), Assessment of Transport Strategies (ASTRA), En-ROADS, TIMES, Green Economy Model (GEM), and Low Emissions Analysis Platform (LEAP).
For asset-level assessments, the reviewed models are the system dynamics and project finance models used with the SAVi method, traditional cost–benefit analysis of bus transport projects, and sector-wide assessments carried out using the Green Economy Model (GEM).
To provide a more comparable review of the models to assess sustainable transportation,
Table 1 was created. It summarizes the main characteristics of the models in terms of the methodology used, the project stages covered, the level of customization, and the categories of indicators that can be measured.
3. Materials and Methods
3.1. Modeling Approach for Systems Analysis
The methods used to assess sustainable transport development in this study encompass system dynamics modeling, spatial modeling, and financial modeling, which complement each other to create an exhaustive and integrated assessment. The importance of approaching transportation in a systematic and integrated way so that the actions implemented can lead to sustainable development has previously been mentioned.
System dynamics is chosen because it allows the exploration of causality in the system analyzed, using a multi-stakeholder, participatory approach. A causal loop diagram (CLD) is created for this purpose, consisting of variables connected by arrows that denote the causal influences between them and represent the feedback loops that underlie the system analyzed [
61,
62]. The co-creation of a CLD often highlights the presence of less obvious dynamics, relationships, delays, and unintended consequences [
63], adding value to the analysis when compared with other, more sectoral, approaches. Furthermore, and because of the co-creation approach provided by system dynamics, it is possible to customize the list of performance indicators analyzed and to create a tailor-made quantitative model that accounts for the unique socio-economic and environmental characteristics of the context in which the sustainable transport investment will be implemented. As a result, the model can use standard technical data and equations, e.g., in relation to the technology utilized to increase sustainability, such as the internal combustion engine versus electric mobility, and complement this bottom-up analysis with socio-economic indicators and related mathematical formulations that reflect local drivers of change and behavior. Finally, system dynamics supports knowledge integration by using stocks and flows to represent accumulation processes and by explicitly capturing feedback loops, delays, and non-linearity. Stocks and flows are essential to estimate the outcomes of investments over time, representing the accumulation of capacity, its use over time, and disposal at the end of its lifetime. Feedback loops and non-linearity are more relevant to the use of infrastructure, with the inclusion of behavioral choices (e.g., elements of policy resistance, such as the preference to use private vehicles when air pollution is high, given the perception that air quality inside a vehicle is better than the external air quality).
Spatial modeling is proposed because of the spatial characteristics of transport and mobility. Furthermore, the quantification and economic valuation of externalities is highly dependent on location (i.e., where the impact of an investment is taking place). As a result, spatial modeling, both for mobility and the quantification and economic valuation of externalities, greatly improves the accuracy of the analysis performed.
Financial modeling is proposed because it provides information related to the economic viability of the project, which has important consequences on both the approval of investments and their financing strategy. We argue that the financial analysis of all projects, especially sustainable transport projects, should be extended to capture social, economic, and environmental externalities. This allows estimation of whether the proposed projects generate value for money and positive returns for society as a whole, in addition to investors.
The three modeling approaches presented above can be used in conjunction with one another. Their joint use provides relevant information to several audiences that would normally work in isolation. For instance, the concerns of civil society are brought to the table of financial planners, long-term budget implications are directly compared with potential short-term cost savings, and more. The SAVi method and model reflect these concerns and make use of the three modeling approaches mentioned above.
Specifically, SAVi aims to identify, measure, and quantify the value that infrastructure projects bring to society [
64]. The SAVi features are simulation, valuation, and customization [
64]:
For simulation, SAVi combines the outputs of systems thinking and system dynamics with project finance modeling, bringing consistency to several decision-making processes that normally are disconnected from one another.
For valuation, SAVi simulates the value of climate, economic, social, and environmental risks (e.g., the cost of risks), identifies and places a value on the externalities that emerge as a consequence of infrastructure projects (e.g., the cost of air pollution), and estimates the costs of the future project risks due to the current externalities (e.g., the cost of traffic restrictions due to air pollution).
For customization, SAVi models are co-developed with local stakeholders, including project developers, government, and users. These models can be adapted to individual projects, portfolios, and policies, presenting a more precise analysis for each case.
The Green Economy Model was instead created to study the interconnections of four main types of capital in the context of green economy and green growth assessments: physical, human, social, and natural, normally assessed at the sectoral or national level [
60]. The model is customized and calibrated to the national context and includes various stakeholders, to represent the unique interrelations among the four types of capital. GEM is a tool for the following applications [
60]:
Testing the effectiveness of individual policies and investments by assessing their impact within and across sectors, and for social, economic, and environmental indicators.
Informing budgetary planning by assessing the effectiveness of annual plans in delivering green and inclusive growth.
Supporting the formulation and analysis of development plans that span sectors and target medium- to longer-term goals.
The goal of proposing such an integrated framework that uses mixed methods to ensure consistency and comprehensiveness of the analysis is to provide a unified assessment that supports the formulation of projects that generate value for all, while delivering on the immediate needs of improved mobility.
3.2. The Modeling Process
The modeling process starts with the creation of a CLD, allowing exploration in detail of the causes, effects, and dynamics of the system analyzed. Then, the modeling team translates the causal map into a mathematical model with inputs from different stakeholders, using a multi-stakeholder co-creation approach. The system dynamics model is created using Vensim: “industrial-strength software that can be used for simulating social, economic, and environmental systems in an interconnected way” [
57]. The results of the model include the creation of an integrated cost–benefit analysis (CBA) that includes the required investments and the resulting avoided costs and added benefits.
During the modeling process, different scenarios that represent past, present, and future dynamics are simulated. Usually, there is a business-as-usual scenario that will show how the system will behave if the historical trend continues in the future. Additionally, other scenarios assume policy implementation at different levels to estimate the impact on the system. For instance, there may be a green economy scenario that assumes low-carbon development policies. Scenario-based methods can also be used to analyze the influence of different external factors on endogenous variables such as energy security for transport and the climate vulnerabilities and adaptive capacity of infrastructure, e.g., roads and bridges, in relation to extreme climate events [
65]. Scenario analysis allows the creation of what-if assessments that are crucial for decision-making.
The project finance model is built in Microsoft Excel following Corality SMART. It simulates different risk scenarios and determines the effect of those risks on the financial feasibility (or viability) of the project across its life cycle, including how material externalities can affect future cash flows [
57]. The results that the financial model generates include the internal rates of return (IRR), net present value (NPV), debt service coverage ratios (DCRS), loan life coverage ratios, and other indicators.
To date, SAVi models have covered a variety of sectors such as (i) agriculture, (ii) roads and transportation, (iii) energy, (iv) water, (v) buildings, (vi) nature-based infrastructure, (vii) materials management, and (viii) green public procurement. Particularly in the transportation sector, SAVi has been used to conduct several assessments, including assessments on bus rapid transport and transport electrification, and it is capable of assessing projects in roads, rail, light rail, and other types of transportation [
58]. SAVi models can be applied to different stages of the project cycle, ranging from the early design stage to implemented projects.
3.3. Case Studies
Three case studies were assessed using the SAVi method. The first focused on Malaysian Borneo and studied a proposed road construction investment. The second focused instead on bicycle infrastructure in the sub-city of Dwarka, New Delhi, India. The third analyzed the planned bus rapid transit system in Dakar, Senegal.
These three case studies were chosen based on (a) their geographical diversity in terms of the country, as well as the urban/rural context; (b) the different solutions proposed to address mobility needs, with diverse infrastructure options being envisaged; (c) the different stages of the projects, with BRT in Dakar being approved, road construction in Borneo being planned, and bicycle infrastructure in Dwarka being a project recently conceptualized; and (d) the availability of local stakeholders to co-develop and validate the analysis performed and eventually use its results to inform decision-making at a local level.
The diversity of these three projects is expected to shed light on the suitability of the approach proposed, allowing assessment of whether all the modeling approaches are required and useful and whether the same or different indicators are of relevance for each of the three case studies (e.g., air pollution, greenhouse gases, noise, accidents, and impacts on territory [
66]). Furthermore, all the projects are expected to generate societal benefits, but no quantitative assessment has been carried out to date to estimate these benefits.
3.3.1. Road Infrastructure Investment in Borneo
This SAVi assessment examined the costs and benefits of recovery spending in the case of the Pan Borneo Highway in Malaysia, which is currently under construction and cuts through one of the world’s most biodiverse regions, the Heart of Borneo.
Table 2 shows the main indicators considered in the SAVi simulation, including costs, benefits, trade-offs, and costs for mitigation and offsetting environmental damage. The assessment encompassed a valuation of the capital and operational costs and benefits of the highway, a spatial analysis of land-cover change, and the subsequent ecosystem services deterioration caused by the road construction, as well as a valuation of trade-offs such as carbon emissions [
67].
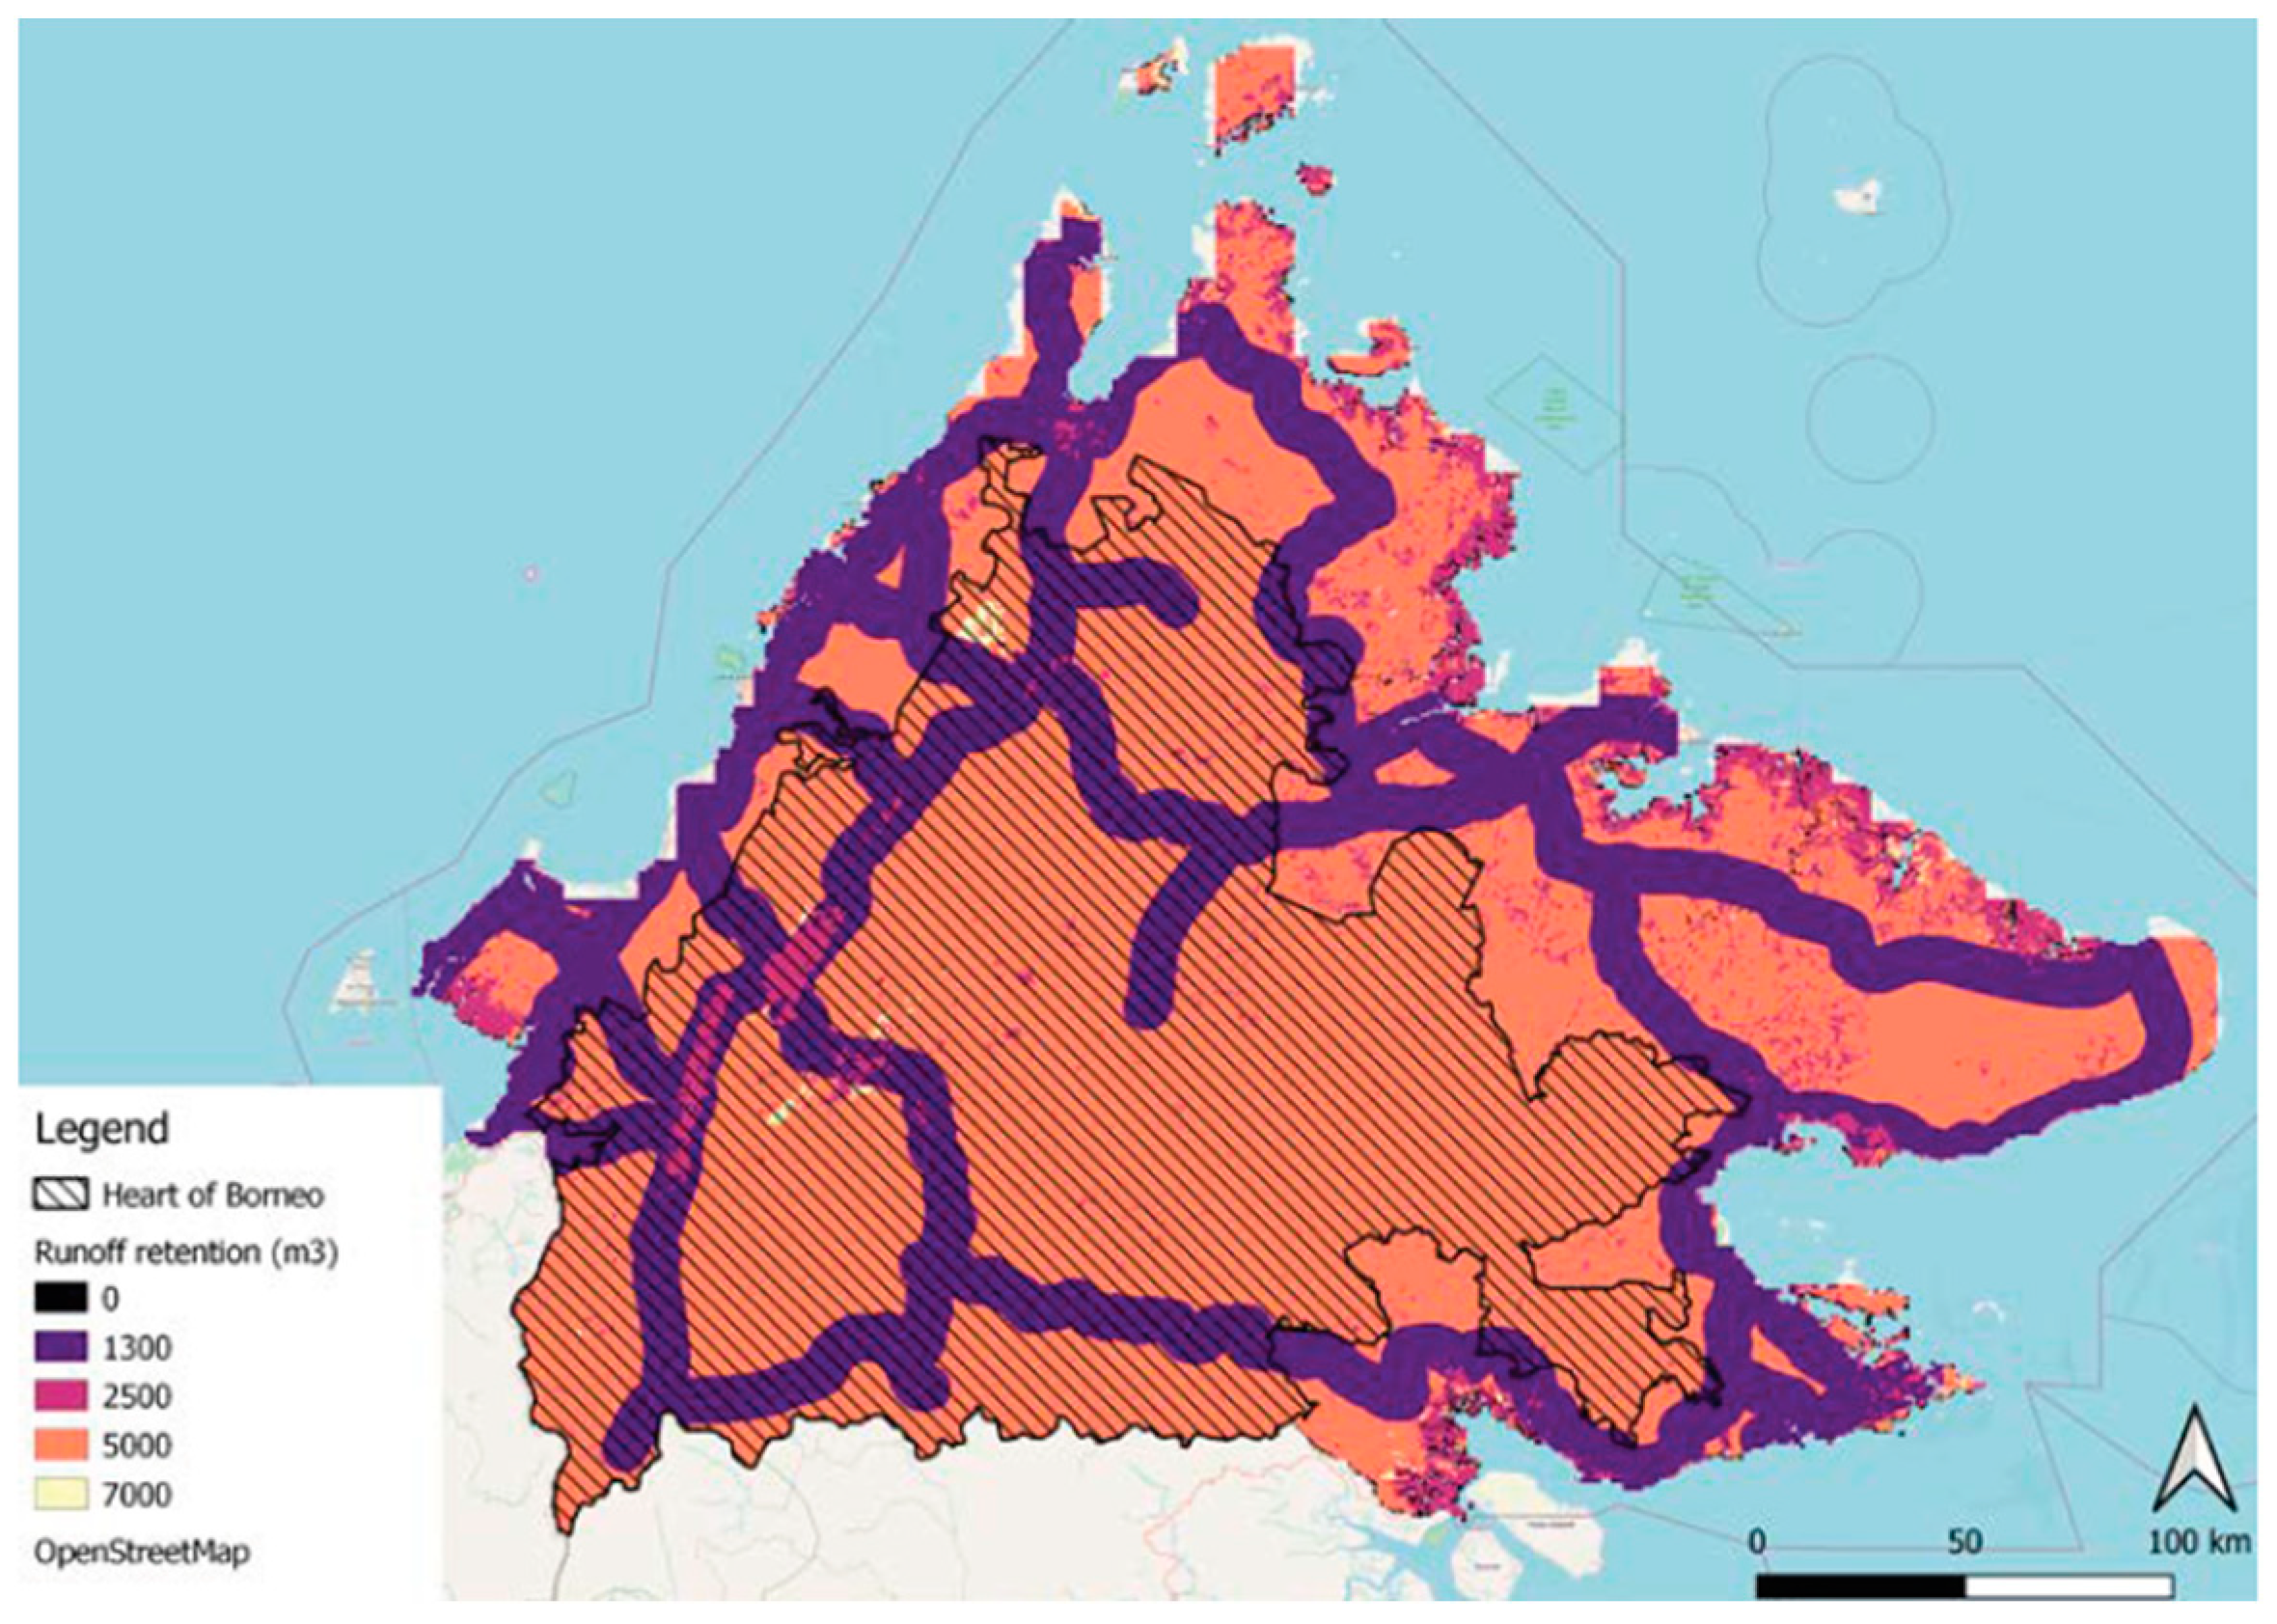
The reduction in carbon sequestration caused by road construction was estimated using spatial analysis. We determined the area deforested due to road construction, as well as the potential emergence of feeder roads that would provide additional access to agricultural production areas (i.e., determining direct and indirect losses in carbon sequestration). Spatial analysis was also used to determine the potential increase in carbon sequestration under reforestation scenarios. The economic value of carbon sequestration loss was calculated by multiplying the amount of carbon by a carbon price. Two values were used: the social cost of carbon and the average emission abatement cost at country level from forestry projects. The increased spending caused by flood damage was calculated based on the runoff retention (measured in m
3) estimated under different scenarios, also using spatial analysis based on land cover change. The cost of biodiversity-related services was estimated based on the calculation of habitat quality using spatial analysis, and the calculation of how this indicator would change under scenarios of road construction and reforestation. Lastly, the environmental cost of Portland cement production was calculated based on the emissions generated in the production process, multiplied by the social cost of carbon. In addition to estimating the costs of trade-offs associated with the Pan Borneo Highway, SAVi estimated the potential costs and benefits of mitigating and offsetting strategies for some of the adverse effects [
67].
To perform the assessment, two what-if scenarios were created that proposed mitigation and offsetting measurements:
Option 1: this scenario assumes the reforestation of areas deforested due to the highway construction and the creation of wildlife crossings that mitigate habitat fragmentation.
Option 2: this scenario assumes investments in solar energy generation to replace coal-fired power plants to reduce carbon emissions by the same amount as those caused by deforestation and cement production, and the provision of wildlife crossings to mitigate habitat fragmentation. This scenario has a low-end and a high-end calculation to simulate variations in the carbon emissions caused by deforestation.
3.3.2. Public Bicycle-Sharing System in Dwarka, New Delhi, India
The SAVi public bicycle-sharing (PBS) model customized to Dwarka estimates and values the environmental, social, and economic co-benefits and avoided costs generated by different demand scenarios for the PBS system [
62]. Dwarka is serving as a pilot for PBS systems in Delhi, given the mobility and urban development challenges that the city is facing. The model considers the externalities shown in
Table 3 related to the PBS system, which are monetized in the creation of the integrated cost–benefit analysis included in the assessment.
The benefits from physical activity were estimated using the Health Economic Assessment Tool (HEAT) developed by the World Health Organization (WHO) [
68]. The value of time saved was estimated by calculating the average time of travel by transport mode, which was then used to quantify the time saved and finally multiplied by the hourly salary of commuters. Changes in retail revenues were estimated based on the assumed increased attractiveness of local businesses, should walkability in the area improve. The additional retail spending volume per PBS demand scenario was calculated using the baseline average minimum daily retail spending in Delhi [
69] multiplied by the assumed 42.2 percent retail spending increase [
70,
71] and the number of defined PBS users per demand scenario. The change in property values was calculated based on the assumption used in various studies that improved walkability in a city can increase property values by 5 to 15 percent [
70,
72,
73]. The avoided cost of air pollution was estimated based on the carbon and air pollution intensity of each transport mode (e.g., PM2.5, NOx, CO, and HC) and the health costs associated with emitting one kilogram of a specific air pollutant [
62]. The cost of increased exposure to air pollution, which is relevant because the cyclist will be more exposed, was estimated based on the health cost per km travelled per person, as indicated by Rabl and Nazelle [
74], and the total vehicle-kilometers (vkm) shifted from motorized to non-motorized transport in Dwarka. The avoided cost of GHG emissions was estimated by multiplying the avoided tons of CO
2 emissions by the social cost of carbon per ton of CO
2 and compared with the avoided cost of pollution. The cost of accidents was calculated based on the estimated number of accidents and their consequences (minor, major, and fatal), and the economic valuation of an accident. Finally, the cost of noise pollution was calculated first by determining the number of people exposed to noise using noise map data and then multiplying that value by the cost of noise per person exposed [
62].
To assess the PBS system, four scenarios were created. The first consists of a baseline scenario that assumes the transport infrastructure and dynamics will continue as they are at present, and the other three correspond to PBS demand scenarios (low, medium, and high PBS demand). The different demand scenarios are modeled because the demand for new and transformative public transport projects is difficult to estimate [
62].
3.3.3. Bus Rapid Transport, Dakar, Senegal
This project assessed the added value of bus rapid transit (BRT) infrastructure when compared to road maintenance and expansion for private transport in Dakar. The BRT is expected to improve Dakar’s economic performance, as well as to make the labor market more accessible to those living further away, while making a more positive environmental contribution [
75].
The SAVi assessment includes the valuation of BRT preparation costs and externalities related to the project, as well as a comparison of the costs and benefits of the project across different scenarios, as shown in
Table 4. The preparation costs include the compensation and reinstallation payments for households impacted by the projects, from whom land was purchased and for whom alternative housing was identified. Further employment impacts from the construction and operation of the BRT were estimated. All these indicators were then included in the integrated cost–benefit analysis and project finance assessment [
75]. The externalities included primarily BRT impacts on the time of travel, pollution, and accidents. Other studies have assessed similar project outcomes [
76,
77]. In addition, we estimated employment creation and discretionary spending.
Discretionary spending, which represents the amount of money that flows back into the economy due to additional employment and consumption, was estimated to be 30% of the additional annual labor income created by the project. The value of time saved was calculated at USD 0.77 per hour of avoided travel time, as a result of the introduction of the BRT. The avoided cost of transport was calculated based on the cost of transport per vehicle-km for six different transport modes: Bus Dakar Dem Dikk (DDD), Bus Association de Financement des Professionnels du Transport Urbain (AFTU), taxi, private vehicles, multi-modal, and the BRT. As the BRT results in a decrease in the use of other transport modes, there will be avoided costs. The avoided cost of pollution was estimated by multiplying the km travelled by the different vehicle types by the vehicle-km cost of pollution for PM
2.5, SO
2, and NO
x emissions. The avoided cost of GHG emissions was computed by multiplying the emissions per year generated by each transport mode by the cost of emissions per ton. Finally, the avoided cost of accidents was calculated based on the number of accidents resulting from the new transport mix, their severity (light injury, heavy injury, and death), and the unit cost [
75].
To assess the costs and benefits of the BTR, four scenarios were simulated: a scenario without BRT, a scenario with BRT, and two sensitivity scenarios where the demand for the BRT drops or increases compared to the general BRT scenario (under or overestimation of the demand impact).
4. Results
The results generated by the application of the SAVi methodology in the three mentioned cases are given in this section and will be discussed in the next section.
4.1. Road Infrastructure Investment in Borneo
Several sectors could benefit from the highway construction. The tourism sector could improve because the highway will increase the accessibility to diverse parts of the island’s forests, providing a benefit of USD 2.225 billion over 25 years. The project could generate an additional annual wage of USD 138.34 million due to indirect jobs. Another benefit is the travel-time reduction, avoiding a cost of around USD 86.06 million for commuting.
On the other hand, the assessment in Borneo showed that the runoff retention could be reduced as a result of the Pan Borneo Highway due to deforestation, which increases flooding events and flood damage down the line. As shown in
Figure 1, the runoff retention decreases to 1300 m
3 where the highway is built (purple lines).
In economic terms, the integrated cost–benefit analysis showed that the project could generate benefits of USD 1.06 for every USD 1 invested in the highway (see
Table 5). However, when considering the costs of negative externalities, the project is much less beneficial for society, generating less than USD 1 (i.e., USD 0.97) for every USD 1 invested.
If mitigation and offsetting measures are included, for every USD 1 invested, approximately USD 1.04 or 1.05 will be returned, but there is still a low societal return on investment.
The novel outcome of the integrated study is that investing the same amount as for the new highway in reforestation and renewable energy brings higher benefits compared to the other scenarios. The SAVi methodology estimates a return of from USD 6.17 to USD 9.43 for every USD 1 invested in reforestation and from USD 18.87 to USD 28.83 for every USD 1 invested in solar energy generation. This analysis demonstrates that new infrastructure is not necessarily the most viable investment. Investing in environmental remediation and cleaner energies offers a higher return, avoiding irreversible biodiversity loss and creating economic growth via a different path based on sustainability, in the Malaysian economy.
4.2. Public Bicycle-Sharing System in Dwarka
The conventional cost–benefit analysis for the PBS system portrayed in the first rows of
Table 6 indicates that the project as designed is not financially feasible. For the three demand scenarios, total costs are higher than revenues, generating a negative net benefit.
When considering the integrated cost–benefit analysis, accounting for externalities, each demand scenario yields a positive net value. The higher the demand for using the PBS system, the higher the positive net results.
In the categories of benefits and costs, the most significant benefits are derived from the increase in property values (from INR 168,910 per day in the low-demand scenario to INR 363,532 per day in the high-demand scenario) and the value of time saved (from INR 487,397 per day to INR 1,457,123 per day across all scenarios). For the avoided and added costs, the avoided cost of air pollution is the biggest contributor, at between INR 33,415 per day and INR 729,805 per day across the scenarios, followed by the avoided cost of noise pollution, accounting for a minimum of INR 15,100 per day and a maximum of INR 32,498 per day among the scenarios.
Among the other benefits associated with PBS in Dwarka, are multi-modal, convenient, safe, and affordable transport, reduced emissions (more than INR 2000 per day for the social costs of carbon), fewer fatality events (at least INR 1890 per day of avoided costs of accidents), transport efficiency (by reducing the traveling time) and health effects (by increasing physical activity and reducing pollution).
From the results, it emerges that in the context of Dwarka, a PSB project may be economically feasible only if externalities are considered or when a societal point of view is considered.
4.3. Bus Rapid Transport (BRT) in Dakar
The results illustrated in
Table 7 show that the BRT project in Dakar is not financially viable under a traditional financial assessment for two out of three scenarios. When environmental, social, and economic externalities are integrated into the financial assessment, the financial performance improves, showing that the project is economically viable for all the scenarios. Specifically, the IRR grows from 2.17% (with negative NPV of USD 51 million) to 37.7% (with positive NPV of USD 1500 million) [
75].
The greatest contributors to the externality’s net benefits are the avoided cost of transport (from infrastructure other than the BRT), with values between CFA 1,146,107 million and CFA 1,764,121 million across the scenarios, and the value of time saved, with values between CFA 424,614 million and CFA 657,517 million across the scenarios.
Implementing the BRT also reduced the exposure to air pollution compared to other modes of transport; the GHG emissions declined between 8.5% and 13.7% compared to a scenario without BRT, and accidents declined by more than 13% due to the reduction in the total vehicle-km traveled. Implementing the BRT also reduced congestion, decreasing the total time spent in traffic by approximately 30%.
Finally, while the BRT project inevitably has a negative impact on jobs related to providing other modes of transportation such as Bus DDD, AFTU, and taxis, the assessment also found an overall positive impact for the economy based on additional spending associated with other jobs not related to the transportation sector, due to the better access to the local job market.
5. Discussion
The previous section, with the results of the application of the SAVi methodology and model, demonstrated that the economic viability of transport projects changes depending on whether societal externalities are included or excluded. This shows that the value of externalities and risks beyond construction are meaningful and can be relevant in determining whether to invest in the project. Specifically, in the case of the public bicycle-sharing system in Dwarka, the project was not feasible under the traditional CBA, but all scenarios showed that the project was economically viable when the value of externalities was considered. Similar results emerged for the BRT project in Dakar. This is consistent with other studies in the literature, although externalities are seldom estimated and valued [
79]. On the other hand, it must be recognized that some of the avoided costs and extra benefits of sustainable transport investments are tangible, while many others are intangible. The former impact decision-making for investors, while the latter only influence decision-making for the government and civil society, being relevant from a societal point of view while not generating direct cash flow for the project developers. Furthermore, the results of the analysis carried out for the three case studies highlight the magnitude and relevance of externalities compared to construction, operation, and maintenance costs for transport infrastructure. The value of externalities is between 4 and 10 times larger than conventional project costs, accounting for both avoided costs and additional benefits, respectively, for the BRT and public bicycle infrastructure. The Borneo project further shows that investing in nature has a higher return than investing in road infrastructure; both investments are economically viable but investing in the mitigation of externalities results in higher returns. These findings are innovative and allow different methods of project valuation to be directly compared. Specifically, a sustainable asset valuation is well aligned with national development goals and the SDGs. This is because it considers social, economic, and environmental investment outcomes, emerging over the short, medium, and longer term. As a result, it allows the determination of whether, and to what extent, transport investment will support the transition towards multi-dimensional development goals.
There is innovation also in the methods and models used, with a consistent underlying approach applied to three diverse cases, resulting in the creation of customized and yet comparable assessments. Firstly, the consideration of the perspectives of many stakeholders has allowed indicators to be estimated that are common to all studies, as well as others that are unique to each case. For instance, avoided air pollution is one of the most important externalities for Dwarka, while avoided time of travel is key for Dakar, and carbon and biodiversity loss represent the highest costs for Borneo. Secondly, customization is essential to capture the potential advantages and side effects emerging from the implementation of infrastructure investments, including those for transport. Along the same lines, the use of economic valuation methods and data that are related to the local context is paramount (e.g., air pollution is less relevant for Dakar and Borneo because of the lower level of air pollution present to date, along with lower population density and exposure), as already indicated in the literature that focuses on ecosystem service valuation [
80,
81]. Thirdly, the quantification of the many direct and indirect outcomes of investments, regardless of whether these are externalities, requires knowledge integration and the use of mixed methods. This is also useful for creating a shared understanding across stakeholders and increasing ownership of the analysis. This is because the results are produced with methods that are familiar to the local stakeholders, with the added benefits of linking such studies to one another to create a unified and consistent analysis.
The main recommendations emerging from this study are: (i) the need to demand project assessments that include several performance indicators reflecting the concept of sustainable transport early in the project lifetime (e.g., at the design stage). This will allow for consultations and data collection that will ultimately result in the implementation of projects that carry a low risk in relation to side effects and climate vulnerability. In addition, (ii) multidisciplinary teams should be formed to assess sustainable transport investments. Otherwise, if conventional methods are used, the avoided costs and benefits of these projects are likely to be underestimated. Finally, (iii) project assessments (e.g., cost–benefit analysis) and policy analysis should be performed taking into account the economic viability of the project construction and operations, as well as the societal value for money of the project (i.e., the analysis presented in this paper). This is to ensure that investments are approved and implemented every year that support reaching medium- and longer-term development goals.
The methods and analysis presented in this paper are of direct relevance to sustainable transport projects. However, the same principles can be applied to any other type of infrastructure investment such as energy, buildings, water, and waste. All infrastructure investments generate benefits and side effects. The identification, quantification, and analysis of both desirable and undesirable outcomes is necessary to ensure that infrastructure investments become enablers of sustainable development. Regarding specific policy relevance, all types of built infrastructure require energy, land, and raw materials. All these generate air emissions and must be addressed in the context of climate mitigation. Further, all built infrastructure is vulnerable to climate change, and hence the adaptive capacity and climate resilience of infrastructure should be considered when assessing investments. As a result, in the context of climate policy, all future investments should be assessed with a systemic approach that is consistent across assets but also customizable using a co-creation approach.
Having described many of the advantages of the method proposed and its potential for future applications in the transport sector and beyond, it should be stated that there are many challenges and weaknesses yet to address. First, the high degree of customization of the performance indicators and models is time-consuming and requires country- and location-specific data. This prevents scaling and results in a “project by project” process that can only be accelerated if SAVi or a similar integrated approach is used by many researchers or practitioners. Secondly, the approach proposed requires knowledge integration. While data may be available in different research domains, limited data are found concerning the interconnections of different fields (e.g., the impact of air pollution on morbidity). The assessment of “systems” is where more effort should be concentrated, supporting the creation of multidisciplinary teams within academia for infrastructure assessments. The creation of more assessments and the dissemination of results to a wide range of audiences may represent a solution to these problems, generating interest and demand for more infrastructure assessments.
Finally, there are further areas requiring improvement in the method and analysis. For instance, additional methods and models could be merged to inform different policy processes. As an example, developing models that are spatially explicit as well as location-specific would allow the analysis of equity and equality to be refined (e.g., in relation to access to transport services or exposure to pollution). This would allow the analysis to be expanded to active mobility [
82] and micro-mobility [
83], as well as to sector-specific strategies (e.g., short sea shipping [
84]), considerably expanding the potential applications of the methods and tools proposed. Further, merging models of different transport modes into a single assessment would allow the impacts of different urban planning strategies on local development to be analyzed. Finally, synergies across sustainable assets could be explored in the context of urban assessments, e.g., merging transport assessments with nature-based infrastructure in urban areas to further reduce air pollution, provide shade, and increase climate resilience.
Ultimately, sustainable development requires that each investment is sustainable and that the combination of outcomes of different investments is also sustainable. Synergies can be found between sustainable transport and sustainable landscape management or urban planning, as well as energy and water planning, which is the next frontier for our work and for the development of SAVi.


