2. Methodology
The analysis of the impact of the construction and commissioning of a rail freight infrastructure must consider the regional economic system in its entirety, since this impact extends beyond the direct contribution to the increase of production, and the consequent generation of income from capital and remuneration for work incorporated in that activity. It is necessary to quantify the indirect effects that are generated with the purchases of goods and services, as well as the income generated, from both direct and indirect suppliers; that is, the drag effect of the investments made and the operation of the infrastructure [
26]. The structure of intersectoral relations reflected in the Input-Output tables provides an adequate tool to determine the drag on the rest of the economic system [
27]. The effects generated on the employed population and the wage incomes associated with these levels of employment (induced effects) can be quantified by the relationships between production levels and employment needs [
28].
The input-output analysis has been a valuable tool for the study of productive systems, since it considers that the effects of demand in the productive system are not exhausted in its simple direct satisfaction but are spread and multiplied through the framework of the dominant intermediate relationships in the economic system [
29]. These analyzes require the creation of a symmetric Input-Output table (TIO) that is able to represent the economic system as a whole, on which an accurate measurement of all its interrelationships and main variables will be established within the production and exploitation accounts of a certain economy. This matrix simulates all the intersectoral relations of a given economy, which allows implementing an input-output demand model, which quantifies the impacts on the vectors of production, added value and employment, associated with a certain volume of investment/billing in a temporary reference period. It is therefore the best method to quantify the socio-economic effects of the investments required in the adaptation of Cofemanex and its subsequent exploitation as a high-performance rail freight corridor, on the whole of the economic system of Extremadura.
In 1995, Macorra and Prudencio published the regional Input-Output tables (TIO-R) for Extremadura for the year 1990 [
30]. De Miguel et al. published a social accounting matrix and accounting multipliers for Extremadura [
31] and subsequently an Input-Output model of prices applied to Extremadura’s economy [
32]. However, this information should not be used as a reference because it is a reflection of society at the end of the 20th century that has nothing to do with the situation in Extremadura in the 21st century. It has therefore been necessary to look for an autonomous community that has updated TIO-R tables and that has a productive structure similar to Extremadura as its starting point. Finally, among the 12 Spanish autonomous communities that do have TIO
s, the 2008 Autonomous Community of Castilla la Mancha has been selected [
33], which is the latest updated and has the structure of the closest Gross Value Added (GVA) to Extremadura. It is important to note that the impact model derived from the TIO tables operates on the basis of technical coefficients of production, GVA and employment in relative terms. That is why the use of these ratios can be transferred to the case of Extremadura. When absolute values are used, the impact model always work with updated statistical information of Extremadura.
The approach is based on the quantification of the performance indicators on which the
impact vectors are built, for each of the stages considered “
e” (construction and exploitation), and each of the years contemplated in the time horizon of the analysis “
t”. Being
A the inverse matrix of the input-output matrix, the calculation of the total production necessary to supply this initial demand
is made through Equation (1) [
34].
Tarancón [
35] describes the way to obtain the total income generated (
), the employment necessary to carry out this production and the fiscal returns from the calculated production and the coefficients of added value and employment of the TIO-R tables.
The socio-economic impact indicators finally generated are:
- (a)
Total value of regional production, total income (added value) and tax collection generated by the main tax figures (direct and indirect), differentiating between the construction and exploitation phases.
- (b)
Total employment generated (direct, indirect and induced), differentiating the construction and exploitation phases.
To carry out this methodology it will be necessary:
- (a)
Identify the flows of acquisition of goods and services during the stages of construction and operation of the high-performance railway network.
- (b)
Calculate the corresponding macroeconomic effects direct, indirect and induced, in terms of production, added value and employment.
For the construction and commissioning phase, the flows to be considered will be formed by all those investments made for the adaptation of the rail freight corridor. For the exploitation stage, it will be necessary to identify the total amounts of billing generated by the different agents linked to the rail corridor, which must include, not only the strict activities of freight transport, but all those services generated around the infrastructure of reference (maintenance of infrastructure, hotel business, etc.). Additionally, other investments that help to boost the transport activity in the rail corridor (electrification, logistics platforms, execution of accesses to logistic nodes, etc.) must be included. The calculation of the direct effect will be determined by the added value and employment used in each of these activities, while the indirect effect will be calculated from the purchases of goods and services made to other suppliers. In addition to the calculation of direct and indirect effects generated as a consequence of the economic transactions originated, the induced effects are also included, which would be the effects caused by the income generated by the previous ones.
2.1. Construction and Commissioning: Investments and Assumptions Made
Table 1 includes an investment program for the adaptation of the logistics corridor of Extremadura, which includes not only the improvement works in the rail freight corridor between Puertollano and Badajoz, but also the actions associated with the development of regional logistics nodes.
Investment distribution in the period 2015–2017 is attached in
Table 2.
The ballast is obtained in Extremadura, supplying sleepers and rails from other Spanish regions. Hence, 35% of the investment corresponding to manufactures are produced in Extremadura and the remaining 65% is imported from other regions.
2.2. Exploitation Phase: Billing, Investments and Assumptions Made
Five years are considered since the commissioning of the high-performance rail freight network in Extremadura. In this case the period 2018–2022. It is considered that the optimal exploitation of the railway infrastructure will generate returns/impacts in the following products/activity components:
- (a)
Maintenance of infrastructure in the Badajoz-Puertollano section. The Spanish Railway Infrastructure Manager [
37] values the average maintenance cost of one kilometer of conventional rail network per year in Spain at € 33,000/km-year (single track and Iberian gauge). The total cost of maintenance is distributed among the productive sectors of construction and manufacturing, at a ratio of 60 (maintenance of the track)/40 (maintenance of infrastructure and facilities).
- (b)
Rail freight transport to/from intermodal terminals (increase in demand).
Table 3 shows the potential demand that can be collected by the railway under two premises: Badajoz-Puertollano railway section is dedicated to the freight transport and the improvement of the Portuguese rail network in the Sines-Badajoz section, scheduled for 2020.
Based on this potential demand, the expectations for the increase of rail freight traffic in the reference logistic rail corridor are monetized, knowing that only the impacts linked to the import/export rail traffic with origin/destination in Extremadura will be taken into consideration. These impacts will be reflected in two levels: road transport to/from intermodal terminals in the region (the only level contemplated in the model), reduction of transport externalities and gains in competitiveness for the region’s production companies due to the reduction of their logistic costs. Freight transport distances by road within Extremadura are estimated at 120 km. The cost of one ton of merchandise transported by road in an articulated truck of 25 t is 1.23 €/Km [
39].
Table 4 encloses the monetization of the demand for freight transport in the high-performance logistics rail corridor in Extremadura for the reference time horizon (2018–2022).
- (c)
Related or auxiliary activities of the previous ones, such as training, consultancy, hotel services, etc. A billing estimate of 2.0% of the total invested is made.
- (d)
Other investments that are complementary to the development of the high-performance railway corridor and the regional logistics system. Within this chapter are computed the investments destined to the enhancement of logistics and rail freight traffic, such as the actions linked to the line electrification and the rail connections (accesses) of the territory logistics nodes. The sectoral allocation of this investment will correspond entirely to the construction sector. For the period 2020–2022, Coloma and García [
36] justify a complementary investment of € 79.538 million, divided into € 69.528 million for the electrification of the line and € 10.01 million for the execution of railway accesses. The total amount of the investments planned during the exploitation of Cofemanex is attached in
Table 5.
Appendix A describes the design of the reference macroeconomic scenario and
Appendix B describes the procedure followed to estimate the socioeconomic impact and its effects.
3. Results
3.1. Simulation Tool
The model designed is introduced in a simulation tool that allows comparing different levels of impact depending on the intensity of the investments made or the activity developed after the commissioning of the new rail freight corridor. In order to be easy to manage, it has been chosen to develop the tool in a standardized spreadsheet of Microsoft Excel.
Table 6 and
Table 7 quantify the total and disaggregated economic impact, both in absolute and relative terms, of the investments for adapting the existing rail line into a high-performance rail freight corridor in Extremadura.
3.2. Effects in Terms of Production
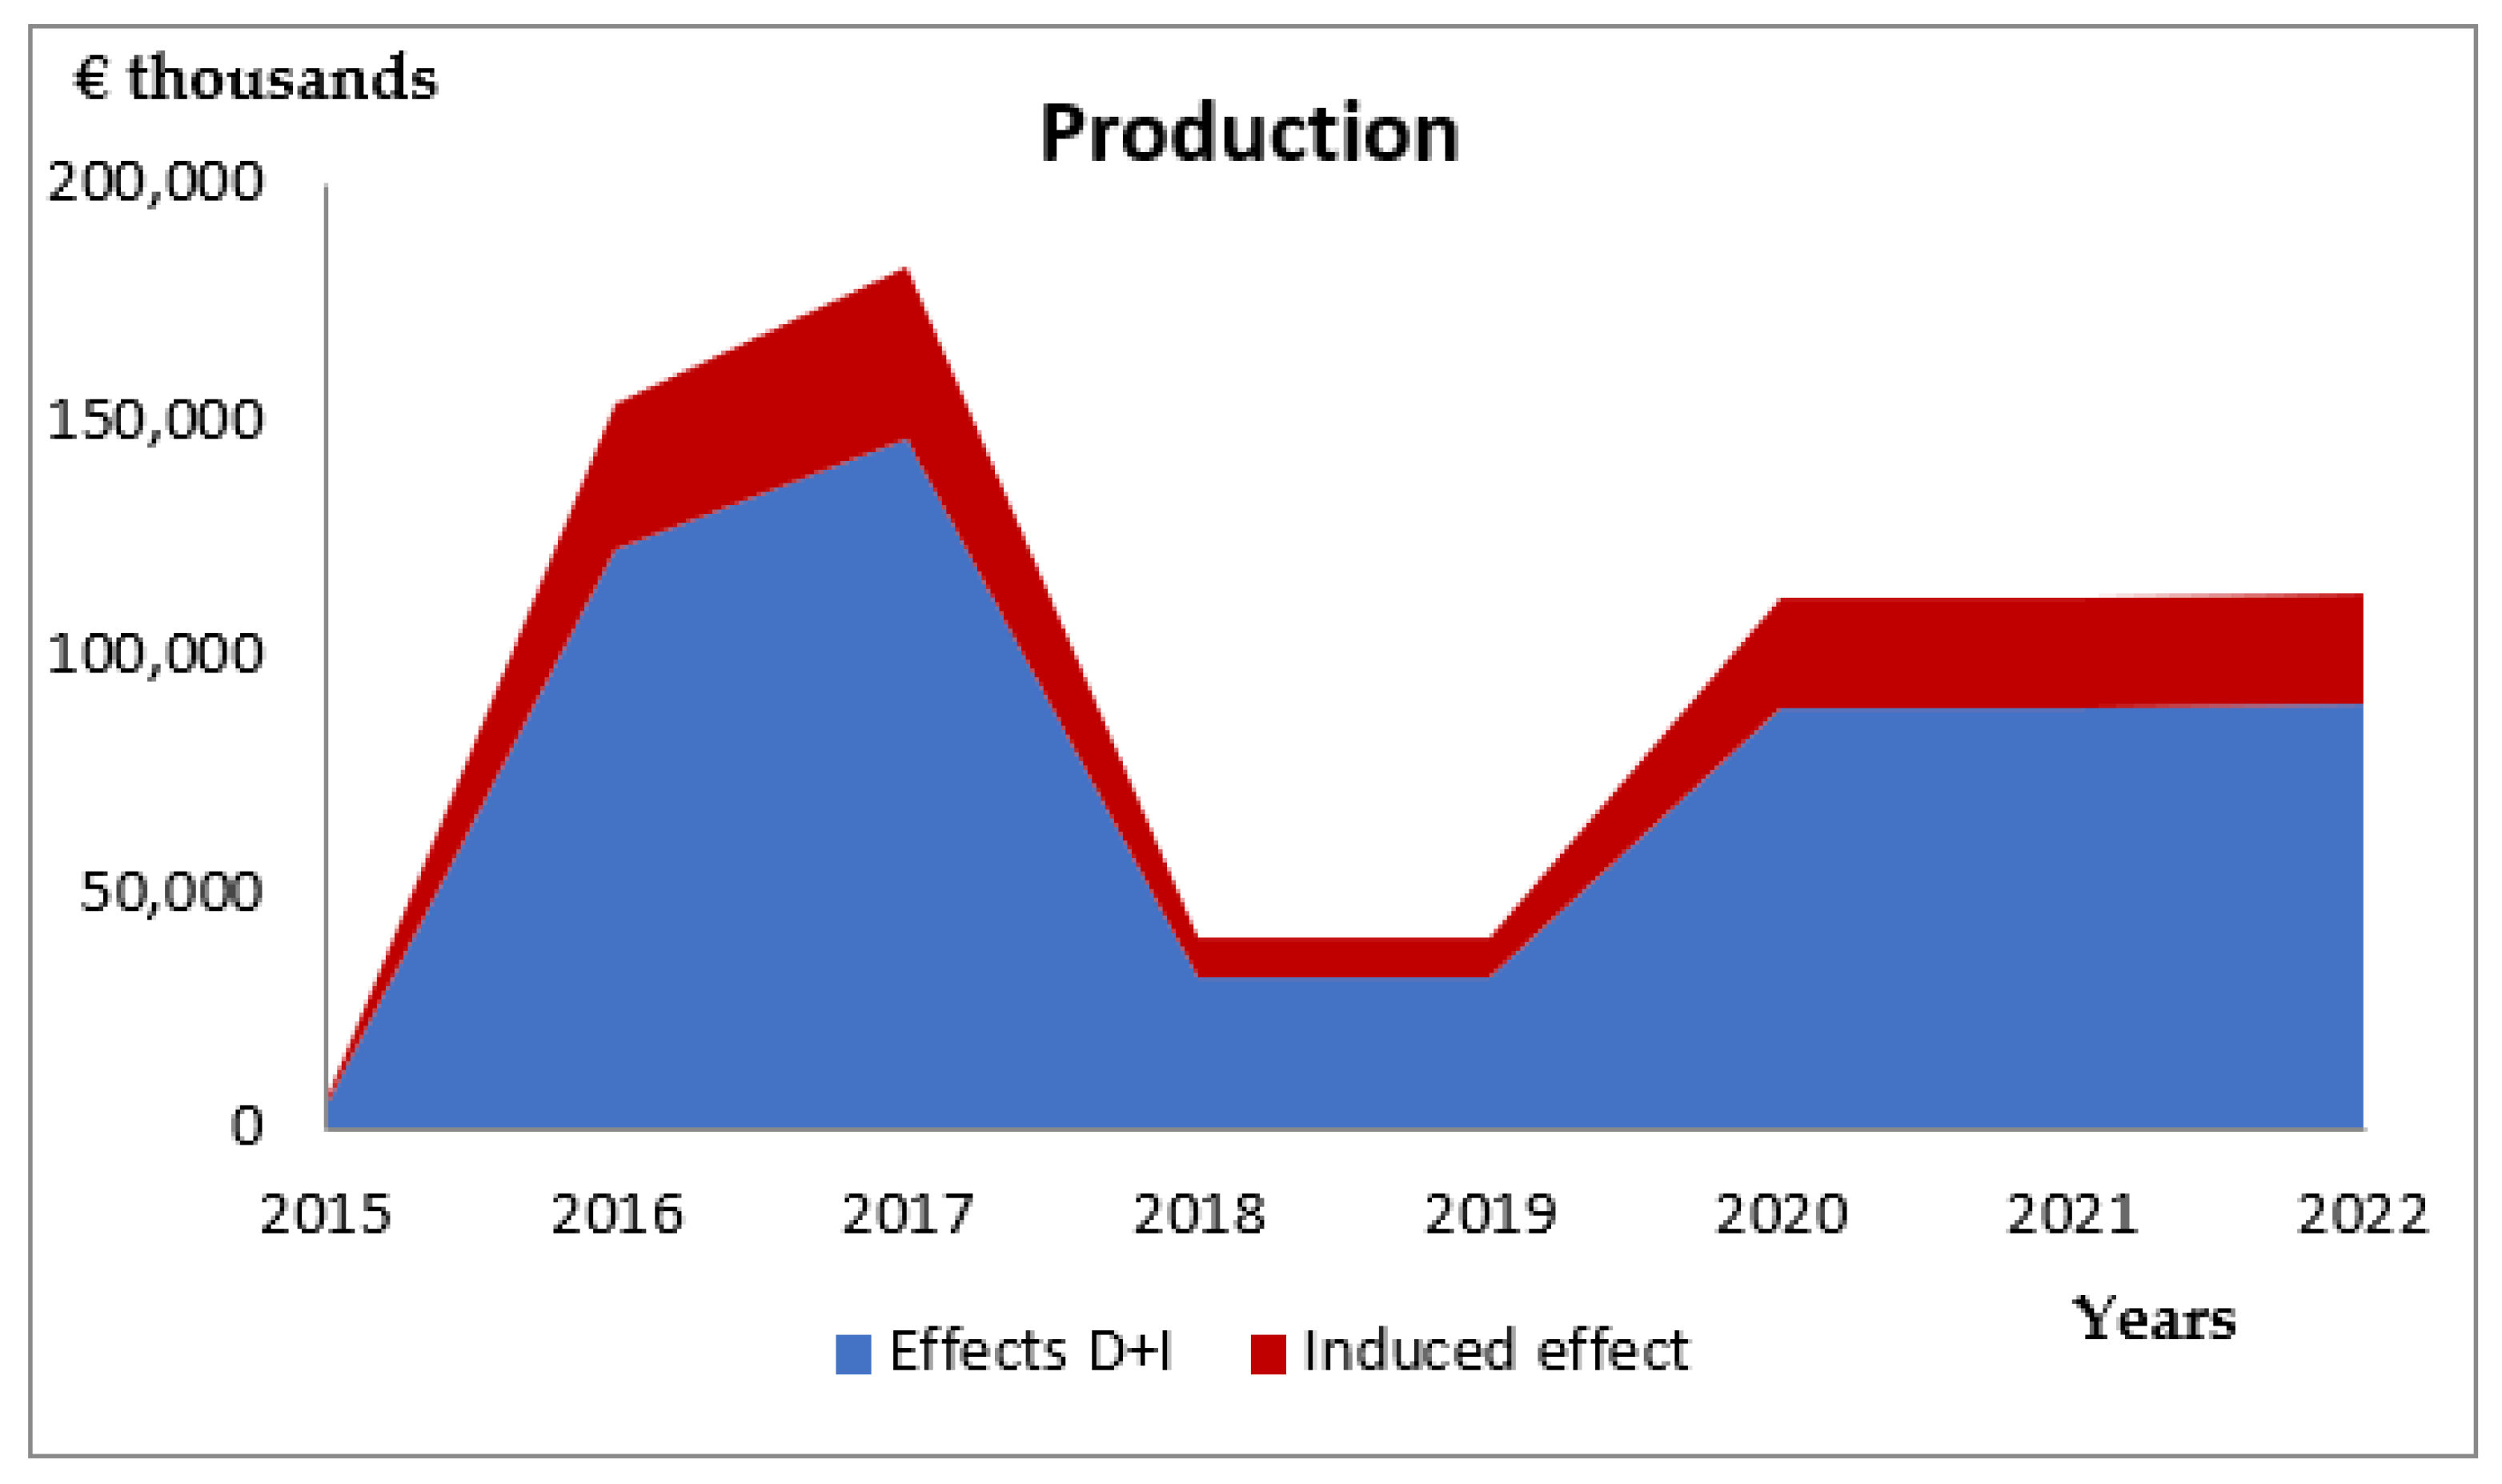
The total economic impact of the investment made in the construction and commissioning of the high-performance rail freight corridor in Extremadura, as well as in the development of the regional logistics system, exceeds 341 million euros in the period 2015–2018, equivalent to a return on regional production of 2.12 euros for each euro of investment. The disbursement of the planned investments will cause a drag effect (indirect more induced) in the regional economy of more than 205 million euros in the period 2015–2017, which represents a multiplier effect of 1.49. This means that for every euro of direct demand in the regional productive system a drag effect of 1.49 euros is generated in the economy of the territory. The impact of investments in terms of production is shown in
Figure 2.
For annuities, it is worth highlighting the year 2017, where the total effects on production come to represent 1.10% of the regional GDP for that year.
During the exploitation phase, complementary actions in the regional logistics system mediate the results. Highlights the effect derived from investment flows in the regional productive system, before 2018 and 2020 onwards.
3.3. Effects in Terms of GVA (Income Generated)
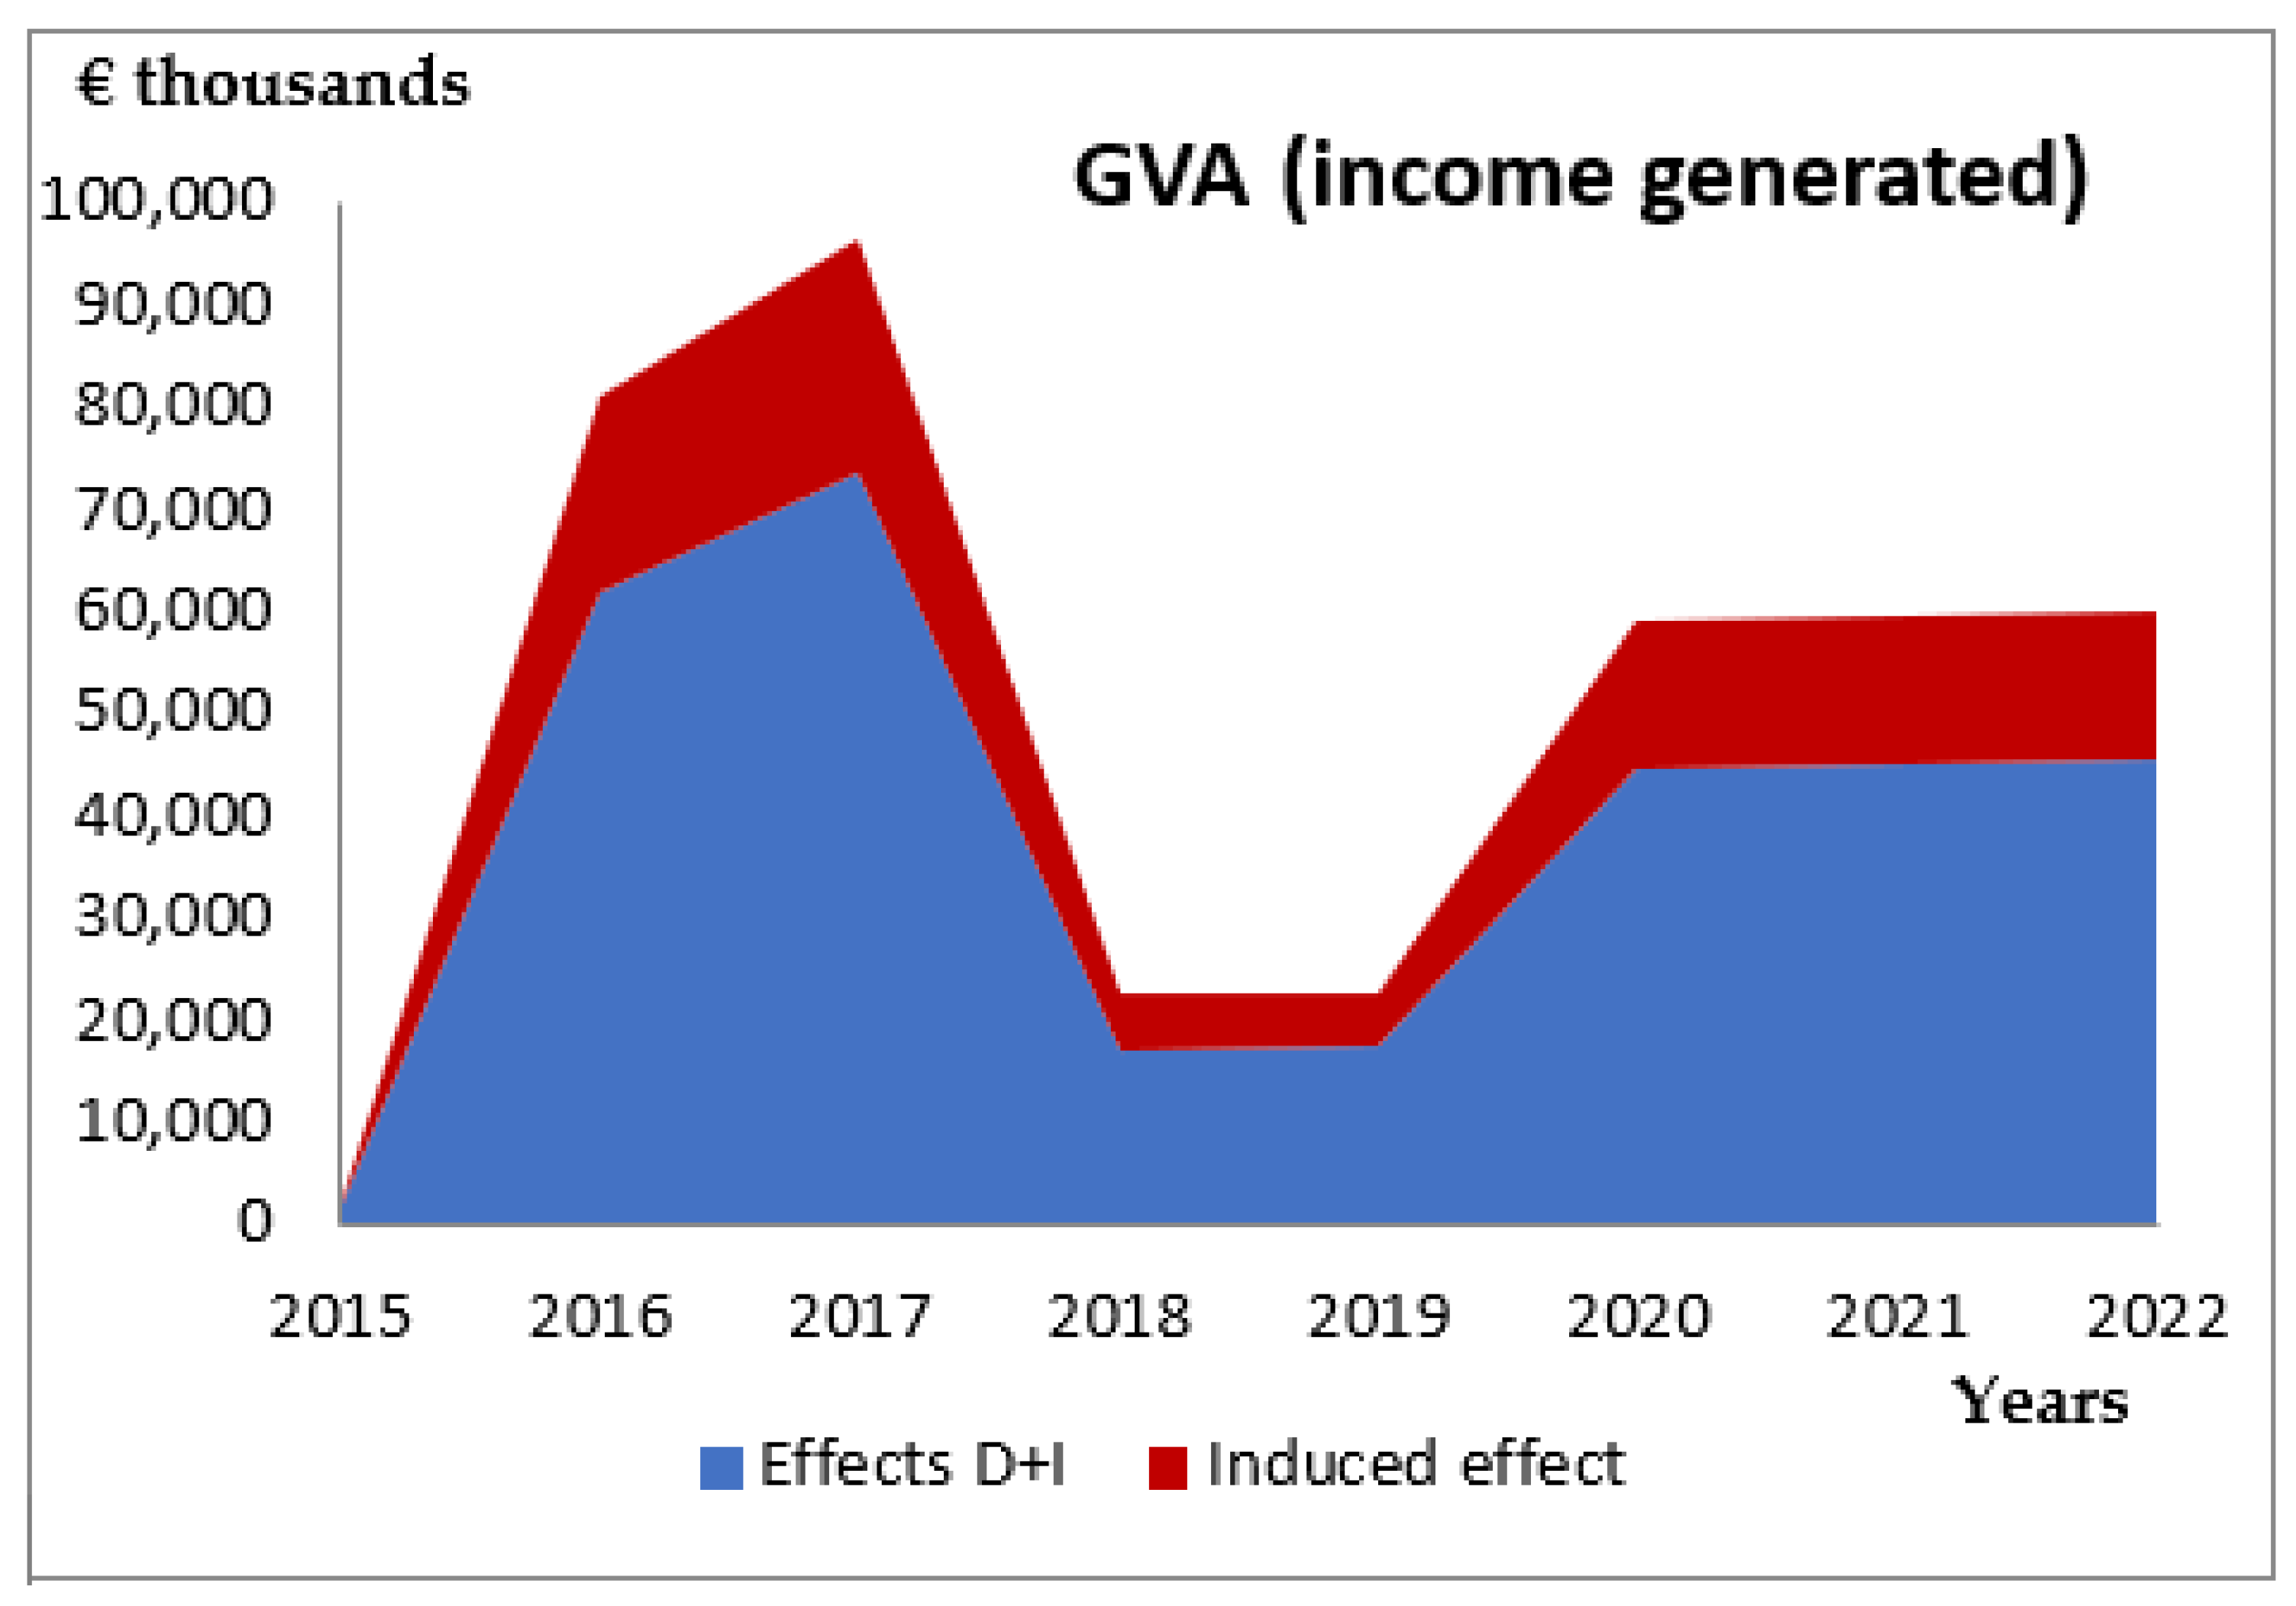
The aggregate of investments for the period 2016–2018 comes to represent 1.19% of the autonomous GVA of 2015 [
23]. Construction, industry and services are the main motor activities. With respect to the estimated regional GDP, the GVA generated in the reference time horizon represents up to 0.57% of the GDP of Extremadura in the year 2017.
Figure 3 shows the impact of the investments on the GVA.
3.4. Effects in Terms of Employment (Unitary Needs)
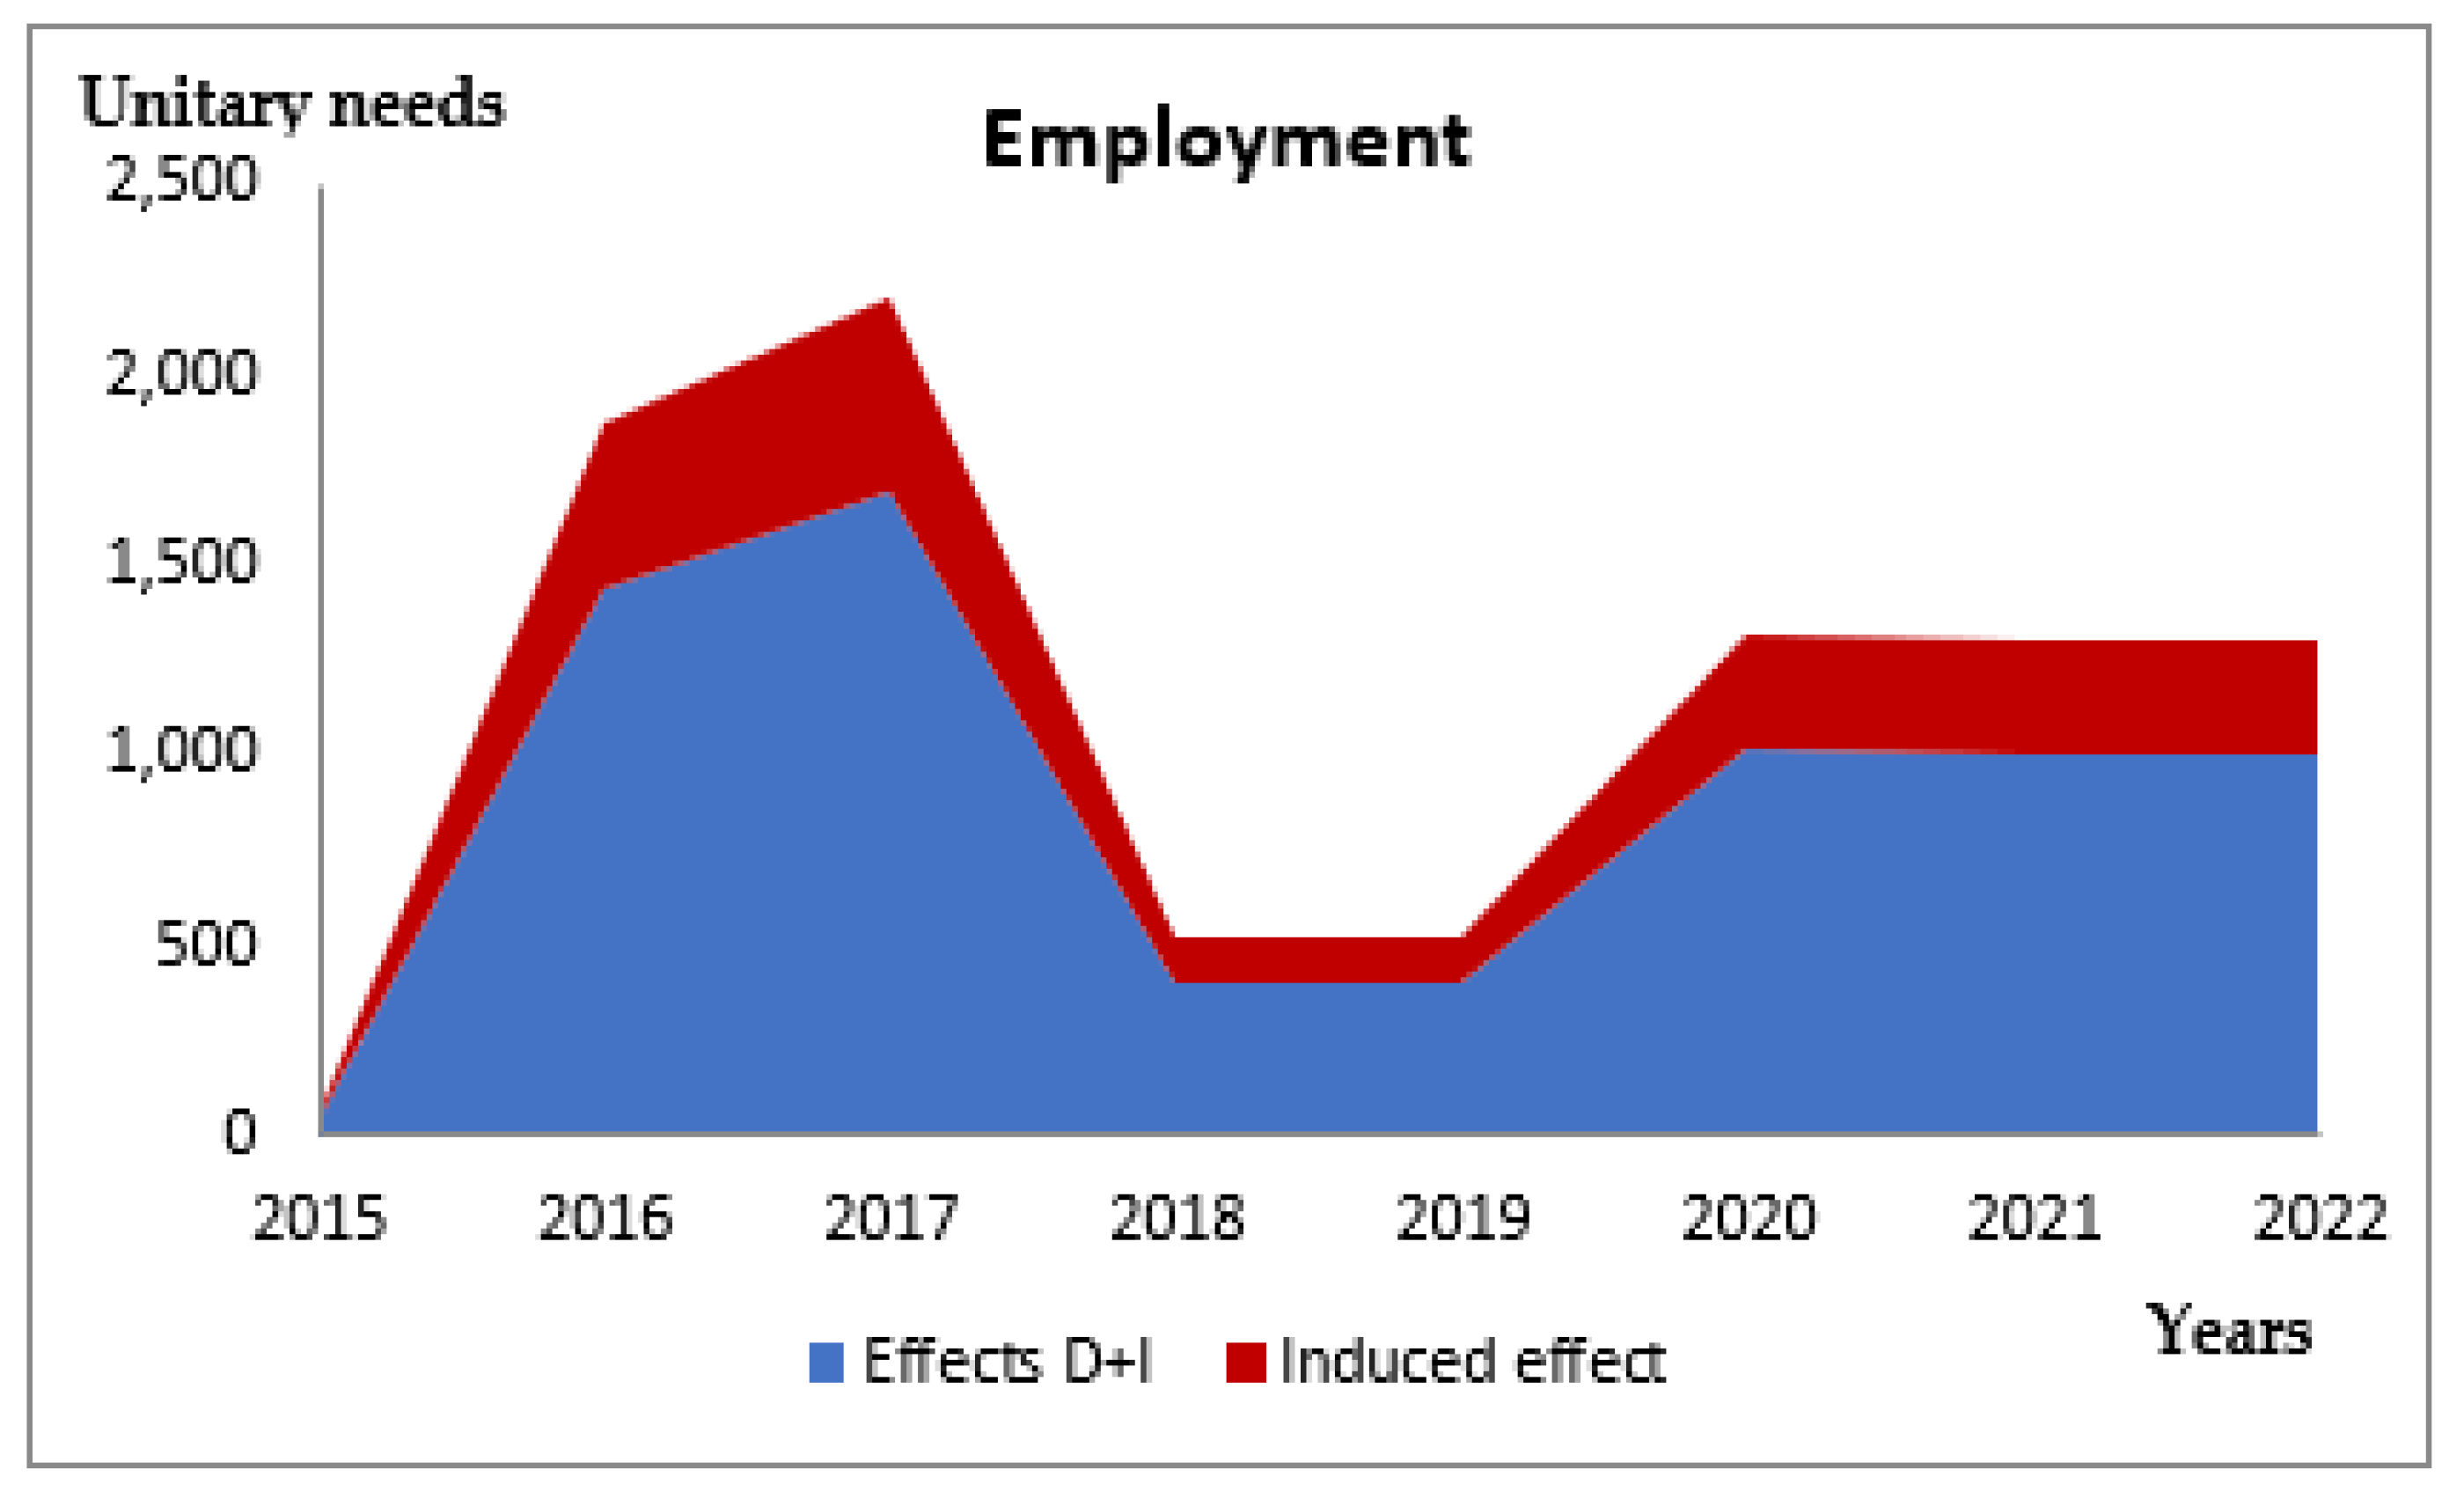
The unitary employment needs for the period 2015–2017 (construction phase) are estimated at more than 4100 jobs.
Figure 4 shows the impact of investments on employment.
For the exploitation phase, the annual employment detail associated with the operation of the high-performance rail freight corridor, offers employment generation figures ranging from practically 500 jobs per year for the first two years of operation of the improved line, to the 1300 from the period 2020–2022. This is due to the increase in transport demand and particularly from new investments to improve the regional logistics system.
In relative terms, the volume of employment generated during the construction phase of the Badajoz-Puertollano line and the development of the regional logistics system is equivalent to 1.24% of the total employed in Extremadura [
22]. In addition, the employment ratio associated with the volume of investment made a unit cost of 39,000 euros for employment generated in the period 2015–2017.
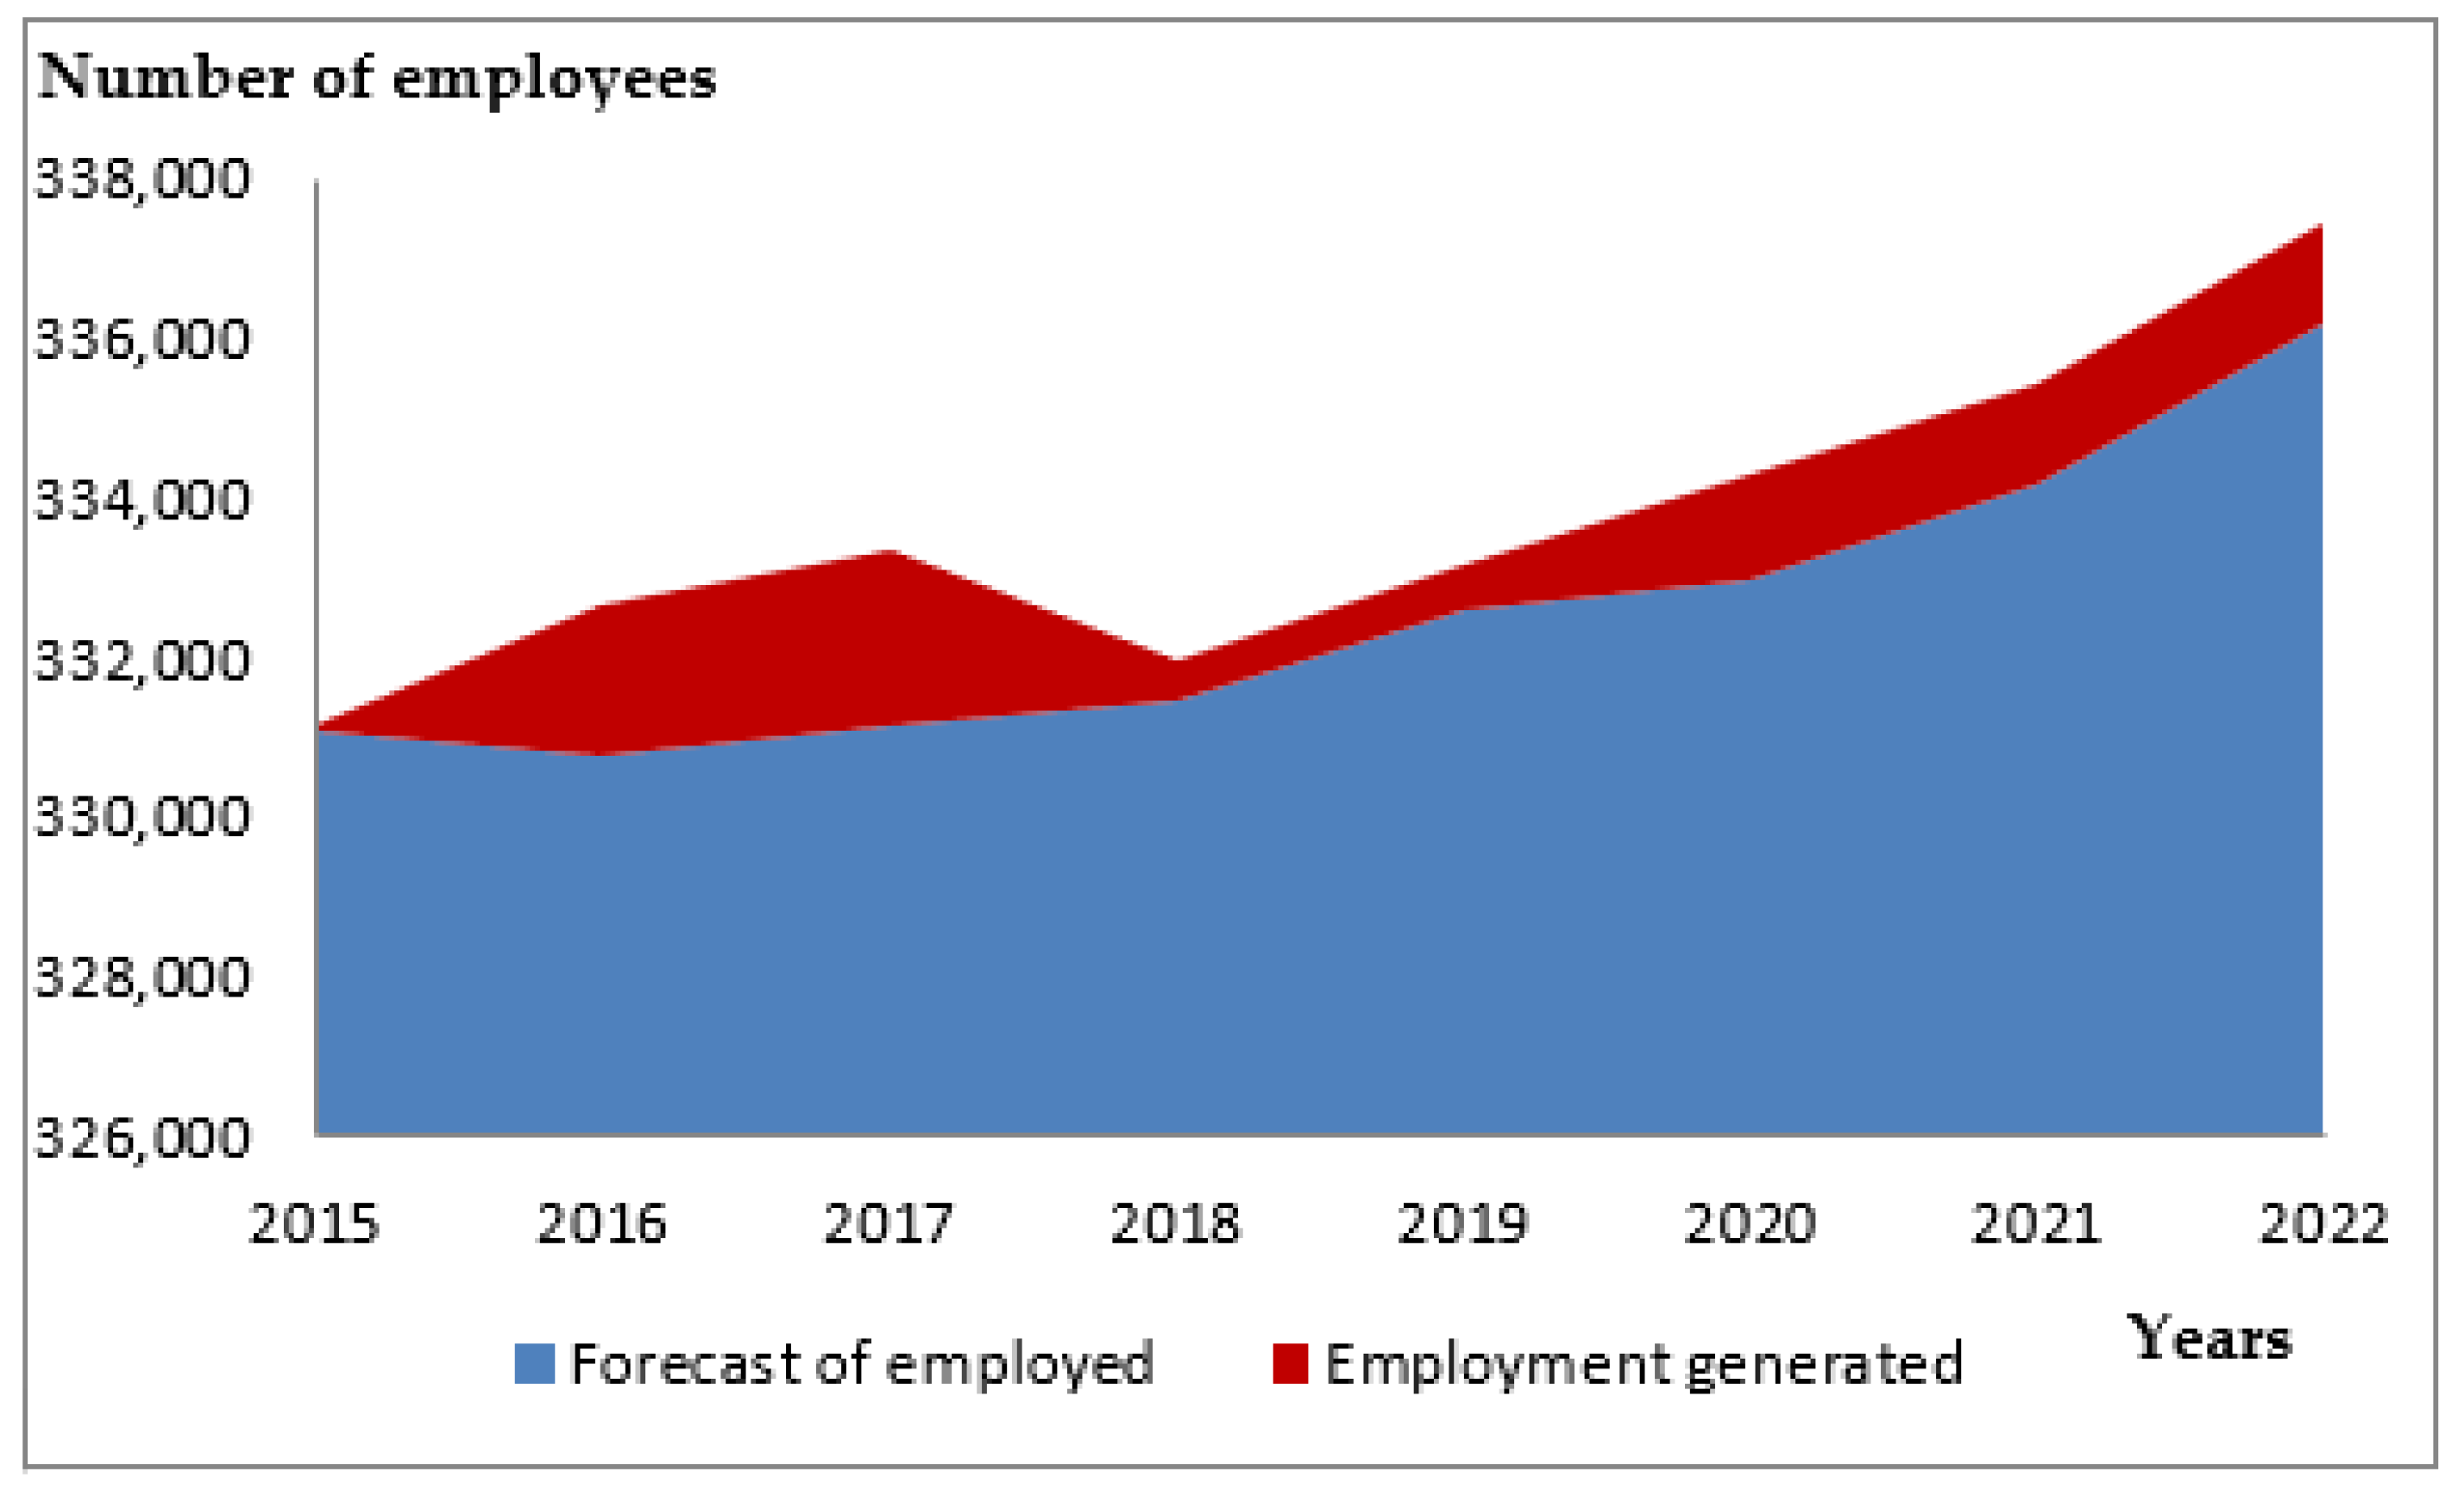
The employment forecast in Extremadura is represented by the number of employed in the macroeconomic scenario of reference (
Figure 5). During the construction phase, the volume of additional employment generated in 2017 represents 0.66% of the total number of employed persons in the region. In the exploitation phase, the relative impact falls to 0.38%.
3.5. Tax Purposes
The tax returns computed over the reference time horizon (2015–2022) amount to around 90 million euros, disaggregated as follows: 45% during the construction phase and 55% during the exploitation period. Taxes return ratio from the adaptation investments of the railway corridor and the regional logistics system (2015–2017) stands at 0.25; therefore, each euro invested in the improvement of Cofemanex generates a tax return of 25-euro cents, including in that calculation the direct and indirect taxes, and the social contributions of the jobs generated.
4. Discussion
These types of investment studies are usually carried out in the medium term (10–20 years). However, in this case, it has been decided to carry out a study of a first 3-year investment for the start-up of the high-performance rail freight corridor and a subsequent 5-year investment for its connection to the logistics nodes and supply electricity to the line, making investment more feasible for the administration.
The generated demand model allows to quantify, for any branch of activity contemplated in the Input-Output table of reference, two interesting economic phenomena:
- (a)
How this activity diffuses or transmits the variations of its own final demand throughout the economic system, that is, the sensitivity of production, income or employment of the economic system to the situation of the final demand of that activity.
- (b)
How this activity absorbs the variations of the final demand of other activities or of the whole economic system, that is, the sensitivity shown by the production, income or employment of the activity in the context of the final demand of other sectors of the economy.
However, since it is an estimative method, it also has some drawbacks:
- (a)
A wealth of very detailed statistical information is needed on the intersectoral relationships of the industries that make up the structure of a certain region or country. All this information is collected in the TIO. The great number of resources necessary to be able to elaborate the TIO implies, in practice, that they are made every certain year. Therefore, in case of using the table to analyze a year that does not correspond to the elaboration of that TIO, it is necessary to suppose that the technical coefficients have not changed in time.
- (b)
On the other hand, Barro [
40] criticizes the use of multipliers to justify the profitability of a public investment. De Rus [
41] recommends the use of Cost Benefit Analysis (CBA) to evaluate the impact of infrastructure investment. Boscá et al. [
42] consider that the multiplier of the Spanish economy stands at 1.05, well below the 2.12 obtained in this study. This could show that the effect of investments in less developed regions produces a higher impact than in more developed regions.
In any case, the long tradition of studies based on input-output tables, their disaggregated nature, and availability, advise the use of this procedure for this research.
5. Conclusions and Future Research
This research analyzes the effects of the investment made to upgrade the conventional railway line Cofemanex in a high-performance rail freight line of a sparsely populated region such as Extremadura (Spain). The results obtained show the profitability of this investment since each euro that is invested in Cofemanex, returns in more than 2 euros in the production system of Extremadura. In addition, in a region such as Extremadura that suffers a high rate of unemployment (29.23%, [
22]), it is very necessary to create more than 4100 jobs that are expected in the construction and commissioning of the freight corridor. In the first 5 years of operation of the corridor, the forecasts for job creation are also high, exceeding 1300 jobs/year. The simulated fiscal return also yields positive data since it is expected that in the construction phase of Cofemanex, 25 cents will be collected for each euro invested.
Finally, it is necessary to emphasize that the socioeconomic impact measured is limited to evaluating the consequences generated by the new infrastructure on the current economic structure. The growth of production, income and employment caused by the exploitation of the new business opportunities that the railway corridor will produce, have not been contemplated in the calculation. Nor is included in this quantification the evaluation of the effects derived from the increase of the productivity of the companies, thanks to the liberation of the time of journey in the displacements.
For future research will be interesting to evaluate the effects linked to the saving of external costs (energy, road accidents, emissions, etc.) as a result of the transfer of freight from the road to the railway in future scenarios. Furthermore, it would be of interest implementing a new cost-benefit analysis considering all the life stages of the railway line (not only 5 years), analyzing the positive and negative effects on populations, property values, land use and location of production activities.
The future of the freight transportation has lots of uncertainties, mainly due to two factors: vehicle automation and global pandemic. In terms of vehicle automation, the recent development of electric automated freight trucks is making truck-based freight transportation more and more appealing [
43]. In terms of the global pandemic, regional and global trade, along with passenger travel behavior, have been shaped greatly [
44,
45]. Future research should consider these factors and study their effects.
This research shows that conventional rail lines can be adapted to high-performance freight lines with small investments (compared to high-speed infrastructure), making them more profitable and advantageous to operate. It can be concluded that the effects of rail freight corridors in low-population regions are positive, profitable, sustainable and very necessary for regions such as Extremadura.
