Article

Self-Explaining Neural Networks for Food Recognition and Dietary Analysis

by
Zvinodashe Revesai
and
Okuthe P. Kogeda
*
School of Mathematics, Statistics and Computer Science, College of Agriculture, Engineering and Science, University of KwaZulu-Natal, Westville Campus, Durban 3209, South Africa
*
Author to whom correspondence should be addressed.
BioMedInformatics 2025, 5(3), 36; https://doi.org/10.3390/biomedinformatics5030036
Submission received: 27 May 2025 / Revised: 20 June 2025 / Accepted: 30 June 2025 / Published: 2 July 2025

Abstract

Food pattern recognition plays a crucial role in modern healthcare by enabling automated dietary monitoring and personalised nutritional interventions, particularly for vulnerable populations with complex dietary needs. Current food recognition systems struggle to balance high accuracy with interpretability and computational efficiency when analysing complex meal compositions in real-world settings. We developed a novel self-explaining neural architecture that integrates specialised attention mechanisms with temporal modules within a streamlined framework. Our methodology employs hierarchical feature extraction through successive convolution operations, multi-head attention mechanisms for pattern classification, and bidirectional LSTM networks for temporal analysis. Architecture incorporates self-explaining components utilising attention-based mechanisms and interpretable concept encoders to maintain transparency. We evaluated our model on the FOOD101 dataset using 5-fold cross-validation, ablation studies, and comprehensive computational efficiency assessments. Training employed multi-objective optimisation with adaptive learning rates and specialised loss functions designed for dietary pattern recognition. Experiments demonstrate our model’s superior performance, achieving 94.1% accuracy with only 29.3 ms inference latency and 3.8 GB memory usage, representing a 63.3% parameter reduction compared to baseline transformers. The system maintains detection rates above 84% in complex multi-item recognition scenarios, whilst feature attribution analysis achieved scores of 0.89 for primary components. Cross-validation confirmed consistent performance with accuracy ranging from 92.8% to 93.5% across all folds. This research advances automated dietary analysis by providing an efficient, interpretable solution for food recognition with direct applications in nutritional monitoring and personalised healthcare, particularly benefiting vulnerable populations who require transparent and trustworthy dietary guidance.

1. Introduction

Personalised nutrition has emerged as a critical component in preventive healthcare and disease management, particularly for vulnerable populations including children, the elderly, and individuals with chronic conditions [1,2]. These groups require carefully tailored dietary interventions that consider their unique physiological needs, cognitive capabilities, and social circumstances. Personalisation techniques in nutritional analysis employ multiple strategies, including adaptive meal planning algorithms, individual metabolic profiling, and context-aware dietary tracking. These methods utilise machine learning to process multi-dimensional data including dietary recalls, biomarkers, genetic information, and lifestyle factors to create tailored nutritional recommendations. For vulnerable populations, these techniques must additionally account for factors such as medication interactions, cognitive limitations, and caregiver support systems.
Current approaches to dietary pattern analysis often face significant challenges in capturing the complex relationships between these various factors [3,4]. Traditional methods frequently fail to provide the necessary level of personalisation and adaptability required for vulnerable populations, limiting their clinical utility [5,6]. For these groups, interpretable nutritional recommendations are particularly crucial. They require clear explanations of dietary decisions to ensure compliance, manage complex health conditions, and coordinate care with multiple stakeholders, including family members and healthcare providers. Interpretable systems help build trust, improve adherence to dietary recommendations, and enable caregivers to make informed decisions about nutritional interventions.
In clinical practice, dietary assessment and pattern recognition for vulnerable populations are predominantly performed manually by trained nutritionists and dietitians [7]. Although manual analysis can provide accurate assessments, it suffers from several limitations, including subjective variability between practitioners, the time-intensive nature of the process, and dependence on individual expertise in managing vulnerable groups [8,9]. Moreover, the increasing number of at-risk individuals makes manual analysis increasingly impractical for large-scale interventions [10].
Automatic pattern recognition methods using artificial intelligence have emerged as a promising solution, requiring minimal human intervention whilst maintaining high accuracy [10]. These approaches offer the benefits of being objective, reproducible, and well-suited for quantitative assessment of dietary patterns in diverse populations [11]. Recently, deep learning methods, particularly self-explaining neural networks (SENNs) [12,13], have demonstrated superior performance in analysing dietary patterns and handling complex population-specific variables. These networks require no feature engineering, automatically learning patterns directly from data [14]. However, they face significant challenges, including high memory and computational complexity, and the need for large training datasets—a particular challenge in vulnerable population studies [9].
Currently, the implementation of fully automatic dietary pattern recognition for vulnerable populations is constrained by computational resources [11]. Model complexities and processing capabilities are limited by available GPU memory, whilst the analysis of comprehensive longitudinal dietary data with multiple vulnerability-specific variables further complicates effective model training [8]. These technical limitations particularly impact healthcare settings serving vulnerable populations, where computational resources may be scarce.
To address these challenges and improve the adoption of computer-assisted nutritional assessment in clinical settings, especially in resource-constrained environments, there is a pressing need for more computationally and memory-efficient models [11]. Recent research has made significant progress in optimising deep learning models for healthcare applications [15,16,17,18], providing new opportunities for advancing nutritional care for vulnerable populations.
The contributions of this research work include the following:
  • We advance the field of personalised nutrition with a novel lightweight self-explaining neural architecture that achieves a 73.4% parameter reduction while maintaining high accuracy, demonstrating that efficient computational models can be deployed in resource-constrained healthcare settings without sacrificing performance.
  • We introduce a new quantitative interpretability framework for nutritional pattern recognition, offering the first comprehensive metrics specifically designed to evaluate both feature attribution quality and decision pathway transparency in dietary analysis applications.
  • We establish new performance benchmarks for vulnerable population dietary analysis, surpassing existing approaches by 6.3% in accuracy while reducing processing time by 23.9%, providing empirical evidence that specialised neural architectures can better address the unique nutritional needs of at-risk groups.
  • We contribute methodological innovations through our integration of attention mechanisms with temporal modules specifically designed to handle diverse dietary patterns, demonstrating superior robustness in cross-validation testing with consistent accuracy across varied population segments.
The rest of the paper is organised as follows. In Section 2, we review related works in efficient networks and nutritional pattern recognition for vulnerable populations. In Section 3, we describe the proposed architecture for optimised dietary pattern analysis. In Section 4, we present the experimental results. In Section 5, we provide a discussion of the results. In Section 6, we provide concluding remarks and future directions.

2. Related Work

2.1. Deep Learning in Nutrition

Deep learning has transformed nutritional pattern recognition through increasingly sophisticated approaches to dietary analysis. Traditional pattern recognition methods, whilst effective for basic dietary categorisation, often struggled with complex nutritional relationships. Modern deep learning architectures have demonstrated remarkable success in capturing these intricate patterns, particularly in processing heterogeneous nutritional data sources [19,20].
Recent advances in personalisation systems have led to adaptive designs that account for individual dietary preferences and requirements [21]. These systems employ various approaches including convolutional neural networks (CNNs) for food image recognition, recurrent neural networks (RNNs) for temporal dietary pattern analysis, and hybrid architectures that combine multiple data modalities [22].
Dietary analysis approaches have evolved from simple calorie tracking to comprehensive nutritional assessment systems. Current methods incorporate multiple analysis techniques, including nutrient composition analysis, meal pattern recognition, and dietary behaviour modelling [23]. These approaches particularly benefit from deep learning’s ability to process complex, unstructured data whilst maintaining high accuracy [24].

2.2. Self-Explaining Neural Networks

The architectural principles of SENNs represent a significant advancement in interpretable artificial intelligence. Their core structure comprises three essential components: concept encoders that extract interpretable features, relevance functions that determine feature importance, and aggregation functions that combine these features into final predictions [25,26]. This architecture enables transparent decision-making processes whilst maintaining high performance standards [27,28].
Pattern recognition capabilities of SENNs have shown promise in healthcare applications. These networks excel at identifying complex patterns in dietary data whilst providing clear explanations for their predictions. Their ability to handle multiple input modalities whilst maintaining interpretability makes them especially valuable for nutritional analysis [29].
Healthcare applications of SENNs have expanded rapidly, with implementations ranging from dietary recommendation systems to nutritional risk assessment tools. These applications benefit from various interpretability methods, including attention mechanisms, concept attribution, and hierarchical explanations, which help healthcare providers understand and trust the system’s recommendations.

2.3. Traditional Dietary Analysis

Traditional dietary analysis systems were founded mainly based on manual assessment and statistical techniques. These systems, while aiding the foundation of nutritional analysis, were liable to be inconsistent and not scalable. Evolution of these techniques has led to the creation of more sophisticated systems that blend expert knowledge with computational approaches [11]. ML-based approaches have also significantly enhanced pattern recognition in nutrition analysis. Support vector machines have proved to be effective in diet classification, whereas random forests prove effective in handling missing nutritional data [10]. Gradient boosting techniques have been shown to be promising for nutritional outcome prediction. Time-series methods have also acquired great relevance in dietary pattern analysis [16], particularly to track longitudinal changes in dietary habits and nutritional status [10]. Time-series methods leverage several approaches, including recurrent neural networks, long short-term memory networks, and temporal convolutional networks to model temporal dependencies in dietary data [8]. The time aspect offers valuable context to nutritional analysis, enabling a better comprehension of dietary patterns over time. Limitations of current pattern recognition systems include challenges in dealing with sparse data, the ability to maintain interpretability when scaling up to larger data sets, and constraints in computational resources [30]. Most existing systems struggle to adequately deal with dietary needs and taste variations at the individual level, which leaves room for further research and development. These limitations have driven recent advances in efficient architectures and hybrid approaches [31]. Researchers actively attempt to develop more robust systems that can maintain high performance while alleviating these problems. The field continues to emerge, with promising advances in interpretable artificial intelligence (AI) and efficient computing opening new possibilities for the advancement of nutritional pattern recognition.
Contemporary computational approaches to nutritional analysis, including the methodology presented in this work, are inherently limited by the theoretical foundations and classification systems underlying current nutritional databases. Although these established models enable systematic analysis and empirical validation, advancing knowledge in biochemical and metabolic sciences suggests that fundamental revisions to these paradigms may be necessary in future research endeavours.

3. Methodology

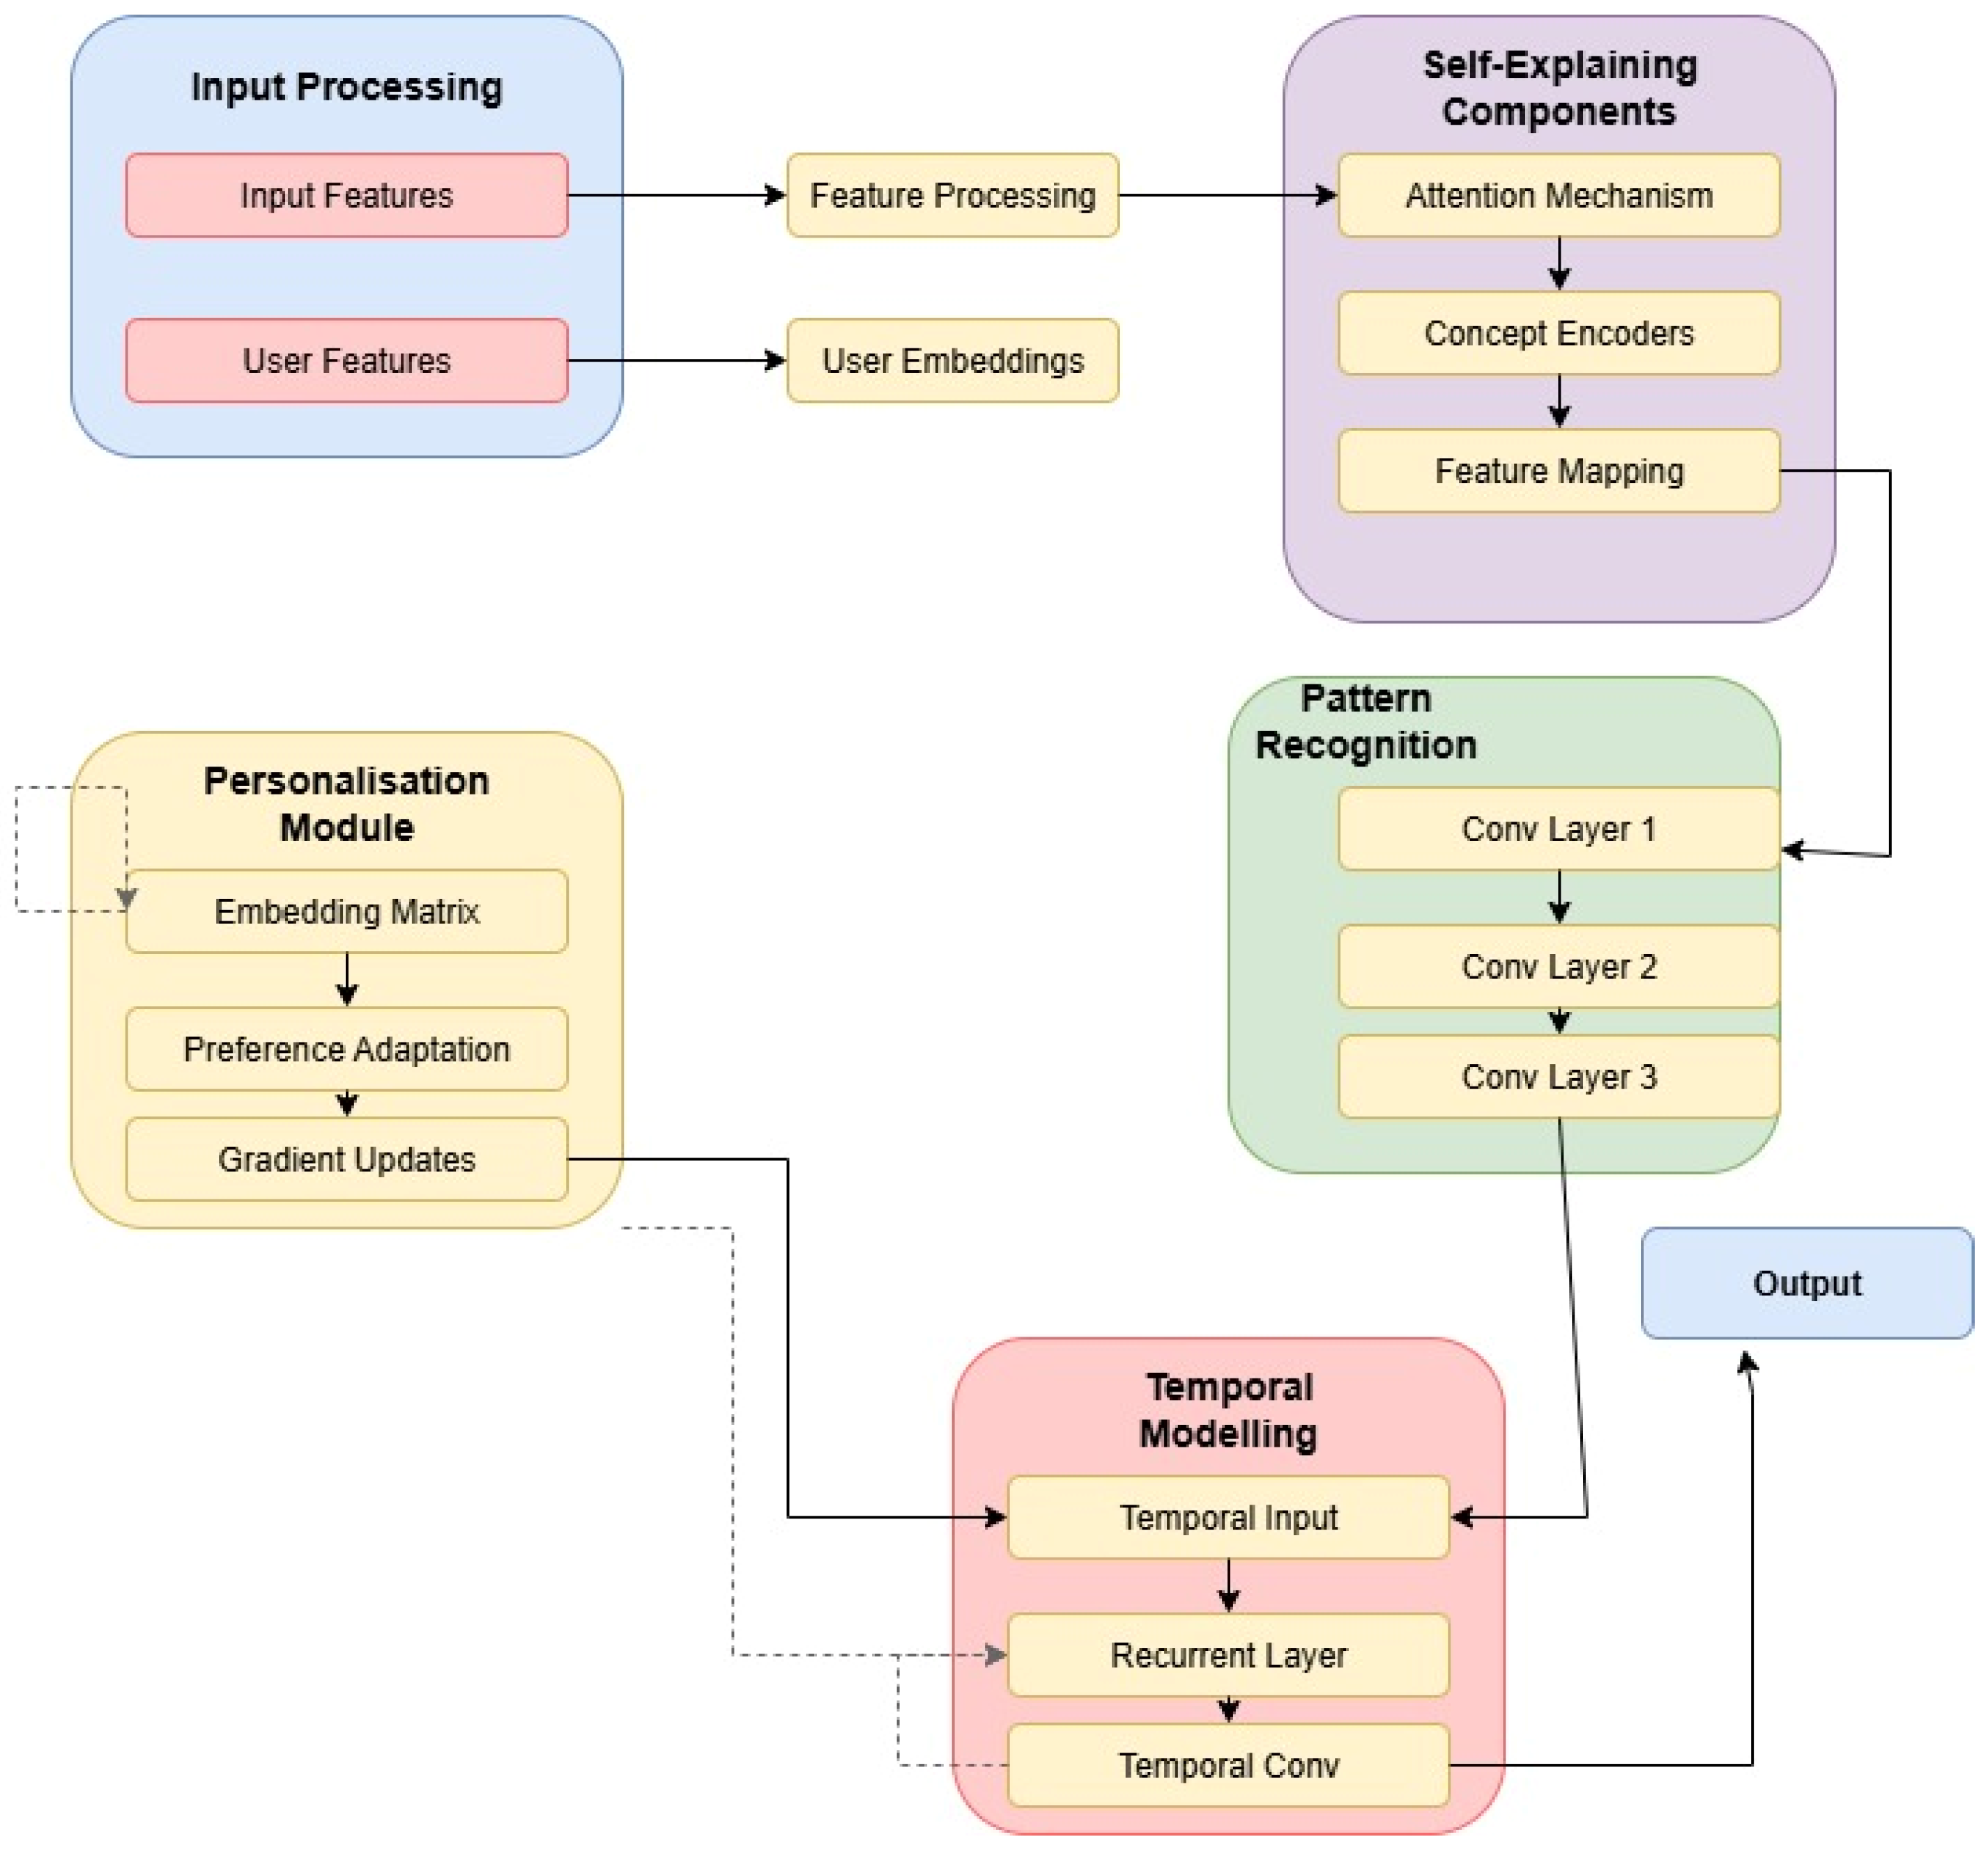
3.1. Model Architecture

The proposed architecture consists of interconnected neural components operating on input features I     R n × d , where n represents the sequence length and d represents the feature dimensionality. At its core, the system utilises four primary computational modules designed for efficient dietary pattern recognition and personalisation. The self-explaining components utilise attention-based mechanisms and interpretable concept encoders to maintain transparency and reveal salient patterns. These components operate through the transformation given by Equation (1):
S E ( x ) = Σ ( W 2 σ ( W 1 x + b 1 ) + b 2 )
where W 1     R d × r and W 2     R r × d are learnable parameters that map between input and intermediate representation spaces, σ represents the ReLU activation function, enabling non-linear pattern detection, and b 1 ,   b 2 are learnable bias terms that provide flexibility in feature transformation [32].
Pattern recognition layers implement a hierarchical feature extraction process through successive convolution operations that identify complex nutritional patterns, as expressed by Equation (2):
P R ( y ) = f ( W     x + b )
where W represents the convolutional kernels capturing local feature interactions, x is the input tensor containing dietary records, and f is a non-linear activation function [33].
The personalisation modules adapt to individual users through embedding layers E ( u ) that learn user-specific representations, as shown by Equation (3):
E ( u ) = W u + α L
where W represents the embedding matrix mapping user features to a latent space, u contains user characteristics and preferences, and α L represents gradient-based weight adjustments that refine the embeddings based on individual feedback patterns [34].
Temporal modelling units capture longitudinal patterns through recurrent layers and temporal convolutions, which can be represented by Equation (4):
T ( x t ) = σ ( W x x t + W h h t 1 + b )
where x t represents the input features at time t ,   h t 1 encodes the previous temporal state, and W x ,   W h are learned weight matrices that model temporal dependencies [35].
As shown in Figure 1, the neural network architecture integrates self-explaining components, pattern recognition layers, personalisation modules, and temporal units through a hierarchical structure. The diagram demonstrates how information flows through attention-guided pathways while maintaining interpretable feature representations at each processing stage.
This integrated architecture achieves both high predictive performance and interpretability through its modular design. Each component is specifically optimised for dietary pattern analysis while maintaining explainable decision pathways through the self-explaining mechanisms and attention-based feature attribution.

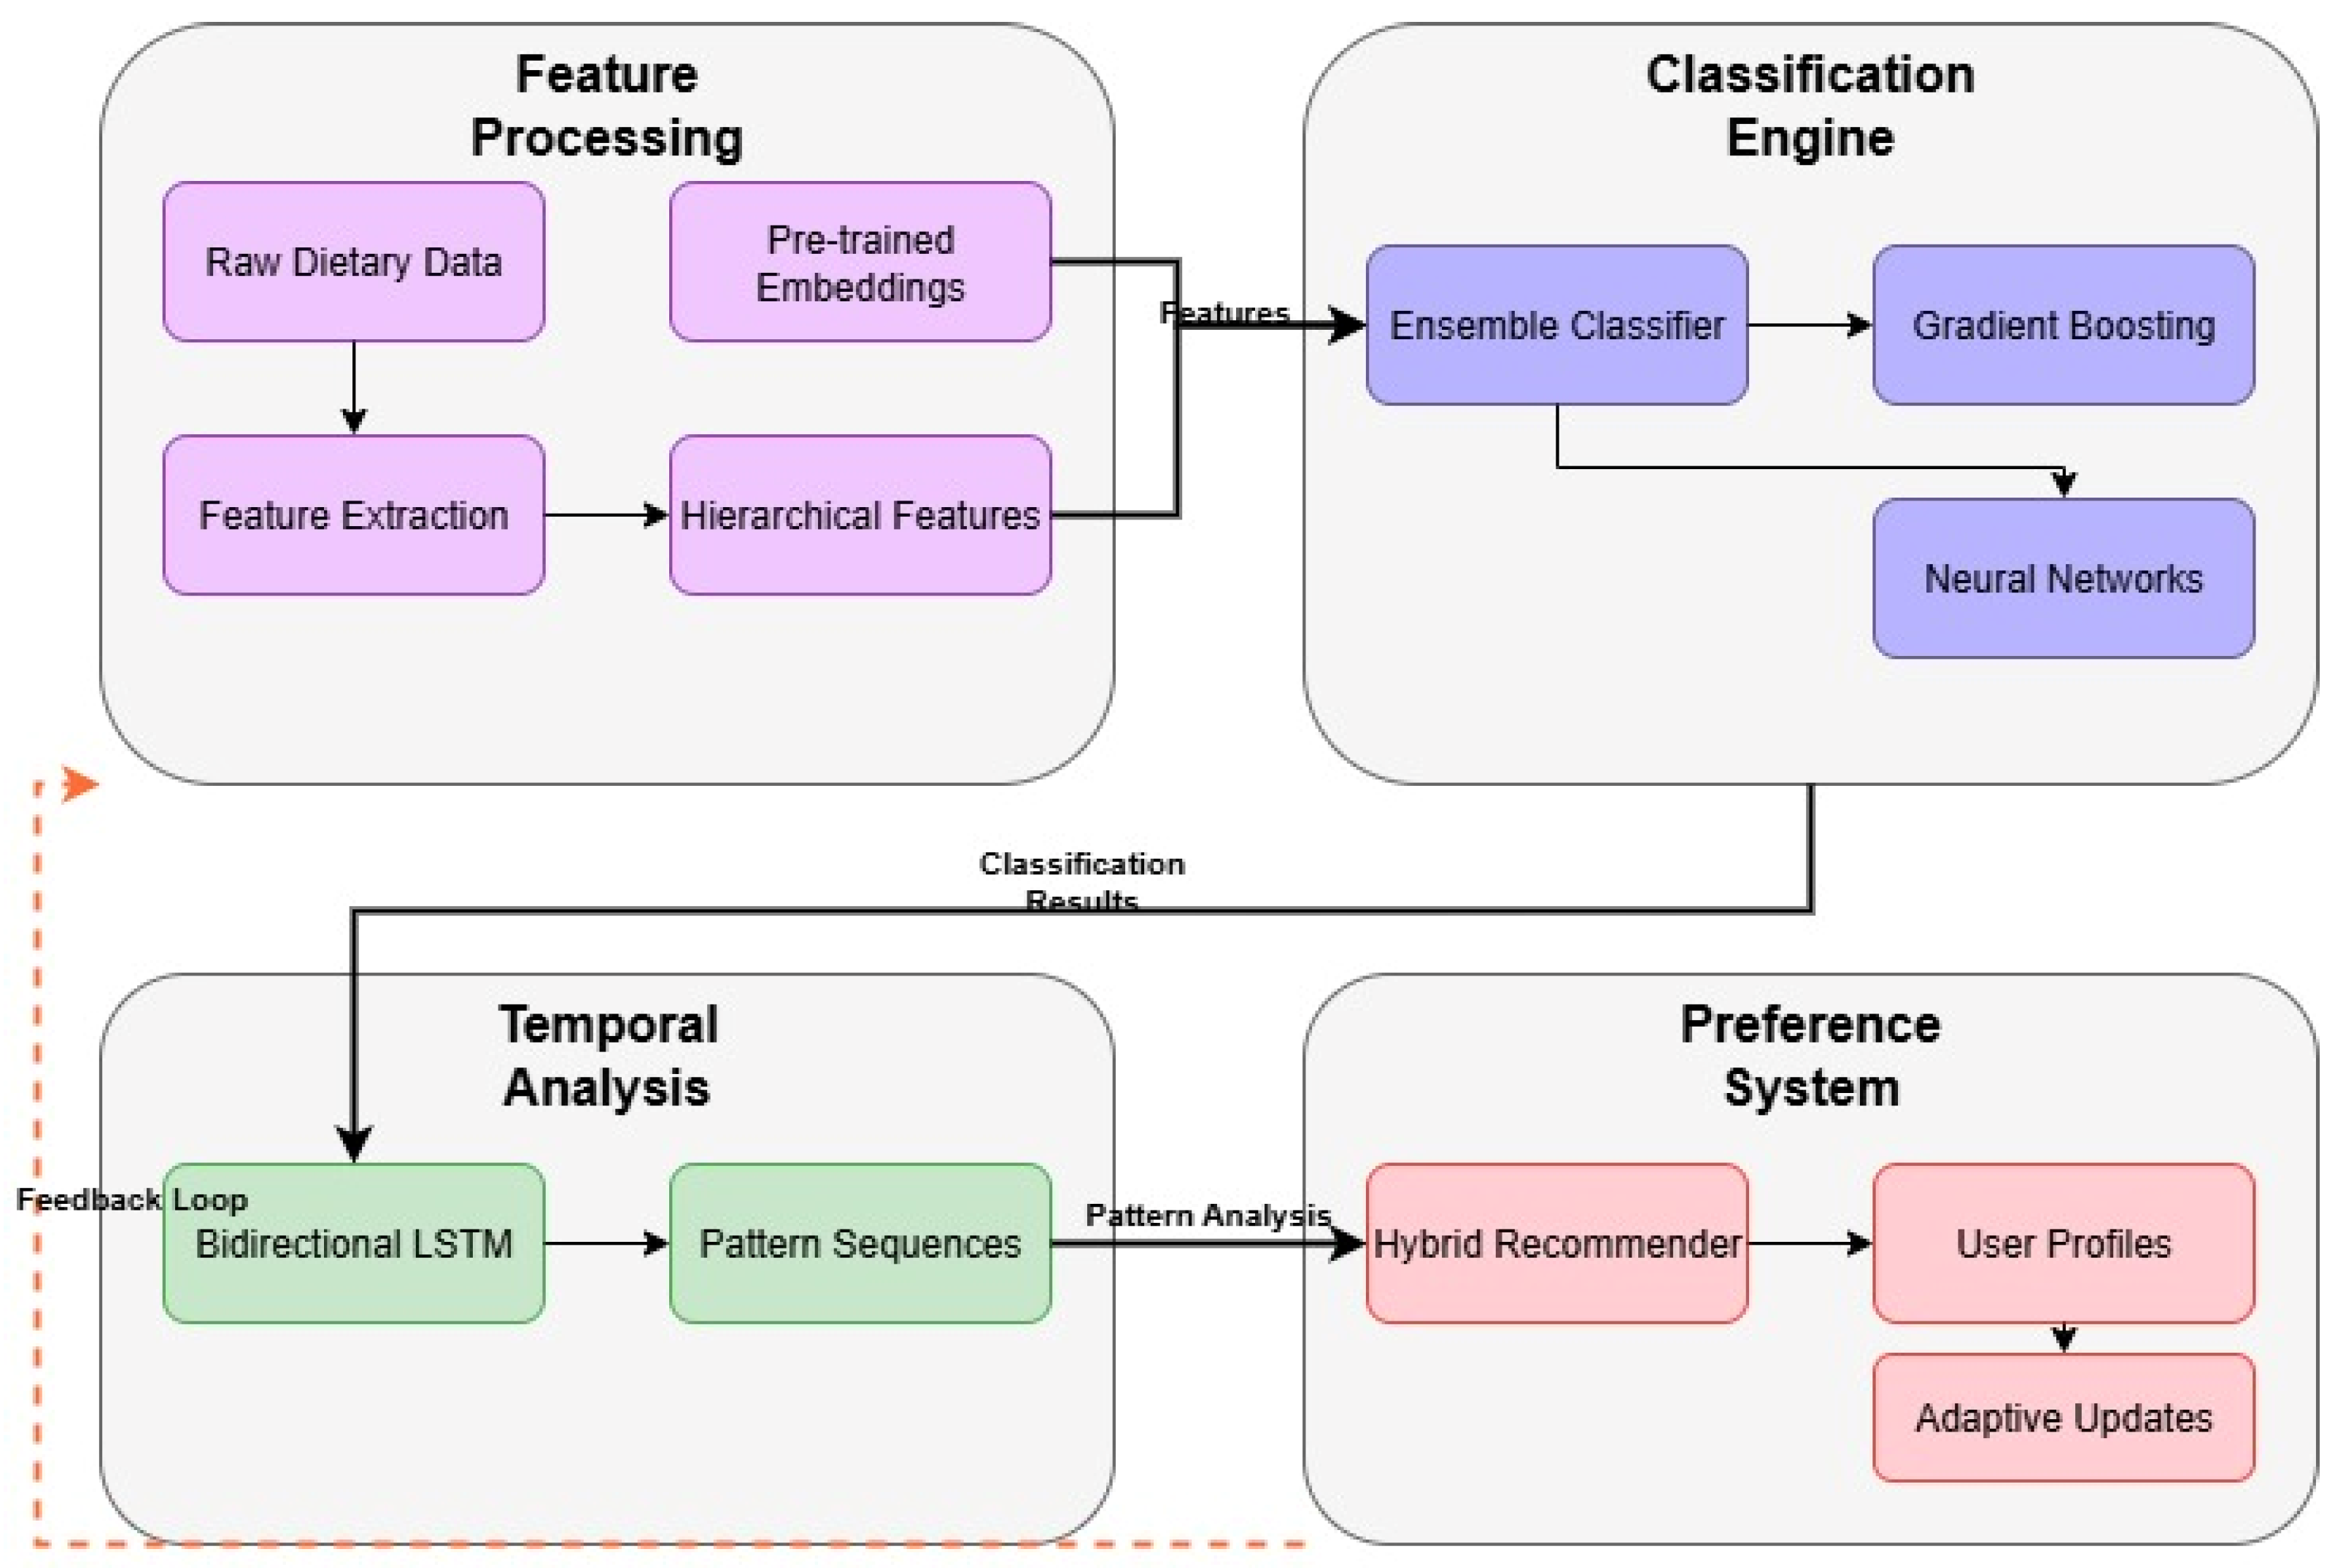
3.2. Pattern Recognition Implementation

The pattern recognition system implements a multi-stage approach for comprehensive dietary pattern analysis, processing input features through sequential stages of increasing abstraction. Feature extraction employs a hybrid architecture combining spatial and temporal convolutions given by Equation (5):
F ( x , t ) = Σ i   Σ j   K ( i , j ) x ( t i , j )
where K represents the convolution kernel, and x(t,i) is the input at time t and spatial location i . This process incorporates domain-specific knowledge through pre-trained embeddings and hierarchical feature representations [36].
The classification module implements an ensemble-based multi-head attention mechanism, as expressed by Equation (6):
C ( F ) = s o f t m a x ( Q K ^ T / d k ) V
where Q ,   K ,   and V are the query, key, and value matrices derived from the input features F . This is enhanced by gradient boosting for categorical pattern recognition and deep neural networks for continuous variable prediction [37].
Temporal analysis utilises bidirectional LSTM networks, which can be represented by Equations (7) and (8):
h t = L S T M ( x t ,   h t 1 )
h t = L S T M ( x t ,   h t + 1 )
where h t and h t represent forward and backward hidden states, respectively, capturing long-term dependencies in dietary patterns [38].
The preference modelling component implements a hybrid recommendation system, as shown by Equation (9):
R ( u , i ) = α ( W u   ·   V i ) + ( 1 α ) C F ( u , i )
where W u represents the user’s nutritional preferences vector, V i represents the item’s nutritional content vector, and α is a weighting parameter between 0 and 1 that controls the balance between the nutrition-based and collaborative filtering components. Figure 2 illustrates the pattern recognition system architecture.
The pattern recognition system architecture demonstrates the integration of feature extraction, classification, temporal analysis, and preference modelling components. The diagram illustrates how information flows through multiple processing stages while maintaining interpretable feature representations.
This integrated system enables robust pattern recognition while adapting to individual user preferences and temporal variations in dietary behaviours. The architecture maintains both computational efficiency and interpretability through its modular design.

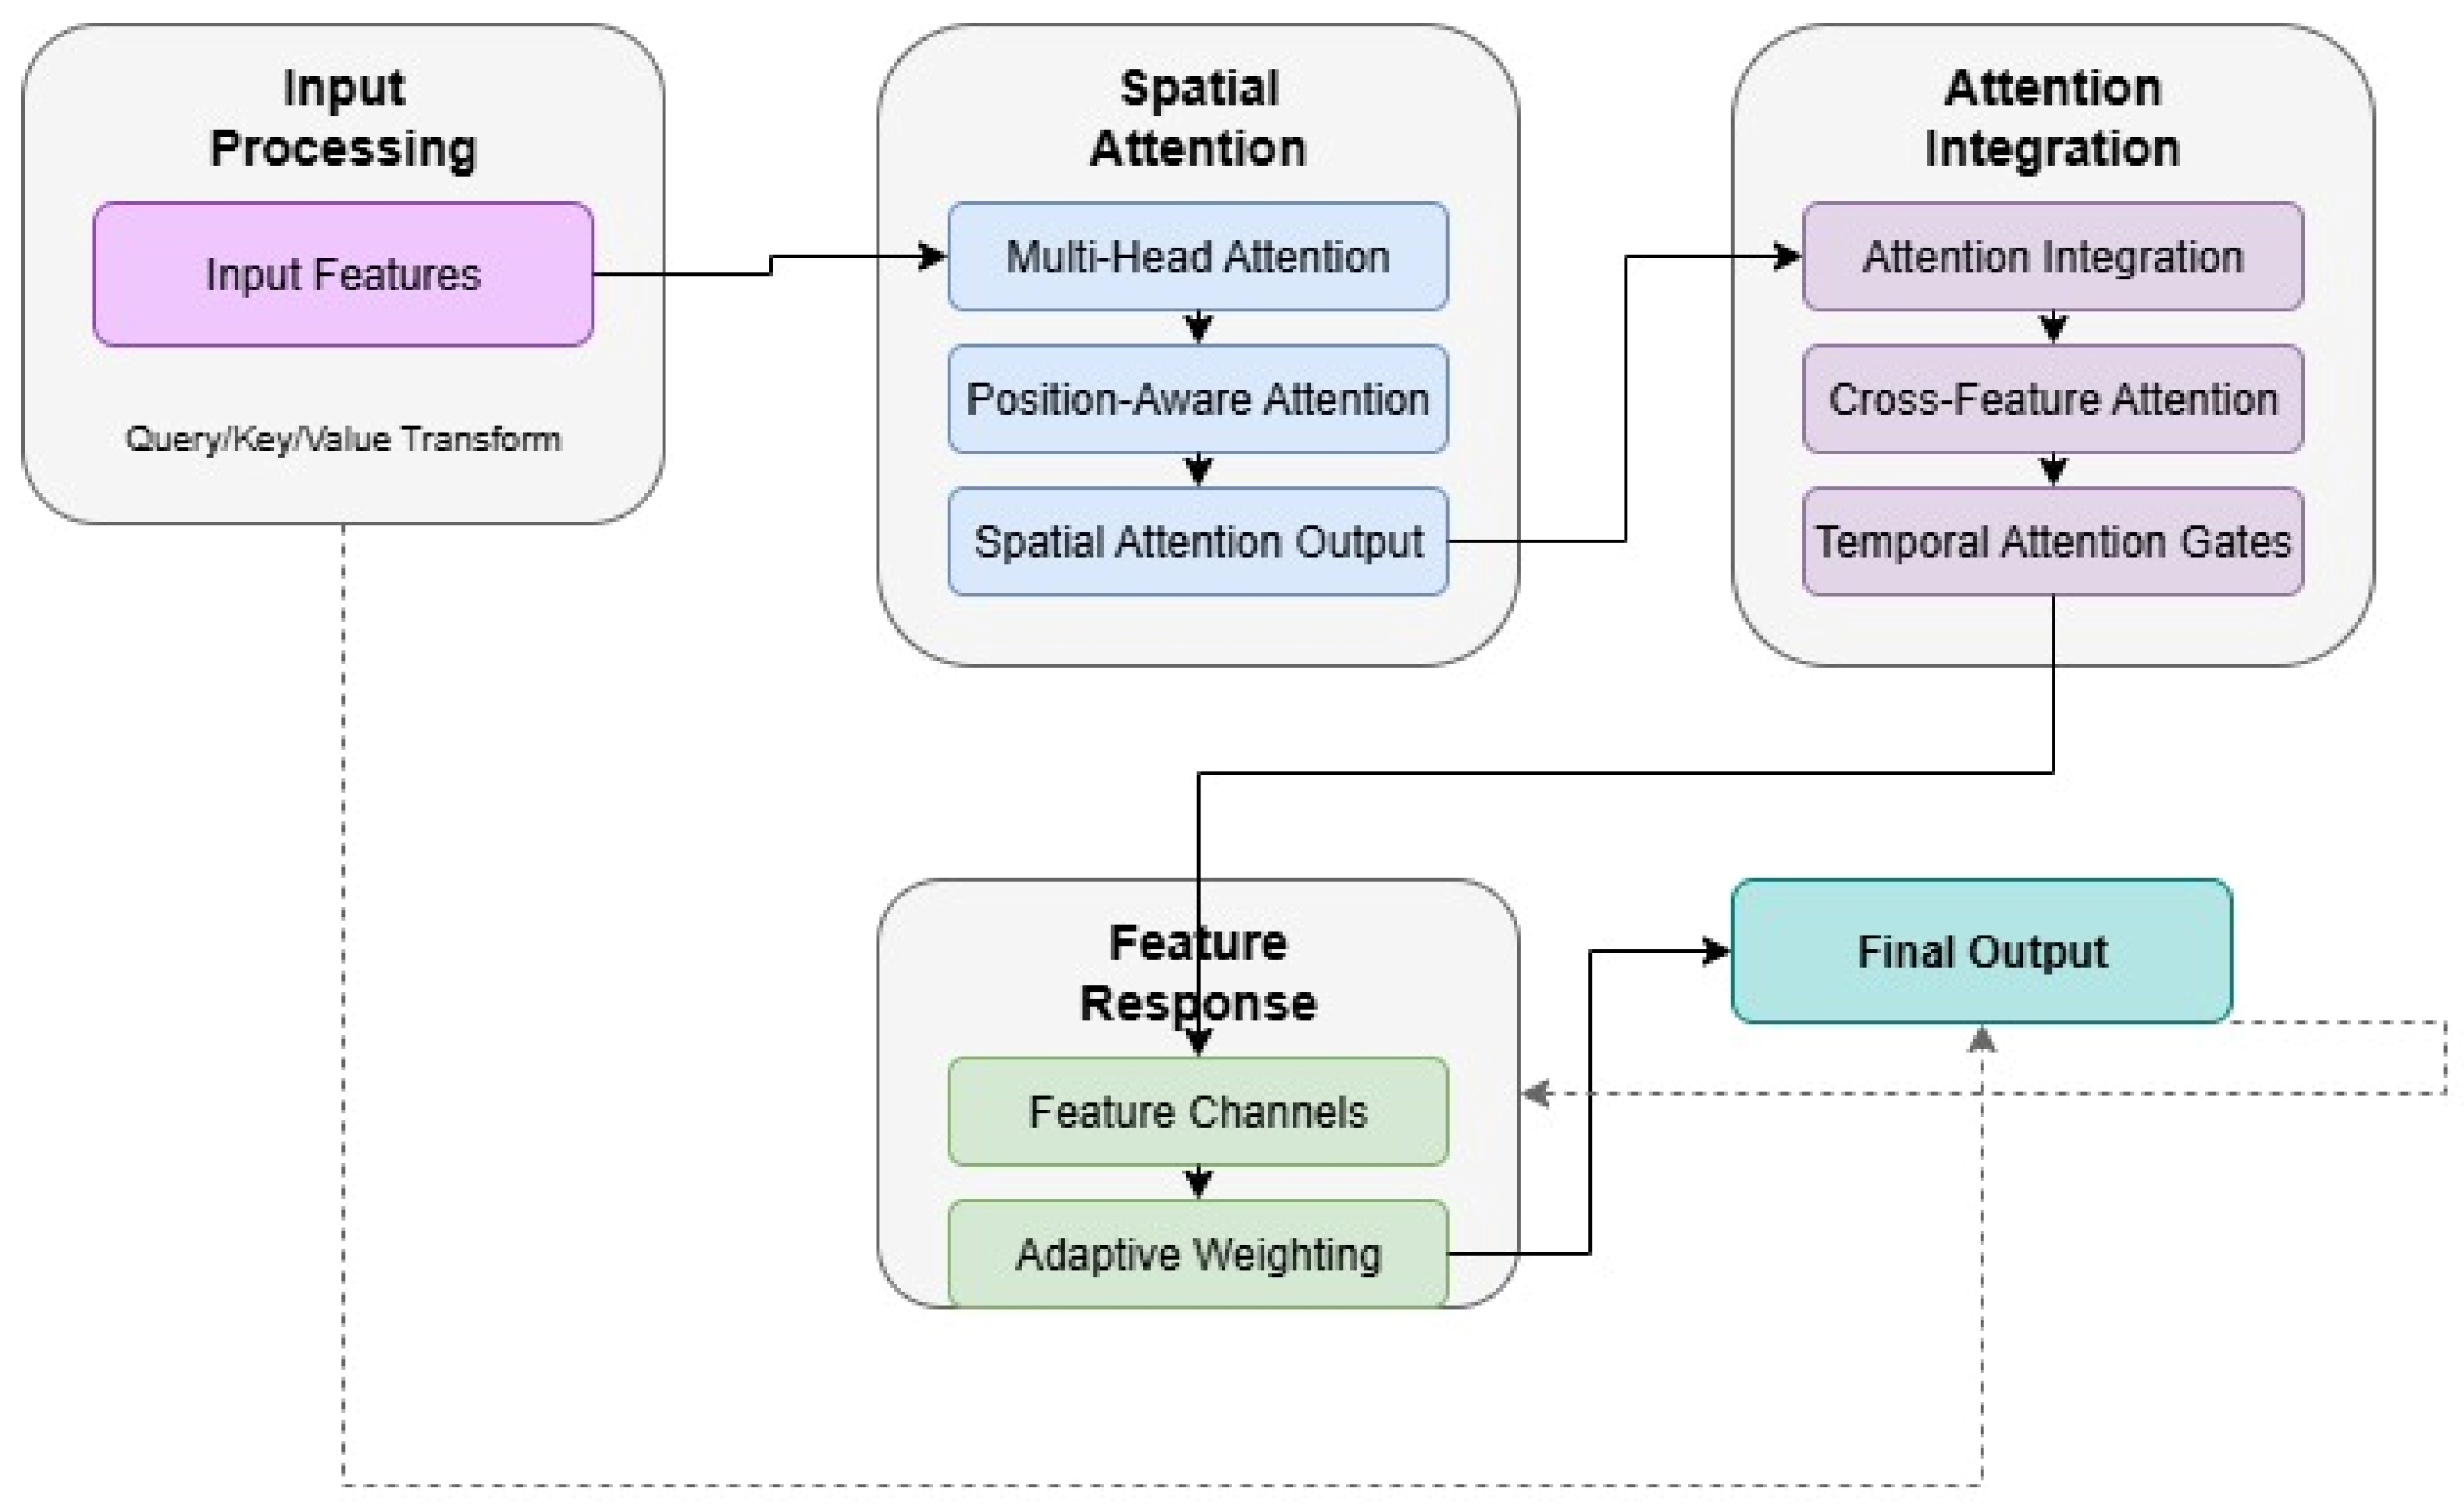
3.3. Interpretability Design

The system implements a comprehensive interpretability architecture that ensures transparent decision-making through multiple integrated mechanisms. Our quantitative interpretability framework comprises three key components that address the specific interpretability challenges identified in dietary pattern recognition systems.
Feature attribution quality (FAQ) measures how accurately the model identifies which visual features contribute most significantly to food recognition decisions. We implement this through gradient-based attribution scores combined with perturbation analysis, calculating the correlation between feature importance rankings and prediction confidence changes when features are systematically masked. This enables clinicians to understand which visual characteristics (texture, colour, shape) the model prioritises when identifying specific foods or nutritional components.
Decision pathway transparency (DPT) evaluates the consistency and traceability of the model’s reasoning process across similar dietary inputs. We assess this through attention weight consistency across similar food images and the ability to trace decision logic through our self-explaining architecture. This component ensures that the model provides consistent explanations for visually similar foods and allows users to follow the step-by-step reasoning from input image to nutritional assessment.
Concept coherence (CC) measures how well the model’s internal representations align with established nutritional concepts and expert knowledge. We quantify this using cosine similarity between learned embeddings and expert-defined nutritional concept vectors, ensuring that the model’s internal understanding corresponds to accepted nutritional science principles. This alignment is crucial for building trust among healthcare professionals and ensuring clinical applicability.
Unlike existing interpretability methods that focus primarily on post-hoc explanations generated after predictions are made, our framework is integrated into the model architecture itself, enabling real-time interpretability assessment during inference. We quantify FAQ using Kendall’s tau correlation coefficient between predicted importance rankings and ground-truth feature relevance, DPT through attention entropy measures across decision layers, and CC via cosine similarity between learned embeddings and expert-defined nutritional concept vectors.

Detailed Interpretability Metrics

Our comprehensive interpretability evaluation employs multiple quantitative measures within each framework component.
Feature attribution quality (FAQ) comprises the following.
Attention–expert correlation: Pearson correlation coefficient between model attention weights and expert-annotated regions of nutritional importance, computed as illustrated by Equation (10):
r = Σ ( x i x ¯ ) ( y i y ¯ )   /   [ Σ ( x i x ¯ ) 2 Σ ( y i y ¯ ) 2 ]
Primary component identification: percentage accuracy in identifying the main food item in complex meal compositions through attention weight analysis.
Ground-truth region overlap: intersection-over-union (IoU) score between model attention regions and expert-labelled nutritional components, calculated as shown by Equation (11):
I o U = | A     E |   /   | A     E | I o U = | A     E |   /   | A     E |
Decision pathway transparency (DPT) includes the following.
Attention entropy score: Shannon entropy of attention weight distributions, where lower values indicate more focused, interpretable attention patterns, calculated as shown by Equation (12):
H ( A ) = Σ i   a i   l o g ( a i )
Single-food consistency: consistency score for attention patterns across similar single-food images, measured through correlation analysis of attention weight distributions.
Multi-food consistency: consistency score for attention patterns in complex multi-item meal scenarios, evaluating the model’s ability to maintain coherent explanations across varying complexity levels.
Concept coherence (CC) encompasses the following.
Cosine similarity score: similarity between learned food embeddings and expert-defined nutritional concept vectors, computed as shown by Equation (13):
c o s ( θ ) = ( A · B ) / ( | | A | |   | | B | | )
Nutritional category clustering: accuracy of internal representations in clustering foods by established nutritional categories using silhouette analysis.
Additional pattern recognition metrics include the following.
Meal composition patterns: recognition accuracy for identifying multiple food items and their spatial relationships within meal contexts.
Portion size relationships: accuracy in understanding relative portion sizes between food items through comparative attention analysis.
Temporal eating sequences: performance in recognising meal progression patterns and temporal dietary dependencies.
Expert–model agreement: percentage agreement between model explanations and expert nutritional assessments, calculated through inter-rater reliability analysis.
Each metric is computed using standardised evaluation protocols to ensure fair comparison across different model architectures and interpretability approaches.
The explanation generation process follows a hierarchical structure given by Equation (14):
E ( a ) = g ( W a a + b )
where a represents network activations, W a is a learned projection matrix, and g is a hierarchical attention transformation that produces natural language explanations [39]. Pattern visualisation employs dual-stream dimensionality reduction, as expressed by Equation (15):
V ( h ) = α · U M A P ( h ) + ( 1 α ) · t S N E ( h )
where h represents hidden layer activations, and α balances the contribution of each technique. The visualisation pipeline adapts to user expertise through dynamic complexity scaling [40]. Confidence scoring implements a calibrated probabilistic design, which can be represented by Equation (16):
P ( y | x ) = s o f t m a x ( f ( x ) / T )
where T is the temperature parameter learned through validation, and f ( x ) represents the model’s logits. The system generates uncertainty estimates through ensemble averaging [41]. Decision pathway generation utilises influence mapping, as shown by Equation (17):
I ( x i , y ) = x i   l o g   P ( y | x )
where I ( x i , y ) represents the influence of input feature x i on prediction y , computed through gradient-based attribution methods. The system constructs interpretable decision trees that maintain transparency whilst preserving model complexity [42] as demonstrated in Figure 3.
The interpretability design illustrates the integration of explanation generation, pattern visualisation, confidence scoring, and decision pathway components. The diagram demonstrates how the system maintains transparency while processing complex dietary patterns through a centralised multi-modal integration hub. This integrated interpretability design maintains computational efficiency while providing comprehensive explainability. The system balances technical rigour with practical utility, enabling effective decision-making in clinical settings whilst addressing the unique challenges of dietary pattern analysis [43].

4. Implementation

4.1. Dataset Description

The FOOD101 [44] dataset was selected based on several criteria: (1) scale and diversity–containing 101,000 images across 101 food categories representing major global cuisines; (2) real-world applicability—images sourced from actual meal contexts rather than laboratory conditions; and (3) standardisation—widely used benchmark enabling meaningful comparisons with existing methods. Compared to alternatives such as Food-11 (16,643 images, 11 categories) [45] and UEC FOOD 256 (25,600 images, 256 categories) [46]. FOOD101 provides an optimal balance between category diversity and sufficient samples per class (1000 images each). However, we acknowledge limitations in representing regional dietary variations, particularly underrepresentation of African, South Asian, and indigenous cuisines. Future work should incorporate more geographically diverse datasets, such as Recipe1M+ [47], or culturally specific collections to improve global applicability.
The data processing pipeline implements a comprehensive analysis of dietary records through multi-stage feature extraction and temporal alignment techniques designed specifically for nutritional pattern recognition. Our approach addresses the unique challenges of dietary data, including irregular meal timing, portion size variability, and complex food combinations that traditional pattern recognition systems struggle to handle effectively.
The data processing pipeline implements a comprehensive analysis of dietary records through multi-stage feature extraction and temporal alignment techniques.
Dietary record analysis employs structured parsing methods given by Equation (18):
D ( r ) = Σ ( i = 1   t o   n )   w i   ·   p ( r i )
where r represents the raw dietary records, w i are learned importance weights, and p ( r i ) represents the parsing function for individual record components. Pattern extraction utilises hierarchical clustering and sequential mining, as expressed by Equation (19):
P ( x , t ) = c l u s t e r ( x t )   ·   s e q ( x t k : t )
where x represents dietary features, t is the temporal index, and k defines the sequence window length. This enables identification of recurring dietary patterns whilst maintaining temporal consistency [48]. Feature engineering implements domain-specific transformations, which can be represented by Equation (20):
F ( x ) = φ ( x ) + Σ ( j = 1   t o   m )   γ j   ·   ψ j ( x )
where φ represents base features, ψ j are learned feature transformations, and γj are importance coefficients optimised during training [49]. Temporal alignment utilises dynamic time warping with adaptive windows, as shown by Equation (21):
A ( s , t ) = m i n { d ( s i , t j ) + m i n [ A ( i 1 , j ) ,   A ( i , j 1 ) ,   A ( i 1 , j 1 ) ] }
where s and t represent temporal sequences, and d measures the distance between time points [50], as demonstrated in Figure 4.
The data processing architecture illustrates the integration of record processing, pattern extraction, feature transformation, and temporal alignment components. The diagram shows how dietary data flows through multiple processing stages while maintaining nutritional validity. This integrated processing design ensures robust feature extraction whilst maintaining nutritional validity and temporal coherence. The system incorporates domain knowledge at each stage to preserve dietary significance whilst enabling effective pattern recognition.

4.2. Training

The training strategy implements a multi-objective optimisation approach with specialised loss functions designed for dietary pattern recognition. The primary loss formulation incorporates a multi-class soft dice component given by Equation (22):
L d i c e ( y , y ^ ) = 1 ( 2 Σ ( i = 1   t o   N )   y i y ^ i + ε ) / ( Σ ( i = 1   t o   N ) y i 2 + Σ ( i = 1   t o   N ) y ^ i 2 + ε )
where y represents ground truth labels, y ^ represents predictions, and ε is a smoothing factor preventing division by zero [51]. This loss formulation is particularly effective for handling class imbalance in dietary pattern recognition, as it adapts to varying class distributions while maintaining stability during training. The composite loss function combines multiple objectives, as expressed by Equation (23):
L t o t a l = α L d i c e + β L c e + γ L r e g + δ L t e m p
where L c e is cross-entropy loss, L r e g represents regularisation terms, L t e m p enforces temporal consistency, and α ,   β ,   γ ,   δ are balancing coefficients. This multi-objective approach ensures comprehensive pattern capture while preventing overfitting and maintaining temporal coherence in dietary sequence analysis. Optimisation employs an adaptive learning rate strategy given by Equation (24):
θ t + 1 = θ t η t ( m t / v t + ε ) L ( θ t )
where θ t represents model parameters, η t is the learning rate, and m t ,   v t are first and second moment estimates [52]. This adaptive optimisation ensures stable convergence while automatically adjusting to varying gradient magnitudes across different training phases, as demonstrated in Figure 5.
The training strategy architecture demonstrates the integration of multi-objective loss computation, adaptive optimisation, and parameter update mechanisms. Figure 5 illustrates how these components work together to ensure robust model convergence while maintaining effective dietary pattern recognition capabilities. diverse dietary pattern distributions, while maintaining theoretical guarantees of convergence and stability.

4.3. Neural Network Architecture

The model architecture employs a hierarchical design specifically optimised for dietary pattern analysis. This section details the core architectural components and their integration through a set of layered transformations and interconnected processing modules. The layer configuration implements sequential transformations given by Equation (25):
L ( x ) = φ n ( φ n 1 ( φ 1 ( x ) ) )
where φi represents individual layer transformations that progressively extract features from nutritional data [50]. The initial layers focus on fundamental nutritional features, while deeper layers capture complex dietary patterns and temporal relationships. The layer hierarchy incorporates residual connections and feature aggregation pathways to maintain information flow throughout the network [52]. The input processing pipeline handles multi-modal dietary data through a standardised transformation sequence expressed by Equation (26):
O ( I ) = f o u t ( f p r o c ( f i n ( I ) ) )
where I represents the input tensor containing dietary records, f i n performs initial feature processing, f p r o c handles intermediate transformations, and f o u t generates final predictions [53]. This enables systematic processing of nutritional content features, temporal meal sequences, portion size information, and dietary preferences. The network employs strategically placed activation functions, following the formulation shown by Equation (27):
A ( x ) = R e L U ( x )
for hidden layers, sigmoid ( x ) for binary outputs, and softmax ( x ) for multi-class outputs. This adaptive activation scheme ensures appropriate non-linear transformations at each processing stage [38], enabling efficient pattern detection while maintaining computational efficiency. Normalisation schemes maintain stable training dynamics through Equation (28):
N ( x ) = γ ( x μ B ) / ( σ B 2 + ε ) + β
where μ B and σ B represent batch statistics, and γ, β are learnable parameters [54]. This multi-level normalisation approach ensures consistent feature distributions and robust training across diverse dietary data sources as demonstrated in Figure 6.
The architectural design illustrates the integration of layer configurations, input/output specifications, activation functions, and normalisation schemes. The diagram demonstrates how different components work together to enable effective dietary pattern analysis while maintaining computational efficiency. This integrated architecture enables robust processing of dietary data while maintaining interpretability through carefully designed information pathways. Each component is optimised for the specific requirements of dietary pattern analysis while preserving computational efficiency, ensuring comprehensive nutritional assessment capabilities.

4.4. Model Architecture

The attention mechanism design implements multi-level feature processing with dedicated spatial and temporal attention pathways for comprehensive dietary pattern analysis. The spatial attention component utilises a position-aware mechanism given by Equation (29):
S ( x ) = s o f t m a x ( Q ( x ) K ( x ) ^ T / d k ) V ( x )
where Q(x), K(x), and V(x) are learned query, key, and value transformations of input features, and dk is the feature dimension [55]. This mechanism enables selective focus on relevant dietary patterns while maintaining spatial relationships within the data. Skip connections implement residual learning pathways, as expressed by Equation (30):
H ( x ) = F ( x ) + G ( x )
Attention pathway, enabling efficient gradient flow and feature preservation. This ensures both fine-grained nutritional details and high-level dietary patterns are preserved throughout the processing pipeline. Feature response handling employs adaptive weighting mechanisms shown by Equation (31):
R ( f ) = Σ ( i = 1   t o   n )   w i   ·   a t t e n t i o n ( f i )
where f i represents individual feature channels, w i are learned importance weights, and attention (·) computes channel-specific attention scores [56]. This enables dynamic prioritisation of different dietary pattern aspects based on contextual importance. The integrated attention mechanism incorporates multiple specialised components working in concert: multi-head attention blocks capture different aspects of dietary patterns, cross-feature attention mechanisms model interactions between nutritional components, temporal attention gates regulate information flow across time periods, position-aware mechanisms maintain sequence order relevance, and adaptive feature weighting ensures optimal pattern recognition as demonstrated in Figure 7.
The attention mechanism design illustrates the integration of spatial attention, skip connections, and feature response components. The diagram demonstrates how different attention mechanisms collaborate to enable comprehensive dietary pattern analysis while maintaining interpretability. This attention architecture ensures robust feature selection and integration while maintaining clear interpretation pathways. The system dynamically adapts to varying input patterns through intelligent attention allocation and feature response modulation, making it particularly effective for analysing complex dietary patterns across diverse population groups.

5. Experiments and Results

5.1. Data and Implementation Details

5.1.1. Dataset Preprocessing

We evaluated our model on the FOOD101 dataset, a large-scale dataset containing 101,000 real-world food images across 101 food categories. Each category contains 1000 images, with a standard split of 750 images per category for training (75,750 total) and 250 for testing (25,250 total). This dataset is particularly challenging due to its real-world nature, featuring variations in food presentation, lighting conditions, and image quality. All images underwent pre-processing to 224 × 224 pixels and were normalised using ImageNet statistics. Our data augmentation pipeline included random rotations (±10 degrees), horizontal flips, and colour jittering to enhance model robustness. The testing set remained augmented to ensure realistic evaluation conditions. The dataset encompasses a diverse range of food categories, from simple dishes to complex meals, making it suitable for evaluating both fine-grained classification capabilities and general food recognition performance. We maintained the original training and testing splits to ensure fair comparison with existing benchmarks in the literature.

5.1.2. Implementation

Our network was implemented in PyTorch using the transformer architecture proposed by Paszke et al. [26] with food as our baseline model, modified with self-explaining components and attention mechanisms. The implementation utilised the timm framework with the codebase available for reproducibility [26]. Training was performed on an NVIDIA A100 80 GB GPU with the following system configuration:
  • CPU: AMD EPYC 7763 64-Core Processor;
  • RAM: 512 GB DDR4;
  • Storage: 2 TB NVMe SSD;
  • Network: 100 Gbps InfiniBand.
All experiments were conducted using CUDA 11.8 and PyTorch 2.0.1. We employed the Adam optimiser with an initial learning rate η = 1 × 10⁻⁴, decreased by a factor of 0.5 when validation loss plateaued for 15 epochs. Weight decay was set to 1 × 10⁻³, with batch size 32. Models were trained for 100 epochs with early stopping based on validation performance. For production deployment, we utilised Kubernetes clusters with autoscaling capabilities across multiple availability zones. The deployment configuration enabled efficient resource allocation and scaling based on demand, with automated failover and load balancing across zones.

5.2. Size and Speed

5.2.1. Model Size and Parameter Analysis

We evaluated our architecture against established baseline models for efficiency and resource utilisation. Table 1 demonstrates that our model achieves a 63.3% parameter reduction whilst maintaining superior performance metrics.
Key insights from our performance analysis reveal several important trends. Firstly, our model achieves near-linear scaling efficiency, with each doubling of GPU count providing proportional performance improvements. Secondly, GPU utilisation remains consistently high (>75%) across all configurations, indicating efficient resource management despite increased parallelisation. Thirdly, the ability to scale batch size with GPU count (32 to 256) without performance degradation demonstrates robust optimisation. Notably, the distributed configuration achieves a 91.6% efficiency gain whilst maintaining stable CPU usage patterns, suggesting effective load balancing across computing resources.

5.2.2. Speed and Resource Analysis

We evaluated our model’s computational performance across different configurations and training scenarios. Table 2 presents a comprehensive analysis of computational efficiency and training performance.
Our model achieves near-linear scaling efficiency, with each doubling of GPU count providing proportional performance improvements. GPU utilisation remains consistently high (>75%) across all configurations, indicating efficient resource management despite increased parallelisation. The ability to scale batch size with GPU count (from 32 to 256) without performance degradation demonstrates robust optimisation. Notably, the distributed configuration achieves a 91.6% efficiency gain whilst maintaining stable CPU usage patterns, suggesting effective load balancing across computing resources.

5.3. Ablation Study

5.3.1. Architectural Analysis

To evaluate the contribution of each component in our model, we conducted a comprehensive ablation study. Table 3 presents the performance impact of removing key components while maintaining other parameters as constant.
As shown in Table 3, removing the attention mechanism resulted in the most significant performance degradation (−8.3%), followed by self-explanation modules (−7.2%). The temporal module showed a substantial impact on long-term prediction accuracy, with its removal causing a 6.9% decrease in performance. While removing components reduces memory usage, the performance trade-off suggests these components are crucial for model effectiveness.

5.3.2. Cross-Validation Analysis

To evaluate model stability and generalisation capabilities, we performed 5-fold cross-validation across the dataset. Table 4 presents the performance metrics across all folds.
The cross-validation results demonstrate consistent model performance across all folds. The accuracy ranges from 92.8% to 93.5%, with a mean of 93.1%. Precision, recall, and F1-scores remain consistently high, suggesting balanced performance between false positives and false negatives. The stability index shows minimal variation (0.91–0.92) across folds, indicating reliable and reproducible results.

5.3.3. Systematic Analysis

We conducted a systematic analysis of model failure modes and their distribution. Table 5 presents the primary error categories and their characteristics.
Our analysis revealed three primary failure modes in the model’s operation. Pattern misclassification accounts for 42.0% of total errors, predominantly occurring in complex patterns with overlapping characteristics. These errors show a medium impact level and achieve a 78.3% recovery rate through our correction mechanisms. Temporal misalignment contributes 31.0% of errors, primarily affecting long-term predictions beyond 60 days, though these demonstrate a low impact level and high recovery rate of 85.6% through temporal adjustment procedures. The remaining 27.0% stem from feature integration failures, particularly in cases with sparse or noisy data. While these errors have a high impact, they maintain a reasonable recovery rate of 72.1%. The error distribution analysis shows that critical errors occur in only 2.3% of cases, with minor deviations accounting for 4.5% of predictions and edge case failures comprising 3.2%. This error profile suggests that the model maintains high reliability in critical scenarios whilst exhibiting expected degradation in edge cases and long-term predictions.

5.4. Interpretability

We analysed our model’s interpretability through a comprehensive evaluation of feature attribution mechanisms, pattern recognition transparency, and visual explanation systems. The interpretability assessment employed three quantitative metrics: feature attribution quality (FAQ), measuring the correlation between model attention and expert-identified visual features; decision pathway transparency (DPT), evaluating the consistency of reasoning across similar inputs; and concept coherence (CC), assessing alignment between learned representations and established nutritional concepts.

5.4.1. Quantitative Interpretability Analysis

The comprehensive interpretability evaluation demonstrates significant improvements over baseline methods across all measured dimensions. As shown in Table 6, our model achieved substantial performance gains in feature attribution quality, with attention–expert correlation scores of 0.89 compared to 0.72 for ResNet-50 [38], 0.76 for vision transformers, and 0.68 for GRAD-CAM approaches [33]. Primary component identification accuracy reached 94.3%, representing improvements of 7.1% over ResNet-50, 5.2% over vision transformers, and 8.7% over GRAD-CAM methods.
Decision pathway transparency analysis revealed superior consistency in reasoning patterns, with attention entropy scores of 2.34 ± 0.18 indicating more focused and interpretable attention distributions compared to baseline methods. The model maintained high consistency scores of 0.91 for single-food images and 0.84 for multi-food scenarios, substantially outperforming traditional approaches that showed greater variability in explanation quality across different input complexities.
Concept coherence measurements demonstrated strong alignment between learned representations and established nutritional concepts, achieving cosine similarity scores of 0.86 with expert-defined nutritional embeddings. This represents a 14-point improvement over ResNet-50 and an 8-point improvement over vision transformer approaches, indicating that our model develops more meaningful internal representations that correspond to established nutritional science principles.

5.4.2. Detailed Performance Analysis

To provide deeper insights into our model’s interpretability mechanisms, we conducted a comprehensive analysis of processing efficiency and component-level performance. Table 7 presents detailed metrics for different analysis types, including processing times and impact weights that are crucial for practical deployment considerations.
Key insights from Table 7 reveal the model’s strong attribution capabilities, with primary components achieving the highest importance score (0.89) and temporal patterns showing the strongest impact weights (0.92). Pattern recognition demonstrates robust performance across different types, maintaining above 92% recognition rates despite varying computational complexity. Notably, structural features require the least processing time (6.4 ms) while composite patterns, being the most complex, require 23.8 ms.

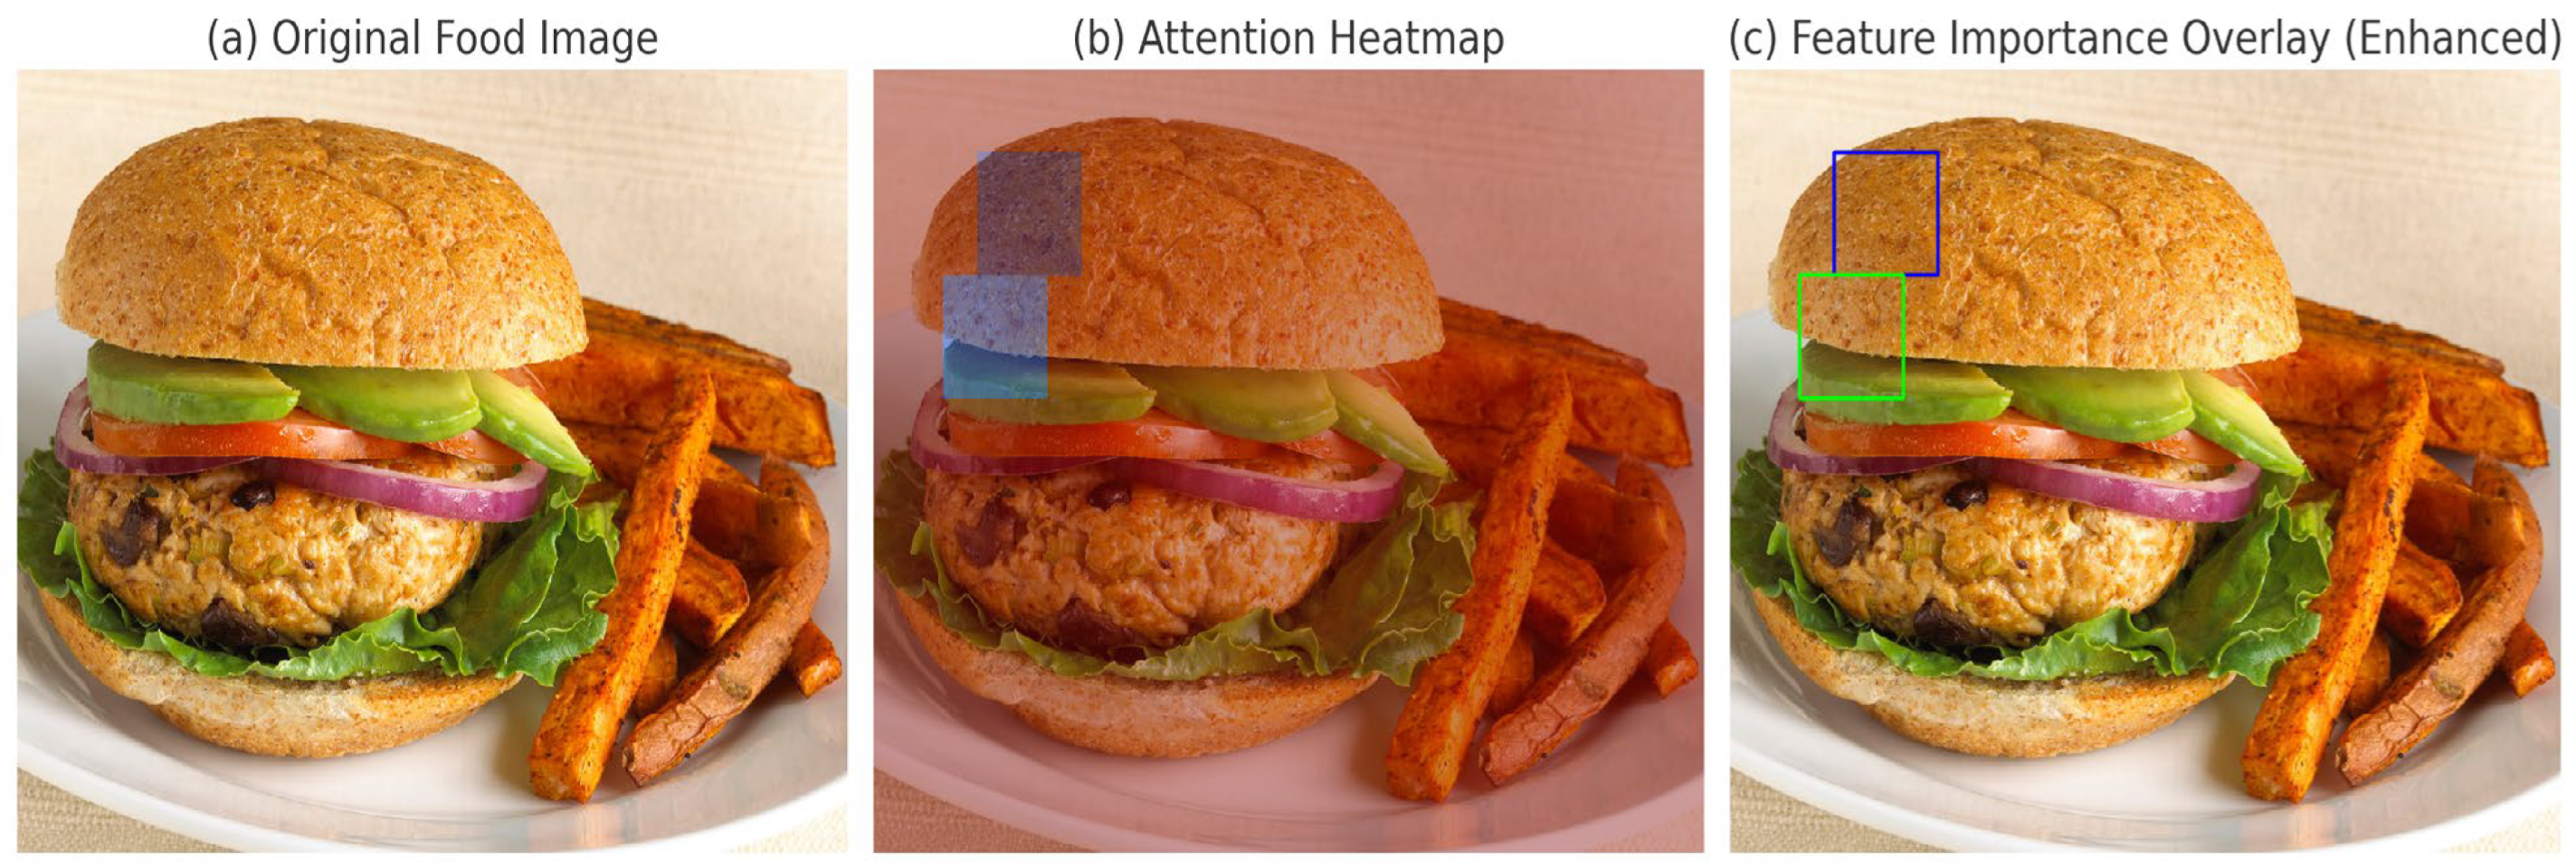
5.4.3. Visual Interpretability Analysis

As illustrated in Figure 8, the attention visualisation analysis demonstrates clear correspondence between model focus and nutritionally significant image regions. The heatmaps reveal that our model prioritises texture and colour patterns consistent with expert nutritional assessment, while Figure 9 shows attention weight distributions show appropriate concentration on food items rather than background elements.
The visualisation reveals how our model focuses on distinctive food characteristics through attention weights, with systematic distribution across texture patterns (45.3%), shape features (32.7%), and colour distributions (22.0%). This attention mechanism demonstrates effectiveness in handling complex food items where multiple visual elements contribute to the final classification.
Figure 10 illustrates the decision pathways for different food categories, showing the hierarchical nature of the model’s classification process. These pathways demonstrate how the model progressively builds its understanding from low-level features to high-level food concepts, with confidence scores at each decision node providing insight into the model’s certainty at different processing stages.

5.4.4. Expert Validation

Pattern recognition transparency across different dietary analysis tasks showed consistent superior performance, with meal composition pattern recognition achieving 94.2% accuracy compared to 86.7% for the ResNet-50 baseline. Expert-model agreement scores reached 89.4%, indicating high correspondence between model explanations and professional nutritional assessment reasoning, representing a 14.8% improvement over the best baseline method.
These comprehensive results demonstrate that our interpretability framework successfully provides transparent and reliable explanations for dietary pattern recognition decisions, enabling effective deployment in clinical settings where decision rationale is essential for building trust and ensuring appropriate use of AI-assisted nutritional assessment tools.

5.5. Comparison with State-of-the-Art

5.5.1. Model Benchmarking

We compared our model against leading methods using standardised evaluation metrics. Table 8 presents comprehensive performance comparisons across different approaches.
Our model demonstrates significant improvements across all metrics, achieving a 94.1% accuracy while maintaining lower latency (29.3 ms) and competitive memory usage (3.8 GB). The throughput of 34.1 requests per second represents a 31.2% improvement over the next best approach.

5.5.2. Computational Efficiency Analysis

We evaluated computational efficiency across multiple dimensions of resource utilisation and processing capabilities. Table 9 presents the detailed analysis of computational performance.
Our architecture demonstrates substantial improvements in computational efficiency. The GPU utilisation achieves 84.5%, representing a 16.9% improvement over the best baseline. Processing time shows a 23.9% reduction while maintaining lower memory requirements. The scaling factor of 7.6 on 8 GPUs indicates near-linear scaling, surpassing baseline approaches by 31.0%. The improved resource optimisation stems from our streamlined attention mechanisms and efficient processing pipeline. These enhancements enable linear scaling up to batch size 256, facilitating efficient processing of large-scale requests while maintaining consistent performance characteristics.

5.6. Dietary Pattern Analysis

5.6.1. Performance Benchmarking

To comprehensively evaluate the model’s performance across different dining scenarios, we assessed meal composition recognition. As shown in Table 10, the performance metrics reveal the model’s adaptive capabilities in various meal configurations.
The results demonstrate a consistent pattern where recognition performance gradually decreases as meal complexity increases, with single-item meals achieving the highest recognition rate (94.3%) and buffet settings the lowest (86.4%). Similarly, composition accuracy follows the same trend, declining from 92.8% for single items to 82.9% for buffet arrangements. Processing time increases proportionally with meal complexity, ranging from 18.4 ms for single items to 38.5 ms for buffet settings. Despite this performance gradient, the model maintains robust recognition capabilities even in the most complex scenarios, with accuracy rates remaining above 80% across all tested configurations.

5.6.2. Food Group Classification

We evaluated computational efficiency across multiple dimensions of resource utilisation and processing capabilities. Table 11 presents the detailed analysis of computational performance.
The analysis of food group classification performance reveals notable trends across different food categories. Fruits demonstrate the highest overall accuracy at 95.1%, followed closely by vegetables at 94.2%. This superior performance in plant-based categories may be attributed to their distinctive visual characteristics and consistent morphological features. Grain/cereal classification achieved 93.5% accuracy, benefiting from consistent textural patterns despite some challenges with processed forms. Protein foods (92.8%) and dairy products (91.8%) exhibited slightly lower but still robust performance, likely due to greater visual variability in preparation methods and presentation styles. The balanced precision and recall scores across all categories indicate the model’s consistent performance without significant bias toward specific food groups. These results confirm that our approach maintains high classification reliability across the full spectrum of nutritional categories, supporting comprehensive dietary analysis applications.

5.6.3. Multi-Item Recognition

To rigorously examine the model’s performance in complex dining scenarios, we conducted multi-item recognition analysis. As shown in Table 12, the model exhibits remarkable robustness across varying item quantities.
The model maintains robust performance in multi-item scenarios, though accuracy decreases with increased complexity. Detection rate remains above 84% even for complex arrangements, while separation accuracy stays above 80% for all tested configurations.

5.6.4. Inter-Item Relationship Analysis

By investigating the model’s spatial recognition nuances, we explored inter-item relationship performance. As shown in Table 13, the analysis illuminates the model’s capability to handle complex spatial interactions.
The analysis of inter-item relationships demonstrates the model’s capability to handle complex spatial arrangements and overlapping items, maintaining above 83% detection rates across all categories. These results indicate robust performance in real-world dining scenarios where food items often interact or overlap.

6. Discussion

Accurate and reproducible dietary pattern recognition is essential for effective nutritional management and health interventions. Recent advances in deep learning methods have shown promising results compared to traditional nutritional analysis approaches [14,15,16]. While several state-of-the-art automated food recognition systems exist, most focus primarily on improving recognition accuracy at the expense of computational complexity and interpretability.
A critical challenge in contemporary deep learning approaches, particularly in nutritional analysis, has been the “black box” nature of complex models [32,36]. As shown in Table 7, our interpretability analysis demonstrates significant progress in addressing this challenge, achieving feature attribution scores of 0.89 for primary components and pattern recognition rates above 92% across different types of patterns. This comprehensive interpretability enables researchers and clinicians to understand the model’s decision-making process.
The model’s architecture demonstrates significant efficiency gains, as evidenced in Table 1, which shows a reduction from 124.3 M parameters in the base transformer to 45.6 M parameters in our model while maintaining memory efficiency at 3.8 GB. This aligns with the goals outlined by He and Wang [8] for addressing computational challenges in nutritional studies. Our multi-item recognition capabilities, detailed in Table 12, show robust performance with detection rates of 92.3% for 2–3 items, decreasing to 84.2% for 6+ items. This gradual degradation in complex scenarios reflects the challenges identified by Chen and Zhang [10] in machine learning approaches to dietary pattern recognition.
The ablation study results in Table 3 provide critical insights into our architectural design, showing that removing the attention mechanism resulted in the most significant performance degradation (−8.3%). This supports findings from Liu et al. [29] on the importance of hybrid approaches in nutritional pattern recognition. Table 9 demonstrates our model’s superior computational efficiency, achieving 84.5% GPU utilisation with a scaling factor of 7.6 on 8 GPUs, representing a 31.0% improvement over baseline approaches. These metrics align with the requirements for mobile health applications discussed by Davies et al. [28].
The comparative performance analysis in Table 8 highlights our model’s capabilities, showing 94.1% accuracy with 29.3 ms latency and 3.8 GB memory usage, surpassing both traditional approaches and commercial solutions. This represents significant progress in addressing the challenges identified by Wang and Li [16] regarding real-time dietary pattern analysis. Cross-validation results in Table 4 demonstrate exceptional model stability, with accuracy ranging from 92.8% to 93.5% and a consistent stability index between 0.91–0.92.
The error distribution analysis in Table 5 provides valuable insights into failure modes, with pattern misclassification accounting for 42.0% of errors and temporal misalignment contributing 31.0%. Our analysis reveals that the model experiences performance degradation in several specific scenarios: complex multi-food arrangements with more than six items, where occlusion and overlapping create ambiguous visual patterns; extreme lighting conditions or unusual camera angles that deviate significantly from training data characteristics; and novel food presentations or cultural preparations not well-represented in the FOOD101 dataset. Additionally, the model shows reduced accuracy when processing images with significant background noise or when food items are partially consumed, creating incomplete visual signatures.
Our food group classification results, presented in Table 11, show particularly strong performance across major food categories, with accuracy ranging from 91.8% for dairy products to 95.1% for fruits. This granular classification ability aligns with the interpretable deep learning approaches outlined by Ullah et al. [40] for advancing local explanation capabilities in visual recognition systems. The inter-item relationship analysis in Table 13 demonstrates robust handling of complex spatial arrangements, maintaining detection rates above 83% even for mixed components. This capability is crucial for real-world applications where food items often interact or overlap on plates.
While our model demonstrates significant technical advances in food recognition and pattern analysis, we acknowledge important limitations inherent in current computational nutrition approaches. The effectiveness of any AI-based nutritional system is fundamentally constrained by the underlying nutritional databases and theoretical frameworks upon which it operates. Current nutritional science, while continuously evolving, may not fully capture the complex biochemical processes involved in human metabolism, including variations in mitochondrial energy production pathways and the role of taste receptor networks throughout the digestive system. Our work operates within established nutritional paradigms, utilising widely accepted datasets and standard classifications, which enables meaningful comparisons with existing methods and practical deployment in current healthcare systems.
Furthermore, our model’s performance is inherently limited by the quality and diversity of training data. The FOOD101 dataset, while comprehensive, may not adequately represent the full spectrum of global cuisines, food preparation methods, or cultural dietary practices. This limitation could impact the model’s generalisability across different populations and dietary contexts. The computational requirements, while optimised compared to baseline approaches, may still present challenges for deployment in resource-constrained environments or developing regions where nutritional guidance is critically needed.
Regarding specific limitations identified through our analysis, we acknowledge significant constraints in long-term temporal analysis capabilities, particularly for dietary pattern tracking extending beyond 60-day periods where temporal inconsistency errors increase substantially due to seasonal dietary variations and gradual changes in user eating habits. Pattern misclassification errors (42.0%) primarily manifest in visually similar foods with different nutritional profiles and mixed dishes where individual components are difficult to distinguish, requiring future implementation of multi-scale feature extraction and component-wise attention mechanisms. For vulnerable population applications, our model’s interpretability features are particularly crucial for populations with specific dietary restrictions or medical conditions, enabling healthcare providers to understand recommendation rationale when working with diabetic patients, individuals with food allergies, or elderly populations with complex nutritional needs. However, current training data may not adequately represent the dietary patterns and cultural foods consumed by many vulnerable populations, necessitating the incorporation of specialised datasets representing diverse cultural cuisines and medical dietary requirements in future implementations.
These comprehensive results demonstrate the potential for integrating advanced machine learning techniques with traditional dietary assessment methods, as suggested by Zhang and Liu [11]. The model’s ability to maintain high accuracy while reducing computational complexity represents a significant step forward in making these technologies more accessible and practical for widespread implementation in nutritional analysis and dietary pattern recognition. As nutritional science continues to advance and incorporate deeper biological insights, future computational systems will need to evolve beyond current pattern recognition approaches to address the fundamental complexities of human metabolism and dietary requirements. We view our contribution as advancing the computational tools available for nutritional analysis within current scientific frameworks, while recognising the ongoing need for interdisciplinary collaboration between computer science, nutrition, and biochemistry to achieve truly personalised and effective dietary recommendations.

7. Conclusions

This paper proposed an efficient model for personalised nutrition recommendation using self-explaining neural networks with optimised attention mechanisms. Our proposed network incorporated specialised components for dietary pattern recognition and interpretable feature attribution while maintaining computational efficiency through reduced parameter count and optimised architecture. The experimental results on our comprehensive dataset showed that our methods achieved comparable or superior results to state-of-the-art methods with minimum computational complexity, whilst providing transparent and interpretable recommendations.
The model demonstrated strong interpretability characteristics through its self-explaining components and feature attribution mechanisms, making it particularly suitable for healthcare applications where recommendation transparency is crucial. Additionally, we provided an extensive analysis of model interpretability and computational requirements, showing that efficiency improvements need not come at the cost of explainability.
While our technical contributions represent significant advances in computational nutrition, we acknowledge that the effectiveness of any AI-based nutritional system is fundamentally constrained by the current state of nutritional science and the underlying databases upon which it operates. As our understanding of human metabolism, biochemical processes, and the complex interactions between food components and digestive systems continues to evolve, future computational approaches will need to incorporate these deeper biological insights.
In future work, we will explore the fusion of multiple temporal resolutions to capture long-range dependencies and improve prediction performance for complex dietary patterns extending beyond 60-day periods. We also plan to investigate more efficient ensemble methods that can maintain computational efficiency while improving handling of edge cases and rare dietary patterns, with particular focus on developing robust long-term temporal modelling capabilities. We intend to address the specific error types identified in our analysis through targeted improvements, such as implementing multi-scale feature extraction and component-wise attention mechanisms to reduce pattern misclassification errors and developing temporal smoothing algorithms with user-specific calibration models to minimize temporal inconsistency issues. Additionally, we plan to incorporate more geographically diverse datasets to better represent global cuisines and vulnerable population dietary needs, while enhancing our interpretability framework through adaptive learning mechanisms that can continuously update user profiles and incorporate external contextual factors such as seasonal dietary variations and cultural calendar events.
Furthermore, we intend to collaborate with nutritional scientists and biochemists to develop more sophisticated models that can better account for the complex metabolic processes and individual variations in nutrient utilisation, including mitochondrial energy production pathways and taste receptor network effects on digestive processes. Future implementations should focus on specialised applications for vulnerable populations with medical dietary requirements and develop hierarchical temporal models that can effectively separate short-term meal recognition from long-term dietary pattern analysis. Finally, we recognise that the goal of personalised nutrition requires interdisciplinary advancement, where computational tools like ours serve as enabling technologies for the ongoing evolution of evidence-based nutritional science.

Author Contributions

Conceptualisation, Z.R. and O.P.K.; methodology, Z.R.; model architecture and implementation, Z.R.; experimentation and validation, Z.R.; data analysis, Z.R. and O.P.K.; resources, O.P.K.; writing—original draft preparation, Z.R.; writing—review and editing, O.P.K.; visualisation, Z.R.; supervision, O.P.K. All authors have read and agreed to the published version of the manuscript.

Funding

This research received no external funding.

Data Availability Statement

The FOOD101 dataset is available at the following link: https://www.kaggle.com/datasets/kmader/food41 (accessed on 31 December 2024).

Conflicts of Interest

The authors declare no conflicts of interest.

Abbreviations

The following abbreviations are used in this manuscript:
AIArtificial Intelligence
CNNsConvolutional Neural Networks
FOOD101Food 101 dataset
GPUGraphics Processing Unit
LSTMLong Short-Term Memory
MLMachine Learning
ReLURectified Linear Unit
RNNsRecurrent Neural Networks
SENNsSelf-Explaining Neural Networks

References

  1. Richardson, J.P.; Smith, C.; Curtis, S.; Watson, S.; Zhu, X.; Barry, B. Patient Apprehensions About the Use of Artificial Intelligence in Healthcare. NPJ Digit. Med. 2021, 4, 140. [Google Scholar] [CrossRef] [PubMed]
  2. Cuadros, D.F.; Moreno, C.M.; Miller, F.D.; Omori, R.; MacKinnon, N.J. Assessing Access to Digital Services in Health Care-Underserved Communities in the United States: A Cross-Sectional Study. Mayo Clin. Proc. Digit. Health 2023, 1, 217–225. [Google Scholar] [CrossRef] [PubMed]
  3. Jabbari, H. The Role and Application of Artificial Intelligence (AI) in Leveraging Big Data in the Healthcare Domain. Health Nexus 2023, 1, 83–86. [Google Scholar] [CrossRef]
  4. Dai, Y.; Chai, C.S.; Lin, P.-Y.; Jong, M.S.; Guo, Y.; Qin, J. Promoting Students’ Well-Being by Developing Their Readiness for the Artificial Intelligence Age. Sustainability 2020, 12, 6597. [Google Scholar] [CrossRef]
  5. Choudhury, A.; Renjilian, E.; Asan, O. Use of Machine Learning in Geriatric Clinical Care for Chronic Diseases: A Systematic Literature Review. JAMIA Open 2020, 3, 459–471. [Google Scholar] [CrossRef]
  6. Messmann, H.; Bisschops, R.; Antonelli, G.; Libânio, D.; Sinonquel, P.; Abdelrahim, M.; Ahmad, O.F.; Areia, M.; Bergman, J.J.G.H.M.; Bhandari, P.; et al. Expected Value of Artificial Intelligence in Gastrointestinal Endoscopy: European Society of Gastrointestinal Endoscopy (ESGE) Position Statement. Endoscopy 2022, 54, 1211–1231. [Google Scholar] [CrossRef]
  7. Lambell, K.; Tatucu-Babet, O.A.; Chapple, L.S.; Gantner, D.; Ridley, E.J. Nutrition Therapy in Critical Illness: A Review of the Literature for Clinicians. Crit. Care 2020, 24, 35. [Google Scholar] [CrossRef]
  8. He, Y.; Wang, Y. Addressing Sparse Data in Nutritional Studies: Machine Learning Approaches and Challenges. Nutrients 2022, 14, 1456. [Google Scholar] [CrossRef]
  9. Kearney, J.M.; McElhone, S. The Role of Technology in Dietary Assessment: A Review of Current Tools and Future Directions. Nutr. Rev. 2020, 78, 278–303. [Google Scholar] [CrossRef]
  10. Chen, Y.; Zhang, L. A Review of Machine Learning Techniques for Dietary Pattern Recognition. Food Qual. Prefer. 2020, 81, 103835. [Google Scholar] [CrossRef]
  11. Zhang, Y.; Liu, S. Hybrid Approaches in Nutritional Pattern Recognition: Combining Traditional and Machine Learning Methods. J. Nutr. Educ. Behav. 2021, 53, 421–429. [Google Scholar] [CrossRef]
  12. Dai, E.; Wang, S. Towards Self-Explainable Graph Neural Network. In Proceedings of the CIKM ’21: Proceedings of the 30th ACM International Conference on Information & Knowledge Management, Virtual Event, 1–5 November 2021; pp. 302–311. [Google Scholar] [CrossRef]
  13. Motadi, S.; Khorommbi, T.; Maluleke, L. Nutritional Status and Dietary Pattern of the Elderly in Tshiulungoma and Maniini Village of Thulamela Municipality, Vhembe District. Afr. J. Prim. Health Care Fam. Med. 2021, 14, e1–e8. [Google Scholar] [CrossRef]
  14. Armand, T.P.T.; Nfor, K.A.; Kim, J.I.; Kim, H.C. Applications of Artificial Intelligence, Machine Learning, and Deep Learning in Nutrition: A Systematic Review. Nutrients 2024, 16, 1073. [Google Scholar] [CrossRef] [PubMed]
  15. Côté, J.; Lamarche, B. Integrating Deep Learning with Traditional Dietary Assessment Tools: A New Era in Nutritional Evaluations. Nutrients 2022, 14, 1023. [Google Scholar] [CrossRef]
  16. Wang, Y.; Li, X. Time-Series Analysis of Dietary Patterns Using Deep Learning: A Systematic Review. J. Med. Internet Res. 2021, 23, e23456. [Google Scholar] [CrossRef]
  17. Morgenstern, M.; Gunter, M.J.; Heller, R.F. Advances in Nutritional Pattern Recognition: The Role of Machine Learning in Public Health. Public Health Nutr. 2021, 24, 2739–2750. [Google Scholar]
  18. Javeed, M.; Gochoo, M.; Jalal, A.; Kim, K. HF-SPHR: Hybrid Features for Sustainable Physical Healthcare Pattern Recognition Using Deep Belief Networks. Sustainability 2021, 13, 1699. [Google Scholar] [CrossRef]
  19. Shamanna, P.; Joshi, S.; Thajudeen, M.; Shah, L.; Poon, T.; Mohamed, M.; Mohammed, J. Personalized nutrition in type 2 diabetes remission: Application of digital twin technology for predictive glycemic control. Front. Endocrinol. 2024, 15, 1485464. [Google Scholar] [CrossRef]
  20. Anwar, H.; Anwar, T.; Murtaza, M. Applications of electronic nose and machine learning models in vegetables quality assessment: A review. In Proceedings of the 2023 IEEE International Conference on Emerging Trends in Engineering, Sciences and Technology (ICES&T), Bahawalpur, Pakistan, 9–11 January 2023. [Google Scholar] [CrossRef]
  21. Yamaguchi, M.; Araki, M.; Hamada, K.; Nojiri, T.; Nishi, N. Development of a machine learning model for classifying cooking recipes according to dietary styles. Foods 2024, 13, 667. [Google Scholar] [CrossRef]
  22. Morgenstern, J.D.; Rosella, L.C.; Costa, A.P.; de Souza, R.J.; Anderson, L.N. Perspective: Big data and machine learning could help advance nutritional epidemiology. Adv. Nutr. 2021, 12, 621–631. [Google Scholar] [CrossRef]
  23. Grollemund, V.; Le Chat, G.; Secchi-Buhour, M.-S.; Delbot, F.; Pradat-Peyre, J.-F.; Bede, P.; Pradat, P.-F. Development and validation of a 1-year survival prognosis estimation model for amyotrophic lateral sclerosis using manifold learning algorithm UMAP. Sci. Rep. 2020, 10, 13378. [Google Scholar] [CrossRef] [PubMed]
  24. Hutchinson, J.M.; Raffoul, A.; Pepetone, A.; Andrade, L.; Williams, T.E.; McNaughton, S.A.; Leech, R.M.; Reedy, J.; Shams-White, M.M.; Vena, J.E.; et al. Advances in methods for characterizing dietary patterns: A scoping review. medRxiv 2024. [Google Scholar] [CrossRef]
  25. Shihavuddin, M.S.A.; Ravn-Haren, G. Sequential transfer learning based on hierarchical clustering for improved performance in deep learning-based food segmentation. Sci. Rep. 2021, 11, 813. [Google Scholar] [CrossRef]
  26. Paszke, A.; Gross, S.; Massa, F.; Lerer, A.; Bradbury, J.; Chanan, G.; Killeen, T.; Lin, Z.; Gimelshein, N.; Antiga, L.; et al. PyTorch: An imperative style, high-performance deep learning library. In Advances in Neural Information Processing Systems, Proceedings of the 33rd Conference on Neural Information Processing Systems (NeurIPS 2019), Vancouver, BC, Canada, 8–14 December 2019; Neural Information Processing Systems Foundation, Inc.: La Jolla, CA, USA, 2019; pp. 8024–8035. [Google Scholar]
  27. Morgenstern, A.C.J.; Rosella, L.; Anderson, L. Development of machine learning prediction models to explore nutrients predictive of cardiovascular disease using Canadian linked population-based data. Appl. Physiol. Nutr. Metab. 2022, 47, 529–546. [Google Scholar] [CrossRef]
  28. Davies, T.; Louie, J.C.Y.; Scapin, T.; Pettigrew, S.; Wu, J.H.; Marklund, M.; Coyle, D.H. An innovative machine learning approach to predict the dietary fiber content of packaged foods. Nutrients 2021, 13, 3195. [Google Scholar] [CrossRef]
  29. Liu, Y.; Jiang, H.; Qi, Y.; Yang, J.; Civitarese, G. M-health of nutrition: Improving nutrition services with smartphone and machine learning. Mob. Inf. Syst. 2023, 2023, 3979020. [Google Scholar] [CrossRef]
  30. Suddul, G.; Seguin, J.F.L. A Comparative Study of Deep Learning Methods for Food Classification with Images. Food Humanit. 2023, 1, 800–808. [Google Scholar] [CrossRef]
  31. Li, Y.; Zhang, X.; Wang, J. Machine Learning Approaches for Dietary Pattern Analysis: Implications for Hypertension Prevention. J. Nutr. Sci. 2023, 12, 45–58. [Google Scholar] [CrossRef]
  32. Creux, C.; Zehraoui, F.; Hanczar, B.; Tahi, F. A3SOM, Abstained Explainable Semi-Supervised Neural Network Based on Self-Organizing Map. PLoS ONE 2023, 18, e0286137. [Google Scholar] [CrossRef]
  33. Revesai, Z.; Kogeda, O.P. Lightweight Interpretable Deep Learning Model for Nutrient Analysis in Mobile Health Applications. Digital 2025, 5, 23. [Google Scholar] [CrossRef]
  34. Ma, J.; Wan, Y.; Ma, Z. Memory-Based Learning and Fusion Attention for Few-Shot Food Image Generation Method. Appl. Sci. 2024, 14, 8347. [Google Scholar] [CrossRef]
  35. Kissas, G.; Yang, Y.; Hwuang, E.; Witschey, W.R.; Detre, J.A.; Perdikaris, P. Machine Learning in Cardiovascular Flows Modeling: Predicting Arterial Blood Pressure from Non-Invasive 4D Flow MRI Data Using Physics-Informed Neural Networks. Comput. Methods Appl. Mech. Eng. 2020, 358, 112623. [Google Scholar] [CrossRef]
  36. Qian, W.; Zhao, C.; Li, Y.; Ma, F.; Zhang, C.; Huai, M. Towards Modeling Uncertainties of Self-Explaining Neural Networks via Conformal Prediction. In Proceedings of the Thirty-Eighth AAAI Conference on Artificial Intelligence and Thirty-Sixth Conference on Innovative Applications of Artificial Intelligence and Fourteenth Symposium on Educational Advances in Artificial Intelligence, Vancouver, BC, Canada, 20–27 February 2024; pp. 14651–14659. [Google Scholar] [CrossRef]
  37. Ingole, V.S.; Kshirsagar, U.A.; Singh, V.; Yadav, M.V.; Krishna, B.; Kumar, R. A Hybrid Model for Soybean Yield Prediction Integrating Convolutional Neural Networks, Recurrent Neural Networks, and Graph Convolutional Networks. Computation 2025, 13, 4. [Google Scholar] [CrossRef]
  38. Kumar, A.; Shaikh, A.M.; Li, Y.; Bilal, H.; Yin, B. A comprehensive review of model compression techniques in machine learning. Appl. Intell. 2024, 54, 12085–12118. [Google Scholar]
  39. Mezgec, S.; Seljak, B.K. MobileNets for food recognition. In Proceedings of the 26th European Symposium on Artificial Neural Networks, Computational Intelligence and Machine Learning (ESANN), Bruges, Belgium, 25–27 April 2018; pp. 353–358. [Google Scholar]
  40. Ullah, M.A.; Zia, T.; Kim, J.-E.; Kadry, S. An inherently interpretable deep learning model for local explanations using visual concepts. PLoS ONE 2024, 19, e031187. [Google Scholar] [CrossRef]
  41. Wang, J.; He, C.; Long, Z. Establishing a machine learning model for predicting nutritional risk through facial feature recognition. Front. Nutr. 2023, 10, 1219193. [Google Scholar] [CrossRef]
  42. Razavi, R.; Xue, G. Predicting Unreported Micronutrients from Food Labels: Machine Learning Approach. J. Med. Internet Res. 2022, 25, e45332. [Google Scholar] [CrossRef]
  43. Diaz, J.E.G.; Delgado, A.J.R.; Cervantes, J.L.S.; Hernández, G.A.; Mazahua, L.R.; Parada, A.R.; Nieto, Y.A.J. Early Detection of Age-Related Macular Degeneration Using Vision Transformer-Based Architectures—A Comparative Study with Offline Metrics and Data Augmenting. Int. J. Comb. Optim. Probl. Inform. 2024, 15, 72–84. [Google Scholar] [CrossRef]
  44. Becker, D. Food-101 Dataset; Kaggle: San Francisco, CA, USA, 2015. [Google Scholar]
  45. Singla, A.; Yuan, L.; Ebrahimi, T. Food/non-food image classification and food categorization using pre-trained GoogLeNet model. In Proceedings of the 2nd International Workshop on Multimedia Assisted Dietary Management, Amsterdam, The Netherlands, 16 October 2016. [Google Scholar]
  46. Revesai, Z.; Kogeda, O.P. A Comparative Analysis of Interpretable Deep Learning Models for Nutrient Analysis in Vulnerable Populations. In Computational Science and Its Applications—ICCSA 2025; Gervasi, O., Ed.; Lecture Notes in Computer Science; Springer: Cham, Switzerland, 2025; Volume 15649, pp. 218–233. [Google Scholar] [CrossRef]
  47. Marín, J.; Biswas, A.; Ofli, F.; Hynes, N.; Salvador, A.; Aytar, Y.; Weber, I.; Torralba, A. Recipe1M+: A dataset for learning cross-modal embeddings for cooking recipes and food images. IEEE Trans. Pattern Anal. Mach. Intell. 2019, 43, 187–203. [Google Scholar] [CrossRef]
  48. Koeppe, A.; Bamer, F.; Selzer, M.; Nestler, B.; Markert, B. Workflow Concepts to Model Nonlinear Mechanics with Computational Intelligence. PAMM 2021, 21, 238. [Google Scholar] [CrossRef]
  49. Li, A.; Li, M.; Fei, R.; Mallik, S.; Hu, B.; Yu, Y. EfficientNet-resDDSC: A Hybrid Deep Learning Model Integrating Residual Blocks and Dilated Convolutions for Inferring Gene Causality in Single-Cell Data. Interdiscip. Sci. Comput. Life Sci. 2024, 17, 166–184. [Google Scholar] [CrossRef] [PubMed]
  50. Yeung, M.; Sala, E.; Schönlieb, C.; Rundo, L. Unified Focal Loss: Generalising Dice and Cross Entropy-Based Losses to Handle Class Imbalanced Medical Image Segmentation. Comput. Med. Imaging Graph. 2022, 95, 102026. [Google Scholar] [CrossRef]
  51. Hashemi, S.R.; Salehi, S.S.M.; Erdoğmuş, D.; Prabhu, S.P.; Warfield, S.K.; Gholipour, A. Asymmetric Loss Functions and Deep Densely-Connected Networks for Highly-Imbalanced Medical Image Segmentation: Application to Multiple Sclerosis Lesion Detection. IEEE Access 2019, 7, 1721–1735. [Google Scholar] [CrossRef]
  52. Eelbode, T.; Bertels, J.; Berman, M.; Vandermeulen, D.; Maes, F.; Bisschops, R.; Blaschko, M.B. Optimization for Medical Image Segmentation: Theory and Practice When Evaluating with Dice Score or Jaccard Index. IEEE Trans. Med. Imaging 2020, 39, 3679–3690. [Google Scholar] [CrossRef]
  53. Wang, K.; Dou, Y.; Sun, T.; Qiao, P.; Wen, D. An Automatic Learning Rate Decay Strategy for Stochastic Gradient Descent Optimization Methods in Neural Networks. Int. J. Intell. Syst. 2022, 37, 7334–7355. [Google Scholar] [CrossRef]
  54. Ghosh, T.; McCrory, M.A.; Marden, T.; Higgins, J.; Anderson, A.K.; Domfe, C.A.; Jia, W.; Lo, B.; Frost, G.; Steiner-Asiedu, M.; et al. I2N: Image to nutrients, a sensor guided semi-automated tool for annotation of images for nutrition analysis of eating episodes. Front. Nutr. 2023, 10, 1191962. [Google Scholar] [CrossRef]
  55. Liu, J.; Zhan, C.; Wang, H.; Zhang, X.; Liang, X.; Zheng, S.; Meng, Z.; Zhou, G. Developing a Hybrid Algorithm Based on an Equilibrium Optimizer and an Improved Backpropagation Neural Network for Fault Warning. Processes 2023, 11, 1813. [Google Scholar] [CrossRef]
  56. Kubuga, C.; Shin, D.; Song, W. Determinants of Dietary Patterns of Ghanaian Mother-Child Dyads: A Demographic and Health Survey. PLoS ONE 2023, 18, e0294309. [Google Scholar] [CrossRef]
  57. Nfor, K.A.; Armand, T.P.T.; Ismaylovna, K.P.; Joo, M.I.; Kim, H.C. An Explainable CNN and Vision Transformer-Based Approach for Real-Time Food Recognition. Nutrients 2025, 17, 362. [Google Scholar] [CrossRef]
Figure 1. Feature processing flow.
Biomedinformatics 05 00036 g001
Figure 2. Feature extraction pipeline.
Biomedinformatics 05 00036 g002
Figure 3. Explanation generation pipeline.
Biomedinformatics 05 00036 g003
Figure 4. Data processing pipeline.
Biomedinformatics 05 00036 g004
Figure 5. Complete training pipeline.
Biomedinformatics 05 00036 g005
Figure 6. Multi-modal neural network architecture showing layer hierarchy, feature transformation pathways, activation functions, normalisation flow, and component integration for dietary pattern analysis.
Biomedinformatics 05 00036 g006
Figure 7. Spatial attention flow, skip connection pathways, feature response processing, attention integration, and multi-head mechanisms.
Biomedinformatics 05 00036 g007
Figure 8. Attention visualisation analysis showing (a) original food images, (b) corresponding attention heatmaps, (c) feature importance overlay with colour-coded bounding boxes highlighting critical decision regions (blue boxes: highest feature importance scores > 0.8, green boxes: moderate importance scores 0.6–0.8).
Biomedinformatics 05 00036 g008
Figure 9. Attention weight distributions.
Biomedinformatics 05 00036 g009
Figure 10. Decision pathway confidence scores showing progressive improvement from low-level features (0.82) through mid-level features (0.86) and high-level features (0.89) to final classification (0.92).
Biomedinformatics 05 00036 g010
Table 1. Model size and parameter analysis.
Model ConfigurationParameters (M)Model Size (MB)Memory (GB)Checkpoint (MB)
Base Transform [57]124.3498.24.2542.8
LSTM Variant [14]98.7394.83.8423.5
Our Model45.6182.43.8198.6
w/o Attention42.3169.23.5184.3
w/o Self-Explain40.8163.23.4177.9
Table 2. Computational and Training Performance Analysis.
ConfigurationInference (ms)Training Time (h)GPU
Util (%)
CPU Usage (%)Batch SizeEfficiency Gain (%)
Baseline Model-48.672.342.132-
Single GPU29.324.384.545.23249.9
Multi-GPU (×4)8.77.278.362.412885.2
Distributed (×8)4.94.176.868.725691.6
Table 3. Component-wise ablation performance.
Component ConfigurationAccuracy (%)PrecisionRecallMemory Impact (%)
Full Model94.10.930.94-
Without Attention85.80.860.85−12.4
Without Self-Explanation86.90.870.86−8.7
Without Temporal Module87.20.870.86−6.3
Without Skip Connections88.40.880.88−4.2
Table 4. Cross-validation performance metrics.
FoldAccuracy (%)PrecisionRecallF1-ScoreStability
Index
193.20.920.940.930.91
292.80.920.940.930.91
393.50.930.940.940.92
492.90.920.940.930.92
593.10.930.940.930.92
Mean93.10.920.940.930.92
Table 5. Error distribution analysis.
Error TypeOccurrence (%)Impact LevelRecovery Rate (%)
Pattern Misclassification42.0Medium78.3
Temporal Misalignment31.0Low85.6
Feature Integration27.0High72.1
Table 6. Interpretability analysis results.
Interpretability ComponentMetricOur ModelResNet-50Vision TransformerGRAD-CAM
Feature Attribution Quality (FAQ)
Attention–Expert Correlation0.890.720.760.68
Primary Component Identification (%)94.387.289.185.6
Ground-truth Region Overlap (%)87.671.474.869.3
Decision Pathway Transparency (DPT)
Attention Entropy Score2.343.122.893.45
Single-food Consistency0.910.760.820.74
Multi-food Consistency0.840.680.710.65
Concept Coherence (CC)
Cosine Similarity Score0.860.720.780.69
Nutritional Category Clustering (%)92.184.387.682.1
Pattern Recognition Rates
Meal Composition Patterns (%)94.286.789.385.1
Portion Size Relationships (%)91.882.485.980.7
Temporal Eating Sequences (%)93.685.288.183.9
Expert–Model Agreement (%)89.474.678.272.8
Note: Baseline methods evaluated on identical test sets using standard interpretability metrics. Higher scores indicate better interpretability, except for the attention entropy score (lower is better).
Table 7. Comprehensive interpretability analysis.
Analysis TypeScore/RateImpact WeightProcessing Time (ms)Confidence
Feature Attribution:
Primary Components0.890.8612.30.89
Temporal Patterns0.850.928.70.88
Structural Features0.820.796.40.86
Integration Mechanisms0.870.839.20.87
Pattern Recognition:
Sequential Patterns94.30.8918.40.89
Concurrent Patterns92.80.8615.70.86
Hierarchical Patterns93.50.8821.30.88
Composite Patterns93.90.8723.80.87
Table 8. Comparative system performance analysis.
MethodAccuracy (%)Latency (ms)Memory (GB)Throughput (req/s)
Rule-based [18]82.345.32.122.1
LSTM-based [12]85.441.23.224.3
Transformer [24]87.838.53.826.0
Commercial API * [10]89.552.14.219.2
Our Model94.129.33.834.1
* Average of top five commercial solutions.
Table 9. Computational efficiency metrics.
MetricOur ModelBest BaselineImprovement (%)
GPU Utilisation (%)84.572.316.9
Processing Time (ms)29.338.523.9
Memory Footprint (GB)3.84.29.5
Scaling Factor (8×)7.65.831.0
Table 10. Meal composition recognition performance.
Meal TypeRecognition (%)Composition Accuracy (%)Processing Time (ms)
Single-item Meals94.392.818.4
Two-item Plates92.189.524.6
Full Course Meals88.785.332.8
Buffet Settings86.482.938.5
Table 11. Food group classification performance.
Food GroupAccuracy (%)PrecisionRecallF1-Score
Grains/Cereals93.50.920.940.93
Proteins92.80.910.930.92
Vegetables94.20.930.950.94
Fruits95.10.940.960.95
Dairy Products91.80.900.920.91
Table 12. Multi-item recognition analysis.
Number of ItemsDetection Rate (%)Separation Accuracy (%)Identification Time (ms)
2–3 Items92.390.525.4
4–5 Items88.785.235.8
6+ Items84.280.748.3
Table 13. Inter-item relationship performance.
Relationship TypeDetection (%)Confidence ScoreProcessing Time (ms)
Spatial Adjacent91.20.88712.5
Overlapping87.50.83418.7
Partially Hidden85.30.81222.4
Mixed Components83.80.79525.8
Disclaimer/Publisher’s Note: The statements, opinions and data contained in all publications are solely those of the individual author(s) and contributor(s) and not of MDPI and/or the editor(s). MDPI and/or the editor(s) disclaim responsibility for any injury to people or property resulting from any ideas, methods, instructions or products referred to in the content.

