Article

Identification of a New Lung Cancer Biomarker Signature Using Data Mining and Preliminary In Vitro Validation

1
Comms and Intelligent Systems Research Group, University of Hertfordshire, Hatfield AL10 9AB, UK
2
Curenetics Ltd., London SE1 7LL, UK
3
Department of Clinical, Pharmaceutical and Biological Science, University of Hertfordshire, Hatfield AL10 9AB, UK
*
Authors to whom correspondence should be addressed.
BioMedInformatics 2025, 5(2), 32; https://doi.org/10.3390/biomedinformatics5020032
Submission received: 23 April 2025 / Revised: 5 June 2025 / Accepted: 6 June 2025 / Published: 11 June 2025

Abstract

:
Background: Lung adenocarcinoma is one of the major subtype of non-Small Cell Lung Cancer and biomarkers are essential to be identified for early diagnosis. The study aims to find in silico and preliminary in vitro analysis of potential biomarkers for lung adenocarcinoma. Methods: Bioinformatics analysis in parallel to data mining analysis was performed on microarray data with lung adenocarcinoma samples to identify potent gene biomarkers associated with lung cancer type. Afterwards, these genes were then validated in vitro using RT-qPCR analysis in cancerous (Calu-3) and non-cancerous (MRC-5) cell lines. Moreover, these genes were used in machine learning-based analysis to classify lung adenocarcinoma samples from controls. The analysis includes three experiments—the bioinformatic (in silico), in vitro, and machine learning analyses. Results: The three experiments identified four genes, namely, SLC15A1, GPR123 (ADGRA1), KCNAB2, and KNDC1, as key biomarkers and the most relevant gene features for distinguishing lung adenocarcinoma from control. Conclusions: This study identifies four biomarkers associated with lung adenocarcinoma through bioinformatics, in vitro and machine learning analyses. These four genes shows strong potential for further investigation in clinical research.

1. Introduction

Lung adenocarcinomas (LUAD) are considered as the leading cause of cancer-related deaths worldwide amongst men and women. Despite improvements in the management of the neoplasm, 18% of the LUAD cases are associated with a low 5-year overall survival rate [1]. Current advancements in genomics and in machine learning allow the analysis of large bioinformatics databases and the discovery of new diagnostic biomarkers associated with Non-Small Cell Lung Cancer (NSCLC).
In this article, three experiments were conducted to identify, analyze, and validate new LUAD diagnostic biomarker signatures. The conceptual diagram of the experimental setup followed for the identification of new lung cancer biomarker signatures from DNA microarray data is illustrated in Figure 1.
The first experiment involved bioinformatics analysis using statistical tools to screen potential diagnostic biomarkers for LUAD. Linear modeling [2] and Empirical Bayes [3] were applied on LUAD DNA microarray data extracted from patients diagnosed with LUAD and from control samples to identify new biomarkers. In parallel to the bioinformatics analysis, feature ranking with minimum Redundancy Maximum Relevance (mRMR) [4] and with Least Absolute Shrinkage and Selection Operator (LASSO) [5] were applied on the LUAD DNA microarray data. The findings of the bioinformatics analysis also supported by the genomic feature rankings were used in the next experiment for in vitro validation.
In the second experiment, the upregulated and downregulated genes found in the first experiment after the bioinformatics analysis were reviewed, and among these genes, five genes were examined as potential diagnostic biomarkers using in vitro experiments.
In the third experiment, the biomarker signatures validated after the in vitro analysis were used as gene features to train Machine Learning (ML) models to distinguish LUAD from control samples along with the use of the oversampling Synthetic Minority Oversampling Technique (SMOTE) [6] to eliminate imbalances in the number samples of each category. The work was conducted by training the ML models with all the possible combinations of the validated biomarkers used as input features. The best-performing combinations were selected and presented in Section 3.2 of this article.

2. Materials and Methods

2.1. Data Description
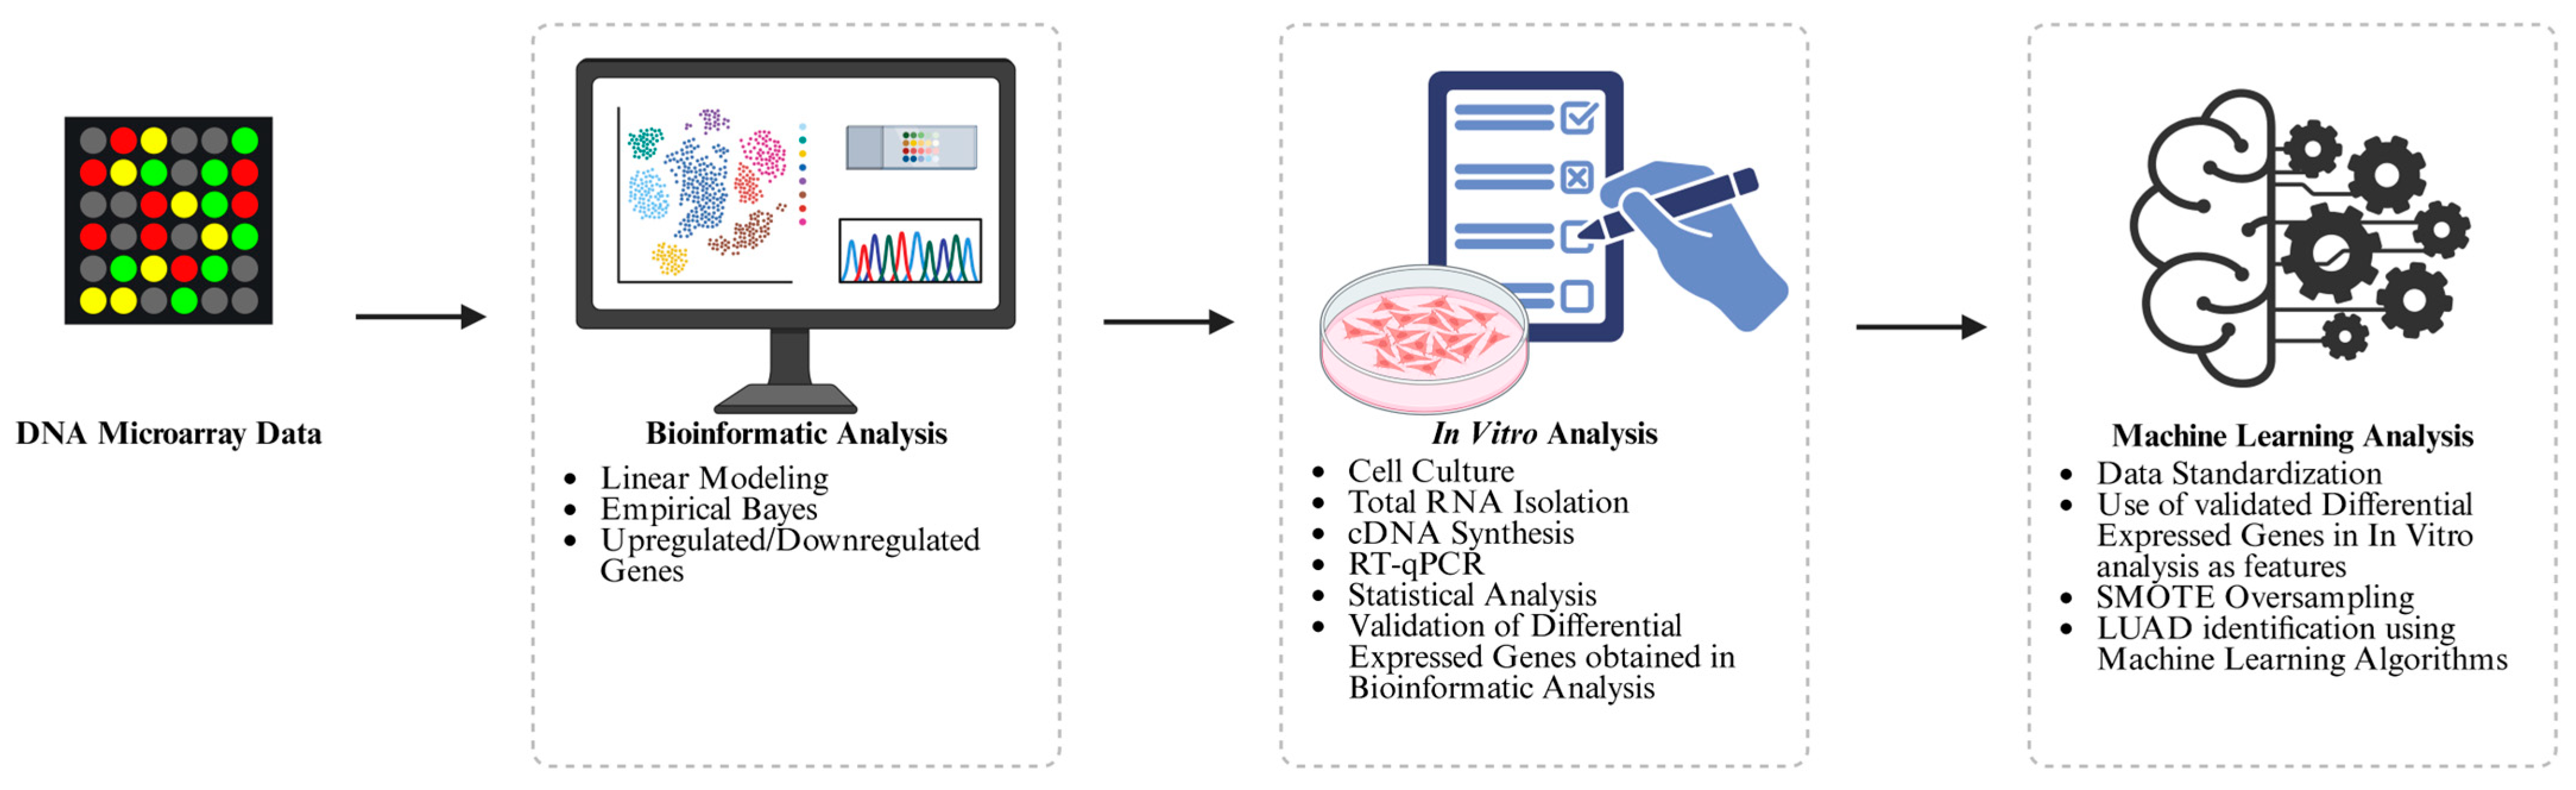
A total of 490 tissue samples from different microarray datasets were selected from the Gene Expression Omnibus (GEO) [7] database. Specifically, five datasets for LUAD were combined, namely, the GSE40791 [8], the GSE30219 [9], the GSE43580 [10], the GSE18842 [11], and the GSE37745 [12]. The tissue samples are from subjects who either were diagnosed as having LUAD or were diagnosed as healthy control subjects. The distribution of the number of microarray samples across the two categories is shown in Table 1.
As can be seen in Table 1, the LUAD category consists of 376 samples and the control category consists of 114 samples. Each microarray sample consists of 21,407 gene expression values.

2.2. Methodology

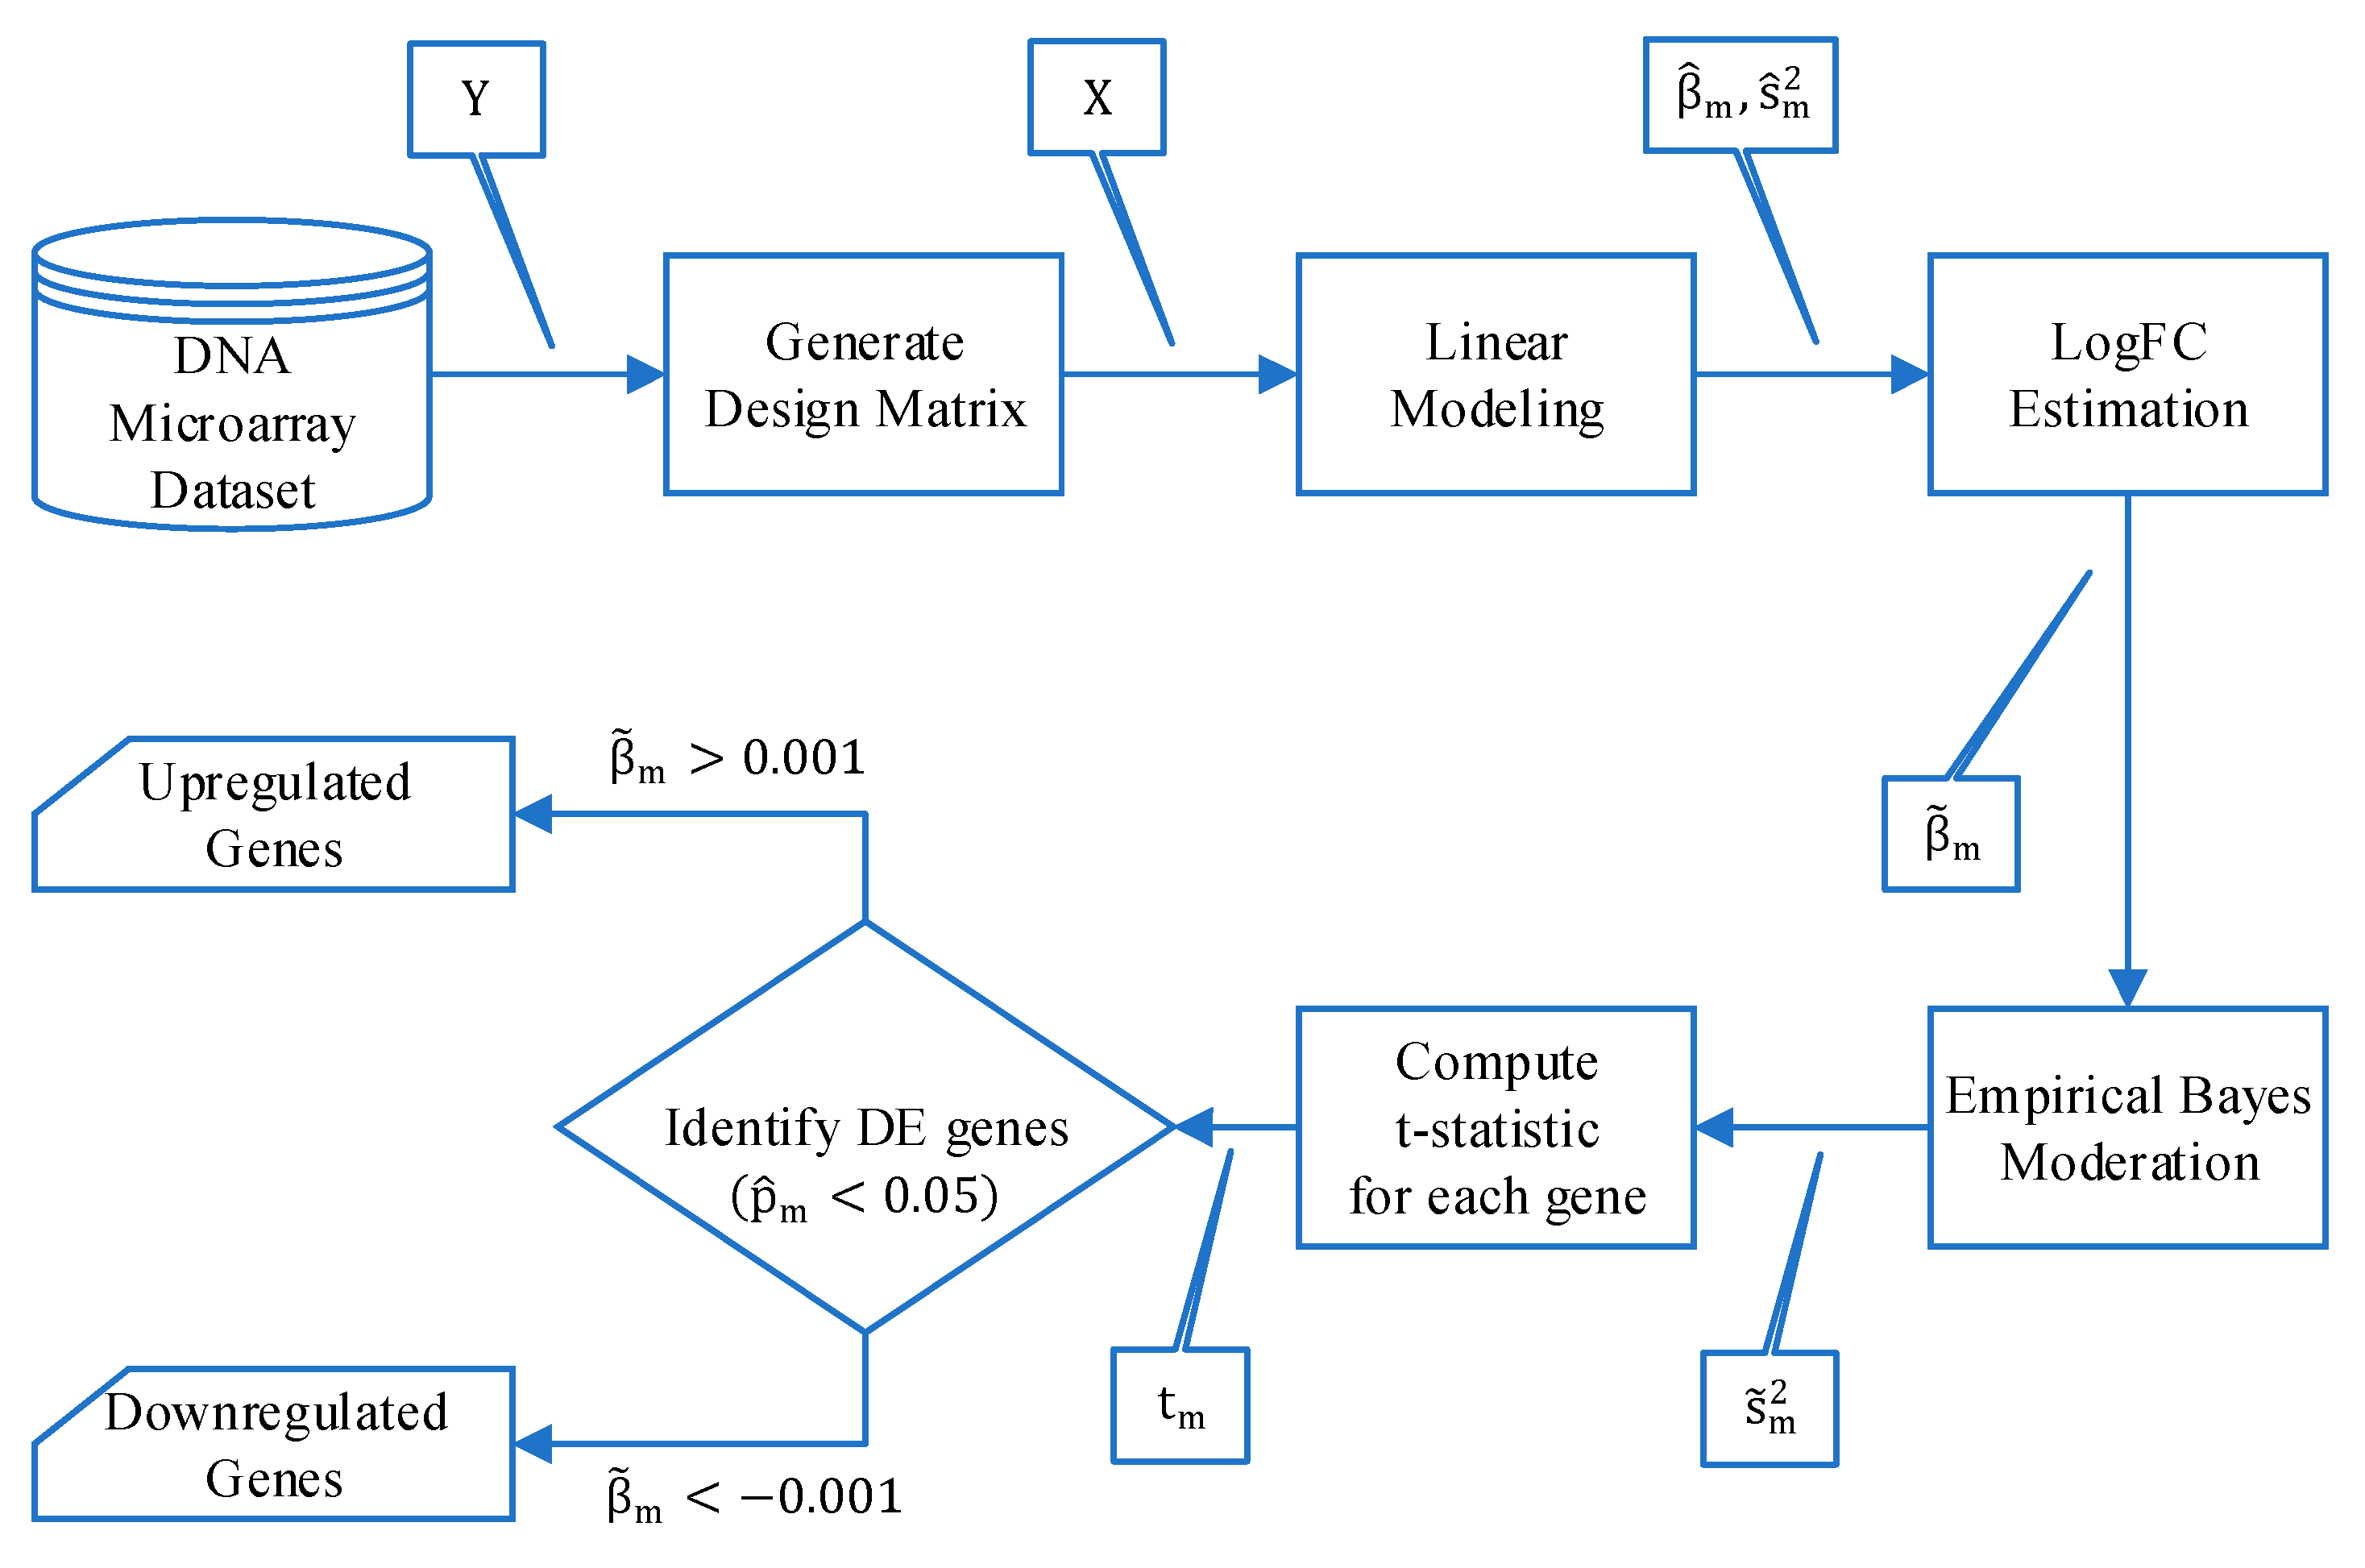
2.2.1. Bioinformatics Analysis

Preprocessing

The Robust Multi-array Average (RMA) [13] was applied on the raw microarray data to normalize them for further analysis. Specifically, RMA corrects the background noise using maximum likelihood estimation, quantile normalization to make the distribution of probe intensities the same across all arrays, and summarization using linear modeling to combine probe-level intensities into a single expression value of each gene.

Biomarker Extraction

The first experimental setup involved applying linear modeling [2] along with Empirical Bayes [3] to extract genes that are differentially expressed (DE) between cancerous and non-cancerous tissue samples. The analysis was performed using R on RStudio 4.4.1. The block diagram of the bioinformatics analysis process that was followed using DE analysis of DNA microarray data is illustrated in Figure 2. The limma package [14] was used to perform DE analysis of the gene expression data. In particular, limma was used to fit a linear model to each gene separately.
Let y m R N × 1 be the measured expression levels of gene m across all samples and its matrix form being the Y R N × M , where N is the number of samples and M the number of genes. The differential expression analysis using linear modeling for the m -th gene is given in Equation (1a) and for all genes, M , in Equation (1b).
y m = X β m + ϵ m
Y = X B + E
where X N N × p represents the design matrix with p equal to the number of categories (in our case LUAD and the control, which results in p = 2 ); β m R p × 1 is the coefficients of the linear model for gene m , and thus its matrix form is B R p × M ; and ϵ m R N × 1 is the estimation errors of gene m , and its matrix form is E R N × M .
The design matrix X encodes the conditions for linear modeling, given that in our case p = 2 , each row represents a sample where the first column is equal to one if the sample is LUAD and zero if it is control. Likewise, the second column is equal to one if the sample is control and zero if it is LUAD, i.e.,
X n , : = 1   0 , i f   t h e   s a m p l e   n   i s   L U A D 0   1 , i f   t h e   s a m p l e   n   i s   c o n t r o l
For each gene m , Ordinary Least Squares (OLS) estimates the coefficients β ^ m R p × 1 of the two categories (LUAD and control) according to Equation (3):
β ^ m = X T X 1 X T y m
The residual variance (mean-squared error) of the linear model s ^ m 2 for gene m is estimated as in Equation (4):
s ^ m 2 = y m X β ^ m 2 d
where d = N p the residual degrees of freedom of the genes.
To test whether the difference in expression among the conditions/classes is statistically significant, a contrast matrix C N p × c is defined where c is the number of comparisons that can be made between the conditions/classes, i.e.,
c = p p 1 2
For a two-group comparison, p = 2 c = 2 , (LUAD vs. control), it is C = 1 1 . The estimation of the base 2 logarithm of the Fold Change ( log 2   F C ), β ~ m R c × 1 , is given in Equation (6).
β ~ m = C T β ^ m
Due to the high dimensionality of the microarray data (high M compared to the usually small N ), s ^ m 2 estimations can be highly unstable and noisy; thus, Empirical Bayes [3] is applied to improve variance estimations by mostly shrinking the gene-specific estimations with high variance towards a common value. Specifically, the Empirical Bayes method assumes a prior distribution for sigma squared, the variance, which is a scaled chi-squared distribution as in Equation (7).
1 s ^ m 2 ~ 1 d 0 s 0 2 χ d 0 2
where d 0 is the prior degrees of freedom and s 0 2 is the prior variance. This results in moderated variance estimates that lead to more robust and stable t-statistics. To do so, the moderated variance s ~ m 2 for gene m is calculated using Equation (8).
s ~ m 2 = d 0 s 0 2 + d s ^ m 2 d 0 + d
The moderated variance estimates s ~ m 2 are then used to compute moderate t-statistics t m as according to Equation (9). Empirical Bayes focuses on the problem of testing the null hypotheses H 0 : β ~ m = 0 and aims to develop improved test statistics.
t m = β ~ m s ~ m C T ( X T X ) 1 C
Afterwards, t m is used to calculate the p-value p m of each m gene. Since more than ten thousands of genes are tested, the false discovery rate is controlled using the Benjamini–Hochberg procedure [15], which generates adjusted p-values p ^ m . A gene m is considered differentially expressed if p ^ m < 0.05 . A fold-change threshold is then applied ( | β ~ m | > 0.05 ) to the genes found to be differentially expressed to characterize them as upregulated or downregulated, i.e.,
m p ^ m < 0.05 = u p r e g u l a t e d ,           β ~ m > 0.05 d o w n r e g u l a t e d ,           β ~ m < 0.05
In parallel to the bioinformatics analysis, genomic feature ranking with minimum Redundancy Maximum Relevance (mRMR) [4] and with Least Absolute Shrinkage and Selection Operator (LASSO) [5] was performed to investigate the relevance of the found lung cancer biomarkers. Both for the two feature rankings and for the log 2   F C values, estimations were nested within each fold of a stratified five-fold cross, and the results were averaged across the five folds.

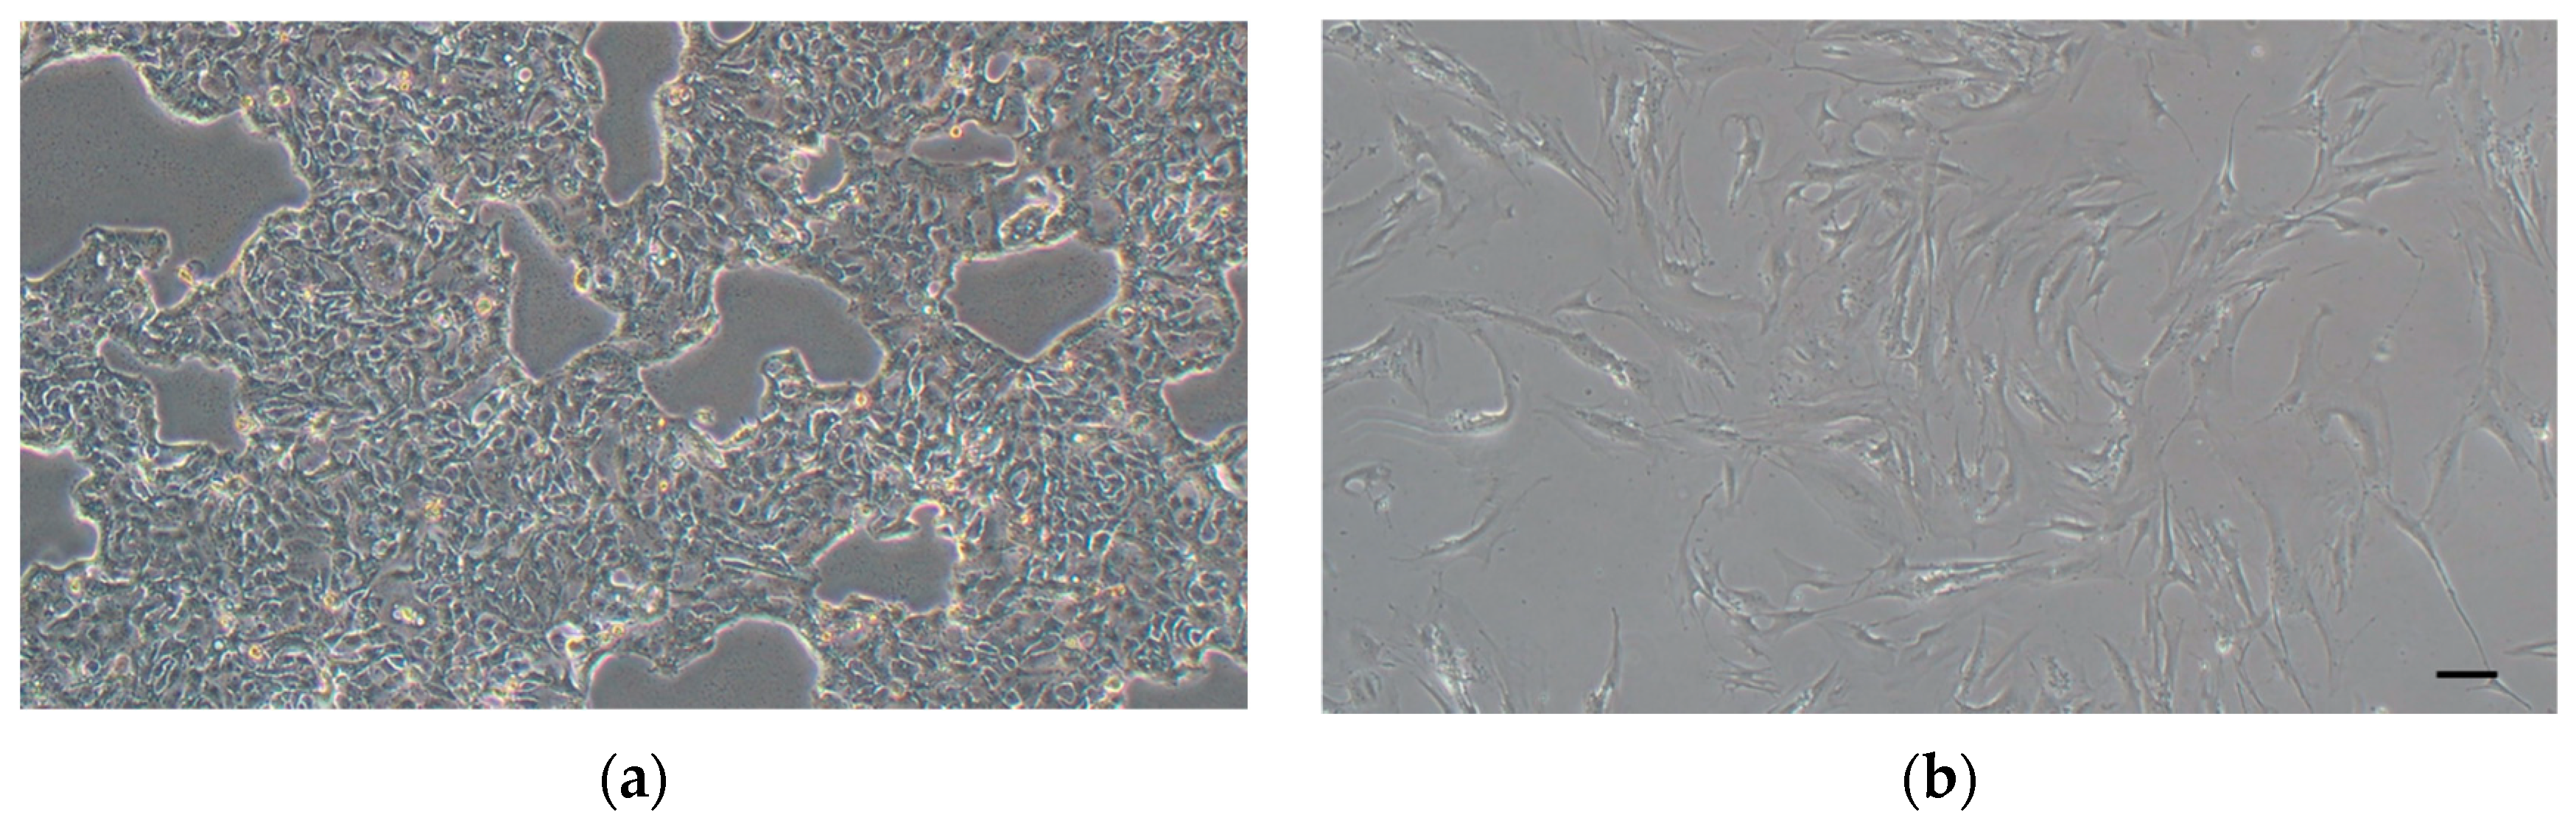
2.2.2. In Vitro Analysis

The Calu-3 cell line, derived from LUAD, and the MRC-5 cell line, derived from lung fibroblasts (control), were used for RNA isolation and DNA profiling. Both cell lines were obtained from ATCC, Manassas, VA, USA. Calu-3 cells were cultured in Dulbecco’s Modified Eagle Medium (DMEM) medium supplemented with 10% fetal bovine serum (FBS; Gibco™, Bleiswijk, The Netherlands) and 11% penicillin-streptomycin (10,000 U/mL) (Gibco™, Bleiswijk, The Netherlands), while MRC-5 cells were cultured in complete Minimum Essential Media (MEM; Gibco™, Bleiswijk, The Netherlands) with the same supplements. Both were incubated at 37 °C with 5% CO2, and only flasks with over 90% confluency were used for RNA extraction.
RNA isolation was carried out using 400 μL of Trizol reagent (Ambion Life Technology, Auckland, New Zealand). Homogenized cell pellets were incubated with Trizol for 5 min at room temperature, followed by chloroform (Sigma-AldrichTM, Dorset, UK) treatment to separate the RNA. The Trizol cell homogenates were then transferred to a 1.5 mL RNase-free eppendorf tubes, and 80 μL of chloroform was added to each of them (Sigma-AldrichTM, Dorset, UK). The contents were mixed thoroughly by vortexing at medium speed and incubated at RT for 2–3 min. Subsequently, the samples were centrifuged (Biofuge Fresco, Hanau, Germany) at 12,000× g for 15 min at 4 °C. After centrifugation, the RNA-containing upper layer was collected and precipitated with isopropanol. The RNA was then washed twice with 75% ethanol, air-dried, and dissolved in RNase-free water. The RNA’s quantity and quality were assessed using a NanoDrop (Nanodrop ND1000 Spectrophotometer, NanoDrop Technologies, Fishersville, VA, USA). To remove DNA contamination, DNase treatment was performed using the QIAGEN RNase-Free DNase Set (Qiagen, Manchester, UK). Specifically, 10 μL of RNase-free Buffer RDD and 2.5 μL of RNase-free DNase I were added to the reaction tubes containing the samples, followed by incubation for 10 min at room temperature. After incubation, the samples were re-quantified using the Nanodrop ND1000.
cDNA synthesis was performed using the High-Capacity cDNA Reverse Transcription Kit (Applied Biosystems ThermoFisher, Pleasanton, CA, USA) with three independent biologic samples for each cell line. RNA samples with a concentration of 20 ng/μL were used, along with buffers, dNTPs, random primers, and reverse transcriptase. The thermal cycler program ran at 25 °C for 10 min, 37 °C for 120 min, and 85 °C for 5 min. The synthesized cDNA was stored at −20 °C for future experiments.
RT-qPCR was conducted to validate the expression of genes that were found upregulated or downregulated after the bioinformatics analysis. TaqMan Fast Advanced Master Mix (Applied Biosystems ThermoFisher, Pleasanton, CA, USA) and GAPDH (Applied Biosystems ThermoFisher, Pleasanton, CA, USA) as the internal control were used. Controls without template and master mix were included to ensure accuracy. The PCR program consisted of enzyme activation at 95 °C for 20 s, followed by 40 cycles of 95 °C for 1 s and 60 °C for 20 s.
All sample data were analyzed on GraphPad Prism 9.5.0 software (GraphPad Software, San Diego, CA, USA) via incorporating an unpaired t-test to check the difference in FC of gene expression using the comparative C T method [16] between the cancerous and control cell lines. p values less than 0.05 were deemed to be significantly different from the controls and denoted with asterisks where appropriate. To calculate the FC, cycle threshold ( C T ) values for the target gene C T t a r g e t and the reference gene C T r e f e r e n c e (housekeeping gene: GAPDH) are measured for each sample. Then, Δ C T for each sample is calculated by subtracting C T r e f e r e n c e from C T t a r g e t , i.e.,
Δ C T s a m p l e = C T t a r g e t C T r e f e r e n c e
A reference (calibrator) MRC-5 sample is chosen with its Δ C T , namely, Δ C T c a l i b r a t o r which is the control sample. Δ Δ C T is then calculated by estimating the difference between Δ C T s a m p l e and Δ C T c a l i b r a t o r as defined in Equation (12).
Δ Δ C T = Δ C T s a m p l e Δ C T c a l i b r a t o r
Δ Δ C T represents the relative change in expression of the target gene in the cancer sample compared to the control sample. Then, the FC of each gene expression is estimated as:
F C = 2 Δ Δ C T

2.2.3. Machine Learning Analysis

The third experiment involved the use of the lung cancer biomarkers identified through bioinformatics analysis and subsequently validated by the preliminary in vitro experiments as gene features to classify LUAD and control. The machine learning validation focused on evaluating the performance of five-gene combinations identified as candidate biomarkers from in vitro analysis. Clinical validation is beyond the scope of this study. The block diagram of the architecture for LUAD vs. control identification using the validated lung cancer biomarkers in the in vitro analysis from DNA microarray data is illustrated in Figure 3.
All possible combinations of the in vitro validated gene features were tested. These combinations were applied to the microarray data and trained using different ML algorithms, namely, the Support Vector Machine (SVM) [17] with linear, RBF, and polynomial kernels, the Random Forest (RF) [18], the Logistic Regression (LR) [19], the Extreme Gradient Boosting (XGBoost) [20], the Gradient Boosting (GB) [21], the AdaBoost (AB) [22], the Extra Trees (ET) [23], the k-Nearest Neighbors (kNN) [24], and the Linear Discriminant Analysis (LDA) [25]). The models were trained using stratified five-fold cross-validation, and their performances were averaged across all folds. Additionally, stratified five-fold cross-validation was applied to the training subsets to optimize the hyperparameters of the machine learning models. The best combinations of the in vitro validated gene features are presented in Section 3.2.
Before training and testing the ML models, the gene expression values were standardized to ensure that genomic features were centered around a mean of zero and scaled with standard deviation equal to one. Standardization was applied separately on the training set, with the estimated means and standard deviations used to standardize the test set. All ML models were evaluated both with and without data augmentation to overcome imbalanced classes (LUAD and control) during the training, using the Synthetic Minority Oversampling Technique (SMOTE) [6] algorithm. SMOTE was applied only to the training data, while all test samples were the original ones.

3. Results

3.1. Bioinformatics Analysis

Table 2 presents the results of the differential expression analysis for the genes found in the bioinformatics analysis to be upregulated or downregulated. Along with the log 2   F C values, the LASSO and mRMR ranking scores are provided. As can be seen in Table 2, the genes KCNAB2, GPR183, and KNDC1 were observed to have negative log 2   F C values, indicating their downregulation in LUAD, while the genes SLC15A1 and GPR123 were observed to have positive log 2   F C values, indicating upregulation.
SLC15A1 had the highest positive coefficient according to LASSO feature ranking, signifying its importance in distinguishing LUAD from control. In contrast, KCNAB2 and KNDC1 have negative LASSO values, indicating a negative relationship to LUAD. mRMR feature selection identified KCNAB2 as the most relevant gene with the highest score (95.92). SLC15A1 and KNDC1 followed with scores of 39.63 and 36.99, while GPR123 and GPR183 had lower scores, indicating lesser relevance compared to the other genes. Table 2 presents that the most upregulated gene SLC15A1, and the most downregulated genes KNDC1 and KCNAB2 were also the most relevant features according to LASSO and mRMR.

3.2. In Vitro Analysis

Figure 4a shows growing Calu-3 cells (LUAD) at 90% confluency. Figure 4b illustrates growing MRC-5 cells (control) at 70% confluency.
The results of gene fold expression obtained via RT-qPCR are illustrated in Figure 5. Our results showed that the gene SLC15A1 was significantly upregulated (p < 0.0032) within the Calu-3 cell line (LUAD) when compared to the MRC-5 cell line (control). Three of the genes analyzed throughout this study showed significant downregulation. These genes are GPR123 (p < 0.003), KNDC1 (p < 0.0002), and KCNAB2 (p < 0.0023). One of the genes analyzed, GPR183, showed no significant difference in gene fold expression when compared to the Calu-3 (LUAD) and MRC-5 (control) cell lines (p < 0.4711).

3.3. Machine Learning Analysis

The performance of all combinations of the five LUAD biomarkers validated in vitro was evaluated using different ML algorithms, with and without the use of SMOTE. The results for the best performing combinations of the five validated genes for the best performing ML model and for the top performing validated genes combination are tabulated in Table 3.
As can be seen in Table 3, the best-performing biomarker signature was the combination of the gene features ADGRA1, KCNAB2, SLC15A1, and KNDC1 without SMOTE using the ET machine learning algorithm, achieving 84.08% accuracy, 84.60% F1-score, 86.18% precision, 84.08% recall, 80.00% specificity, and AUC 92.25%. Combining all five biomarkers reached 83.67% accuracy, 84.49% F1 score, 87.18% precision, 83.67% recall, 84.74% specificity, and 91.71% AUC without SMOTE.
For the best two-gene combination, SLC15A1 and KNDC1, without the use of SMOTE, achieved 79.39% accuracy, 80.63% F1 score, 84.82% precision, 83.67% recall, 84.74% specificity, and 91.71% AUC. As for the best combination of three genes, it was using KCNAB2, SLC15A1, and KNDC1, achieving 82.65% accuracy, 83.34% F1 score, 85.71% precision, 82.65% recall, 80.86% specificity, and 90.85% AUC without SMOTE.

4. Discussion and Conclusions

This study presented a multistage approach, incorporating bioinformatics, in vitro validation, and machine learning to identify a potential biomarker signature for LUAD. Among the five initially shortlisted genes (SLC15A1, KNDC1, KCNAB2, GPR123, and GPR183), four demonstrated consistent differential expression between LUAD and control conditions in both microarray analysis and RT-qPCR validation (SLC15A1, KNDC1, KCNAB2, and GPR123). These genes demonstrated strong predictive value in machine learning models, enabling the distinction between LUAD and control samples with an accuracy of up to 84.08% and an AUC of 92.25%.
Our in vitro validation confirmed that KCNAB2 and KNDC1 were significantly downregulated in LUAD cells, suggesting tumor suppressor roles. Of note, KCNAB2 has been previously associated with adverse outcomes in LUAD. Lyu et al. (2022) reported that the decreased expression of KCNAB2 correlated with reduced immune infiltration and poor prognosis in LUAD patients, highlighting its potential role in modulating tumor immunity [26]. More recently, Li et al. (2025) demonstrated that FTO-mediated m6A methylation of KCNAB2 suppresses its tumor-inhibiting effects by inactivating the PI3K/AKT pathway in non-small cell lung cancer, further supporting its relevance as a tumor suppressor [27]. These studies were in line with our findings, suggesting that KCNAB2 functions as a tumor suppressor in lung cancer by influencing both immune microenvironment dynamics and oncogenic signalling pathways. Although KNDC1 has not been previously studied in LUAD, it has been identified as a tumor suppressor in ovarian cancer where reduced expression was associated with malignant transformation and poorer prognosis [28]. This aligns with our observation of significant downregulation of KNDC1 in LUAD cells, suggesting a possible tumor-suppressive role in lung cancer as well.
We also identified that SLC15A1 was significantly upregulated in both our in vitro and microarray analyses, consistent with its putative role as an oncogene. A prior study has also reported its involvement in LUAD [29]. Specifically, SLC15A1 was included in a prognostic gene panel associated with recurrence in LUAD patients [29]. Furthermore, the gene was also part of a ferritinophagy-related prognostic signature linked to overall survival [30]. Our results further strengthen the case for SLC15A1 as a clinically relevant biomarker, particularly in diagnostic and classification contexts.
GPR123 (ADGRA1), a member of the adhesion G protein-coupled receptor (GPCR) family, was also found to be downregulated in our cell line model, suggesting a potential tumor suppressor role. To the best of our knowledge, GPR123 has not been studied in LUAD. However, in bladder cancer, GPR123 has been identified as an independent biomarker for recurrence and prognosis [31]. A study by Liu et al. (2021) demonstrated that high expression levels of GPR123 were significantly associated with advanced tumor stages and poorer patient outcomes, suggesting a potential oncogenic role in bladder cancer progression [31]. This difference in expression between different cancer types highlights that the gene might exhibit context-specific behavior and that further functional studies in LUAD are required to clarify its biological role and potential as a tumor suppressor.
In contrast, GPR183, though downregulated in our in silico analysis, showed no significant expression change in vitro. Its biological role remains complex; single-cell RNA-seq data from Hou et al. (2024) showed that GPR183 was involved in modulating tumor-infiltrating B cell activity following immunotherapy in NSCLC [32]. These findings suggest that GPR183 may play a context-dependent role in immune regulation with potentially divergent functions across LUAD subtypes or treatment conditions.
Collectively, while some of these genes, such as SLC15A1, KCNAB2, and GPR183 have prior associations with LUAD, our study provides additional evidence for their relevance by integrating multistage transcriptomic screening, machine learning-based prioritization, and RT-qPCR validation. Importantly, we highlight their utility not only as biologically interesting genes but also as predictive features that improve classification performance in distinguishing LUAD from non-cancerous samples. The aforementioned functional roles of these genes proposed in the literature further support their relevance. These findings underline the potential biological significance of the identified genes and highlight directions for future mechanistic and clinical investigations.
Limitations of the present study include the use of only one LUAD (Calu-3) and one control (MRC-5) cell line for RT-qPCR validation. Although our findings provide initial validation, further studies incorporating additional LUAD subtypes, patient-derived tissue samples, and protein-level assays will be important to strengthen clinical relevance. In addition, testing the model on fully independent datasets such as separate GEO or TCGA studies or clinical biopsy samples will be important to confirm its generalizability.
In conclusion, this study highlights the potential of combining data mining, experimental validation, and machine learning to prioritize gene biomarkers for LUAD classification. The panel of SLC15A1, KNDC1, KCNAB2, and GPR123 emerged as a strong candidate and may serve as an avenue for further exploration in clinical studies.

Author Contributions

Conceptualization, all authors; methodology, all authors; software, F.B.A.; validation, F.B.A.; formal analysis, F.B.A., D.M., M.B. and I.M.; investigation, all authors; resources, F.B.A.; data curation, F.B.A.; writing—original draft preparation, F.B.A. and I.M.; writing—review and editing, all authors; visualization, F.B.A.; supervision, M.B. and I.M.; project administration, I.M.; and funding acquisition, I.M. and S.A. All authors have read and agreed to the published version of the manuscript.

Funding

This research work presented in this article was funded by Curenetics Ltd. through a research collaboration agreement with University of Hertfordshire.

Informed Consent Statement

Not applicable.

Data Availability Statement

The datasets used in this study, namely, GSE40791, GSE30219, GSE43580, GSE18842, and GSE37745, are available online from the Gene Expression Omnibus at https://www.ncbi.nlm.nih.gov/geo/ accessed on 20 January 2023.

Conflicts of Interest

Ferid Ben Ali is a PhD student at the University of Hertfordshire and employee of Curenetics Ltd., which provided funding for this study. Sola Adeleke is an employee of Curenetics. The company had no role in the study design, and did not influence the results or conclusions of the study. All other authors declare no conflicts of interest.

Abbreviations

The following abbreviations are used in this manuscript:
LUADLung adenocarcinoma
NSCLCNon-small cell lung cancer
MLMachine learning
SMOTESynthetic Minority Oversampling Technique
GEOGene Expression Omnibus
RMARobust Multi-array Average
DEDifferentially expressed
mRMRminimum Redundancy Maximum Relevance
LASSOLeast Absolute Shrinkage and Selection Operator
SVMSupport Vector Machine
RFRandom Forest
LRLogistic Regression
XGBoostExtreme Gradient Boosting
GBGradient Boosting
ABAdaBoost
ETExtra Trees
kNNk-Nearest Neighbors
LDALinear Discriminant Analysis

References

  1. Haghjoo, N.; Moeini, A.; Masoudi-Nejad, A. Introducing a Panel for Early Detection of Lung Adenocarcinoma by Using Data Integration of Genomics, Epigenomics, Transcriptomics and Proteomics. Exp. Mol. Pathol. 2020, 112, 104360. [Google Scholar] [CrossRef] [PubMed]
  2. Smyth, G.K. Linear Models and Empirical Bayes Methods for Assessing Differential Expression in Microarray Experiments. Stat. Appl. Genet. Mol. Biol. 2004, 3, 3. [Google Scholar] [CrossRef] [PubMed]
  3. Carlin, B.P.; Louis, T.A. Empirical Bayes: Past, Present and Future. J. Am. Stat. Assoc. 2000, 95, 1286–1289. [Google Scholar] [CrossRef]
  4. Ding, C.; Peng, H. Minimum Redundancy Feature Selection from Microarray Gene Expression Data. J. Bioinform. Comput. Biol. 2005, 3, 185–205. [Google Scholar] [CrossRef]
  5. Tibshirani, R. Regression Shrinkage and Selection Via the Lasso. J. R. Stat. Soc. Ser. B Stat. Methodol. 1996, 58, 267–288. [Google Scholar] [CrossRef]
  6. Chawla, N.V.; Bowyer, K.W.; Hall, L.O.; Kegelmeyer, W.P. SMOTE: Synthetic Minority Over-Sampling Technique. JAIR 2002, 16, 321–357. [Google Scholar] [CrossRef]
  7. Edgar, R. Gene Expression Omnibus: NCBI Gene Expression and Hybridization Array Data Repository. Nucleic Acids Res. 2002, 30, 207–210. [Google Scholar] [CrossRef]
  8. Zhang, Y.; Foreman, O.; Wigle, D.A.; Kosari, F.; Vasmatzis, G.; Salisbury, J.L.; van Deursen, J.; Galardy, P.J. USP44 Regulates Centrosome Positioning to Prevent Aneuploidy and Suppress Tumorigenesis. J. Clin. Invest. 2012, 122, 4362–4374. [Google Scholar] [CrossRef]
  9. Rousseaux, S.; Debernardi, A.; Jacquiau, B.; Vitte, A.-L.; Vesin, A.; Nagy-Mignotte, H.; Moro-Sibilot, D.; Brichon, P.-Y.; Lantuejoul, S.; Hainaut, P.; et al. Ectopic Activation of Germline and Placental Genes Identifies Aggressive Metastasis-Prone Lung Cancers. Sci. Transl. Med. 2013, 5, 186ra66. [Google Scholar] [CrossRef]
  10. Tarca, A.L.; Lauria, M.; Unger, M.; Bilal, E.; Boue, S.; Kumar Dey, K.; Hoeng, J.; Koeppl, H.; Martin, F.; Meyer, P.; et al. Strengths and Limitations of Microarray-Based Phenotype Prediction: Lessons Learned from the IMPROVER Diagnostic Signature Challenge. Bioinformatics 2013, 29, 2892–2899. [Google Scholar] [CrossRef]
  11. Sanchez-Palencia, A.; Gomez-Morales, M.; Gomez-Capilla, J.A.; Pedraza, V.; Boyero, L.; Rosell, R.; Fárez-Vidal, M.E. Gene Expression Profiling Reveals Novel Biomarkers in Nonsmall Cell Lung Cancer. Int. J. Cancer 2011, 129, 355–364. [Google Scholar] [CrossRef] [PubMed]
  12. Botling, J.; Edlund, K.; Lohr, M.; Hellwig, B.; Holmberg, L.; Lambe, M.; Berglund, A.; Ekman, S.; Bergqvist, M.; Pontén, F.; et al. Biomarker Discovery in Non-Small Cell Lung Cancer: Integrating Gene Expression Profiling, Meta-Analysis, and Tissue Microarray Validation. Clin. Cancer Res. 2013, 19, 194–204. [Google Scholar] [CrossRef] [PubMed]
  13. Irizarry, R.A. Exploration, Normalization, and Summaries of High Density Oligonucleotide Array Probe Level Data. Biostatistics 2003, 4, 249–264. [Google Scholar] [CrossRef]
  14. Ritchie, M.E.; Phipson, B.; Wu, D.I.; Hu, Y.; Law, C.W.; Shi, W.; Smyth, G.K. Limma Powers Differential Expression Analyses for RNA-Sequencing and Microarray Studies. Nucleic Acids Res. 2015, 43, e47. [Google Scholar] [CrossRef] [PubMed]
  15. Benjamini, Y.; Hochberg, Y. Controlling the False Discovery Rate: A Practical and Powerful Approach to Multiple Testing. J. R. Stat. Soc. Ser. B Stat. Methodol. 1995, 57, 289–300. [Google Scholar] [CrossRef]
  16. Livak, K.J.; Schmittgen, T.D. Analysis of Relative Gene Expression Data Using Real-Time Quantitative PCR and the 2−ΔΔCT Method. Methods 2001, 25, 402–408. [Google Scholar] [CrossRef]
  17. Cortes, C.; Vapnik, V. Support-Vector Networks. Mach. Learn. 1995, 20, 273–297. [Google Scholar] [CrossRef]
  18. Breiman, L. Random Forests. Mach. Learn. 2001, 45, 5–32. [Google Scholar] [CrossRef]
  19. Nelder, J.A.; Wedderburn, R.W. Generalized Linear Models. J. R. Stat. Soc. Ser. A Stat. Soc. 1972, 135, 370–384. [Google Scholar] [CrossRef]
  20. Chen, T.; Guestrin, C. Xgboost: A Scalable Tree Boosting System. In Proceedings of the 22nd ACM Sigkdd International Conference on Knowledge Discovery and Data Mining, San Francisco, CA, USA, 13–17 August 2016; pp. 785–794. [Google Scholar]
  21. Friedman, J.H. Greedy Function Approximation: A Gradient Boosting Machine. Ann. Stat. 2001, 29, 1189–1232. [Google Scholar] [CrossRef]
  22. Freund, Y.; Schapire, R.E. A Decision-Theoretic Generalization of on-Line Learning and an Application to Boosting. J. Comput. Syst. Sci. 1997, 55, 119–139. [Google Scholar] [CrossRef]
  23. Geurts, P.; Ernst, D.; Wehenkel, L. Extremely Randomized Trees. Mach. Learn. 2006, 63, 3–42. [Google Scholar] [CrossRef]
  24. Fix, E.; Hodges, J.L. Discriminatory Analysis. Nonparametric Discrimination: Consistency Properties. Int. Stat. Rev./Rev. Int. Stat. 1989, 57, 238. [Google Scholar] [CrossRef]
  25. Hart, P.E.; Stork, D.G.; Duda, R.O. Pattern Classification; Wiley Hoboken: Hoboken, NJ, USA, 2000; ISBN 0-471-05669-3. [Google Scholar]
  26. Lyu, Y.; Wang, Q.; Liang, J.; Zhang, L.; Zhang, H. The Ion Channel Gene KCNAB2 Is Associated with Poor Prognosis and Loss of Immune Infiltration in Lung Adenocarcinoma. Cells 2022, 11, 3438. [Google Scholar] [CrossRef]
  27. Li, Y.; Niu, J.; Sun, Z.; Liu, J. FTO-mediated m6A Methylation of KCNAB2 Inhibits Tumor Property of Non-Small Cell Lung Cancer Cells and M2 Macrophage Polarization by Inactivating the PI3K/AKT Pathway. J. Biochem. Mol. Toxicol. 2025, 39, e70232. [Google Scholar] [CrossRef] [PubMed]
  28. Yu, S.; Shen, J.; Fei, J.; Zhu, X.; Yin, M.; Zhou, J. KNDC1 Is a Predictive Marker of Malignant Transformation in Borderline Ovarian Tumors. OncoTargets Ther. 2020, 2020, 709–718. [Google Scholar] [CrossRef]
  29. Zhang, Y.; Fan, Q.; Guo, Y.; Zhu, K. Eight-Gene Signature Predicts Recurrence in Lung Adenocarcinoma. Cancer Biomark. 2020, 28, 447–457. [Google Scholar] [CrossRef]
  30. Xia, L.; Ma, H. Identification of a Novel Signature Based on Ferritinophagy-Related Genes to Predict Prognosis in Lung Adenocarcinoma: Focus on AHNAK2. Bioengineering 2024, 11, 1070. [Google Scholar] [CrossRef]
  31. Liu, Y.; Wang, G.; Cui, T.; Lv, L. Adhesion GPR123 Is an Indicator for Recurrence and Prognosis in Bladder Cancer. Genes. Genom. 2021, 43, 1317–1325. [Google Scholar] [CrossRef]
  32. Hou, L.; Zhang, S.; Yu, W.; Yang, X.; Shen, M.; Hao, X.; Ren, X.; Sun, Q. Single-Cell Transcriptomics Reveals Tumor-Infiltrating B Cell Function after Neoadjuvant Pembrolizumab and Chemotherapy in Non-Small Cell Lung Cancer. J. Leukoc. Biol. 2024, 116, 555–564. [Google Scholar] [CrossRef]
Figure 1. Conceptual diagram of the experimental setup followed for identification of new lung cancer biomarker signatures using bioinformatic analysis, in vitro analysis, and ML analysis.
Biomedinformatics 05 00032 g001
Figure 2. Block diagram of bioinformatics analysis process.
Biomedinformatics 05 00032 g002
Figure 3. Block diagram of the LUAD vs. control identification from DNA microarray data using the validated in vitro gene features.
Biomedinformatics 05 00032 g003
Figure 4. (a) A T75 flask for growing Calu-3 cells (LUAD) at 90% confluency (Scale bar 50 μm, 40× magnification). (b) A T75 flask for growing MRC-5 cells (control) at 70% confluency (Scale bar 50 μm, 40× magnification).
Biomedinformatics 05 00032 g004
Figure 5. Fold change of gene expression (2−∆∆CT) for the five tested genes obtained via RT-qPCR, with statistical significance indicated (ns: non significant, **: statistically significant with p < 0.01, and ***: statistically significant with p < 0.001). SLC15A1 was significantly upregulated (p < 0.0032), whereas the genes GPR123 (p < 0.003), KNDC1 (p < 0.0002), and KCNAB2 (p < 0.0023) were significantly downregulated. There was no significant difference in the fold gene expression of the gene GPR183 (p < 0.4711).
Biomedinformatics 05 00032 g005
Table 1. Distribution of the samples of the GEO microarray data used.
CategoryTraining SamplesTest SamplesTotal Samples
LUAD30175376
Control9123114
Total39298490
Table 2. List of genes found upregulated or downregulated between LUAD and control groups.
Gene ID log 2   F C LASSOmRMR
KCNAB2−0.066271−0.00191295.929278
SLC15A10.0753760.00264239.628941
KNDC1−0.061559−0.00157736.992438
GPR123 (ADGRA1)0.0022070.0009410.575879
GPR183−0.005810.0000490.190521
Table 3. Top performing combinations of the five validated in vitro genes for LUAD vs. control identification.
Gene FeaturesOversamplingBest ML ModelAcc.F1PrecRecallSpec.AUC
SLC15A1, KNDC1NoET79.3980.6384.8279.3982.2487.85
SMOTESVM linear78.1674.8982.4574.1882.4587.94
KCNAB2, SLC15A1,
KNDC1
NoET82.6583.3485.7182.6580.8690.85
SMOTESVM linear82.6578.7883.5577.4083.5590.84
ADGRA1, KCNAB2, SLC15A1, KNDC1NoET84.0884.6086.1884.0880.0092.25
SMOTEET85.1079.9280.8679.5580.8691.72
ADGRA1, KCNAB2, SLC15A1, GPR183, KNDC1NoSVM linear83.6784.4987.1883.6784.7491.71
SMOTERF86.1281.5483.1181.5183.1191.46
Disclaimer/Publisher’s Note: The statements, opinions and data contained in all publications are solely those of the individual author(s) and contributor(s) and not of MDPI and/or the editor(s). MDPI and/or the editor(s) disclaim responsibility for any injury to people or property resulting from any ideas, methods, instructions or products referred to in the content.

