Deployment of an Automated Method Verification-Graphical User Interface (MV-GUI) Software
Abstract
1. Introduction
- Reviewing the method in terms of its purpose, sample preparation, instrumentation, and procedure.
- Planning and setting up the method verification experiment according to instructions, with necessary calculations or preparations.
- Establishing quality control procedures for ensuring consistently accurate results, complemented by ongoing monitoring.
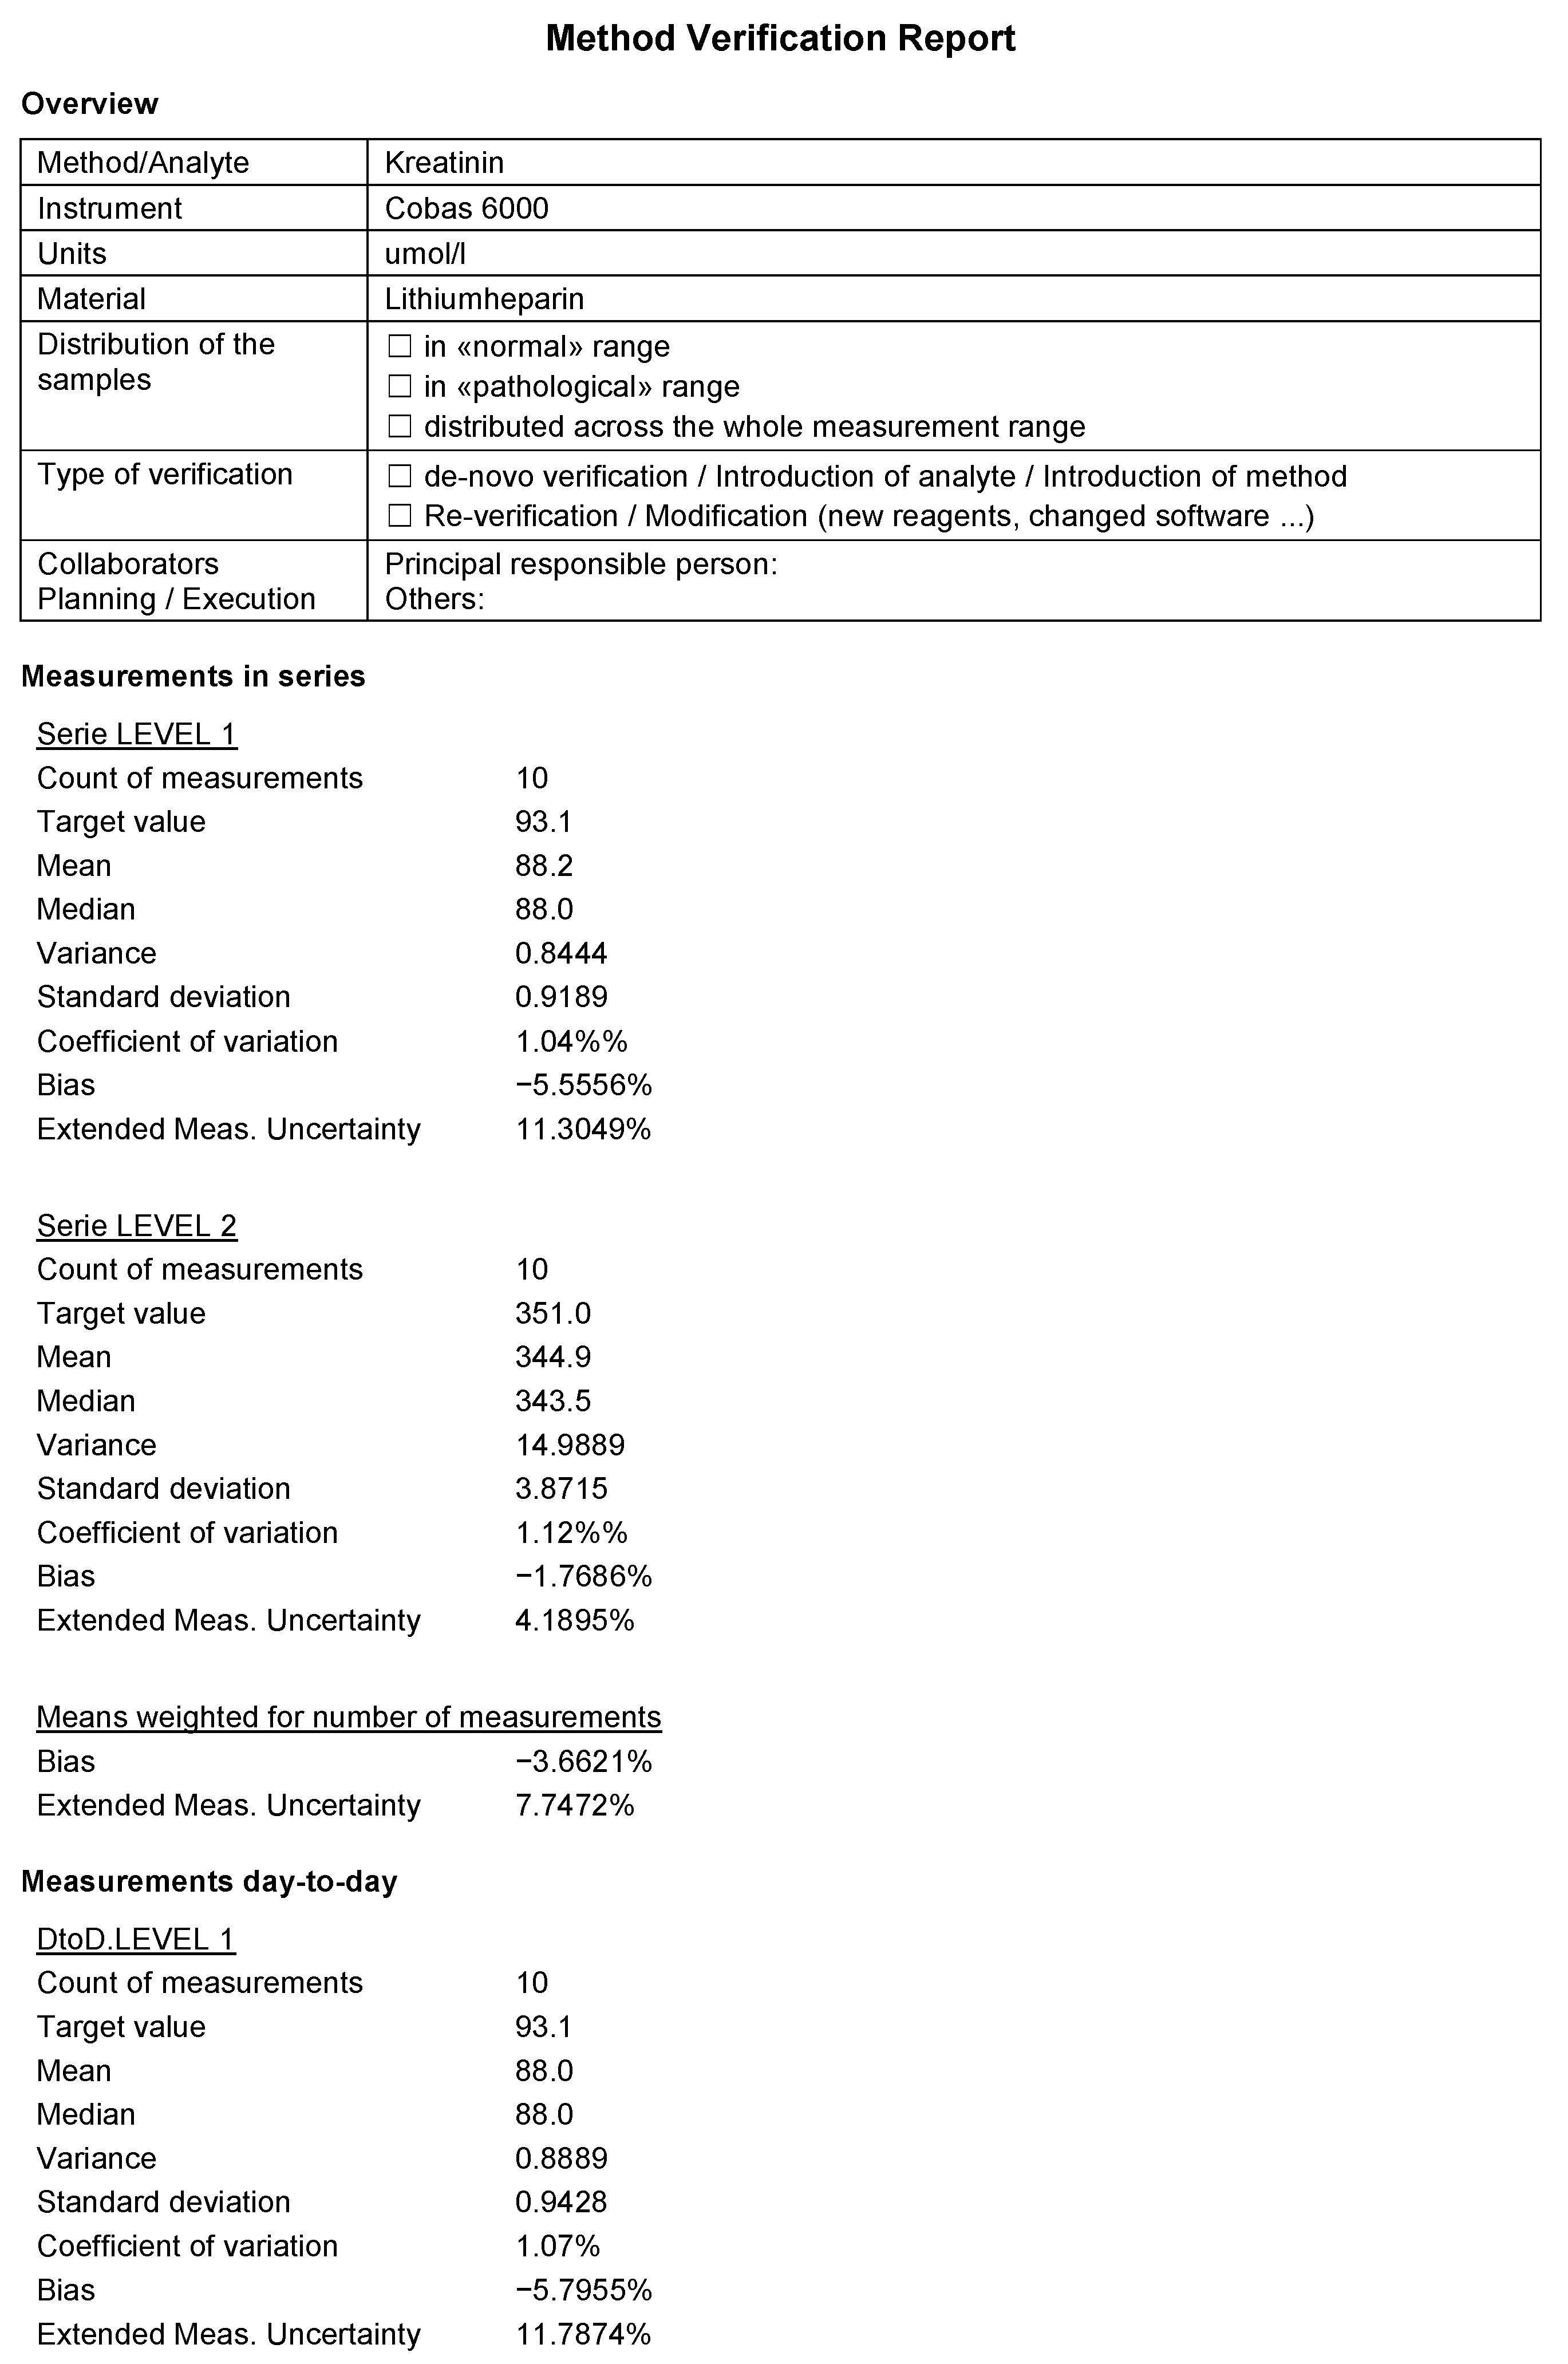
- Documenting the entire method verification process—from purpose to samples, results, and adjustments—for quality control and regulatory compliance.
- Simple descriptive statistics such as mean, median, variance, and standard deviation, which provides a quick overview of data.
- Coefficient of Variation (CV), a measure of the relative precision of a method.
- D’Agostino–Pearson test, a statistical test assessing whether a set of measurements follows a normal distribution [16].
- Bias, a measure of the systematic error in a measurement method.
- Measurement uncertainty, an estimate of the range within which the true value of the measure is likely to lie.
- Correlation methods such as Spearman, Pearson, and Kendall’s tau, used to evaluate the association between two measurement methods.
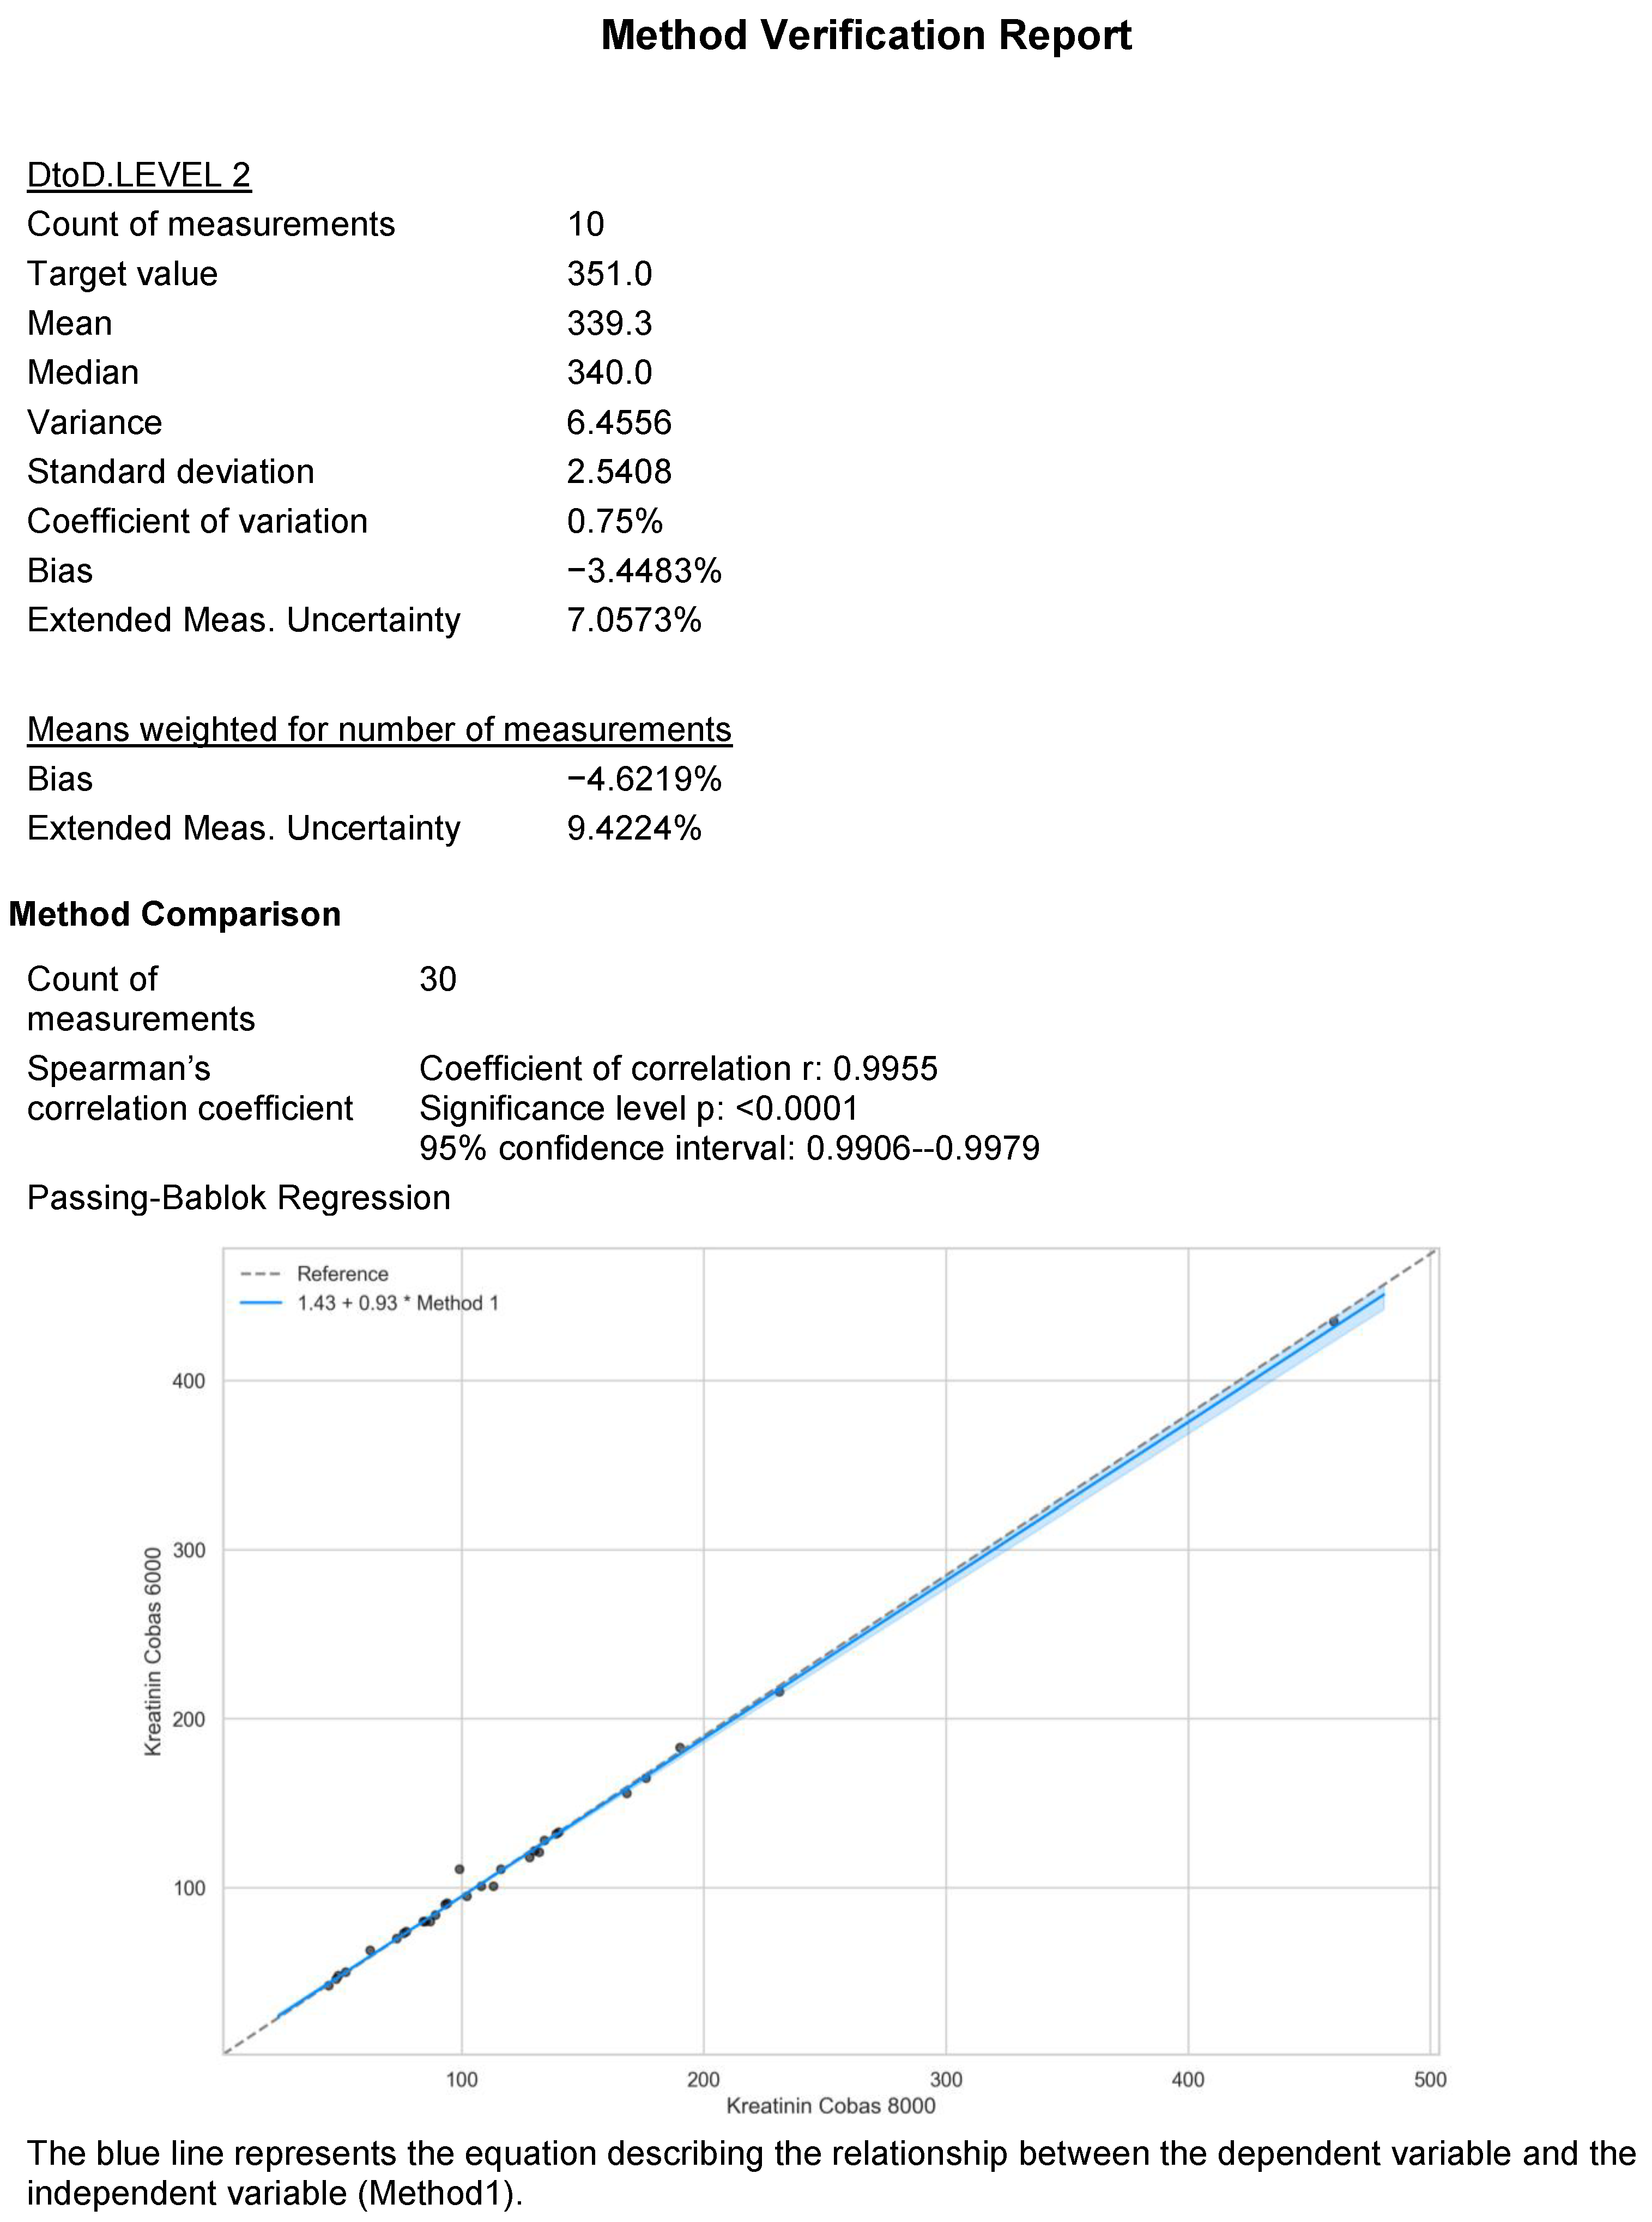
- Scatter plots, which visualize the relationship between two measurement methods, and Passing–Bablok regression, used to fit a line of best fit to the data in the scatter plot.
- Difference plots using Bland–Altman, a technique for evaluating the agreement between two measurement methods.
2. Materials and Methods
2.1. MV-GUI User Interface
Statistical Analysis
2.2. MV-GUI Design Philosophy
2.3. Implementation Details
2.3.1. Recommendations for Correlation Methods
2.3.2. Estimation of Bias and Measurement Uncertainty
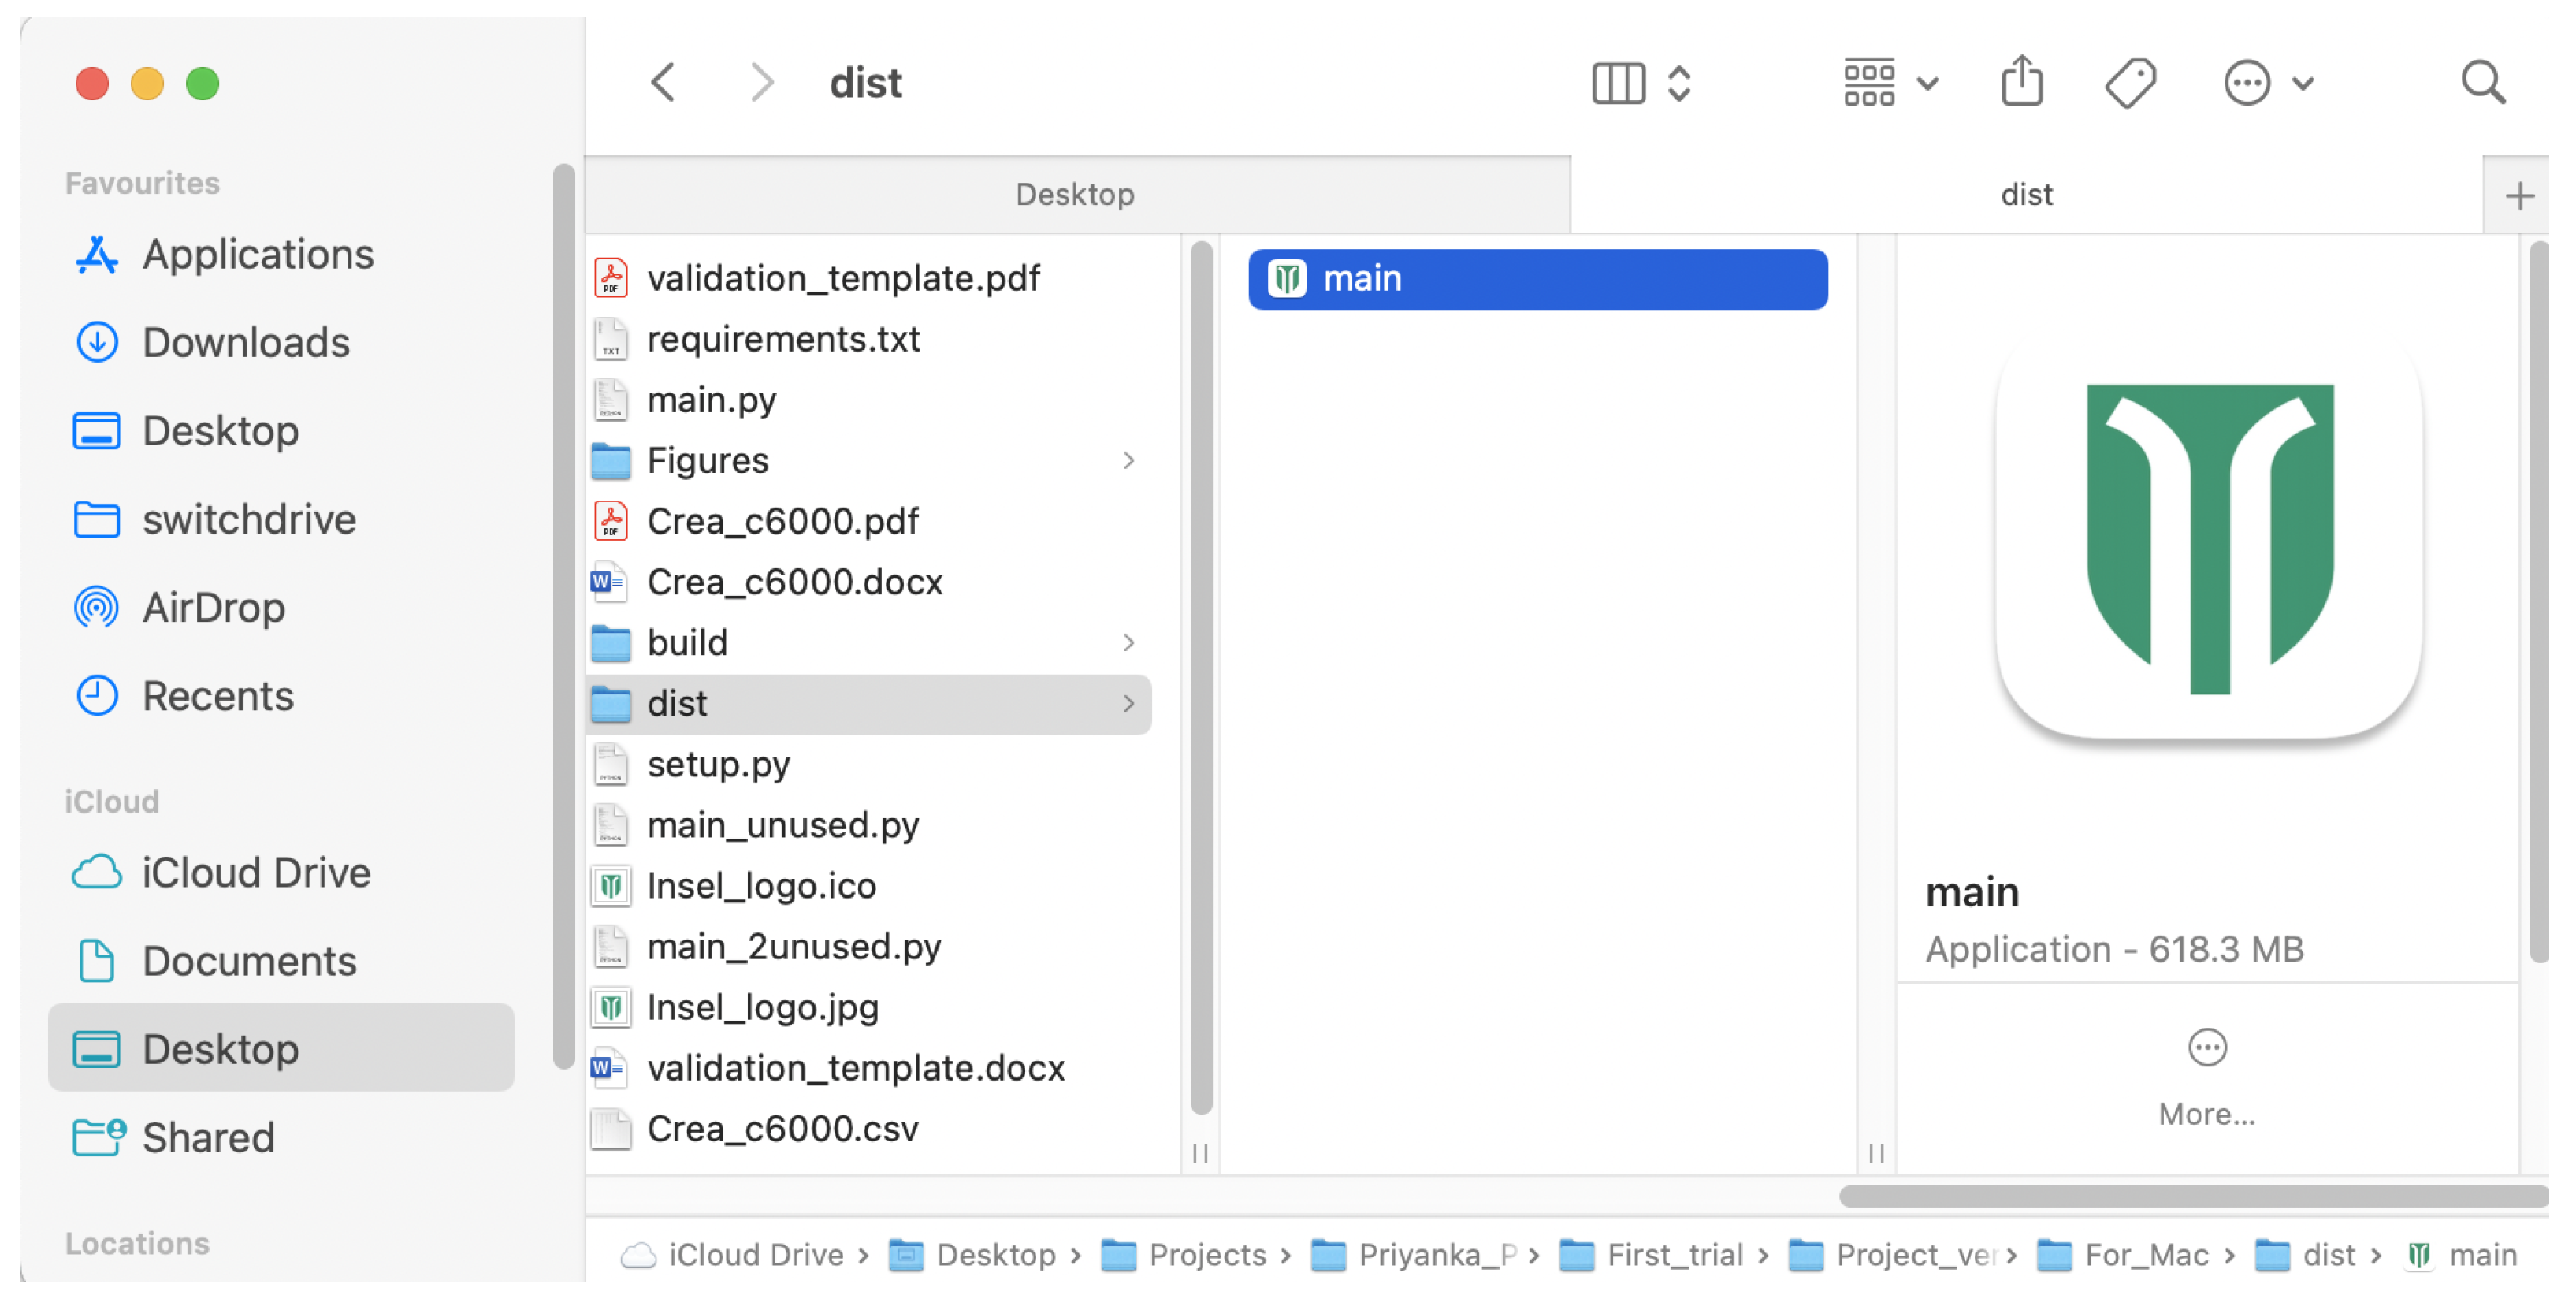
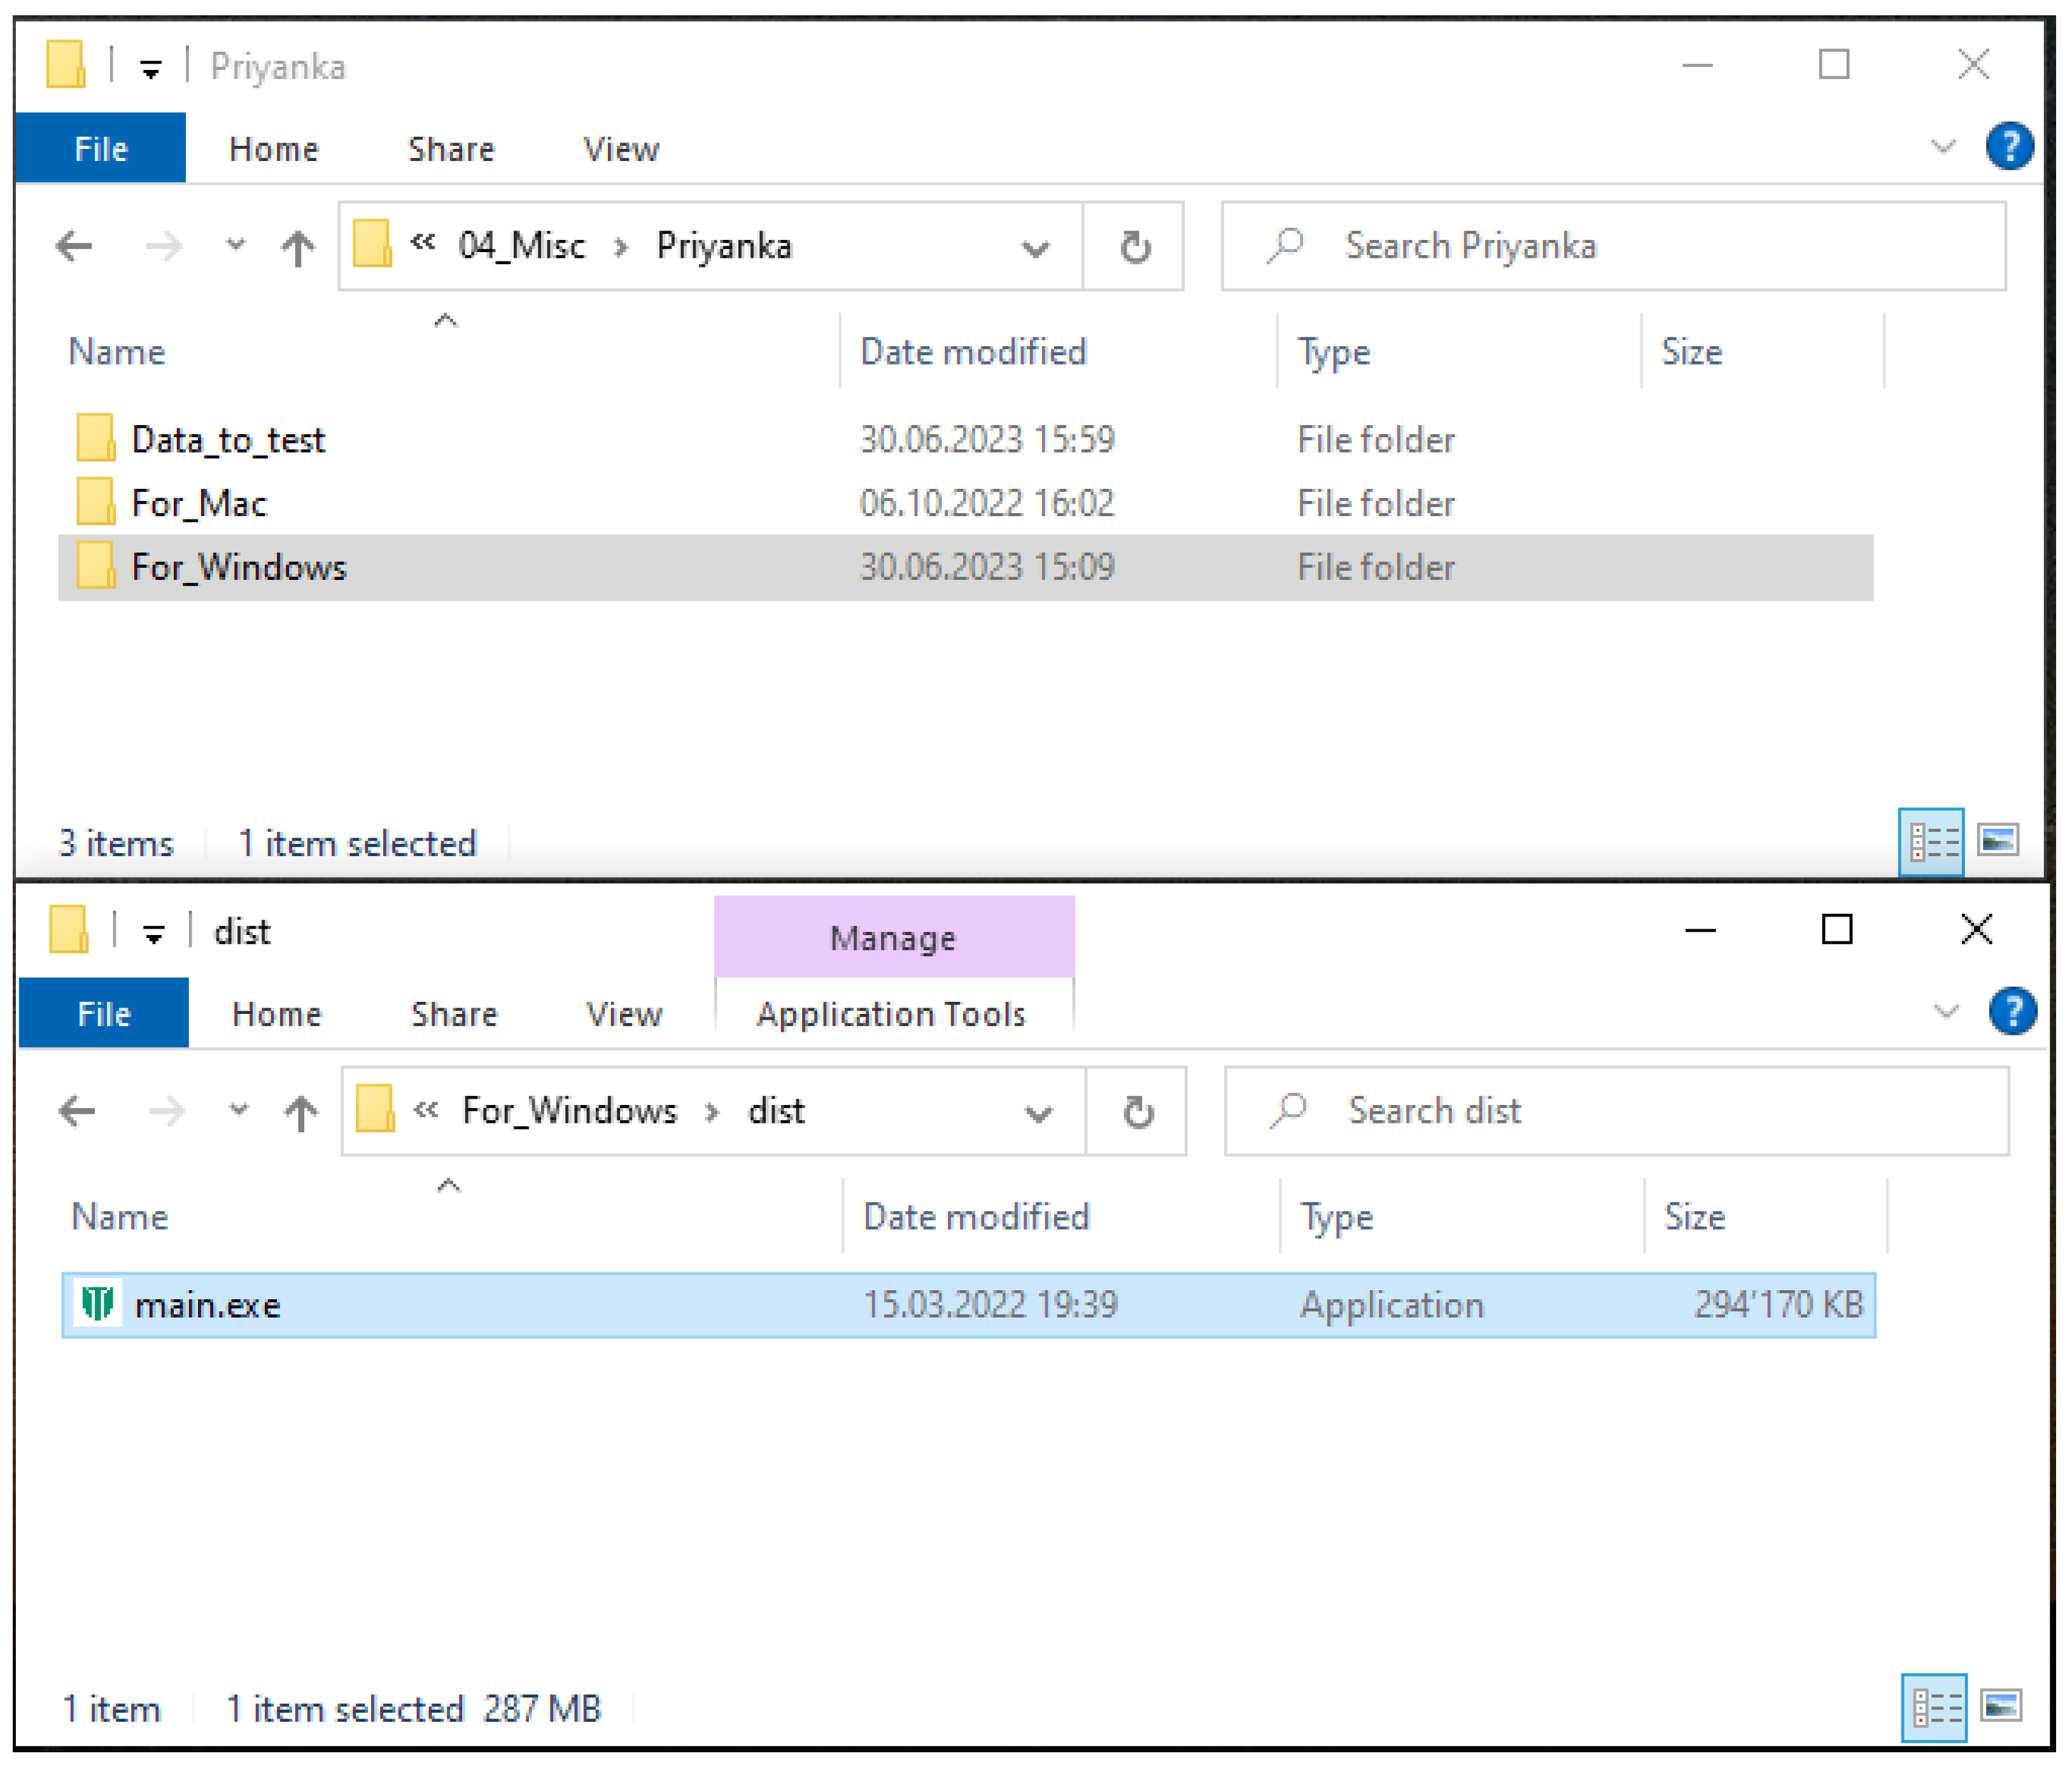
2.4. Deployment
2.4.1. Windows
2.4.2. macOS
2.5. Input .CSV File
2.6. Running MV-GUI
2.7. Comparison with Existing Tools
2.8. Outlook
3. Discussion
4. Conclusions
Author Contributions
Funding
Institutional Review Board Statement
Informed Consent Statement
Data Availability Statement
Acknowledgments
Conflicts of Interest
Abbreviations
| MV-GUI | Method Verification Graphical User Interface |
References
- Nichols, J.H. Verification of method performance for clinical laboratories. Adv. Clin. Chem. 2009, 47, 121–137. [Google Scholar] [PubMed]
- US-FDA. US-Food and Drug Administration (US-FDA). Available online: https://www.fda.gov/ (accessed on 26 June 2023).
- QUALAB. Die Schweizerische Kommission für Qualitätssicherung im Medizinischen Labor (QUALAB). Available online: https://www.qualab.ch/ (accessed on 26 June 2023).
- CLSI. Clinical and Laboratory Standards Institute (CLSI). Available online: https://clsi.org/ (accessed on 26 June 2023).
- CE. Conformité Européenne (CE). Available online: https://ec.europa.eu/growth/single-market/ce-marking_en (accessed on 26 June 2023).
- U.S. Food and Drug Administration (FDA). FDA Premarket Approval (PMA). Available online: https://www.fda.gov/medical-devices/premarket-submissions/premarket-approval-pma (accessed on 26 June 2023).
- Choudhary, P.; Nagaraja, H. Measuring Agreement: Models, Methods, and Applications; John Wiley & Sons: Hoboken, NJ, USA, 2017; pp. 1–336. [Google Scholar] [CrossRef]
- Pum, J. A practical guide to validation and verification of analytical methods in the clinical laboratory. Adv. Clin. Chem. 2019, 90, 215–281. [Google Scholar] [PubMed]
- Lee, M.; Chou, C. Laboratory method for inertial profiler verification. J. Chin. Inst. Eng. 2010, 33, 617–627. [Google Scholar] [CrossRef]
- de Beer, R.R.; Wielders, J.; Boursier, G.; Vodnik, T.; Vanstapel, F.; Huisman, W.; Vukasović, I.; Vaubourdolle, M.; Sönmez, Ç.; Linko, S.; et al. Validation and verification of examination procedures in medical laboratories: Opinion of the EFLM Working Group Accreditation and ISO/CEN standards (WG-A/ISO) on dealing with ISO 15189:2012 demands for method verification and validation. Clin. Chem. Lab. Med. (CCLM) 2020, 58, 361–367. [Google Scholar] [CrossRef] [PubMed]
- Abdel, G.M.T.; El-Masry, M.I. Verification of quantitative analytical methods in medical laboratories. J. Med. Biochem. 2021, 40, 225–236. [Google Scholar] [CrossRef] [PubMed]
- Bablok, W.; Passing, H.; Bender, R.; Schneider, B. A general regression procedure for method transformation. Application of linear regression procedures for method comparison studies in clinical chemistry, Part III. J. Clin. Chem. Clin. Biochem. 1988, 26, 783–790. [Google Scholar] [CrossRef] [PubMed]
- Ranganathan, P.; Pramesh, C.; Aggarwal, R. Common pitfalls in statistical analysis: Measures of agreement. Perspect. Clin. Res. 2017, 8, 187. [Google Scholar] [CrossRef] [PubMed]
- Valdivieso-Gómez, V.; Aguilar-Quesada, R. Quality Management Systems for Laboratories and External Quality Assurance Programs. In Quality Control in Laboratory; Zaman, G.S., Ed.; IntechOpen: Rijeka, Croatia, 2018; Chapter 3. [Google Scholar] [CrossRef]
- Menditto, A.; Patriarca, M.; Magnusson, B. Understanding the meaning of accuracy, trueness and precision. Accredit. Qual. Assur. 2007, 12, 45–47. [Google Scholar] [CrossRef]
- Ghasemi-ji, A.; Zahediasl, S. Normality tests for statistical analysis: A guide for non-statisticians. Int. J. Endocrinol. Metab. 2012, 10, 486–489. [Google Scholar] [CrossRef] [PubMed]
- Van Rossum, G.; Drake, F.L. Python 3 Reference Manual; CreateSpace: Scotts Valley, CA, USA, 2009. [Google Scholar]
- Harris, C.R.; Millman, K.J.; van der Walt, S.J.; Gommers, R.; Virtanen, P.; Cournapeau, D.; Wieser, E.; Taylor, J.; Berg, S.; Smith, N.J.; et al. Array programming with NumPy. Nature 2020, 585, 357–362. [Google Scholar] [CrossRef] [PubMed]
- McKinney, W. Data Structures for Statistical Computing in Python. In Proceedings of the 9th Python in Science Conference, Austin, TX, USA, 28 June–3 July 2010; pp. 56–61. [Google Scholar] [CrossRef]
- The Pandas Development Team. Pandas-Dev/Pandas: Pandas. 2020. Available online: https://zenodo.org/record/8092754 (accessed on 26 June 2023).
- Waskom, M.; Botvinnik, O.; O’Kane, D.; Hobson, P.; Lukauskas, S.; Gemperline, D.C.; Augspurger, T.; Halchenko, Y.; Cole, J.B.; Warmenhoven, J.; et al. Mwaskom/Seaborn: V0.8.1 (September 2017). 2017. Available online: https://zenodo.org/record/883859 (accessed on 26 June 2023).
- Hunter, J.D. Matplotlib: A 2D Graphics Environment. Comput. Sci. Eng. 2007, 9, 90–95. [Google Scholar] [CrossRef]
- Lundh, F. An Introduction to Tkinter. 1999. Available online: https://doc.lagout.org/programmation/Introduction%20to%20Tkinter.pdf (accessed on 26 June 2023).
- Pagano, M.; Gauvreau, K. Principles of Biostatistics, 2nd ed.; Duxbury: Pacific Grove, CA, USA, 2000. [Google Scholar]
- Chowdhry, A.K. Principles of Biostatistics. J. R. Stat. Soc. Ser. A Stat. Soc. 2023, qnad038. [Google Scholar] [CrossRef]
- Carstensen, B.; Gurrin, L.; Ekstrøm, C.T.; Figurski, M. MethComp: Analysis of Agreement in Method Comparison Studies, 2022. R Package Version 1.30.0. Available online: https://cran.r-project.org/web/packages/MethComp/MethComp.pdf (accessed on 26 June 2023).
- Caldwell, A. SimplyAgree: Flexible and Robust Agreement and Reliability Analyses, 2022. R Package Version 0.1.2. Available online: https://cran.r-project.org/web/packages/SimplyAgree/SimplyAgree.pdf (accessed on 26 June 2023).
- Loh, T.P.; Markus, C.; Tan, C.H.; Tran, M.T.C.; Sethi, S.K.; Lim, C.Y. Lot-to-lot variation and verification. Clin. Chem. Lab. Med. (CCLM) 2023, 61, 769–776. [Google Scholar] [CrossRef] [PubMed]
- Loh, T.P.; Cooke, B.R.; Markus, C.; Zakaria, R.; Tran, M.T.C.; Ho, C.S.; Greaves, R.F.; On behalf of the IFCC Working Group on Method Evaluation Protocols. Method evaluation in the clinical laboratory. Clin. Chem. Lab. Med. 2022, 61, 751–758. [Google Scholar] [CrossRef]
- Algeciras-Schimnich, A.; Bruns, D.E.; Boyd, J.C.; Bryant, S.C.; La Fortune, K.A.; Grebe, S.K. Failure of Current Laboratory Protocols to Detect Lot-to-Lot Reagent Differences: Findings and Possible Solutions. Clin. Chem. 2013, 59, 1187–1194. [Google Scholar] [CrossRef] [PubMed]
- Sikaris, K.; Pehm, K.; Wallace, M.; Picone, D.A.M.; Frydenberg, M. Review of Serious Failures in Reported Test Results for Prostate-Specific Antigen (PSA) Testing of Patients by SA Pathology. Australian Commission on Safety and Quality in Health Care. 2016. Available online: https://www.sahealth.sa.gov.au/wps/wcm/connect/2e6fe1804db32ea69009f9aaaf0764d6/ACSQHC+-+PSA+Review+-+SA+Pathology.pdf?MOD=AJPERES&CACHEID=ROOTWORKSPACE-2e6fe1804db32ea69009f9aaaf0764d6-nwMqsAA (accessed on 20 June 2023).
- Schlattmann, P. Statistics in diagnostic medicine. Clin. Chem. Lab. Med. 2022, 60, 801–807. [Google Scholar] [CrossRef] [PubMed]
- Trisovic, A.; Lau, M.K.; Pasquier, T.; Crosas, M. A large-scale study on research code quality and execution. Sci. Data 2022, 9, 60. [Google Scholar] [CrossRef] [PubMed]




| Statistical Tool | Where Used in Script | Description |
|---|---|---|
| Descriptive Statistics (Mean, Median, Variance, Standard Deviation, Coefficient of Variation) | Series.fmean(), Series.fmedian(), Series.fvar(), Series.fstd(), Series.fcv() | Calculates the central tendency, dispersion, and relative variability of a series. |
| Bias and Measurement Uncertainty Calculation | Series.fbias(), Series.fmu() | Computes systematic deviation from a target value and estimates the expected deviation from the true value. |
| Normality Tests (D’Agostino–Pearson, Kolmogorov–Smirnov, Shapiro–Wilk) | Series.fnt(), Series.fks(), Series.fsw() | Assesses if a series follows a specific (usually Gaussian) distribution. |
| Q-Q Plot | Series.fqqplot() | Visual tool to inspect the normality of a series. |
| Comparative Analysis (Passing–Bablok Regression, Bland–Altman Plot) | Comparison.fpb(), Comparison.fba() | Analyzes the agreement and robustness to outliers between two series. |
| Aggregate Analysis (Sample-Size Weighted Mean of Bias and Measurement Uncertainty) | MethodEvaluation.fwbiasmu() | Aggregates bias and measurement uncertainty using sample size weights. |
| Correlation Analysis (Pearson, Spearman, Kendall Tau) and Significance Testing (p-Value, Confidence Interval) | Correlation.regression_ci() with method = ‘pearson’, ‘spearman’, ‘kendall’ | Measures the relationship between two series, calculates its significance and determines the confidence interval. |
| Correlation Coefficient | Appropriate Usage | Assumptions | Advantages | Drawbacks |
|---|---|---|---|---|
| Pearson’s r | When variables are continuous, and the aim is to measure the linear relationship between them. | Assumes that the relationship between variables is linear and that the data are normally distributed. | Widely used and easily interpretable. Measures the strength and direction of the linear relationship between variables. | Assumes a linear relationship and is sensitive to outliers. |
| Spearman’s rho | When data are ordinal or not normally distributed, and the aim is to measure the monotonic relationship between variables. | Assumes that the relationship between variables is monotonic (i.e., variables tend to change together, but not necessarily at a constant rate). | Can capture non-linear relationships and is robust to outliers. Suitable for ranked or ordinal data. | Ignores the magnitude of differences between data points, focusing only on their rank orders. |
| Kendall’s tau | When data are ordinal or not normally distributed, and the aim is to measure the strength and direction of the rank-order relationship between variables. | Assumes that the relationship between variables is monotonic. | Suitable for ranked or ordinal data and is robust to outliers. Measures the concordance between variables. | Does not capture the magnitude of differences between data points. |
Disclaimer/Publisher’s Note: The statements, opinions and data contained in all publications are solely those of the individual author(s) and contributor(s) and not of MDPI and/or the editor(s). MDPI and/or the editor(s) disclaim responsibility for any injury to people or property resulting from any ideas, methods, instructions or products referred to in the content. |
© 2023 by the authors. Licensee MDPI, Basel, Switzerland. This article is an open access article distributed under the terms and conditions of the Creative Commons Attribution (CC BY) license (https://creativecommons.org/licenses/by/4.0/).
Share and Cite
Nagabhushana, P.; Rütsche, C.; Nakas, C.; Leichtle, A.B. Deployment of an Automated Method Verification-Graphical User Interface (MV-GUI) Software. BioMedInformatics 2023, 3, 632-648. https://doi.org/10.3390/biomedinformatics3030043
Nagabhushana P, Rütsche C, Nakas C, Leichtle AB. Deployment of an Automated Method Verification-Graphical User Interface (MV-GUI) Software. BioMedInformatics. 2023; 3(3):632-648. https://doi.org/10.3390/biomedinformatics3030043
Chicago/Turabian StyleNagabhushana, Priyanka, Cyrill Rütsche, Christos Nakas, and Alexander B. Leichtle. 2023. "Deployment of an Automated Method Verification-Graphical User Interface (MV-GUI) Software" BioMedInformatics 3, no. 3: 632-648. https://doi.org/10.3390/biomedinformatics3030043
APA StyleNagabhushana, P., Rütsche, C., Nakas, C., & Leichtle, A. B. (2023). Deployment of an Automated Method Verification-Graphical User Interface (MV-GUI) Software. BioMedInformatics, 3(3), 632-648. https://doi.org/10.3390/biomedinformatics3030043


