Article

Long-Term Geospatial Monitoring of Quarry Expansion Using Landsat Time Series and LandTrendr: A Case Study of Dargov Hill, Slovakia


by
Zofia Kuzevicova
1,*,
Stefan Kuzevic
2,
Diana Bobikova
1,
Michal Roman
2 and
Miroslava Stolična Vancova
2
1
Institute of Geodesy, Cartography and Geographical Information Systems, Faculty of Mining, Ecology, Process Control and Geotechnologies, Technical University of Kosice, Letna 9, 042 00 Kosice, Slovakia
2
Institute of Earth Resources, Faculty of Mining, Ecology, Process Control and Geotechnologies, Technical University of Kosice, Letna 9, 042 00 Kosice, Slovakia
*
Author to whom correspondence should be addressed.
Geomatics 2026, 6(5), 98; https://doi.org/10.3390/geomatics6050098
Submission received: 20 July 2026 / Revised: 24 August 2026 / Accepted: 26 August 2026 / Published: 1 September 2026

Abstract

Surface mining significantly alters land cover and vegetation, making long-term monitoring essential for assessing its environmental impacts. The objective of this study was to analyze the long-term development of the active Dargov quarry (Slovakia) during the period 2009–2025 using Landsat image time series. Changes in vegetation cover and exposed surfaces were assessed using the NDVI, BSI, and NDBI spectral indices in combination with the Mann–Kendall test, Sen’s slope estimator, and the LandTrendr algorithm. The results revealed a gradual decline in NDVI values accompanied by a concurrent increase in BSI and NDBI values within the active quarry, reflecting the expansion of exposed rock and soil surfaces associated with ongoing mining. Statistically significant trends (p < 0.05) were identified in 76.36% of NDVI pixels, 65.45% of BSI pixels, and 63.64% of NDBI pixels within the deposit boundary. The relationships between spectral indices and quarry production were also evaluated using Pearson’s correlation analysis. The spectral indices showed a substantially stronger relationship with cumulative quarry production than with annual production. The LandTrendr algorithm identified the most pronounced vegetation-cover changes primarily during 2019–2024, with 70.91% of the pixels in the Time of Largest Change output within the deposit boundary falling within this period. The proposed methodology provided a comprehensive assessment of the spatial and temporal patterns of changes associated with surface mining at the Dargov quarry and demonstrated its potential to support environmental monitoring, environmental impact assessment (EIA), and mineral resource management.

1. Introduction

The extraction of mineral resources is an integral component of economic development. In the European Union, the extraction of construction materials, particularly aggregates, represents the largest subsector of non-energy mineral extraction in terms of both production volume and economic value [1]. The European Union promotes the principles of sustainable mineral resource extraction throughout the entire life cycle of mining activities, from geological exploration and extraction to mineral processing, mine closure, site restoration, and the recovery of secondary raw materials from mining waste [2]. This approach aims to ensure that mineral extraction is carried out in accordance with environmental requirements established by European legislation and strategic policy documents addressing environmental protection and the sustainable use of natural resources [3,4].
Surface mining is the most common method of extracting construction materials and is one of the human activities with the greatest impact on the landscape. By altering land cover and topography, it can lead to environmental problems such as land degradation, loss of vegetation cover, soil erosion, and terrain modification [5,6]. Conversely, well-planned and properly implemented environmental measures, including progressive reclamation and post-mining site restoration, can mitigate these adverse impacts and promote ecological landscape restoration [7,8,9]. Vegetation cover is a key indicator of landscape condition and the intensity of anthropogenic disturbance, as it reflects changes in land use and the state of the natural environment [10,11].
Earth observation data play a key role in monitoring land use and land-cover dynamics and have become an essential source of information for assessing anthropogenic changes in ecosystems at local, regional, and global scales [12,13]. Combined with geographic information systems (GIS), satellite data enable effective analyses of the spatial extent, intensity, and temporal evolution of changes in land cover and vegetation in areas affected by human activities [14,15,16]. Landsat imagery is one of the principal data sources for long-term monitoring of land-cover change, providing a unique archive for analyzing landscape evolution over extended time periods [17,18]. In recent years, land-cover monitoring has increasingly incorporated advanced image-processing techniques, including machine learning and deep learning algorithms, which have improved the accuracy of land-cover classification and change detection [19,20].
One of the most widely used approaches for assessing the environmental impacts of human activities is the analysis of spectral indices derived from satellite imagery [21,22]. The Normalized Difference Vegetation Index (NDVI) is one of the most applied vegetation indices for evaluating vegetation condition, detecting changes in vegetation cover, and monitoring its temporal dynamics from satellite imagery [23], including in areas affected by surface mining [24,25]. In addition to NDVI, the Normalized Difference Built-up Index (NDBI) is widely used to identify built-up areas and other anthropogenically modified surfaces [26,27], while the Bare Soil Index (BSI) enables the identification of exposed soil and rock surfaces [28,29].
Several studies have demonstrated that combining multiple spectral indices provides a more comprehensive assessment of land-cover changes caused by surface mining than the use of a single index, as it enables the simultaneous detection of changes in vegetation cover, the expansion of exposed surfaces, and the intensity of anthropogenic disturbance [30,31,32,33].
Time-series analysis has become an important approach for assessing long-term changes in spectral indices, enabling the identification of the direction, magnitude, and statistical significance of changes in vegetation cover and landscape conditions. Among the most widely used nonparametric methods are the Mann–Kendall test and Sen’s slope estimator, which together provide robust information on the direction and magnitude of long-term trends [32,33,34]. In addition to conventional trend analysis, temporal segmentation algorithms such as LandTrendr [35,36] are increasingly applied to characterize the temporal dynamics of landscape change. The LandTrendr algorithm identifies the timing, duration, and magnitude of significant changes in vegetation cover through the analysis of satellite image time series [37,38].
Although the number of studies investigating surface mining using remote sensing has increased considerably in recent years, most have focused on individual spectral indices or standalone change detection methods. The combined use of the NDVI, BSI, and NDBI spectral indices together with nonparametric trend analysis (the Mann–Kendall test and Sen’s slope estimator) and the LandTrendr algorithm for long-term monitoring of active quarries has received limited attention, particularly in Slovakia and Central Europe.
The objective of this study was to analyze long-term changes in vegetation cover and exposed surfaces in the Dargov quarry (Slovakia) during the period 2009–2025 using Landsat image time series. To achieve this, the NDVI, BSI, and NDBI spectral indices were combined with the Mann–Kendall test, Sen’s slope estimator, and the LandTrendr algorithm to identify the direction, magnitude, statistical significance, and temporal dynamics of changes associated with the expansion of surface mining.
The specific contribution of this study lies not in the development of new methods, but in their integrated application within a unified analytical framework for the long-term monitoring of an active surface quarry. The selected spectral indices provide complementary information on vegetation loss and the expansion of exposed surfaces. The Mann–Kendall test and Sen’s slope estimator characterize the direction, magnitude, and statistical significance of long-term trends, while LandTrendr adds a temporal dimension by identifying the periods of the most pronounced changes. The integration of these approaches therefore provides a comprehensive assessment of the nature, spatial distribution, statistical significance, and temporal progression of changes associated with active surface mining.

2. Materials and Methods

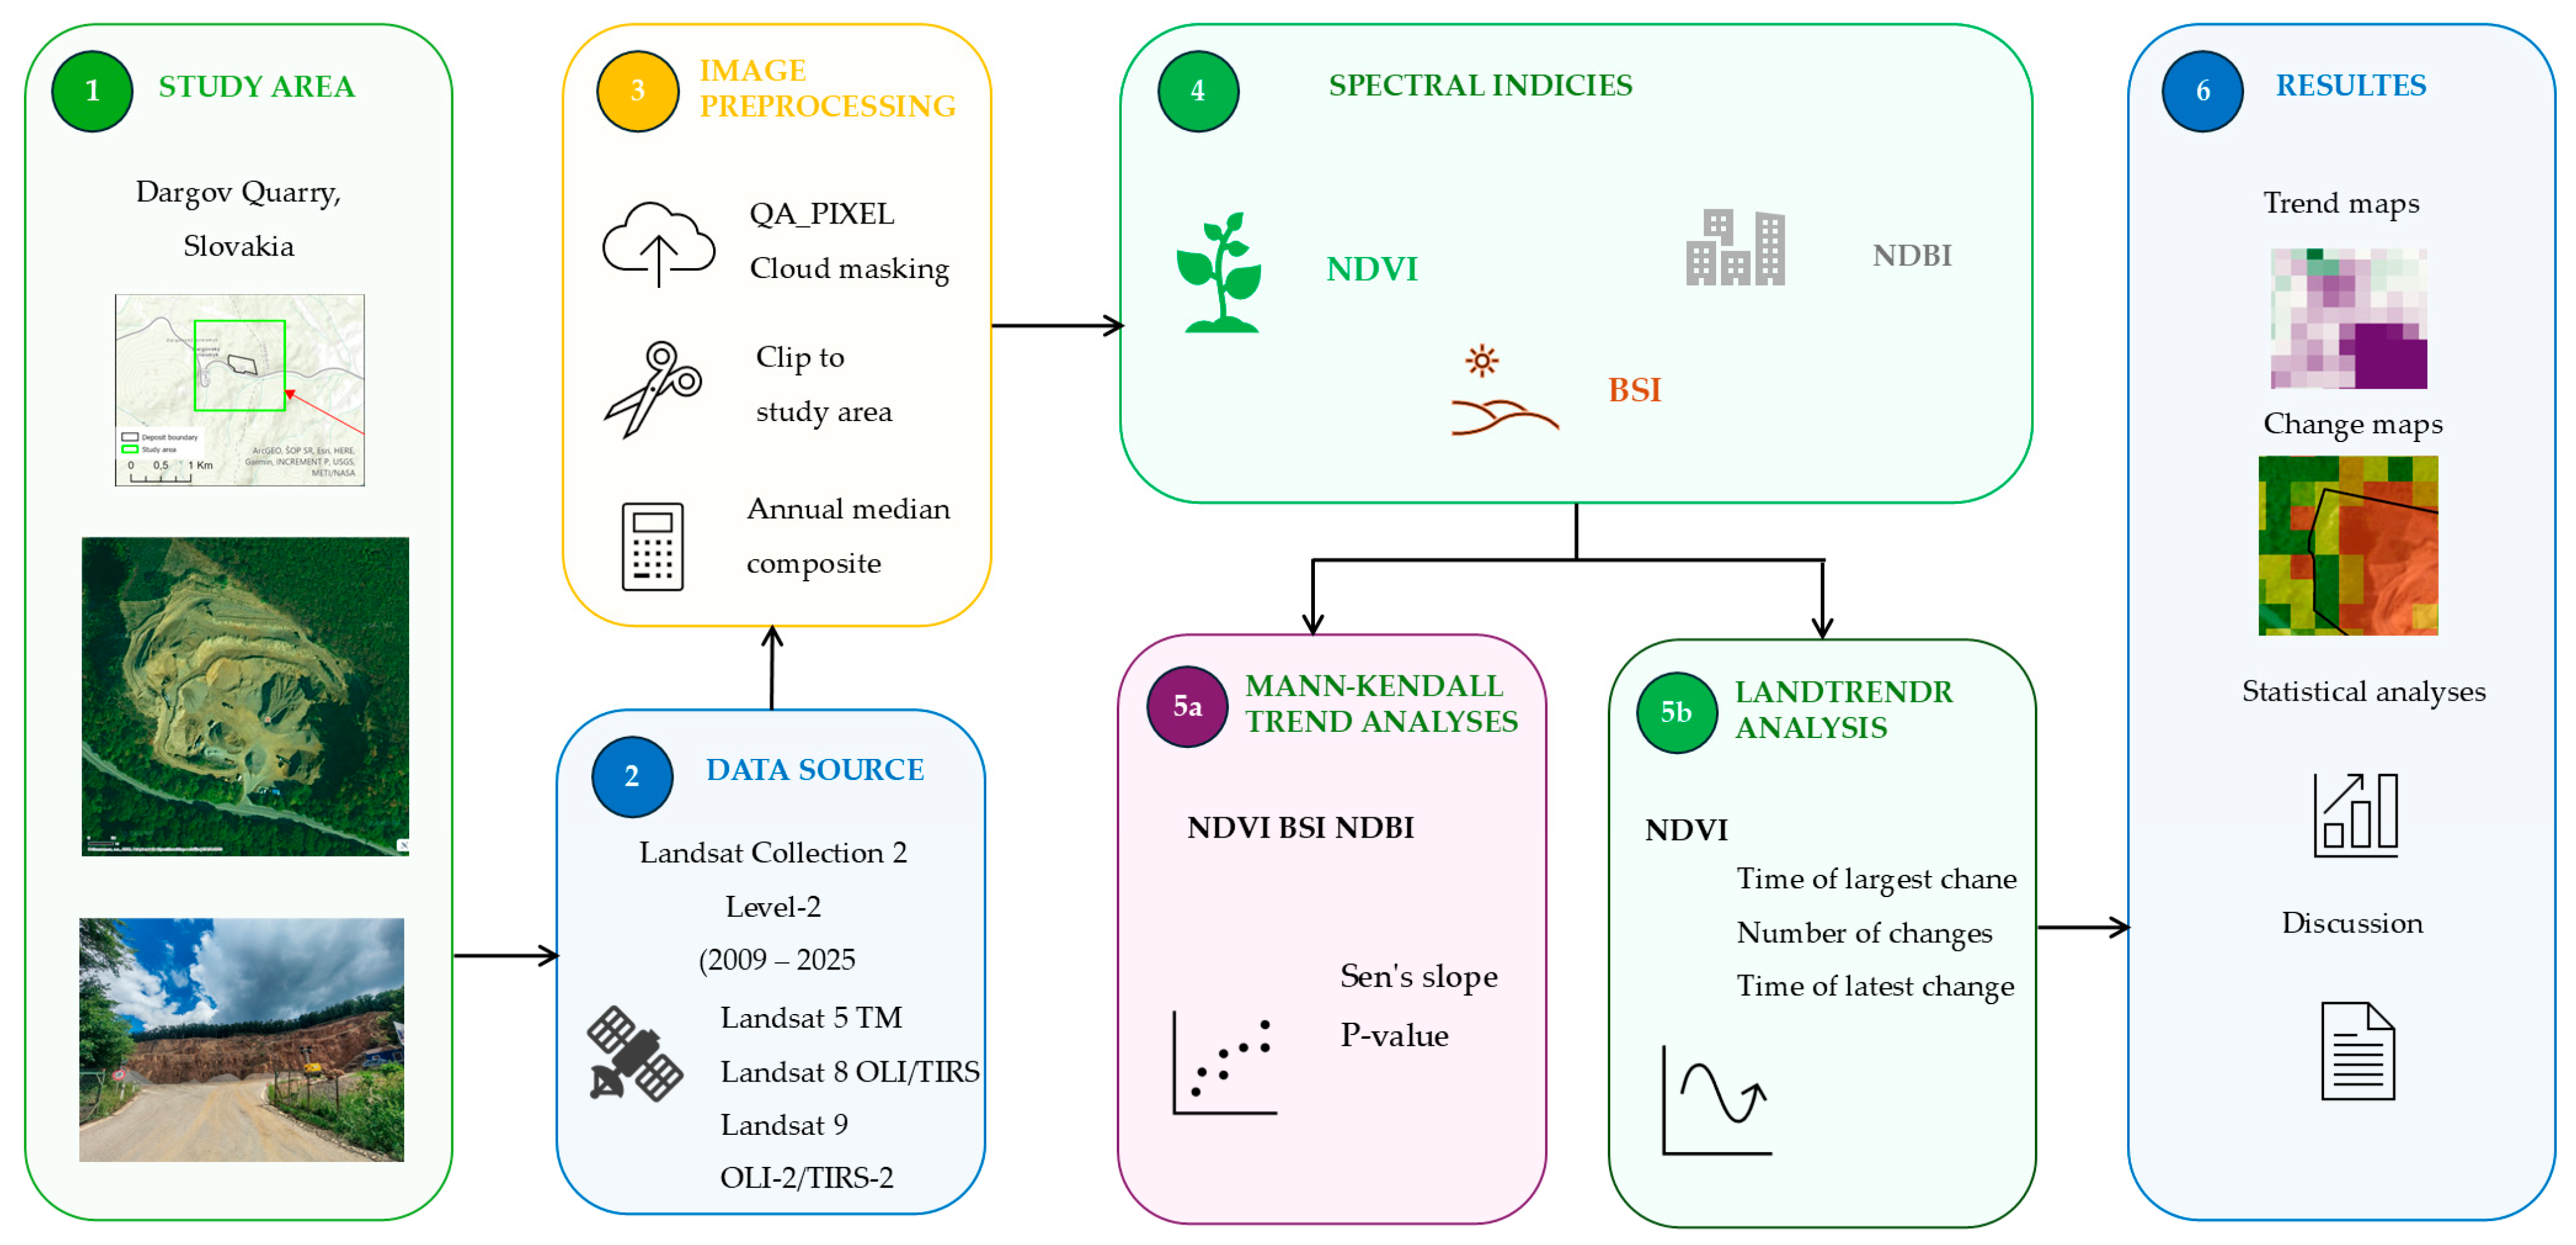
The methodological workflow consisted of the following steps: study area selection, acquisition and preprocessing of Landsat image time series, calculation of the NDVI, BSI, and NDBI spectral indices, long-term trend analysis using the Mann–Kendall test and Sen’s slope estimator, correlation analysis of spectral indices and quarry production, and identification of the temporal dynamics of changes using the LandTrendr algorithm (Figure 1).
The input data were obtained from publicly available sources and processed using ArcGIS Pro 3.5. All spatial analyses were performed in the WGS 84/UTM Zone 34N coordinate reference system (EPSG:32634).

2.1. Study Area

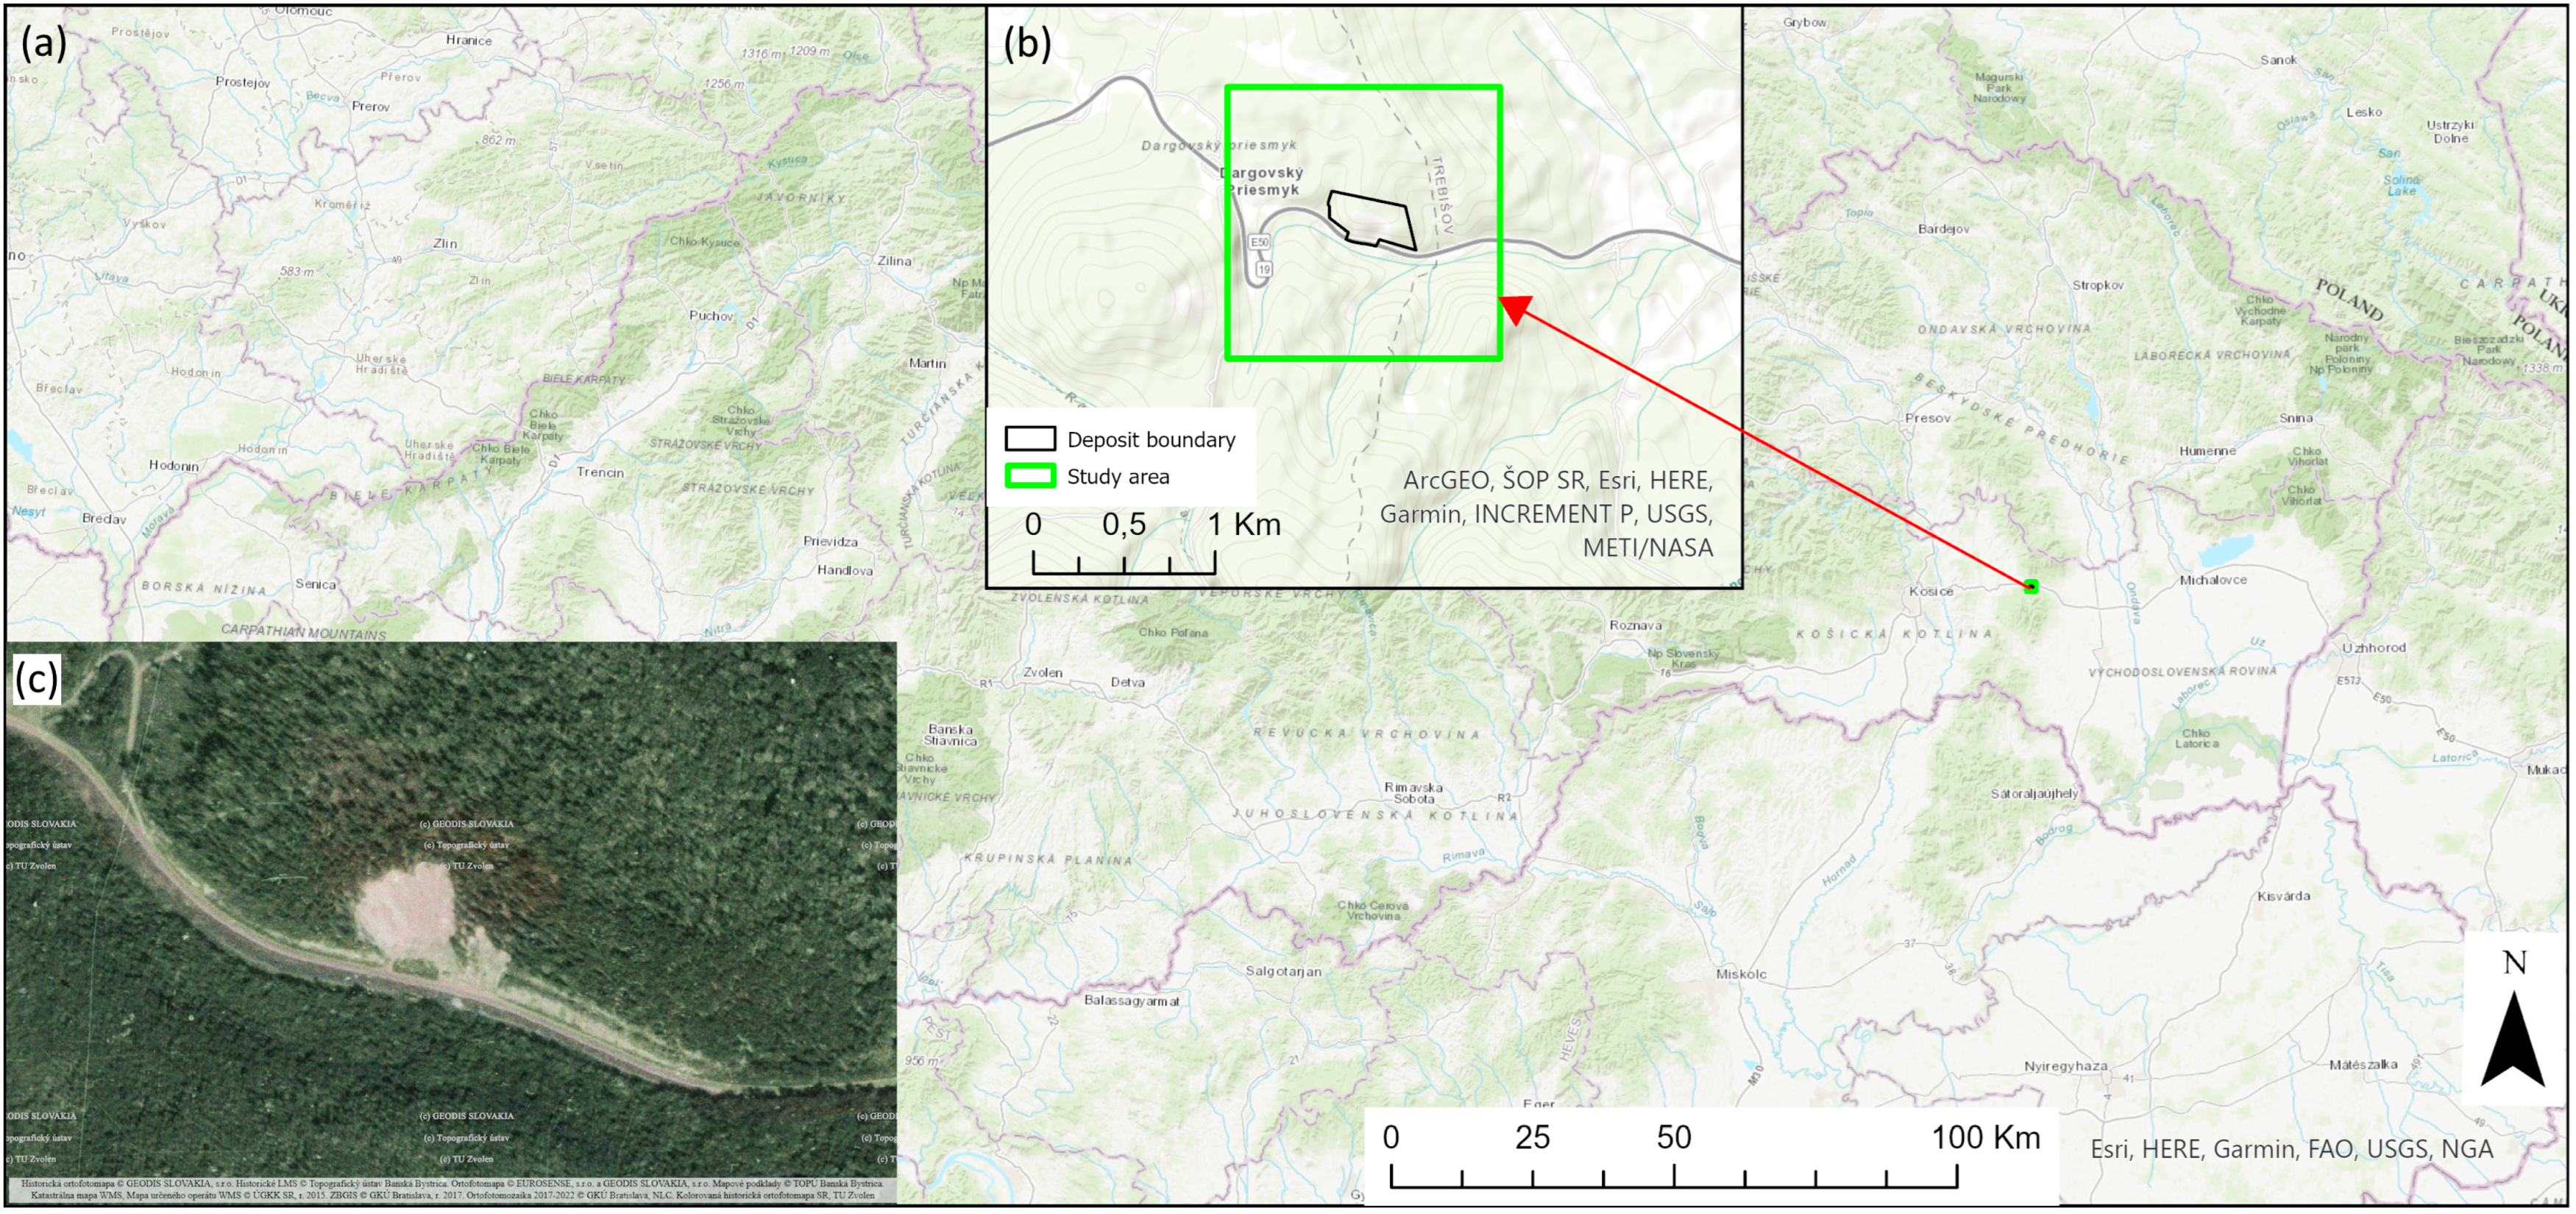
The study area was the Dargov quarry, located in the Košice Region of eastern Slovakia (Figure 2a). The quarry exploits an andesite deposit by means of bench surface mining using drilling and blasting operations in combination with mechanized excavation equipment [34]. The study area was defined as a 1500 × 1500 m square centered on the active quarry, ensuring complete coverage of the mining area and its immediate surroundings (Figure 2b). Elevation ranges from approximately 381 m above sea level at the quarry floor to 457 m above sea level at the highest point within the study area.
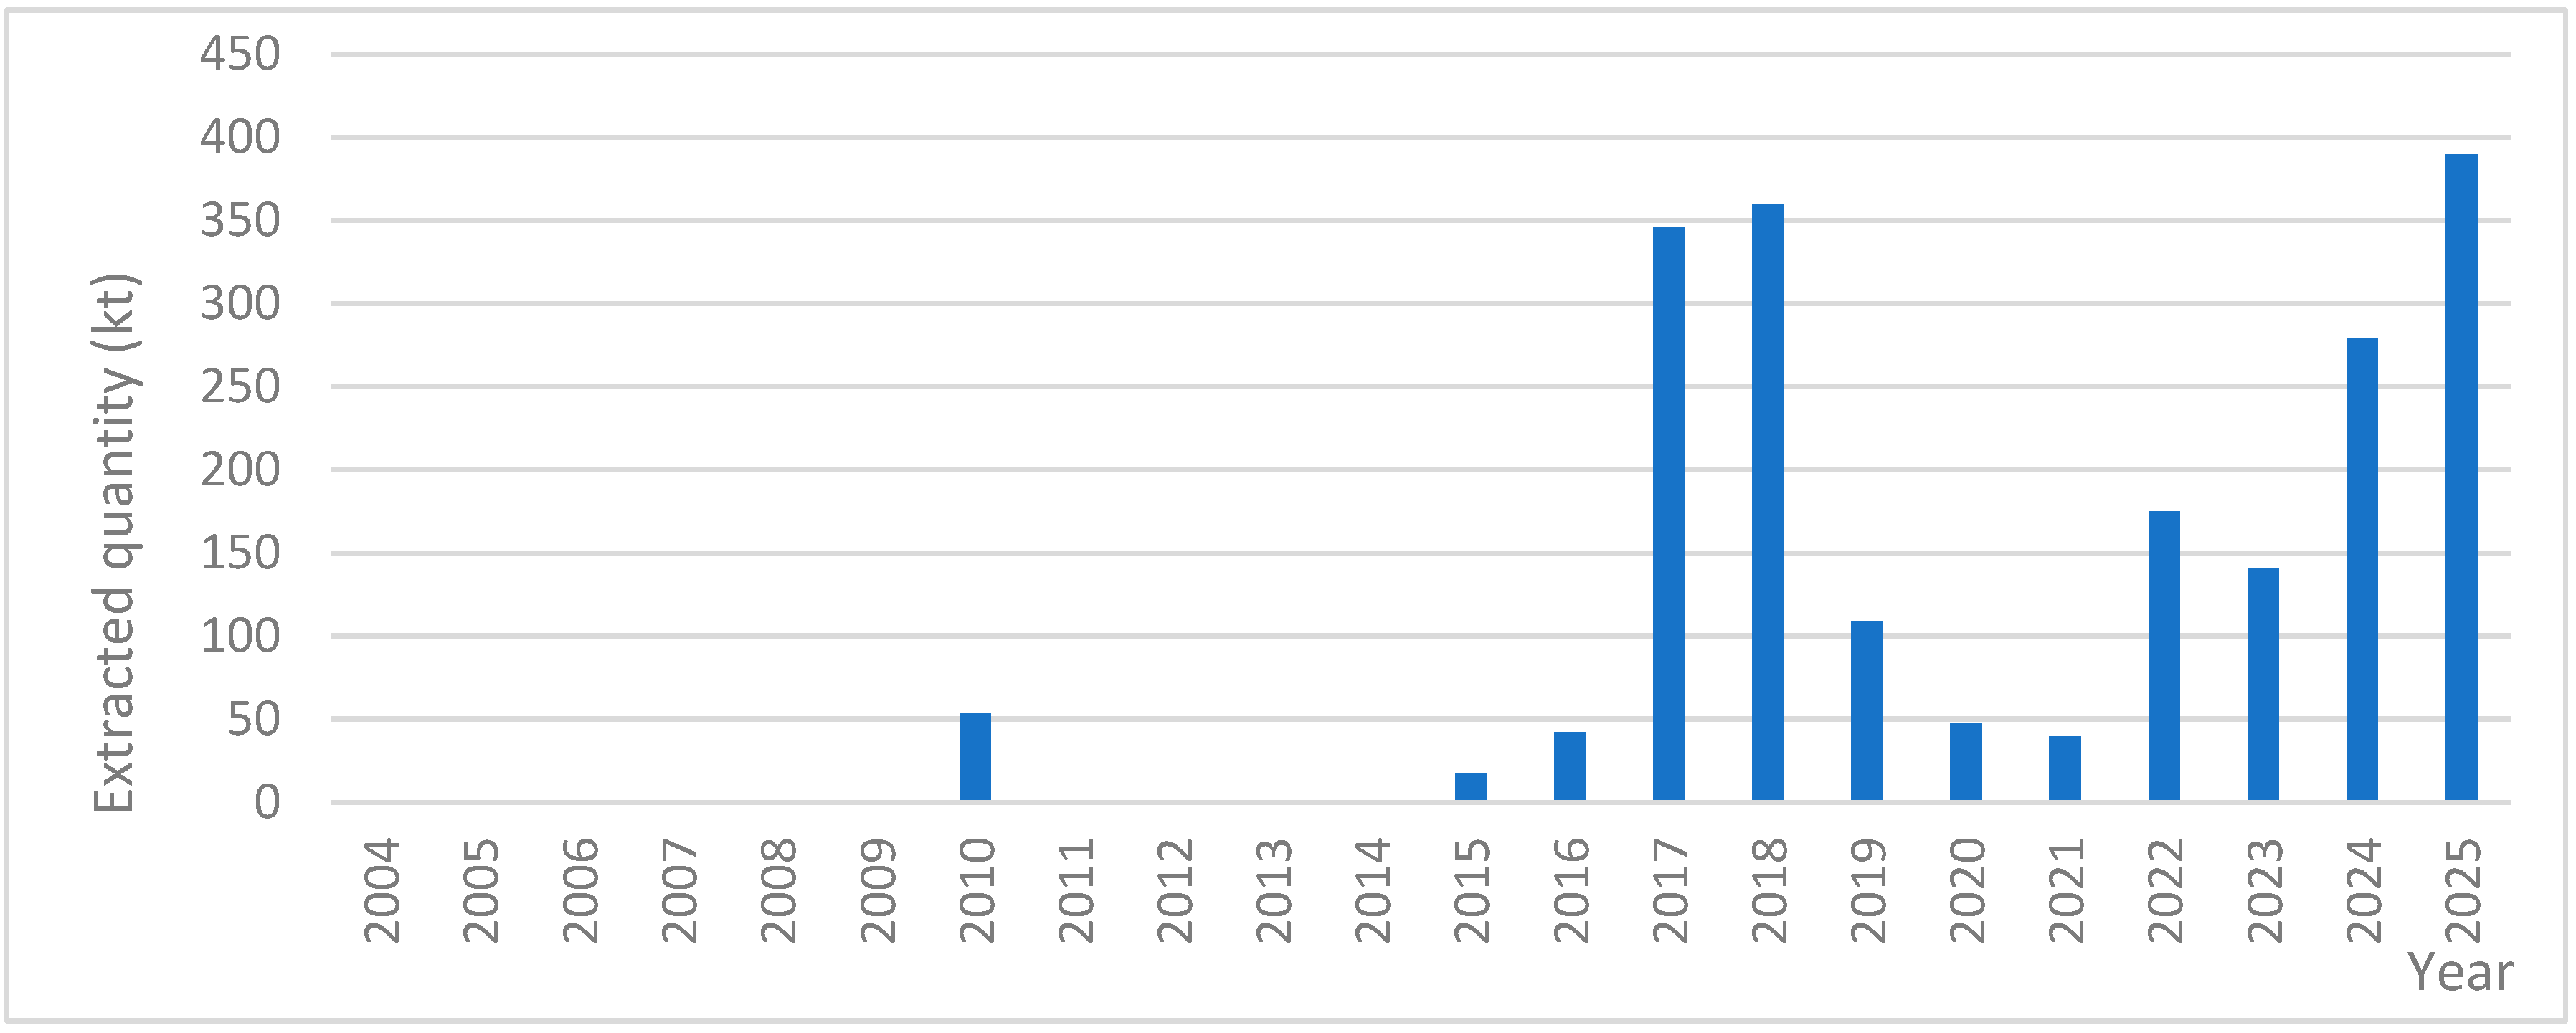
The study area represents a suitable case study for evaluating long-term landscape changes caused by surface mining. A historical orthophoto from the 1950s confirms that mining activity was already present in the mid-20th century (Figure 2c). Annual extraction data indicate relatively low mining intensity during the period 2004–2014 (Figure 3). Mining activity intensified from 2015 onward, with the highest extraction volumes recorded in 2017, 2018, and 2025. A temporary decline in production occurred in 2020 and 2021, most likely reflecting restrictions on economic activity associated with the COVID-19 pandemic. The highest annual extraction volume of the entire study period was recorded in 2025.
The Dargov deposit is located on the eastern slope of the Dargov Pass, near the village of Dargov, within the andesite volcanic complex of the Slanské vrchy Mountains. The geological bedrock consists predominantly of volcanic andesites, which are currently exploited as the primary mineral resource [34].
According to the Climatic Regions map (Map 27) in the Atlas of the Slovak Republic [36], the study area belongs to climatic region M3, classified as a moderately warm and moderately humid hilly to highland region. This climatic region is characterized by a mean July air temperature exceeding 16 °C and fewer than 50 summer days per year (maximum daily temperature ≥ 25 °C). Mean annual precipitation ranges from 600 to 700 mm.
The study area is situated within the Slanské vrchy Mountains, which, according to the zoogeographical classification of Slovakia, belong to the deciduous forest province of the Subcarpathian region. The area also lies within the SKCHVU025 Slanské vrchy Special Protection Area (SPA), designated for the conservation of important bird species and their habitats.

2.2. Satellite Data

The input data consisted of Landsat Collection 2 Level-2 multispectral imagery obtained from the USGS Earth Explorer portal [37] in GeoTIFF format for the period 2009–2025. Images acquired during July and August were selected because these months correspond to the period of fully developed vegetation. The same seasonal window was used throughout the entire study period to ensure temporal consistency of the input data and comparability across years. The year 2012 was excluded from the analysis due to the lack of imagery meeting the required quality criteria. The cloud cover percentage reported in the image metadata served only as a preliminary selection criterion, whereas the actual presence of clouds over the study area was used as the final criterion for image selection.
Clouds were removed from all images using the USGS Landsat QA Toolbox [38], which utilizes the quality information stored in the QA_PIXEL band. For Landsat 8 and Landsat 9 imagery, the Fill, Dilated Cloud, Cloud, Cloud Shadow, and Cirrus classes were masked, whereas for Landsat 5 imagery, the Fill, Dilated Cloud, Cloud, and Cloud Shadow classes were masked. Following cloud masking, all images were clipped to the boundaries of the study area.
The NDVI, BSI, and NDBI spectral indices were calculated for each cloud-free image. Subsequently, annual median composites were generated from all available July–August scenes using the Cell Statistics (Median) tool. Median compositing was applied to reduce the influence of residual cloud contamination, atmospheric noise, and extreme pixel values, thereby improving the representativeness of the annual spectral indices [39].

2.3. NDVI

The Normalized Difference Vegetation Index (NDVI) is one of the most widely used spectral indices for assessing vegetation condition and the spatial distribution of vegetation cover. It is based on the contrast between the high reflectance of healthy vegetation in the near-infrared (NIR) region of the electromagnetic spectrum and its strong absorption in the red region [40]. Owing to its sensitivity to vegetation density and vigor, NDVI is widely applied for monitoring changes in vegetation cover and analyzing satellite image time series [41].
The NDVI is calculated using the commonly used Equation (1):
N D V I = N I R R e d N I R + R e d ,
For Landsat 5 images, Band 4 (NIR) and Band 3 (Red) were used, while for Landsat 8 and Landsat 9 images, Band 5 (NIR) and Band 4 (Red) were used.
The result of the calculation is raster layers with values ranging from –1 to +1, where higher positive values indicate dense vegetation cover, and low or negative values correspond to surfaces without vegetation, such as exposed rock and soil surfaces, built-up areas, or water bodies.

2.4. NDBI

The Normalized Difference Built-up Index (NDBI) is a spectral index widely used to identify built-up, impervious, and bare surfaces from satellite imagery [42]. It is based on the contrast between reflectance in the short-wave infrared (SWIR) and near-infrared (NIR) spectral bands. Built-up and bare surfaces generally exhibit higher reflectance in the SWIR band than in the NIR band, whereas vegetation shows the opposite spectral response [42]. The NDBI was calculated using Equation (2):
N D B I = S W I R N I R S W I R + N I R ,
For Landsat 5 images, Band 5 (SWIR1) and Band 4 (NIR) were used, while for Landsat 8 and Landsat 9 images, Band 6 (SWIR1) and Band 5 (NIR) were used.
NDBI index values range from −1 to +1, with higher positive values characteristic of built-up, paved, and bare surfaces. Values close to zero generally correspond to transitional or mixed areas, or bare soil. Negative values are typical of vegetation cover and water bodies, which exhibit lower reflectance in the SWIR band compared to the NIR band.

2.5. BSI

The Bare Soil Index (BSI) was developed to complement vegetation indices by improving the identification of exposed soil and rock surfaces, particularly in areas with sparse vegetation cover [43]. It is based on the combined reflectance of the blue (Blue), red (Red), near-infrared (NIR), and short-wave infrared (SWIR) spectral bands, exploiting the spectral contrast between vegetation and bare surfaces. Owing to its ability to highlight exposed soil and rock surfaces, the BSI is widely used for monitoring land-cover changes, including those associated with surface mining [44]. The BSI was calculated using Equation (3):
B S I = S W I R + R e d N I R + B l u e S W I R + R e d + N I R + B l u e ,
where Band 1 (Blue), Band 3 (Red), Band 4 (NIR), and Band 5 (SWIR1) were used for Landsat 5, while Band 2 (Blue), Band 4 (Red), Band 5 (NIR), and Band 6 (SWIR1).
BSI index values range from −1 to +1. Negative values are characteristic of vegetation-covered or wet surfaces; values close to zero correspond to mixed or partially exposed surfaces; and positive values indicate an increasing proportion of exposed soil and rock surfaces typical of areas without vegetation cover.

2.6. Trend Analysis and Change Detection

Long-term trends in the time series of the NDVI, BSI, and NDBI spectral indices for the period 2009–2025 were analyzed using the nonparametric Mann–Kendall test. The magnitude of the monotonic trend was quantified using Sen’s slope estimator [45]. Both methods are widely used in the analysis of environmental time series because they do not require the assumption of a normal distribution of the data and are robust to outliers [46].
The mathematical basis of the Mann–Kendall test is given in Equations (4)–(7).
Equation (4) is the Mann–Kendall statistic S:
S = i = 1 n 1 j = i + 1 n s g n x j x i ,
where n is the number of observations in the time series, and xi and xj are the values in time series i and j (where j > i).
Equation (5) is the Signum function:
s g n x j x i = + 1 ;   i f   x j x i > 0 0 ;   i f   x j x i = 0 1 ;   i f   x j x i < 0 ,
Equation (6) is the Normalized Test Statistic Z:
Z = S 1 V a r ( S ) ,   i f   S > 0 0 ,   i f   S = 0 S + 1 V a r ( S ) ,   i f   S < 0 ,
where S is the Mann–Kendall test statistic and Var(S) is the variance of the Mann–Kendall statistic.
Equation (7) is Sen’s slope:
Q i = x j x i j i ,   j > i
where xi and xj are the values of the time series at time points i and j, respectively, with j > i; i and j are the ordinal numbers of the observations in the time series.
The resulting Sen’s slope is defined as the median of all calculated Q i values. Positive values indicate an upward trend, negative values indicate a downward trend, and values close to zero indicate an insignificant or stable trend.
The Mann–Kendall test and Sen’s slope were calculated using the Generate Trend Raster tool in ArcGIS Pro. The outputs included rasters of Sen’s slope, p-values, the test statistic S, the variance Var(S), and the normalized test statistic Z.
The LandTrendr (Landsat-based Detection of Trends in Disturbance and Recovery) algorithm, implemented in ArcGIS Pro, was used to analyze the temporal dynamics of vegetation cover change. The algorithm performs pixel-based temporal segmentation of Landsat image time series, enabling the identification of the timing, magnitude, and progression of significant changes in vegetation cover [47]. LandTrendr has been widely applied for monitoring vegetation dynamics in surface mining areas using Landsat Time Series [48].
LandTrendr was applied to the NDVI and BSI time series using the same parameter configuration. The maximum number of segments was set to 5, the vertex count overshoot threshold to 2, the spike threshold to 0.9, the recovery threshold to 0.25, and the minimum number of observations to 6. One-year recovery was prevented, the “Recovery Has Increasing Trend” parameter was set to “Increasing Trend”, the best model proportion was set to 1.25, and the p-value threshold to 0.01.
Annual median NDVI and BSI composites for the period 2009–2025 served as the input data. The analysis focused on the decreases trend in NDVI values, reflecting the loss of vegetation associated with the expansion of surface mining, and increases in BSI values, reflecting the expansion of exposed soil and rock surfaces. For NDVI, the evaluated LandTrendr outputs included Time of Largest Change, Time of Latest Change, and Number of Changes, whereas BSI was used to identify the timing of the largest increase associated with surface exposure.

3. Results

To illustrate the long-term changes, the years 2009, 2015, and 2025 were selected as representative time points, corresponding to the period before intensive mining, the onset of quarry expansion, and the current state of the study area, respectively. The remaining years were included in the temporal and trend analyses but are not presented separately, as their spatial patterns were comparable to those of the selected years.
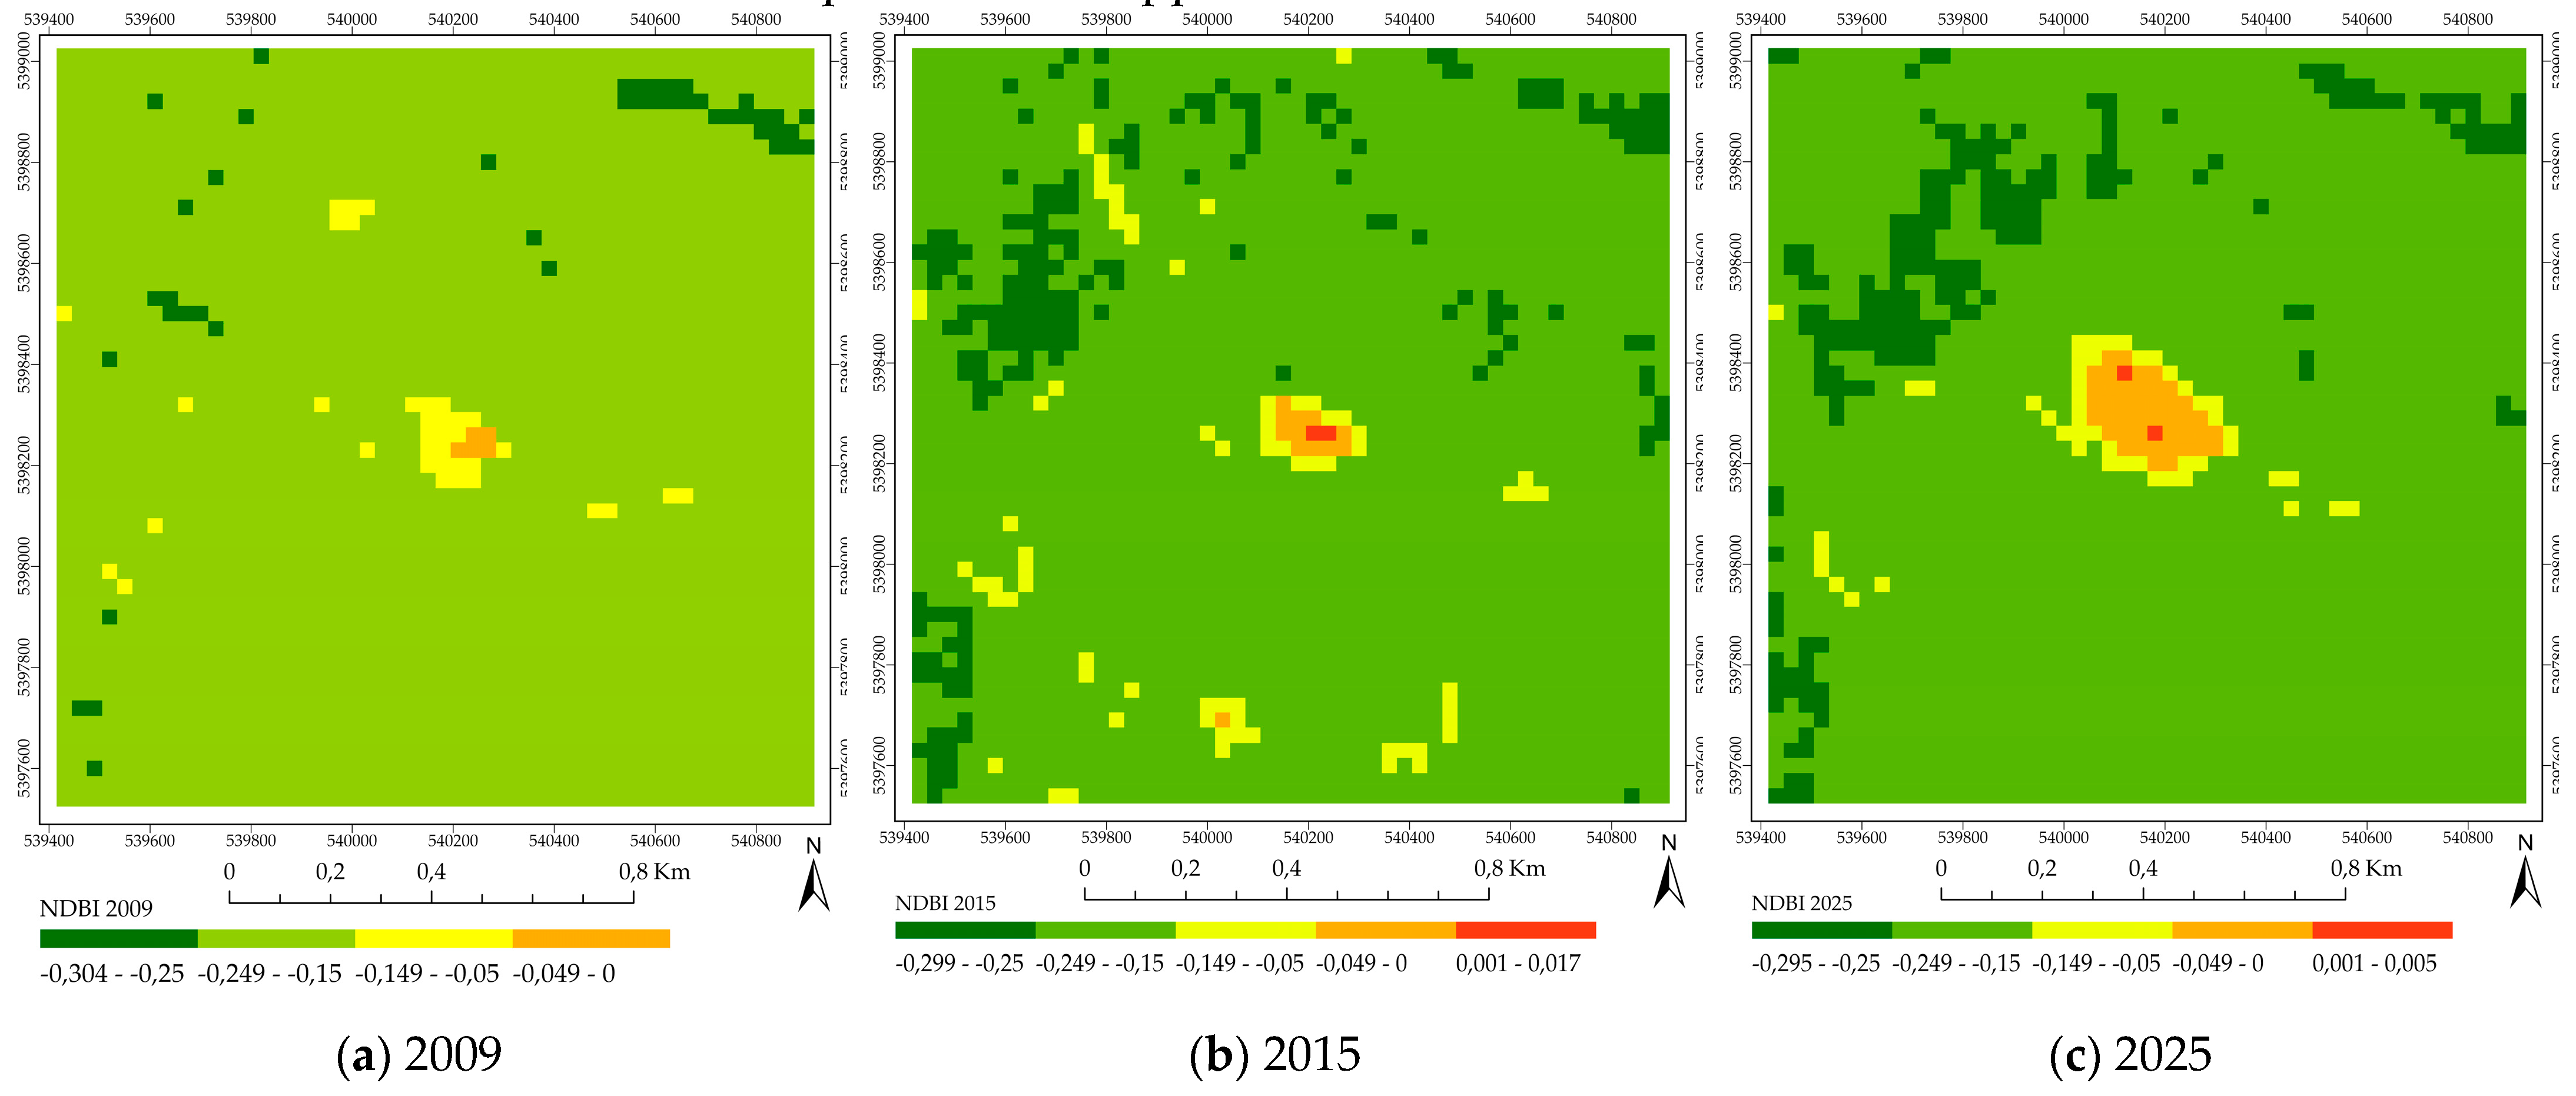
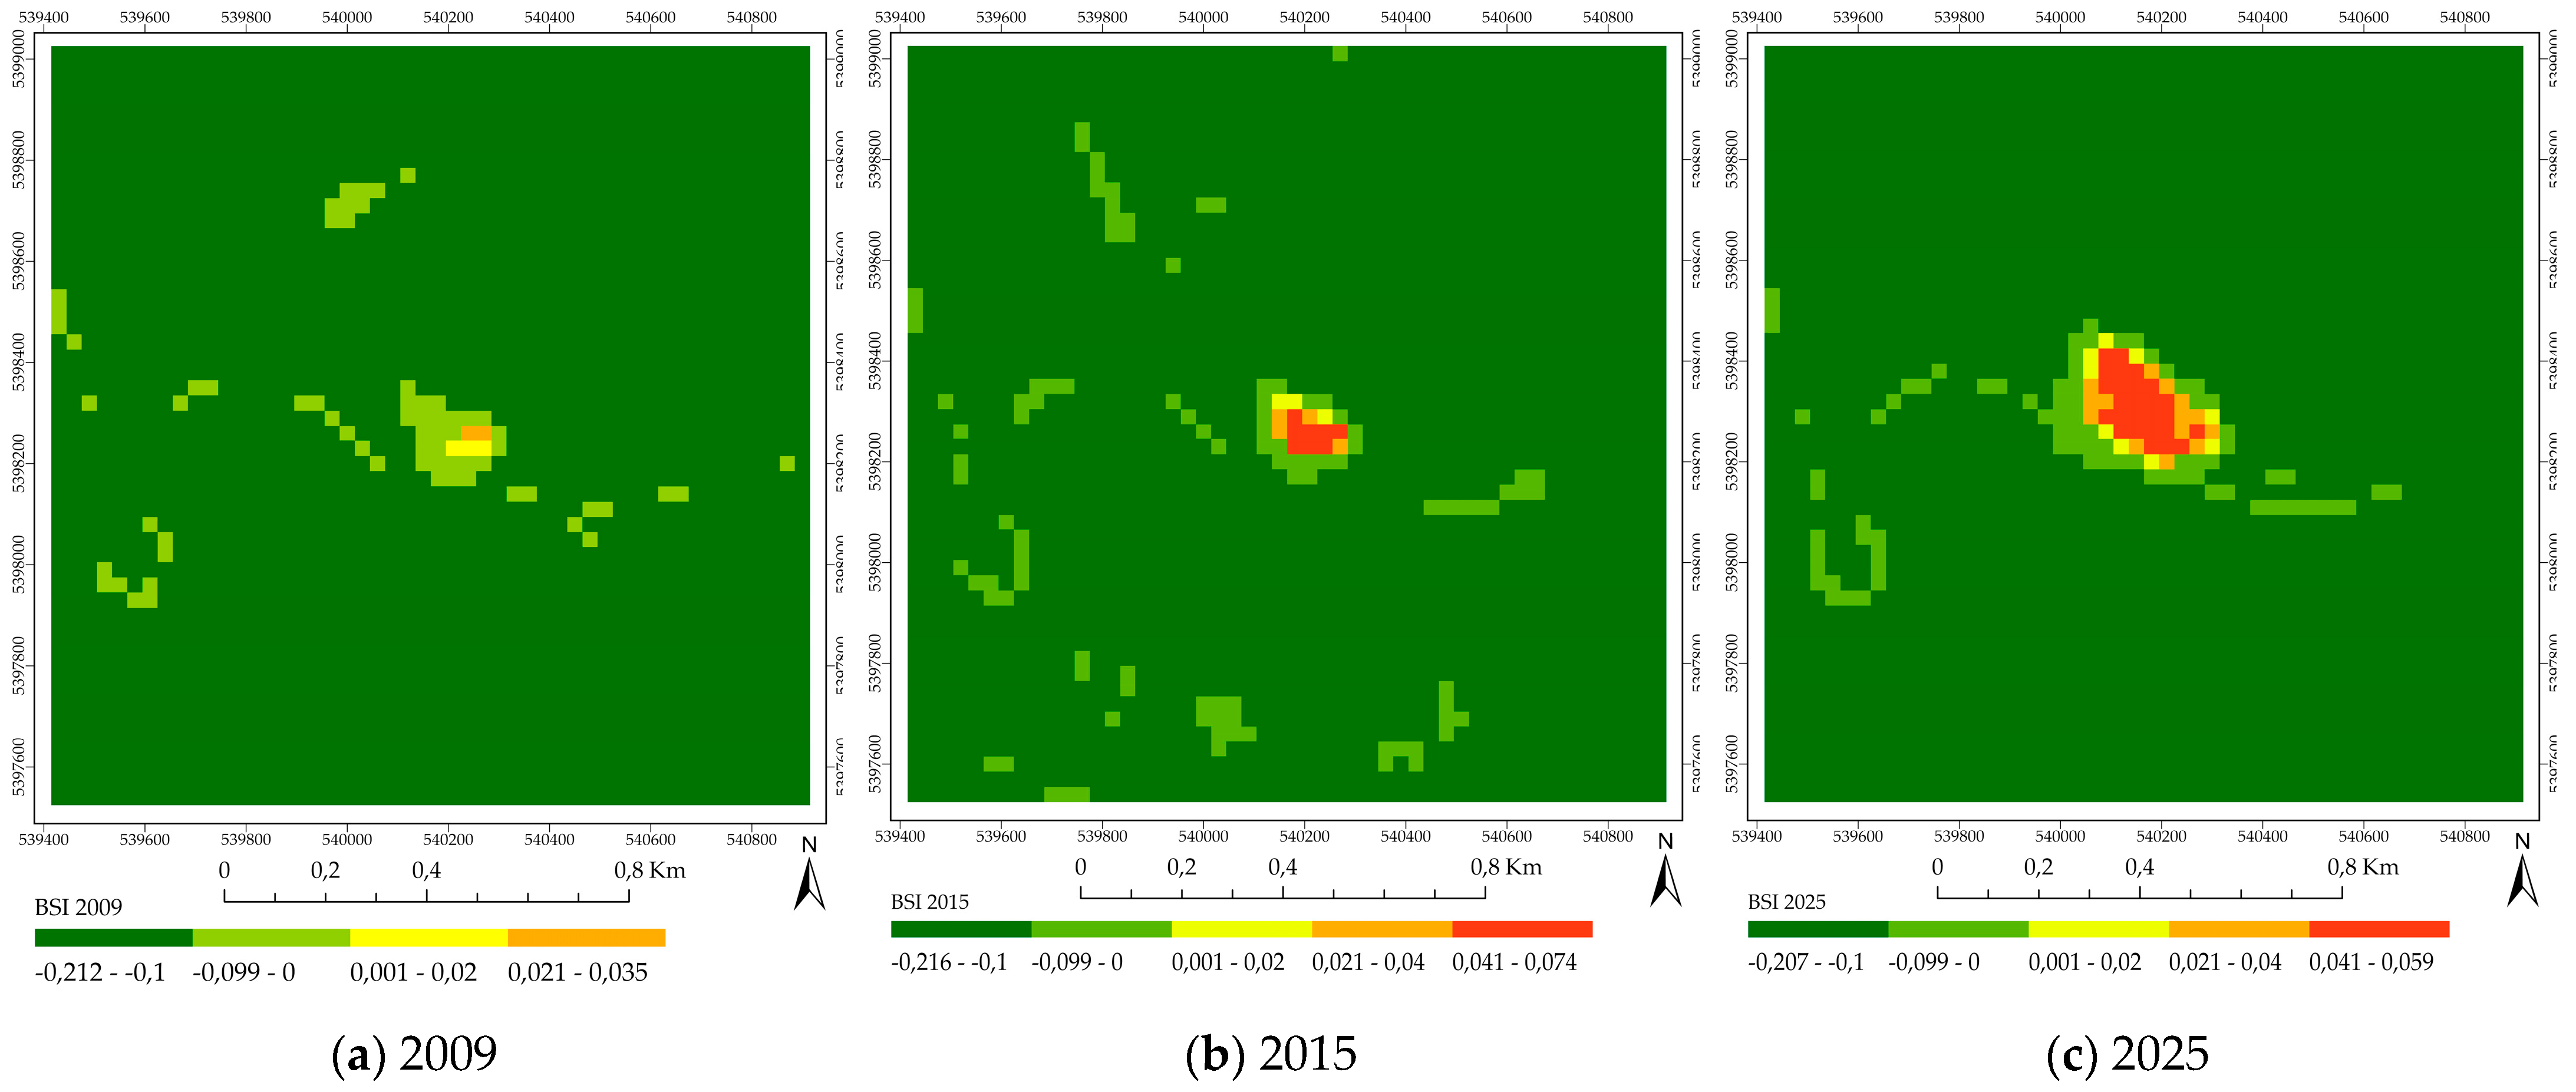
For the representative years 2009, 2015, and 2025, the area covered by individual NDVI, BSI, and NDBI intervals (Figure 4, Figure 5 and Figure 6) was also quantified within the deposit boundary. The area of each interval was calculated based on the number of 30 m Landsat pixels, with each pixel representing 0.09 ha.
Pearson’s correlation coefficient was used to evaluate the relationships between the spectral indices and quarry production. Mean index values within the deposit boundary were compared with annual and cumulative quarry production. Potential time-lagged relationships were assessed by comparing annual production with spectral index values shifted by one and two years.

3.1. Analysis of the NDVI, BSI, and NDBI Indices

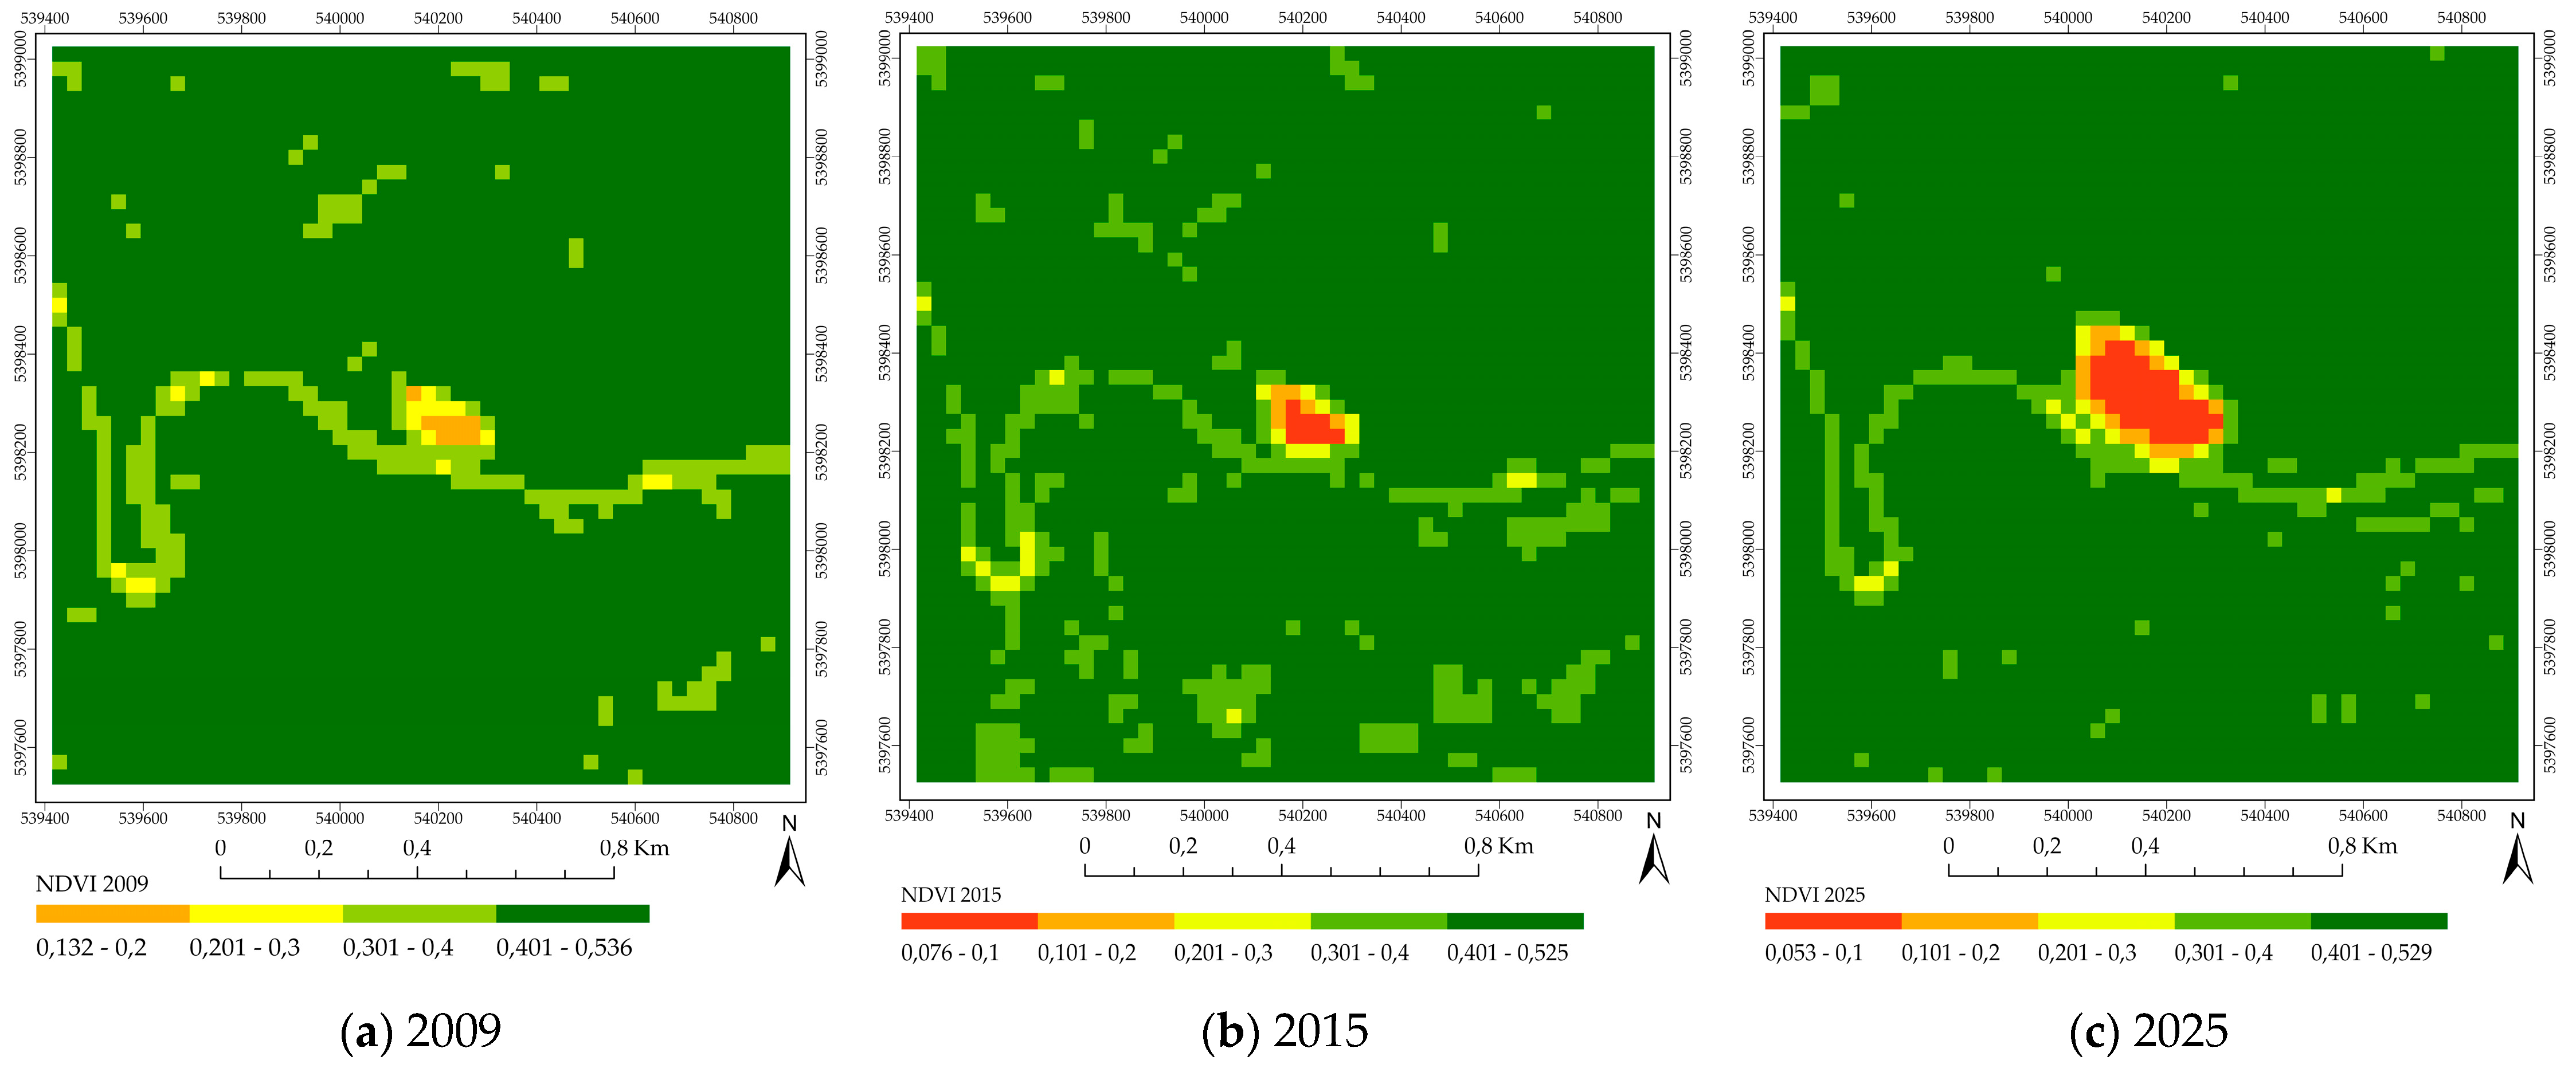
The spatial distribution of NDVI values shown in Figure 4 illustrates the gradual changes in vegetation cover within the Dargov quarry study area. The year 2009 (Figure 4a) represents the initial state of the analyzed period, before the intensification of mining activity. At that time, low NDVI values were concentrated mainly in the central part of the study area, corresponding to the existing quarry, whereas most of the surrounding area was characterized by high NDVI values associated with vegetation cover. By 2015 (Figure 4b), when surface mining expanded substantially, the area characterized by low NDVI values had increased around the existing quarry. This pattern indicates a progressive loss of vegetation cover associated with the expansion of quarry benches. Mining activity continued annually after 2015, although its intensity varied over the years.
The most pronounced changes were observed in 2025 (Figure 4c), when the area with the lowest NDVI values expanded markedly and formed a compact zone in the central part of the study area. This pattern reflects the continued expansion of the active quarry and the associated loss of vegetation cover. Despite these changes, the peripheral parts of the study area remained characterized by high NDVI values, indicating the preservation of forest stands outside the active quarry. The descriptive statistics for NDVI during 2009–2025 are presented in Appendix A Table A1.
Figure 5 illustrates the spatial distribution of BSI values in 2009, 2015, and 2025. In 2009, elevated BSI values were confined to a relatively small area in the central part of the quarry, corresponding to exposed rock and soil surfaces. By 2015, areas with higher BSI values had expanded, indicating an increase in exposed surfaces associated with the expansion of surface mining. The most pronounced changes were observed in 2025, when high BSI values occupied a substantially larger and more contiguous area within the active quarry. The descriptive statistics for the BSI during 2009–2025 are presented in Appendix A Table A2.
Figure 6 shows the spatial distribution of NDBI values in 2009, 2015, and 2025. In 2009, elevated NDBI values were confined to the central part of the quarry. By 2015, areas with higher NDBI values had expanded, indicating an increase in exposed and mining-related surfaces associated with the expansion of surface mining. The most pronounced extent of high NDBI values was observed in 2025, when they formed a contiguous zone within the active quarry, reflecting the continued transformation of the landscape due to mining activities. The descriptive statistics for the NDBI during 2009–2025 are presented in Appendix A Table A3.
Spatial quantification of the individual spectral index intervals within the deposit boundary revealed a marked shift in their distribution over the study period (Appendix A Table A4). The area of the NDVI > 0.40 interval decreased from 6.75 ha (67.6%) in 2009 to 6.48 ha (64.9%) in 2015 and 2.97 ha (29.7%) in 2025, while the combined area of the NDVI ≤ 0.20 intervals increased from 0.72 ha (7.2%) to 1.26 ha (12.6%) and 4.86 ha (48.6%), respectively. The opposite pattern was observed for BSI and NDBI. The combined area of BSI intervals with values > 0.02 increased from 0.18 ha (1.8%) in 2009 to 1.08 ha (10.8%) in 2015 and 3.60 ha (36.0%) in 2025. For NDBI, the combined area of intervals with values > −0.05 increased from 0.45 ha (4.5%) to 1.17 ha (11.7%) and 4.05 ha (40.5%), respectively.
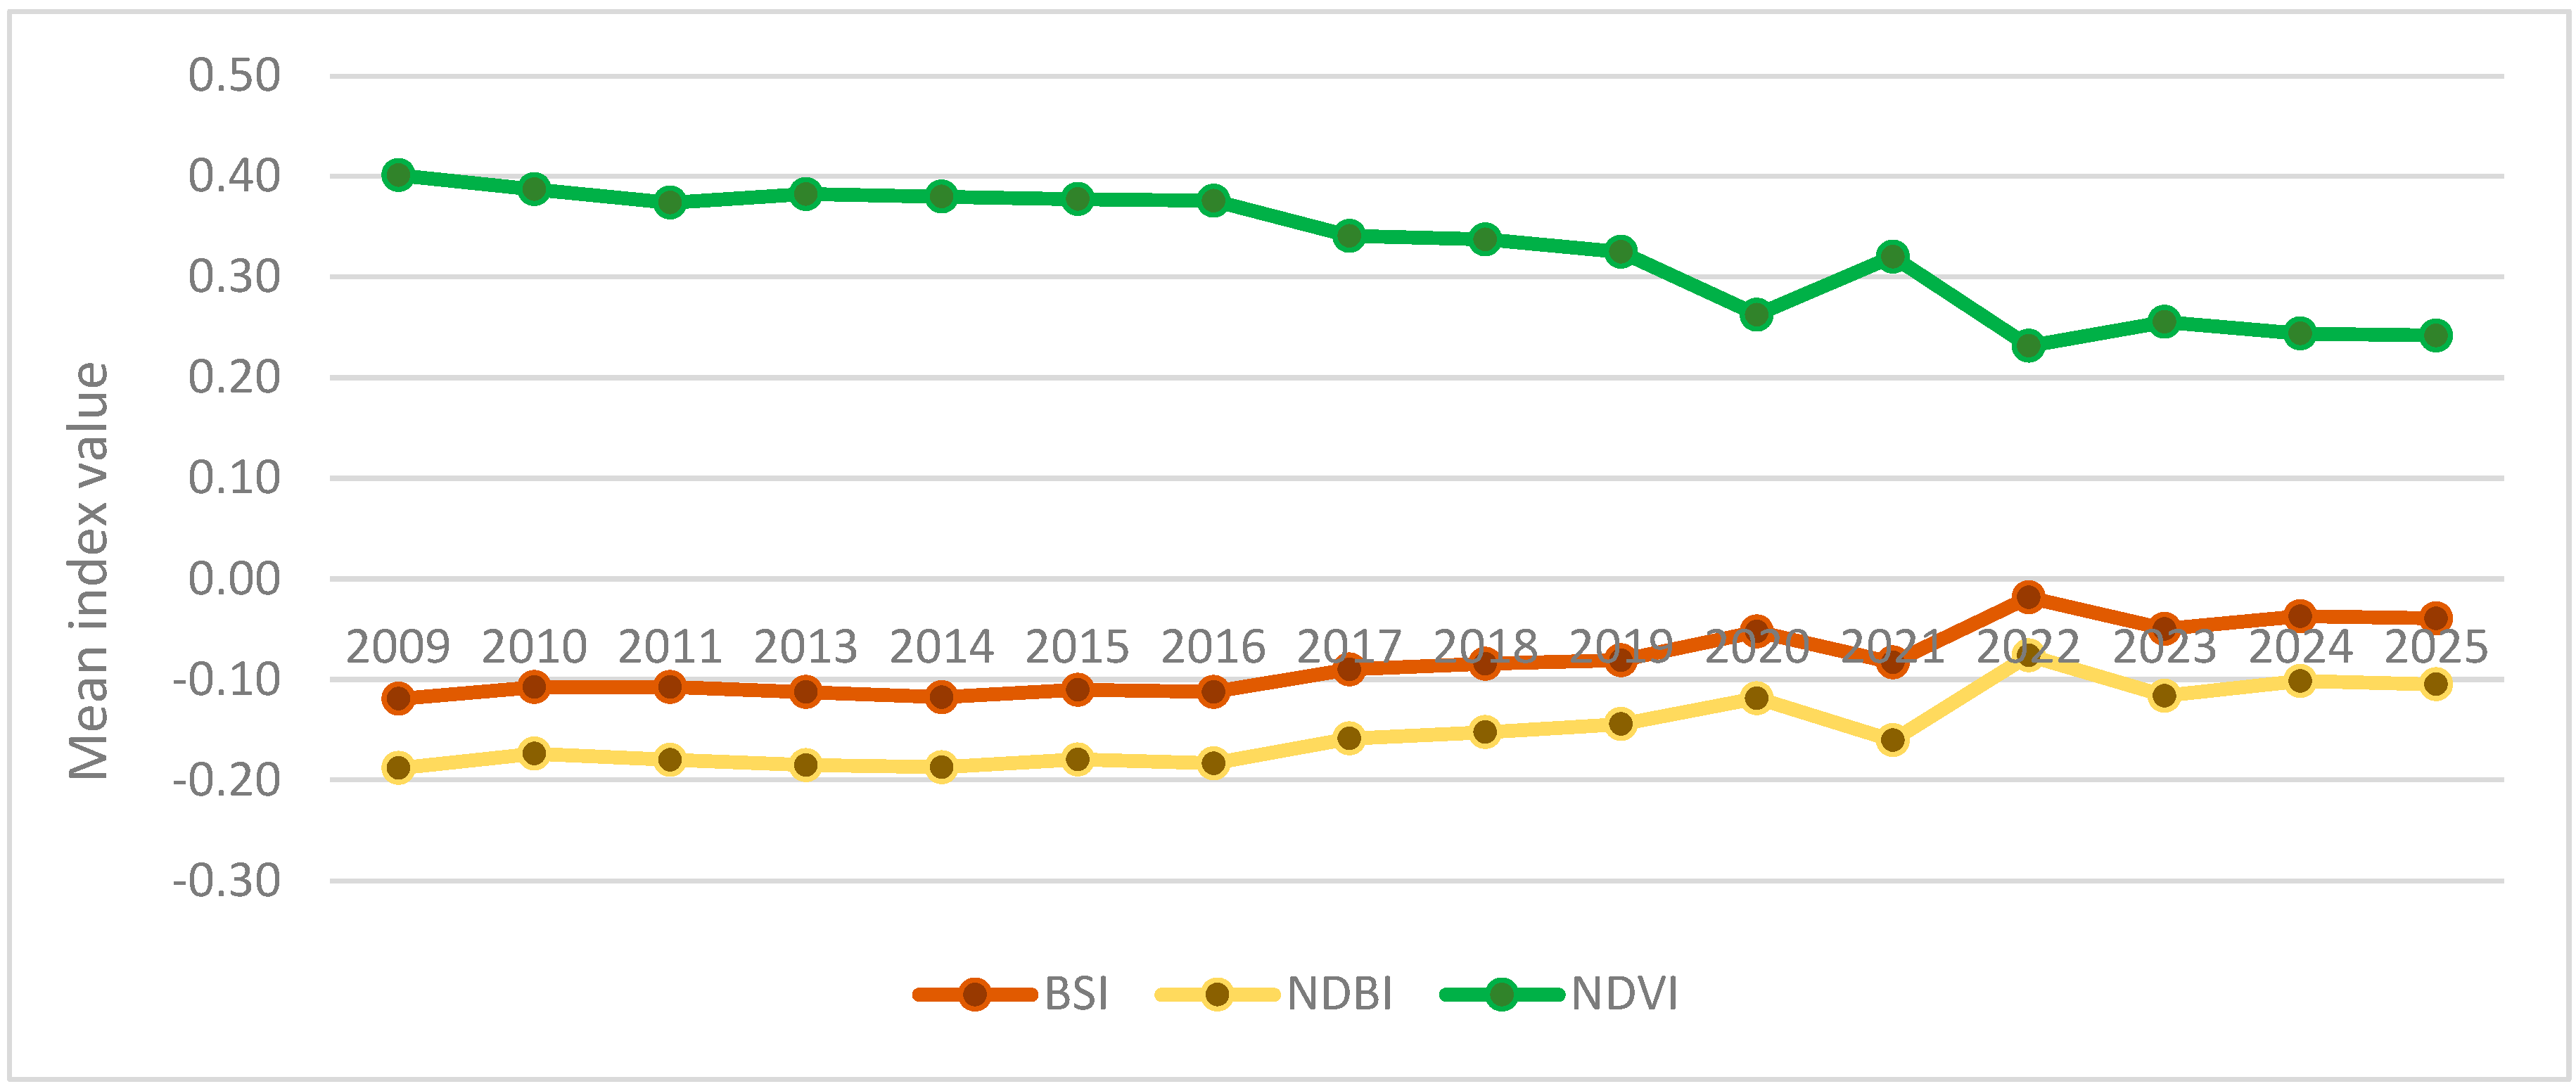
To further evaluate the temporal evolution of the spectral indices, mean NDVI, BSI, and NDBI values were calculated within the deposit boundary using zonal statistics. The results (Figure 7) indicate a gradual decline in the mean NDVI from approximately 0.40 in 2009 to 0.24 in 2025. In contrast, the mean BSI and NDBI values exhibited an opposite trend, increasing progressively throughout the study period. These changes reflect the loss of vegetation cover and the concurrent expansion of exposed surfaces associated with ongoing surface mining.
A more pronounced deviation from the overall temporal trend was observed between 2020 and 2022. In 2021, the mean NDVI temporarily increased, accompanied by a simultaneous decrease in the mean BSI and NDBI values, corresponding to the period of reduced mining intensity shown in Figure 3. In 2022, following a substantial increase in annual production, NDVI declined, whereas BSI and NDBI values increased, demonstrating the sensitivity of the spectral indices to changes in mining intensity.
The relationship between mining intensity and the spectral indices was evaluated using Pearson’s correlation analysis between annual quarry production and the mean NDVI, BSI, and NDBI values calculated within the deposit boundary. The analysis revealed a moderately strong negative correlation between quarry production and NDVI (r = −0.565), whereas moderately strong positive correlations were observed for both BSI (r = 0.581) and NDBI (r = 0.581).
Subsequently, the relationship between cumulative production and the mean spectral index values within the deposit boundary was analyzed to further examine the long-term pattern of the identified changes. Compared with annual production, substantially stronger correlations were observed: r = −0.935 for NDVI, r = 0.912 for BSI, and r = 0.890 for NDBI. Potential time-lagged relationships were evaluated by comparing annual production with spectral index values shifted by one and two years. With a one-year lag, the correlations were r = −0.426 for NDVI, r = 0.413 for BSI, and r = 0.419 for NDBI, while with a two-year lag, they were r = −0.486, r = 0.449, and r = 0.453, respectively. None of the tested time lags resulted in stronger correlations than those observed without a time lag.

3.2. Analysis of Long-Term Trends

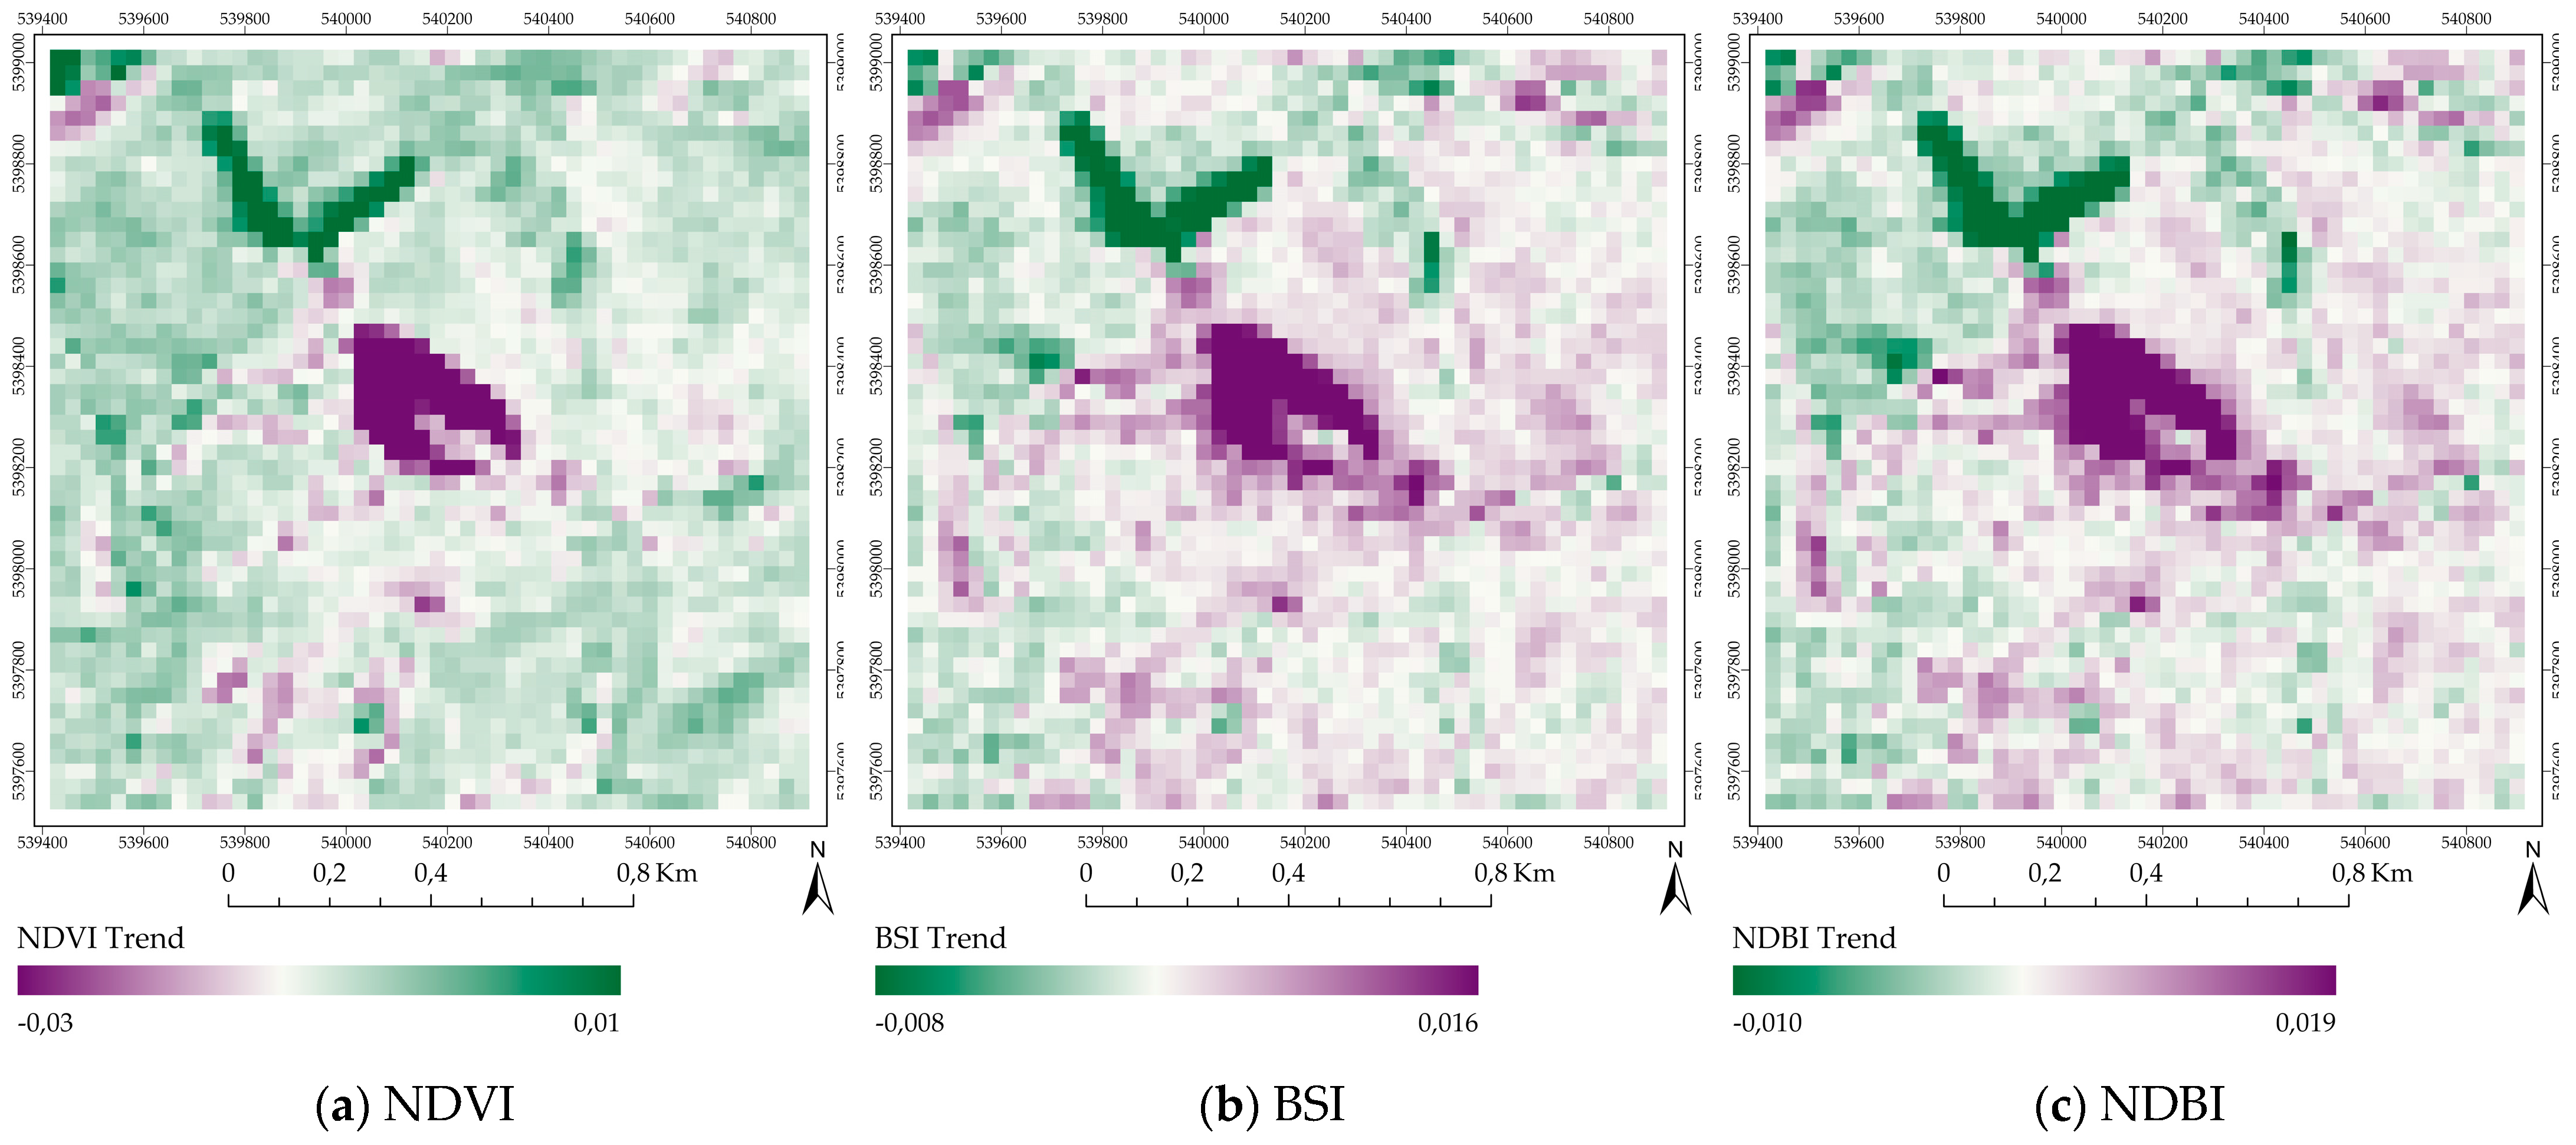
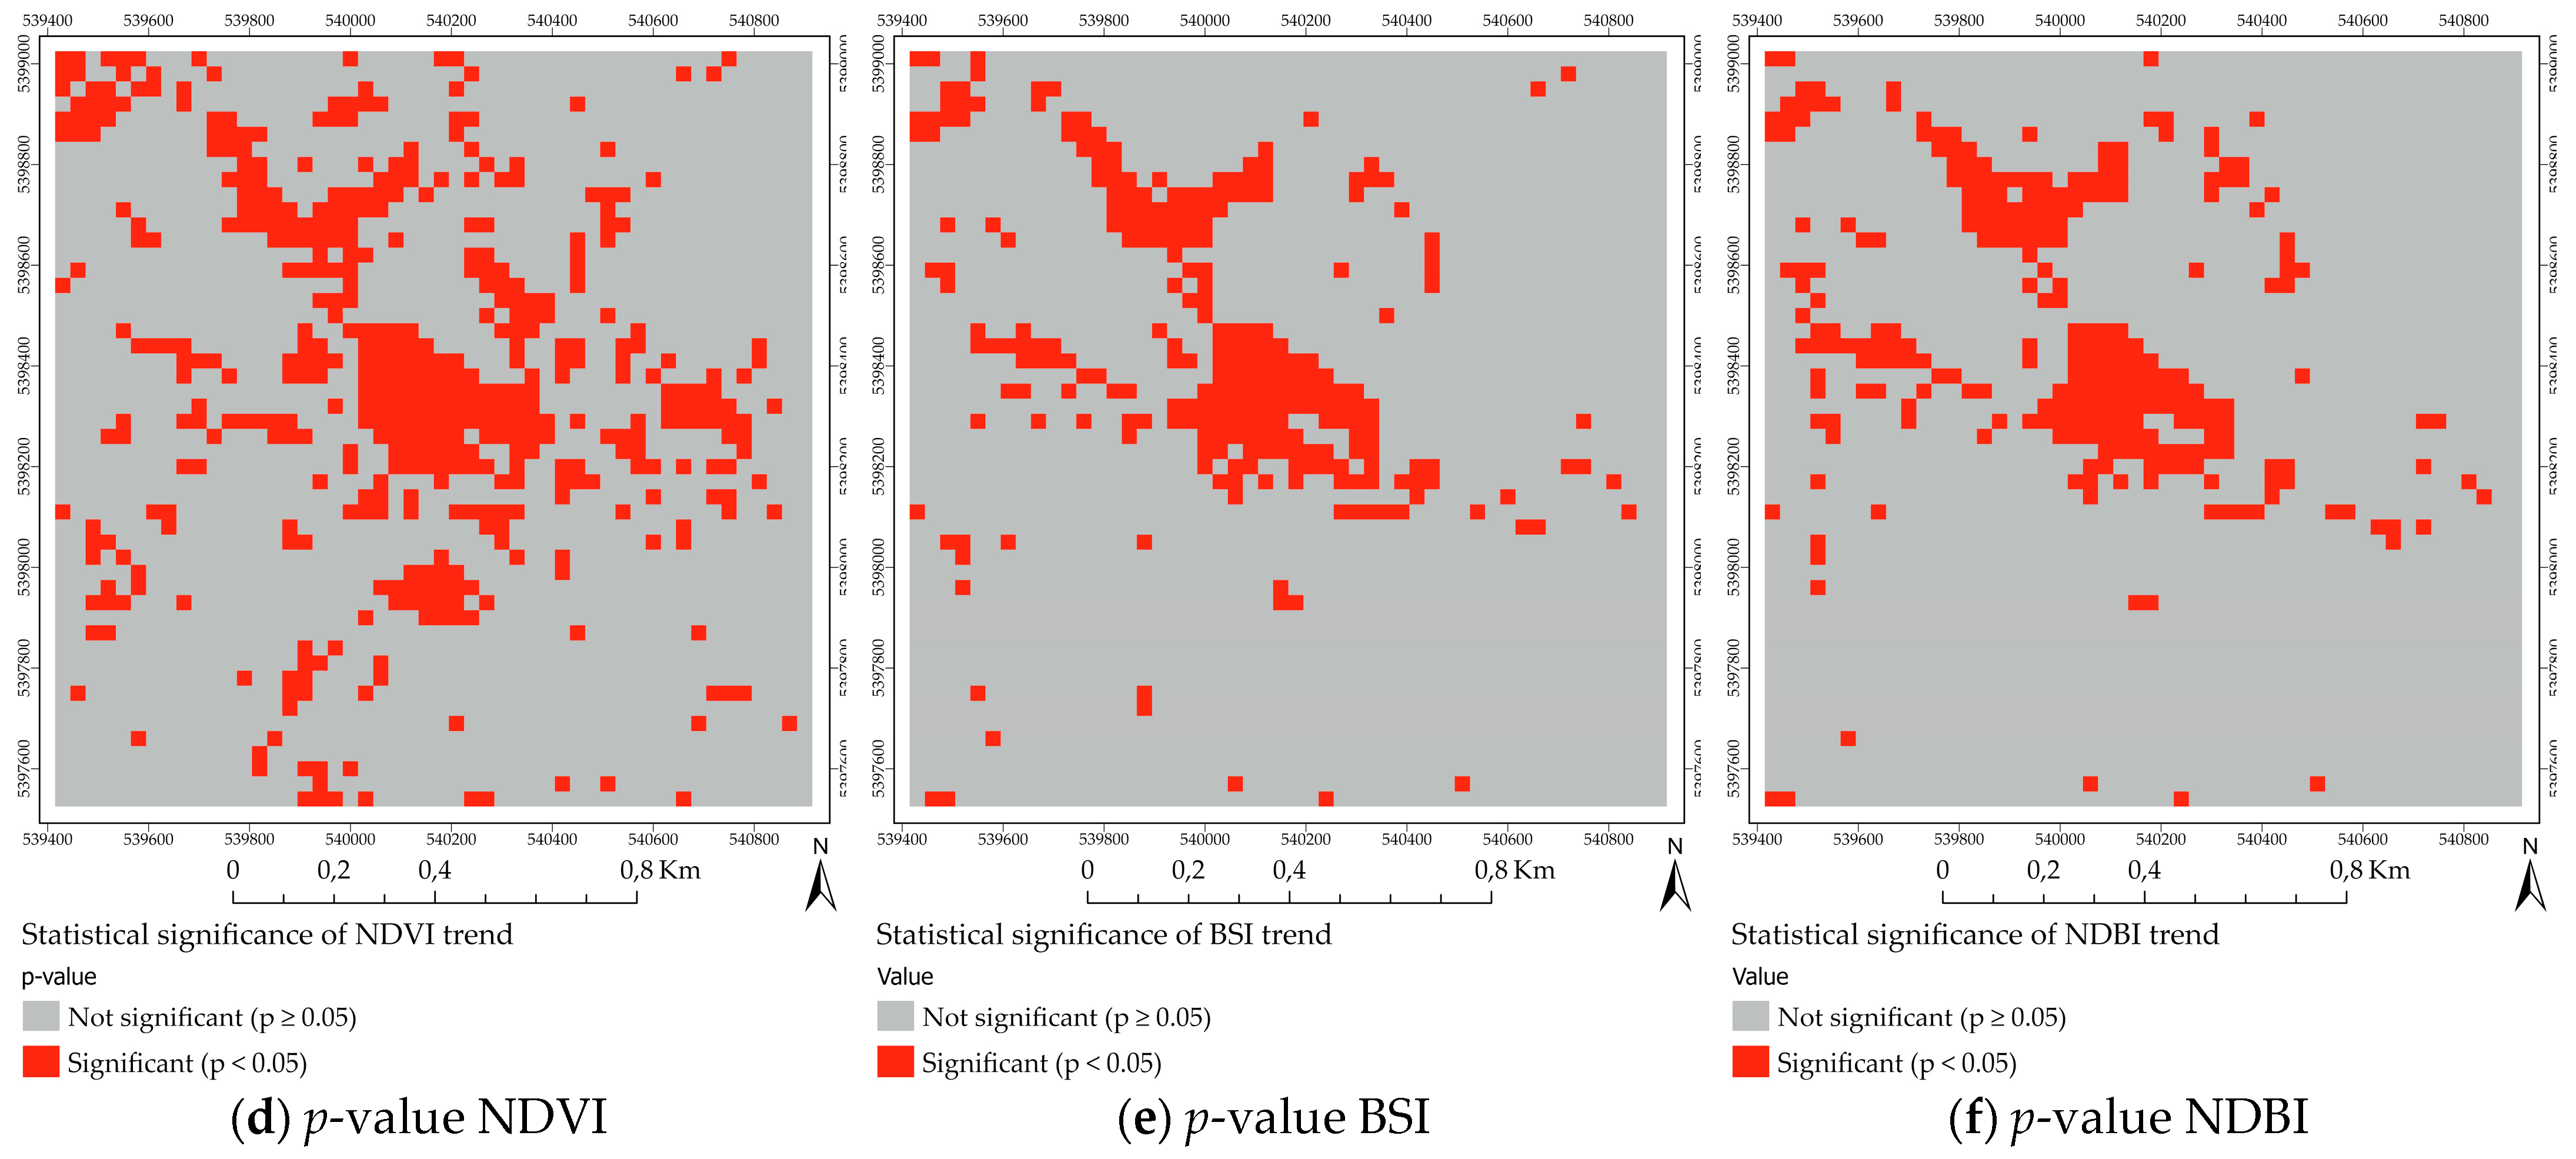
The results of the Mann–Kendall trend analysis for the NDVI, BSI, and NDBI indices for the period 2009–2025 are presented in Figure 8. For NDVI (Figure 8a), negative trends were concentrated mainly in the central part of the quarry, whereas the surrounding areas exhibited predominantly weak positive trends, indicating stable or slightly improving vegetation cover. In contrast, the BSI (Figure 8b) and NDBI (Figure 8c) exhibited predominantly positive trends within the active quarry, reflecting the gradual expansion of exposed rock and soil surfaces and an increasing proportion of unvegetated areas associated with ongoing surface mining. The statistical significance maps for NDVI (Figure 8d), BSI (Figure 8e), and NDBI (Figure 8f) indicate that statistically significant trends (p < 0.05) were concentrated primarily within the active quarry, whereas statistically insignificant changes predominated throughout the surrounding area.
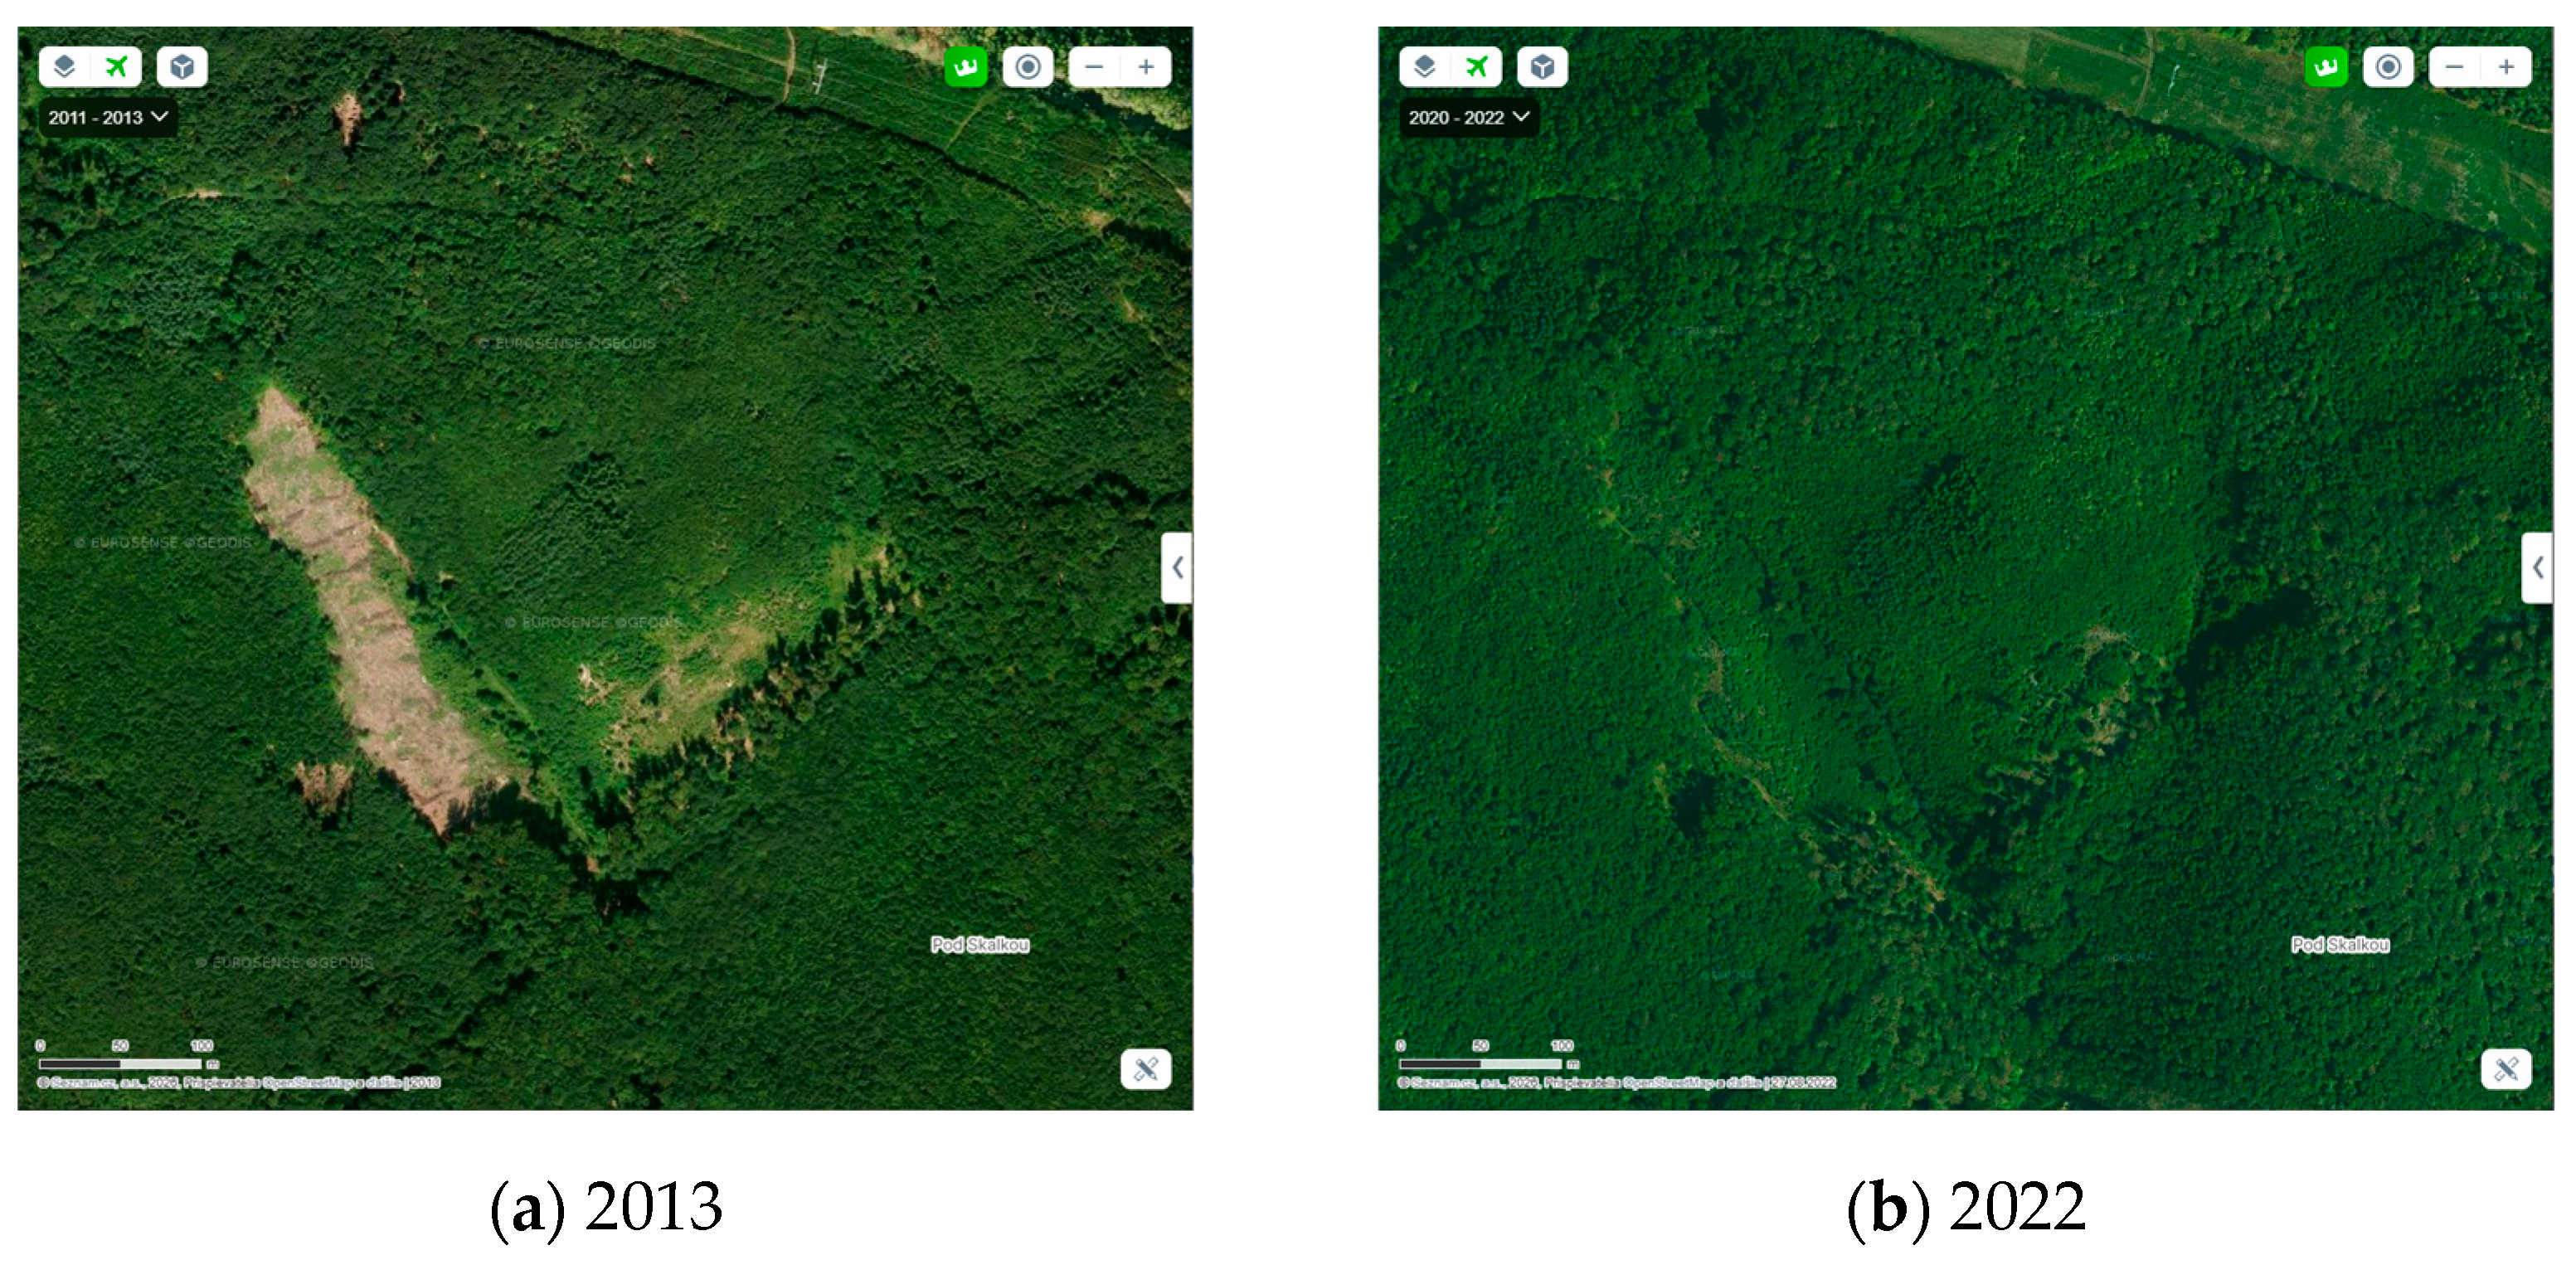
Quantification of trend significance showed that statistically significant changes (p < 0.05) occurred in 18.68% of the area analyzed for NDVI, 10.72% for BSI, and 10.52% for NDBI. For all three indices, these changes were concentrated mainly within the active quarry, whereas statistically insignificant trends predominated in the surrounding parts of the study area. An exception was a small site in the northwestern part of the study area (Figure 8a), where positive NDVI trends indicated gradual vegetation recovery. This interpretation is further supported by a comparison of orthophotos from 2013 and 2022 (Figure 9), obtained from the Mapy.com portal and accessed on 11 July 2026, which clearly shows progressive vegetation regrowth at this location.
To evaluate changes within the active mining area in greater detail, trend significance was also assessed within the deposit boundary. The results revealed a substantially higher proportion of statistically significant trends (p < 0.05) for all three spectral indices than for the study area as a whole. Statistically significant trends were identified in 76.36% of NDVI pixels, 65.45% of BSI pixels, and 63.64% of NDBI pixels. These findings confirm that the most pronounced changes in vegetation cover and the expansion of exposed surfaces were concentrated within the active quarry.
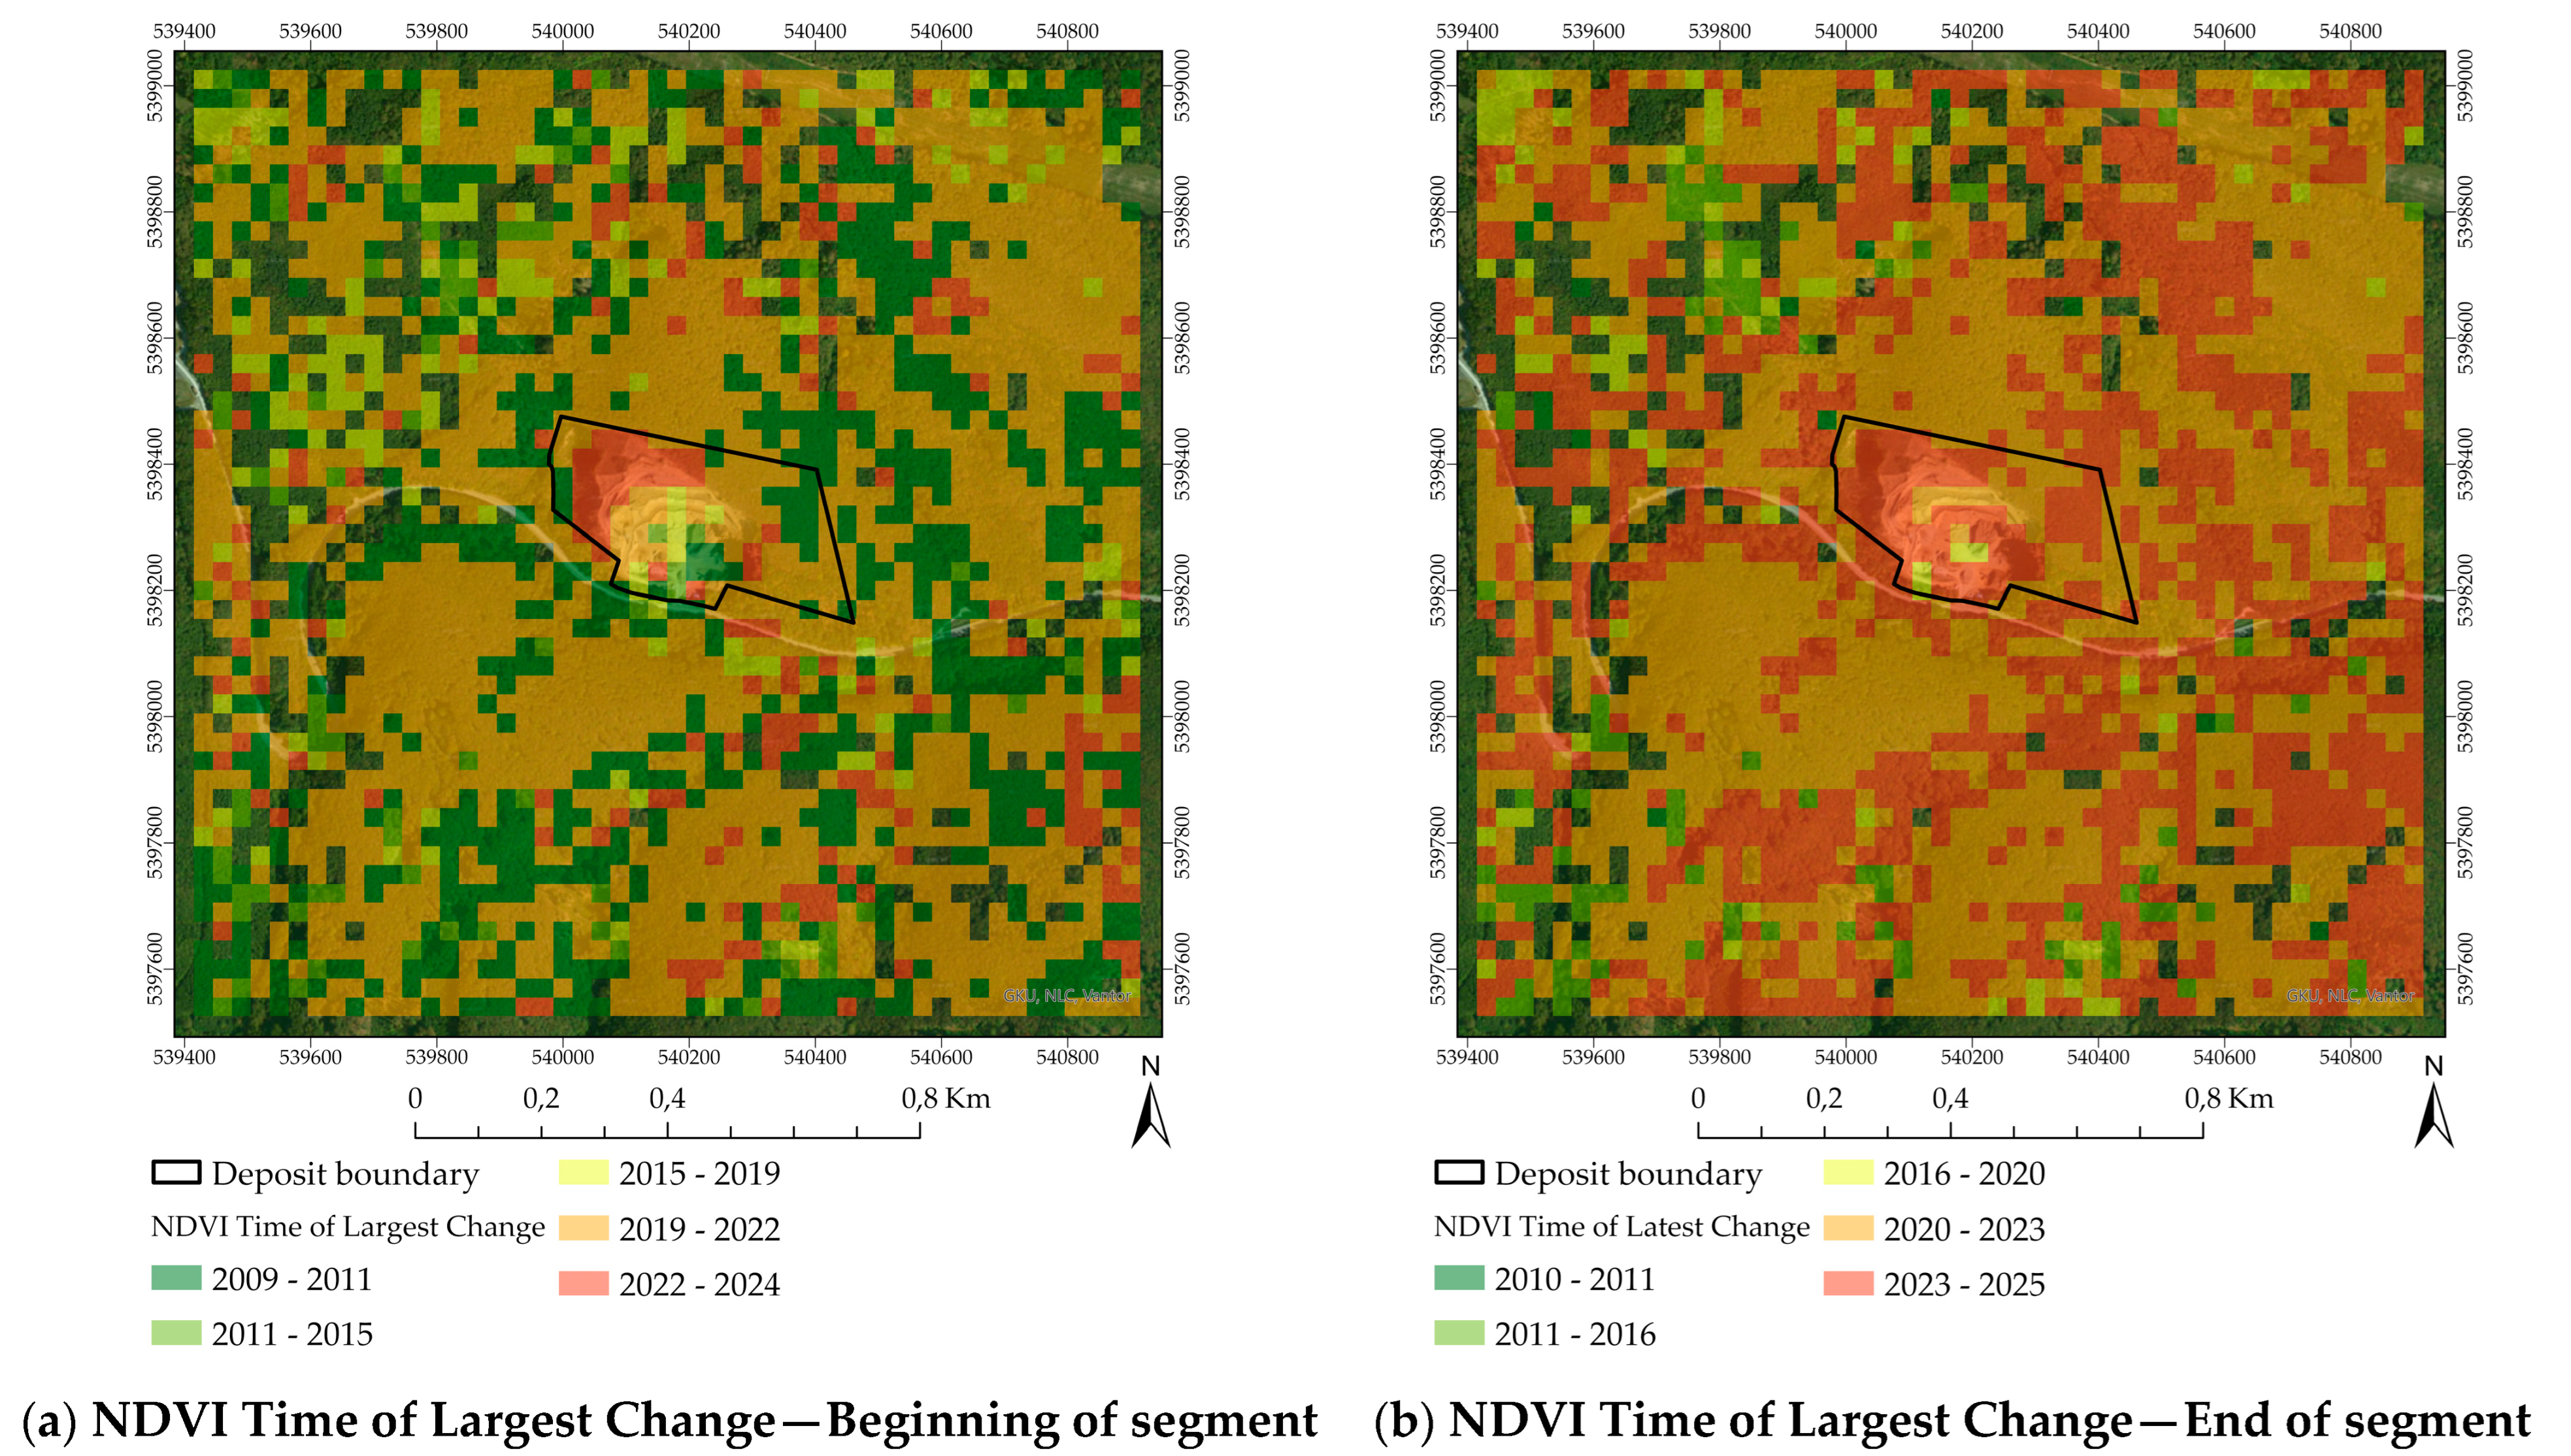
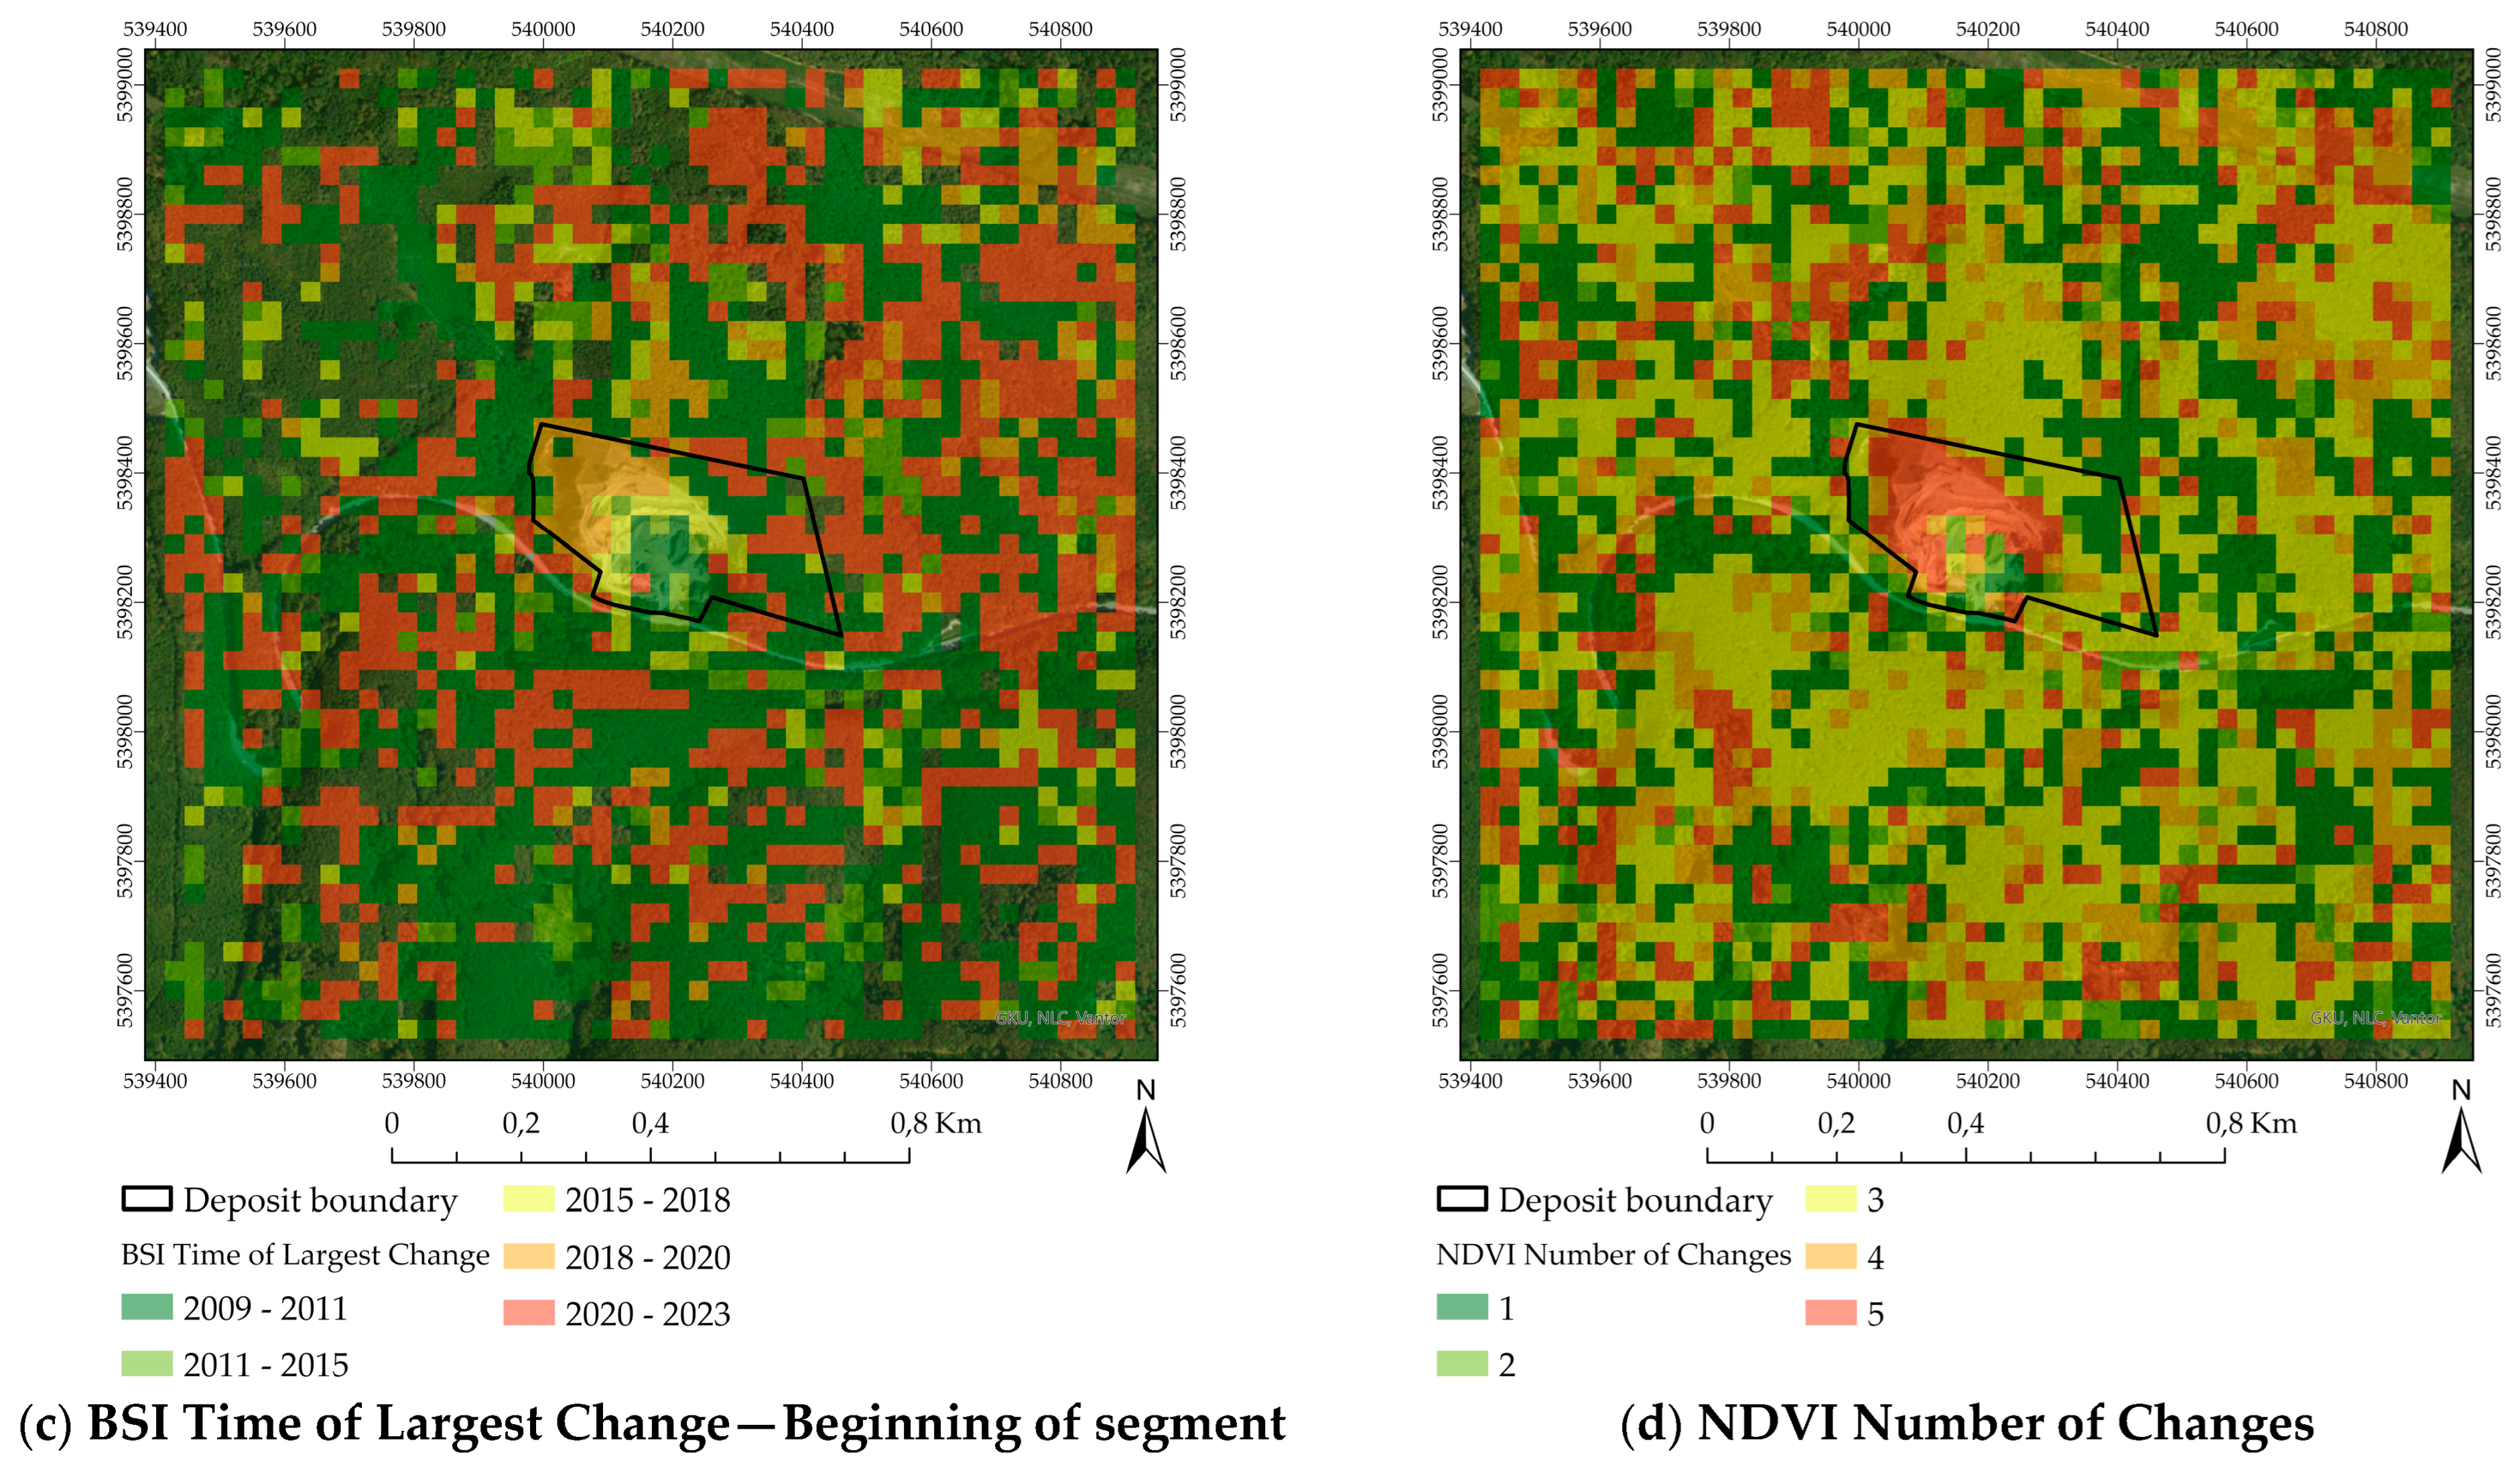
The LandTrendr analysis of the NDVI and BSI time series enabled the identification of the temporal dynamics of vegetation loss and surface exposure within the study area (Figure 10). The Time of Largest Change map for NDVI (Figure 10a) identifies the periods during which the most pronounced vegetation decline began. The Time of Latest Change map (Figure 10b) indicates the areas where vegetation changes persisted until the end of the study period. The Time of Largest Change map for BSI (Figure 10c) confirms that quarry expansion was accompanied by the progressive exposure of rock and soil surfaces. Finally, the Number of Changes map for NDVI (Figure 10d) shows that the highest frequency of change events occurred within the active quarry, reflecting repeated disturbances associated with the expansion of mining operations.
A quantitative evaluation of the LandTrendr outputs within the deposit boundary showed that, for NDVI, 45.45% of the pixels in the “Time of Largest Change” output corresponded to the 2019–2022 period and 25.45% to the 2022–2024 period; together, the 2019–2024 period accounted for 70.91% of the pixels. For the “Time of Latest Change” output, 65.45% of the pixels were concentrated in the 2023–2025 period, with a further 30.91% in the 2020–2023 period. The “Number of Changes” analysis showed that 40.91% of the pixels recorded five changes, while 53.64% recorded four or five changes. Spatially, pixels with a higher number of identified changes were concentrated primarily in the active central and western parts of the quarry, which is consistent with the spatial distribution of disturbed and exposed surfaces visible in the orthophoto imagery. For BSI, changes in the “Time of Largest Change” output were more evenly distributed over time, with the highest proportion occurring during 2009–2011 (38.53%), followed by 2018–2020 (23.85%) and 2015–2018 (16.51%).

4. Discussion

The results suggest that surface mining affected the spectral indices analyzed in different but complementary ways. A decrease in NDVI values indicated a loss of vegetation cover, whereas increases in BSI and NDBI values reflected the expansion of exposed soil and rock surfaces. Although both indices responded to surface exposure, BSI provided more direct information on bare and exposed surfaces, whereas NDBI served as a complementary indicator of anthropogenically modified surfaces. The spatial correspondence among these changes enabled a more precise identification of the areas most affected by surface mining.
The temporal evolution of mean spectral index values does not directly correspond to the annual volume of extracted raw material. The negative relationship between NDVI and annual production is consistent with the gradual loss of vegetation cover, while the positive relationships for BSI and NDBI are consistent with an increasing proportion of exposed surfaces in the active part of the quarry. The analysis showed substantially stronger correlations between the spectral indices and cumulative production than with annual production, suggesting that the observed spectral changes may be more closely associated with the gradual transformation of the surface during long-term quarry development than with production volumes in individual years. At the same time, annual production may not be directly proportional to the areal extent of surface change. The short-term increase in NDVI in 2021 therefore cannot be unequivocally attributed solely to the decline in quarrying activity in 2020–2021, as it may also have been influenced by inter-annual variability in meteorological conditions and natural vegetation dynamics. Since meteorological data and soil moisture indices were not included in the analysis, the relative contribution of these factors could not be assessed separately.
Changes in spectral indices may become apparent during preparatory work preceding actual extraction, including vegetation removal and overburden stripping, while subsequent quarrying may continue in already exposed areas without a corresponding expansion of the disturbed surface. Analyses with one- and two-year time lags did not result in stronger correlations; therefore, the results do not indicate a systematic delayed response of the spectral indices within this time frame. However, the strong correlations with cumulative production should be interpreted with caution, as both cumulative production and the spectral indices exhibit long-term trends; the observed relationships therefore indicate an association rather than evidence of a direct causal relationship.
The advantages of combining multiple spectral indices for monitoring mining areas have also been highlighted in previous studies, which emphasize the importance of a multiparametric approach for distinguishing land-cover changes [29,49]. For example, Loukili et al. [50] used a combination of NDVI, NDBI, and NDWI to monitor a phosphate quarry, whereas Pacheco et al. [51] combined spectral indices with PlanetScope imagery and machine-learning techniques to assess land-cover transformations in a mining-affected area. In the present study, the combined use of NDVI, BSI, and NDBI provided complementary information, with the inclusion of BSI enabling a more detailed characterization of the formation and expansion of exposed soil and rock surfaces, which are characteristic features of active surface mining.
However, spectral indices alone do not provide information on the timing and temporal dynamics of the detected changes. To address this limitation, the present study combined spectral-index analysis with nonparametric trend analysis and the LandTrendr algorithm. Although LandTrendr was originally developed for monitoring forest disturbance and recovery, it has increasingly been applied to assess anthropogenic land-cover changes, including the monitoring and restoration of surface quarries [47,52]. Similarly, Xie et al. [53] applied LandTrendr to evaluate the long-term recovery of abandoned surface quarries using Landsat image time series, demonstrating its suitability for identifying both mining-induced changes and subsequent vegetation regeneration.
In the present study, the application of LandTrendr enabled the identification of the timing of the most pronounced changes in vegetation cover, complementing the information derived from spectral indices and nonparametric trend analysis with an explicit temporal dimension. The combined use of the Mann–Kendall test, Sen’s slope estimator, and the LandTrendr algorithm therefore provided a more comprehensive interpretation of both the spatial and temporal dynamics of mining-induced land-cover change.
The results of the LandTrendr algorithm may be influenced by the selected segmentation parameters, which affect the algorithm’s sensitivity to abrupt disturbances, gradual changes, and recovery trajectories [47,54]. In this study, the same parameter configuration was applied to both the NDVI and BSI time series to ensure the consistency and comparability of the detected temporal patterns.
The temporal distribution of changes identified by the LandTrendr algorithm is broadly consistent with the gradual expansion of quarrying activities. For NDVI, 70.91% of the pixels in the “Time of Largest Change” output fell within the 2019–2024 period, while 65.45% of the pixels in the “Time of Latest Change” output were concentrated in the 2023–2025 period. The most pronounced changes in vegetation cover were therefore concentrated mainly in the later phase of the study period. However, short-term fluctuations in quarrying intensity—including the decline in production during 2020–2021—may not be immediately reflected in the timing of spectral changes, as these may also be associated with preparatory work, vegetation removal, and overburden stripping. Overall, the results suggest that LandTrendr is more effective at capturing the long-term temporal dynamics of vegetation-cover change and surface exposure associated with quarry development than at reflecting year-to-year fluctuations in production volume.
The results of this case study indicate that the combined use of spectral indices, nonparametric trend analysis, and the LandTrendr algorithm provided a suitable framework for the long-term monitoring of changes at the active Dargov quarry. The individual methods provided complementary information, and their integration enabled the assessment of the spatial extent, statistical significance, and temporal evolution of the detected changes. Under the conditions of the analyzed site, such an approach may support the monitoring of quarry development, environmental impact assessment, and the provision of spatial information for decision-making in mineral resource management and permitting processes, including the EIA process. The added value of the integrated approach lies in combining information on the type of land-cover change, the direction and statistical significance of long-term trends, and the timing and recurrence of the identified changes.
Despite their moderate spatial resolution, Landsat data have been successfully used in previous studies for long-term monitoring of surface-quarry expansion and changes in vegetation and land cover in mining areas [49,55,56]. These studies highlight the usefulness of 30 m Landsat data, particularly for detecting long-term and spatially extensive changes. At the Dargov site, the consistency of the identified changes is further supported by the spatial correspondence between declining NDVI, increasing BSI and NDBI, and the concentration of statistically significant trends within the active part of the quarry.
The 30 m spatial resolution of Landsat imagery does not allow for the detection of small-scale changes within individual quarry benches or detailed vegetation-cover changes, representing one of the main limitations of medium-resolution satellite data [57]. Although the use of annual image composites reduces the influence of seasonal variability, it may also mask short-term changes associated with quarry development within individual years. Because the analysis was based on a consistent July–August time window, the results characterize long-term interannual changes during the summer period and do not capture seasonal variability in the spectral indices or the detected changes. In addition, the accuracy of the identified trends depends on the availability of suitable cloud-free imagery.
Future research could focus on integrating higher-resolution remote sensing data, such as Sentinel-2 imagery or airborne laser scanning (LiDAR), to characterize the spatial dynamics of changes in active quarries in greater detail. Another promising direction is the integration of multi-source remote sensing data with machine-learning techniques for the automated detection and classification of mining-induced changes. Future research should test the proposed methodological approach at additional surface quarries to assess its robustness, reproducibility, and applicability under different geological, climatic, and environmental conditions.

5. Conclusions

The objective of this study was to evaluate the potential of Landsat image time series, spectral indices, nonparametric trend analysis, and the LandTrendr algorithm for the long-term monitoring of changes in the active Dargov quarry between 2009 and 2025. Based on the results obtained, the following main conclusions can be drawn:
  • The expansion of the quarry was accompanied by a gradual loss of vegetation cover and an increase in the proportion of exposed surfaces, as reflected by decreasing NDVI and increasing BSI and NDBI values, particularly within the active part of the quarry. The Mann–Kendall test and Sen’s slope estimator identified statistically significant long-term trends, while LandTrendr enabled the identification of the periods of the most pronounced changes.
  • The spectral indices showed a substantially stronger relationship with cumulative quarry production than with annual production, while neither a one-year nor a two-year lag strengthened these relationships. The spectral changes observed therefore appear to be more closely associated with the cumulative transformation of the quarry surface than with short-term fluctuations in annual production.
  • The combined use of spectral indices, nonparametric trend analysis, and the LandTrendr algorithm enabled the assessment of the nature, spatial extent, statistical significance, and temporal progression of the detected changes. The Dargov case study highlights the potential of this methodological approach for long-term monitoring of changes associated with surface mining and for supporting environmental impact assessment and decision-making processes.
  • The wider applicability of the methodological approach requires validation at additional surface quarries under different geological, climatic, and environmental conditions. Future research should also focus on integrating higher-spatial-resolution data, particularly Sentinel-2 and LiDAR, to enable a more detailed assessment of changes within individual parts of the quarry, as well as on incorporating meteorological and other environmental factors when interpreting short-term variability in spectral indices.

Author Contributions

Z.K.: conceptualization, methodology, software, validation, formal analysis, resources, data curation, writing—original draft preparation, writing—review and editing, visualization; S.K.: conceptualization, methodology, validation, formal analysis, investigation, data curation, writing—original draft preparation, visualization; D.B.: conceptualization, methodology, formal analysis, investigation, data curation, writing—original draft preparation, visualization; M.R.: conceptualization, investigation, writing—original draft preparation; M.S.V.: conceptualization, investigation, writing—original draft preparation. All authors have read and agreed to the published version of the manuscript.

Funding

This research received no external funding.

Data Availability Statement

Data are available on reasonable request.

Conflicts of Interest

The authors declare no conflicts of interest.

Abbreviations

The following abbreviations are used in this manuscript:
GISGeographical Information System
NDVIThe Normalized Difference Vegetation Index
NDBIThe Normalized Difference Built-up Index
BSIThe Bare Soil Index
NIRNear-Infrared
SWIRShort-Wave Infrared
QAQuality Assessment

Appendix A

Table A1. Descriptive statistics of NDVI for the entire study area during 2009–2025.
YearMinMaxMeanStd. Dev.
20090.130.540.450.04
20100.120.530.440.04
20110.070.530.440.05
20130.080.520.450.05
20140.080.520.430.05
20150.070.520.440.05
20160.050.560.440.05
20170.070.550.430.05
20180.080.530.450.05
20190.050.570.430.05
20200.040.550.440.06
20210.140.520.450.05
20220.070.510.390.06
20230.060.520.430.06
20240.060.540.430.06
20250.050.530.440.06
Table A2. Descriptive statistics of BSI for the entire study area during 2009–2025.
YearMinMaxMeanStd. Dev.
2009−0.210.04−0.150.02
2010−0.220.04−0.140.02
2011−0.220.04−0.140.02
2013−0.200.06−0.150.03
2014−0.210.04−0.150.03
2015−0.220.07−0.150.03
2016−0.240.05−0.150.03
2017−0.230.05−0.140.03
2018−0.210.06−0.150.03
2019−0.250.06−0.140.03
2020−0.240.06−0.150.03
2021−0.210.02−0.160.03
2022−0.190.06−0.110.03
2023−0.200.05−0.140.03
2024−0.210.06−0.140.03
2025−0.210.06−0.140.03
Table A3. Descriptive statistics of NDBI for the entire study area during 2009–2025.
YearMinMaxMeanStd. Dev.
2009−0.31−0.02−0.220.02
2010−0.31−0.04−0.210.02
2011−0.31−0.02−0.210.02
2013−0.280.03−0.230.04
2014−0.30−0.01−0.220.03
2015−0.300.02−0.220.03
2016−0.33−0.02−0.230.03
2017−0.32−0.01−0.210.03
2018−0.300.01−0.220.03
2019−0.340.02−0.210.03
2020−0.340.02−0.230.04
2021−0.30−0.05−0.240.03
2022−0.270.00−0.170.04
2023−0.280.00−0.210.04
2024−0.300.01−0.210.04
2025−0.300.00−0.220.04
Table A4. Area and proportion of spectral-index intervals within the Dargov deposit boundary in 2009, 2015, and 2025.
IndexInterval200920152025
ha *%ha%ha%
NDVI≤0.10000.727.23.2432.4
>0.10 to ≤0.200.727.20.545.41.6216.2
>0.20 to ≤0.300.818.10.818.11.0810.8
>0.30 to ≤0.401.7117.11.4414.41.0810.8
>0.406.7567.66.4864.92.9729.7
BSI≤−0.107.3873.97.0270.33.0630.6
>−0.10 to ≤0.002.1621.61.6216.22.5225.2
>0.00 to ≤0.020.272.70.272.70.818.1
>0.02 to ≤0.040.181.80.363.61.2612.6
>0.04000.727.22.3423.4
NDBI≤−0.25000.090.900.0
>−0.25 to ≤−0.157.8378.47.4774.83.4234.2
>−0.15 to ≤−0.051.7117.11.2612.62.5225.2
>−0.05 to ≤0.000.454.50.999.93.8738.7
>0.00000.181.80.181.8
* The analyzed raster area within the deposit boundary comprised 111 Landsat pixels (9.99 ha); each 30 × 30 m pixel represents 0.09 ha.

References

  1. European Commission; Directorate-General for Environment. Guidance Document on Non-Energy Mineral Extraction and Natura 2000: A Summary; Publications Office of the European Union: Luxembourg, 2019; ISBN 978-92-79-99542-2. Available online: https://data.europa.eu/doi/10.2779/985239 (accessed on 16 July 2026).
  2. European Commission, Directorate-General for Internal Market, Industry, Entrepreneurship and SMEs. EU Principles for Sustainable Raw Materials; Publications Office of the European Union: Luxembourg, 2021; ISBN 978-92-76-40054-7. Available online: https://data.europa.eu/doi/10.2873/09707 (accessed on 16 July 2026).
  3. European Parliament; Council of the European Union. Directive 2011/92/EU of the European Parliament and of the Council of 13 December 2011 on the Assessment of the Effects of Certain Public and Private Projects on the Environment (Codification). Off. J. Eur. Union 2012, L26, 1–21. Available online: http://data.europa.eu/eli/dir/2011/92/oj (accessed on 16 July 2026).
  4. European Parliament; Council of the European Union. Directive 2001/42/EC of the European Parliament and of the Council of 27 June 2001 on the Assessment of the Effects of Certain Plans and Programmes on the Environment. Off. J. Eur. Communities 2001, L197, 30–37. Available online: http://data.europa.eu/eli/dir/2001/42/oj (accessed on 16 July 2026).
  5. Macdonald, S.E.; Landhäusser, S.M.; Skousen, J.; Franklin, J.; Frouz, J.; Hall, S.; Jacobs, D.F.; Quideau, S. Forest Restoration Following Surface Mining Disturbance: Challenges and Solutions. New For. 2015, 46, 703–732. [Google Scholar] [CrossRef] [Scilit]
  6. Mi, J.; Hou, H.; Jin, Z.; Yang, X.; Hua, Y. Long-Term Impact of Ground Deformation on Vegetation in an Underground Mining Area: Its Mechanism and Suggestions for Revegetation. Land 2023, 12, 1231. [Google Scholar] [CrossRef] [Scilit]
  7. Feng, Y.; Wang, J.; Bai, Z.; Reading, L. Effects of Surface Coal Mining and Land Reclamation on Soil Properties: A Review. Earth-Sci. Rev. 2019, 191, 12–25. [Google Scholar] [CrossRef] [Scilit]
  8. Juanda, E.T.; Martono, D.N.; Saria, L. Analysis Vegetation Change on Coal Mine Reclamation Using Normalized Difference Vegetation Index (NDVI). IOP Conf. Ser. Earth Environ. Sci. 2021, 716, 012035. [Google Scholar] [CrossRef] [Scilit]
  9. Adjiski, V.; Zubíček, V. Continuous Monitoring of the Mining Activities, Restoration Vegetation Status and Solar Farm Growth in Coal Mine Region Using Remote Sensing Data. Min. Rev. 2023, 29, 26–41. [Google Scholar] [CrossRef] [Scilit]
  10. Kuzevic, S.; Bobikova, D.; Kuzevicova, Z. Land Cover and Vegetation Coverage Changes in the Mining Area—A Case Study from Slovakia. Sustainability 2022, 14, 1180. [Google Scholar] [CrossRef] [Scilit]
  11. Yang, Z.; Li, W.; Li, L.; Lei, S.; Tian, J.; Wang, G.; Sang, X. Spatiotemporal Variation and Influencing Factors of Vegetation Growth in Mining Areas: A Case Study in a Colliery in Northern China. Sustainability 2022, 14, 9585. [Google Scholar] [CrossRef] [Scilit]
  12. Latifovic, R.; Fytas, K.; Chen, J.; Paraszczak, J. Assessing Land Cover Change Resulting from Large Surface Mining Development. Int. J. Appl. Earth Obs. Geoinf. 2005, 7, 29–48. [Google Scholar] [CrossRef] [Scilit]
  13. Schueler, V.; Kuemmerle, T.; Schröder, H. Impacts of Surface Gold Mining on Land Use Systems in Western Ghana. Ambio 2011, 40, 528–539. [Google Scholar] [CrossRef] [Scilit] [PubMed]
  14. Tagoe, N.D.; Mantey, S. Mapping the Effects of Anthropogenic Activities in the Catchment of Weija Reservoir Using Remote Sensing Techniques. Ghana Min. J. 2020, 17, 6–11. [Google Scholar] [CrossRef] [Scilit]
  15. Orimoloye, I.R.; Ololade, O.O. Spatial Evaluation of Land-Use Dynamics in Gold Mining Area Using Remote Sensing and GIS Technology. Int. J. Environ. Sci. Technol. 2020, 17, 4465–4480. [Google Scholar] [CrossRef] [Scilit]
  16. Zhou, Y.; Li, C.; Yang, W. Dynamic Assessment of the Eco-Environmental Effects of Open-Pit Mining: A Case Study in a Coal Mining Area (Inner Mongolia, Western China). Sustainability 2025, 17, 5078. [Google Scholar] [CrossRef] [Scilit]
  17. Yin, H.; Prishchepov, A.V.; Kuemmerle, T.; Bleyhl, B.; Buchner, J.; Radeloff, V.C. Mapping Agricultural Land Abandonment from Spatial and Temporal Segmentation of Landsat Time Series. Remote Sens. Environ. 2018, 210, 12–24. [Google Scholar] [CrossRef] [Scilit]
  18. Shimizu, K.; Murakami, W.; Furuichi, T.; Estoque, R.C. Mapping Land Use/Land Cover Changes and Forest Disturbances in Vietnam Using a Landsat Temporal Segmentation Algorithm. Remote Sens. 2023, 15, 851. [Google Scholar] [CrossRef] [Scilit]
  19. Kumari, A.; Karthikeyan, S. A Comparative Analysis for Forty Years of Land Use Land Cover Change (1991–2021) Using Cart and Random Forest Classifiers for Varanasi District (India). SN Comput. Sci. 2025, 6, 251. [Google Scholar] [CrossRef] [Scilit]
  20. Maxwell, A.E.; Warner, T.A.; Fang, F. Implementation of machine-learning classification in remote sensing: An applied review. Int. J. Remote Sens. 2018, 39, 2784–2817. [Google Scholar] [CrossRef] [Scilit]
  21. Xue, J.; Su, B. Significant Remote Sensing Vegetation Indices: A Review of Developments and Applications. J. Sens. 2017, 2017, 1353691. [Google Scholar] [CrossRef] [Scilit]
  22. Chen, Q.; Vaudour, E.; Richer-de-Forges, A.C.; Arrouays, D. Spectral Indices in Remote Sensing of Soil: Definition, Popularity, and Issues. A Critical Overview. Remote Sens. Environ. 2025, 329, 114918. [Google Scholar] [CrossRef] [Scilit]
  23. Berveglieri, A.; Imai, N.N.; Christovam, L.E.; Galo, M.L.B.T.; Tommaselli, A.M.G.; Honkavaara, E. Analysis of Trends and Changes in the Successional Trajectories of Tropical Forest Using the Landsat NDVI Time Series. Remote Sens. Appl. Soc. Environ. 2021, 24, 100622. [Google Scholar] [CrossRef] [Scilit]
  24. Himmy, O.; Nguyen, T.T.; Hemmler, K.S.; Loulad, S.; Rhinane, H.; Buerkert, A. Leveraging Machine Learning and Landsat Time Series for High-Resolution Mapping of Mining-Induced Vegetation Changes in Ouagadougou, Burkina Faso. Environ. Chall. 2024, 17, 101026. [Google Scholar] [CrossRef] [Scilit]
  25. Matejicek, L.; Kopackova, V. Changes in Croplands as a Result of Large Scale Mining and the Associated Impact on Food Security Studied Using Time-Series Landsat Images. Remote Sens. 2010, 2, 1463–1480. [Google Scholar] [CrossRef] [Scilit]
  26. Awasthi, M.P. Mapping and Analyzing Temporal Variability of Spectral Indices in the Lowland Region of Far Western Nepal. Water Pract. Technol. 2023, 18, 2971–2988. [Google Scholar] [CrossRef] [Scilit]
  27. Wahid, T.B.; Mushref, Z.J. Geospatial Analysis of Urban Expansion Using the NDBI Spectral Index and Landsat-8 Data. Eur. J. Sustain. Dev. Res. 2026, 10, em0362. [Google Scholar] [CrossRef] [Scilit] [PubMed]
  28. Zoum, F.A.; Fava, S.; Morelli, D.; Lika Ndimungiang, B. Assessing the Environmental Impacts of Alluvial Gold Mining in Betare-Oya, Cameroon (2021–2025): An Integrated Remote Sensing and Ground-Truthing Approach. New Countrys. 2025, 4, 72–99. [Google Scholar] [CrossRef] [Scilit]
  29. Michałowska, K.; Pirowski, T.; Głowienka, E.; Szypuła, B.; Malinverni, E.S. Sustainable Monitoring of Mining Activities: Decision-Making Model Using Spectral Indexes. Remote Sens. 2024, 16, 388. [Google Scholar] [CrossRef] [Scilit]
  30. Castellanos-Quiroz, H.O.A.; Ramírez-Daza, H.M.; Ivanova, Y. Detection of open-pit mining zones by implementing spectral indices and image fusion techniques. Dyna 2017, 84, 42–49. [Google Scholar] [CrossRef] [Scilit]
  31. Usmanov, B.M.; Isakova, L.S.; Mukharamova, S.S.; Akhmetzyanova, L.G.; Kuritsin, I.N. Automated detection of illegal nonmetallic minerals mining places according to Sentinel-2 data. In Earth Resources and Environmental Remote Sensing/GIS Applications XII; Schulz, K., Ed.; Proceedings of SPIE; SPIE: Bellingham, WA, USA, 2021; Volume 11863, p. 118631C. [Google Scholar] [CrossRef] [Scilit]
  32. Cheng, Y.-T.; Hoang, N.T.; Maupu, L.; Kanemoto, K. Classifying land use within 80,000 mining sites on a global scale. Sci. Data 2026, 13, 338. [Google Scholar] [CrossRef] [Scilit] [PubMed]
  33. Madasa, A.; Orimoloye, I.R.; Ololade, O.O. Application of geospatial indices for mapping land cover/use change detection in a mining area. J. Afr. Earth Sci. 2021, 175, 104108. [Google Scholar] [CrossRef] [Scilit]
  34. VSK MINERAL s.r.o. Dobývanie Ložiska Nevyhradeného Nerastu–Andezitu v Lome Dargov–Barvínkova: Zámer; Enviroportál, Slovenská Agentúra Životného Prostredia: Banská Bystrica, Slovakia, 2016. Available online: https://www.enviroportal.sk/eia/detail/dobyvanie-loziska-nevyhradeneho-nerastu-andezitu-v-lome-dargov-barvink (accessed on 13 July 2026).
  35. Hlavný Banský Úrad SR. Ročné Správy o Činnosti Hlavného Banského Úradu a Obvodných Banských Úradov SR; Hlavný Banský Úrad SR: Banská Štiavnica, Slovakia. Available online: https://www.hbu.sk/rocna-sprava-sprava-o-bozp/rocne-spravy (accessed on 14 July 2026).
  36. Lapin, M.; Faško, P.; Melo, M.; Šťastný, P.; Tomlain, J. Klimatické oblasti. In Atlas Krajiny Slovenskej Republiky; Miklós, L., Ed.; Ministerstvo Životného Prostredia SR; Slovenská Agentúra Životného Prostredia: Bratislava, Slovakia; Banská Bystrica, Slovakia, 2002; Mapa 27, mierka 1:1 000 000. [Google Scholar]
  37. U.S. Geological Survey (USGS). EarthExplorer. Available online: https://earthexplorer.usgs.gov/ (accessed on 22 May 2026).
  38. Arab, S.; Zelenak, D.; Foga, S.; Hansen, T. Landsat Quality Assessment ArcGIS Toolbox; U.S. Geological Survey Software Release; U.S. Geological Survey: Reston, VA, USA, 2024. [Google Scholar] [CrossRef]
  39. Flood, N. Seasonal Composite Landsat TM/ETM+ Images Using the Medoid (a Multi-Dimensional Median). Remote Sens. 2013, 5, 6481–6500. [Google Scholar] [CrossRef] [Scilit]
  40. Rouse, J.W.; Haas, R.H.; Schell, J.A.; Deering, D.W. Monitoring Vegetation Systems in the Great Plains with ERTS. In Proceedings of the Third Earth Resources Technology Satellite-1 Symposium, Greenbelt, MD, USA, 10–14 December 1973; NASA SP-351; NASA: Washington, DC, USA, 1974; Volume 1, pp. 309–317. [Google Scholar]
  41. Sun, W.; Zhang, H.; Cao, Y.; Zhang, X.; Ji, X.; Li, F. Monitoring the ecological environment of open–pit coalfields in cold zone of Northeast China using Landsat time series images of 2000–2015. Teh. Vjesn.–Tech. Gaz. 2017, 24, 129–139. [Google Scholar] [CrossRef] [Scilit]
  42. Zha, Y.; Gao, J.; Ni, S. Use of normalized difference built-up index in automatically mapping urban areas from TM imagery. Int. J. Remote Sens. 2003, 24, 583–594. [Google Scholar] [CrossRef] [Scilit]
  43. Rikimaru, A.; Roy, P.S.; Miyatake, S. Tropical Forest Cover Density Mapping. Trop. Ecol. 2002, 43, 39–47. [Google Scholar]
  44. Mzid, N.; Pignatti, S.; Huang, W.; Casa, R. An Analysis of Bare Soil Occurrence in Arable Croplands for Remote Sensing Topsoil Applications. Remote Sens. 2021, 13, 474. [Google Scholar] [CrossRef] [Scilit]
  45. Sen, P.K. Estimates of the Regression Coefficient Based on Kendall’s Tau. J. Am. Stat. Assoc. 1968, 63, 1379–1389. [Google Scholar] [CrossRef] [Scilit]
  46. Singh, P.; Kumar, V.; Thomas, T.; Arora, M. Basin-Wide Assessment of Temperature Trends in Northwest and Central India. Hydrol. Sci. J. 2008, 53, 421–433. [Google Scholar] [CrossRef] [Scilit]
  47. Kennedy, R.E.; Yang, Z.; Cohen, W.B. Detecting Trends in Forest Disturbance and Recovery Using Yearly Landsat Time Series: 1. LandTrendr–Temporal Segmentation Algorithms. Remote Sens. Environ. 2010, 114, 2897–2910. [Google Scholar] [CrossRef] [Scilit]
  48. Guo, J.; Li, Q.; Xie, H.; Li, J.; Qiao, L.; Zhang, C.; Yang, G.; Wang, F. Monitoring of Vegetation Disturbance and Restoration at the Dumping Sites of the Baorixile Open-Pit Mine Based on the LandTrendr Algorithm. Int. J. Environ. Res. Public Health 2022, 19, 9066. [Google Scholar] [CrossRef] [Scilit] [PubMed]
  49. Zhao, H.; Ma, Y.; Chen, F.; Liu, J.; Jiang, L.; Yao, W.; Yang, J. Monitoring Quarry Area with Landsat Long Time-Series for Socioeconomic Study. Remote Sens. 2018, 10, 517. [Google Scholar] [CrossRef] [Scilit]
  50. Loukili, I.; Laamrani, A.; El Ghorfi, M.; El Moutak, S.; ghafiri, A. Monitoring land changes at an open mine site using remote sensing and multi-spectral indices. Heliyon 2025, 11, e41845. [Google Scholar] [CrossRef] [Scilit] [PubMed]
  51. Pacheco, A.d.P.; Nascimento, J.A.S.d.; Ruiz-Armenteros, A.M.; da Silva Junior, U.J.; Junior, J.A.d.S.; de Oliveira, L.M.M.; Melo dos Santos, S.; Filho, F.D.R.; Pessoa Mello Galdino, C.A. Land Cover Transformations in Mining-Influenced Areas Using PlanetScope Imagery, Spectral Indices, and Machine Learning: A Case Study in the Hinterlands de Pernambuco, Brazil. Land 2025, 14, 325. [Google Scholar] [CrossRef] [Scilit]
  52. Yang, Y.; Erskine, P.D.; Lechner, A.M.; Mulligan, D.; Zhang, S.; Wang, Z. Detecting the dynamics of vegetation disturbance and recovery in surface mining area via Landsat imagery and LandTrendr algorithm. J. Clean. Prod. 2018, 178, 353–362. [Google Scholar] [CrossRef] [Scilit]
  53. Xie, J.; Liu, Y.; Xie, M.; Xia, L.; Yang, R.; Li, J. Exploring the Restoration Stability of Abandoned Open-Pit Mines by Vegetation Resilience Indicator Based on the LandTrendr Algorithm. Ecol. Indic. 2024, 166, 112392. [Google Scholar] [CrossRef] [Scilit]
  54. Kennedy, R.E.; Yang, Z.; Gorelick, N.; Braaten, J.; Cavalcante, L.; Cohen, W.B.; Healey, S. Implementation of the LandTrendr Algorithm on Google Earth Engine. Remote Sens. 2018, 10, 691. [Google Scholar] [CrossRef] [Scilit]
  55. Pericak, A.A.; Thomas, C.J.; Kroodsma, D.A.; Wasson, M.F.; Ross, M.R.V.; Clinton, N.E.; Campagna, D.J.; Franklin, Y.; Bernhardt, E.S.; Amos, J.F. Mapping the yearly extent of surface coal mining in central appalachia using landsat and google earth engine. PLoS ONE 2018, 13, e0197758. [Google Scholar] [CrossRef] [Scilit] [PubMed]
  56. Han, Y.; Ke, Y.; Zhu, L.; Feng, H.; Zhang, Q.; Sun, Z.; Zhu, L. Tracking vegetation degradation and recovery in multiple mining areas in Beijing, China, based on time-series Landsat imagery. GISci. Remote Sens. 2021, 58, 1477–1496. [Google Scholar] [CrossRef] [Scilit]
  57. Almalki, R.; Khaki, M.; Saco, P.M.; Rodriguez, J.F. Monitoring and Mapping Vegetation Cover Changes in Arid and Semi-Arid Areas Using Remote Sensing Technology: A Review. Remote Sens. 2022, 14, 5143. [Google Scholar] [CrossRef] [Scilit]
Figure 1. Workflow of the study methodology.
Geomatics 06 00098 g001
Figure 2. Study area of the Dargov quarry: (a) location within Slovakia; (b) detail of the study area showing the boundaries of the analyzed territory; (c) historical aerial photograph of the Dargov quarry from the 1950s (https://mapy.tuzvo.sk/hofm/, accessed on 11 July 2026).
Geomatics 06 00098 g002
Figure 3. Annual production of andesite at the Dargov quarry (2004–2025) [35].
Geomatics 06 00098 g003
Figure 4. Spatial distribution of NDVI values in the study area of the Dargov quarry: (a) year 2009; (b) year 2015; (c) year 2025.
Geomatics 06 00098 g004
Figure 5. Spatial distribution of BSI values in the Dargov: (a) year 2009; (b) year 2015; (c) year 2025.
Geomatics 06 00098 g005
Figure 6. Spatial Distribution of NDBI Values in the Dargov Quarry Study Area: (a) year 2009; (b) year 2015; (c) year 2025.
Geomatics 06 00098 g006
Figure 7. Temporal trends in mean NDVI, BSI, and NDBI values within the boundaries of the Dargov quarry from 2009 to 2025.
Geomatics 06 00098 g007
Figure 8. Spatial distribution of Sen’s slope and p-values for the NDVI, BSI, and NDBI indices for the period 2009–2025: (a) Sen’s slope of NDVI, (b) Sen’s slope of BSI, (c) Sen’s slope of NDBI, (d) p-value of NDVI, (e) p-value of BSI, and (f) p-value of NDBI.
Geomatics 06 00098 g008aGeomatics 06 00098 g008b
Figure 9. Orthophoto of the northwestern part of the study area: (a) the site’s condition in 2013, showing limited vegetation cover; (b) the site’s condition in 2022, documenting an increase in vegetation cover and gradual vegetation recovery.
Geomatics 06 00098 g009
Figure 10. LandTrendr analysis results derived from annual median NDVI and BSI composites for the period 2009–2025: (a) the time of the onset of the most significant decline in NDVI (Time of Largest Change—Beginning of segment); (b) the time of the end of the most significant decline in NDVI (Time of Latest Change—End of segment); (c) the time of the beginning of the most significant increase in BSI (Time of Largest Change—Beginning of segment); (d) the number of significant changes in NDVI identified by the LandTrendr algorithm (Number of Changes).
Geomatics 06 00098 g010aGeomatics 06 00098 g010b
Disclaimer/Publisher’s Note: The statements, opinions and data contained in all publications are solely those of the individual author(s) and contributor(s) and not of MDPI and/or the editor(s). MDPI and/or the editor(s) disclaim responsibility for any injury to people or property resulting from any ideas, methods, instructions or products referred to in the content.