2.1. Study Area
As mentioned in the introduction, two contrasting coastal regions were selected as study areas in order to evaluate the proposed two-stage semiempirical modeling framework.
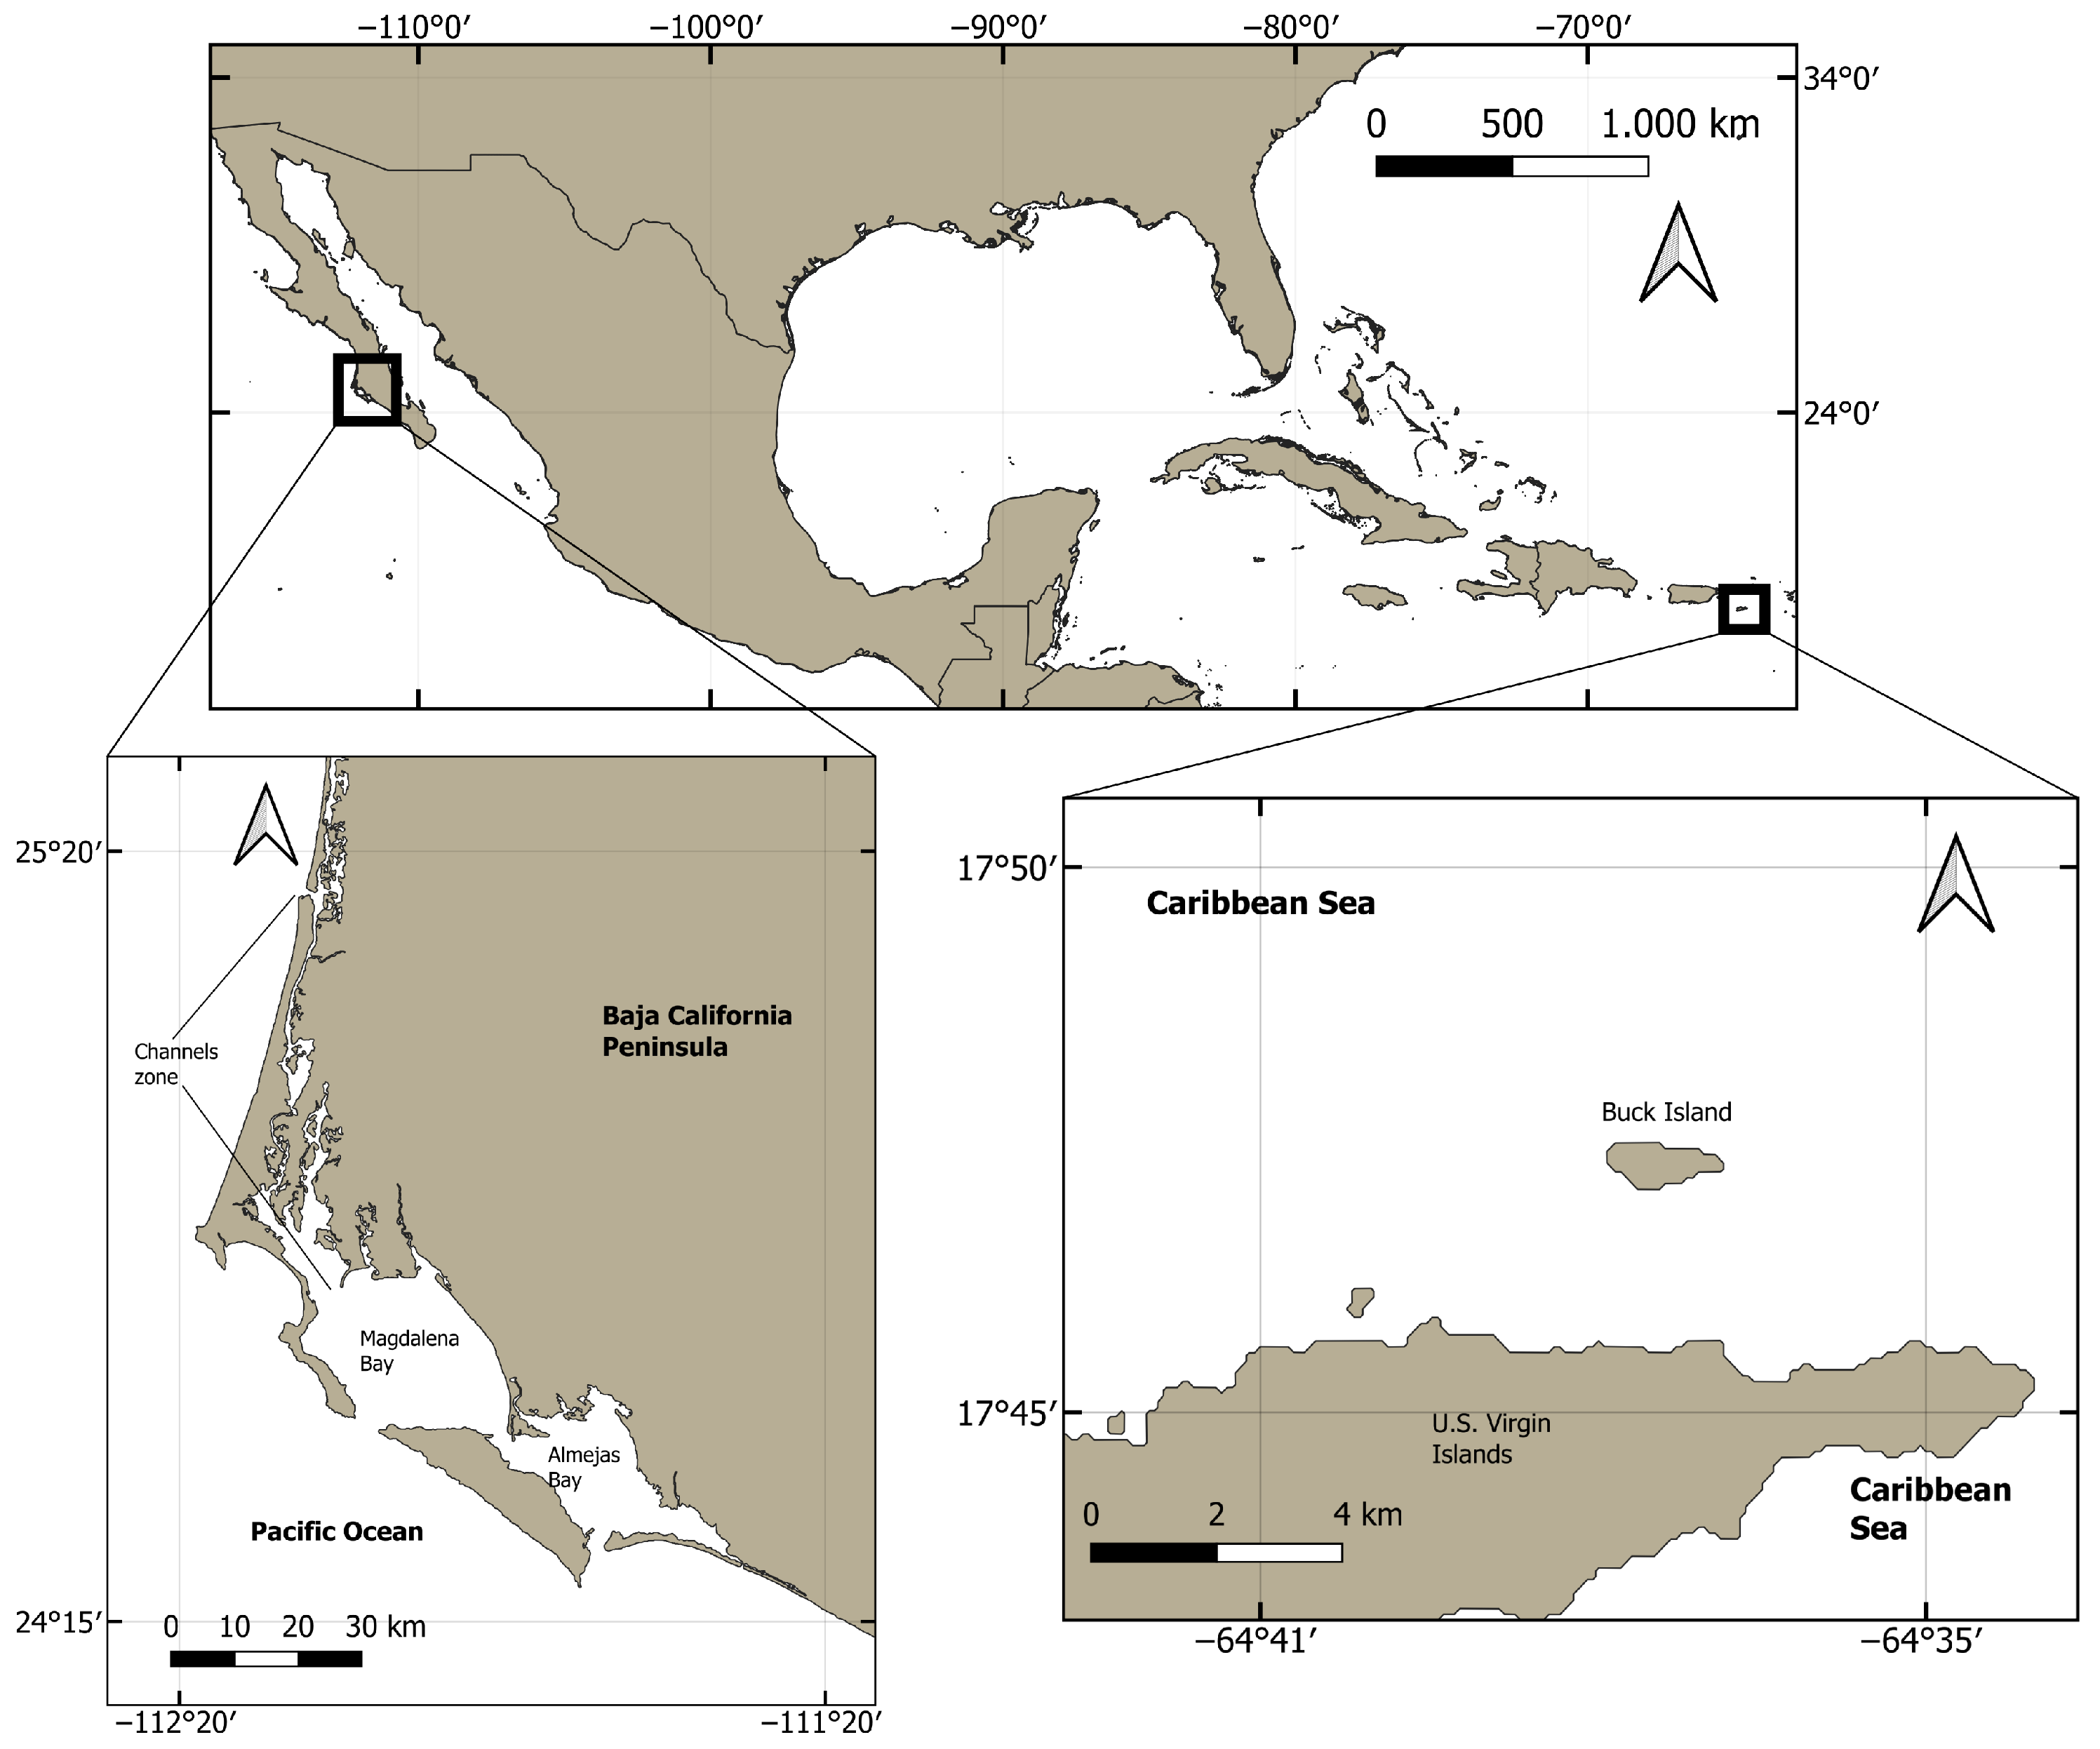
Figure 1 shows the geographic location of both study areas. The left and right panels highlight the study areas.
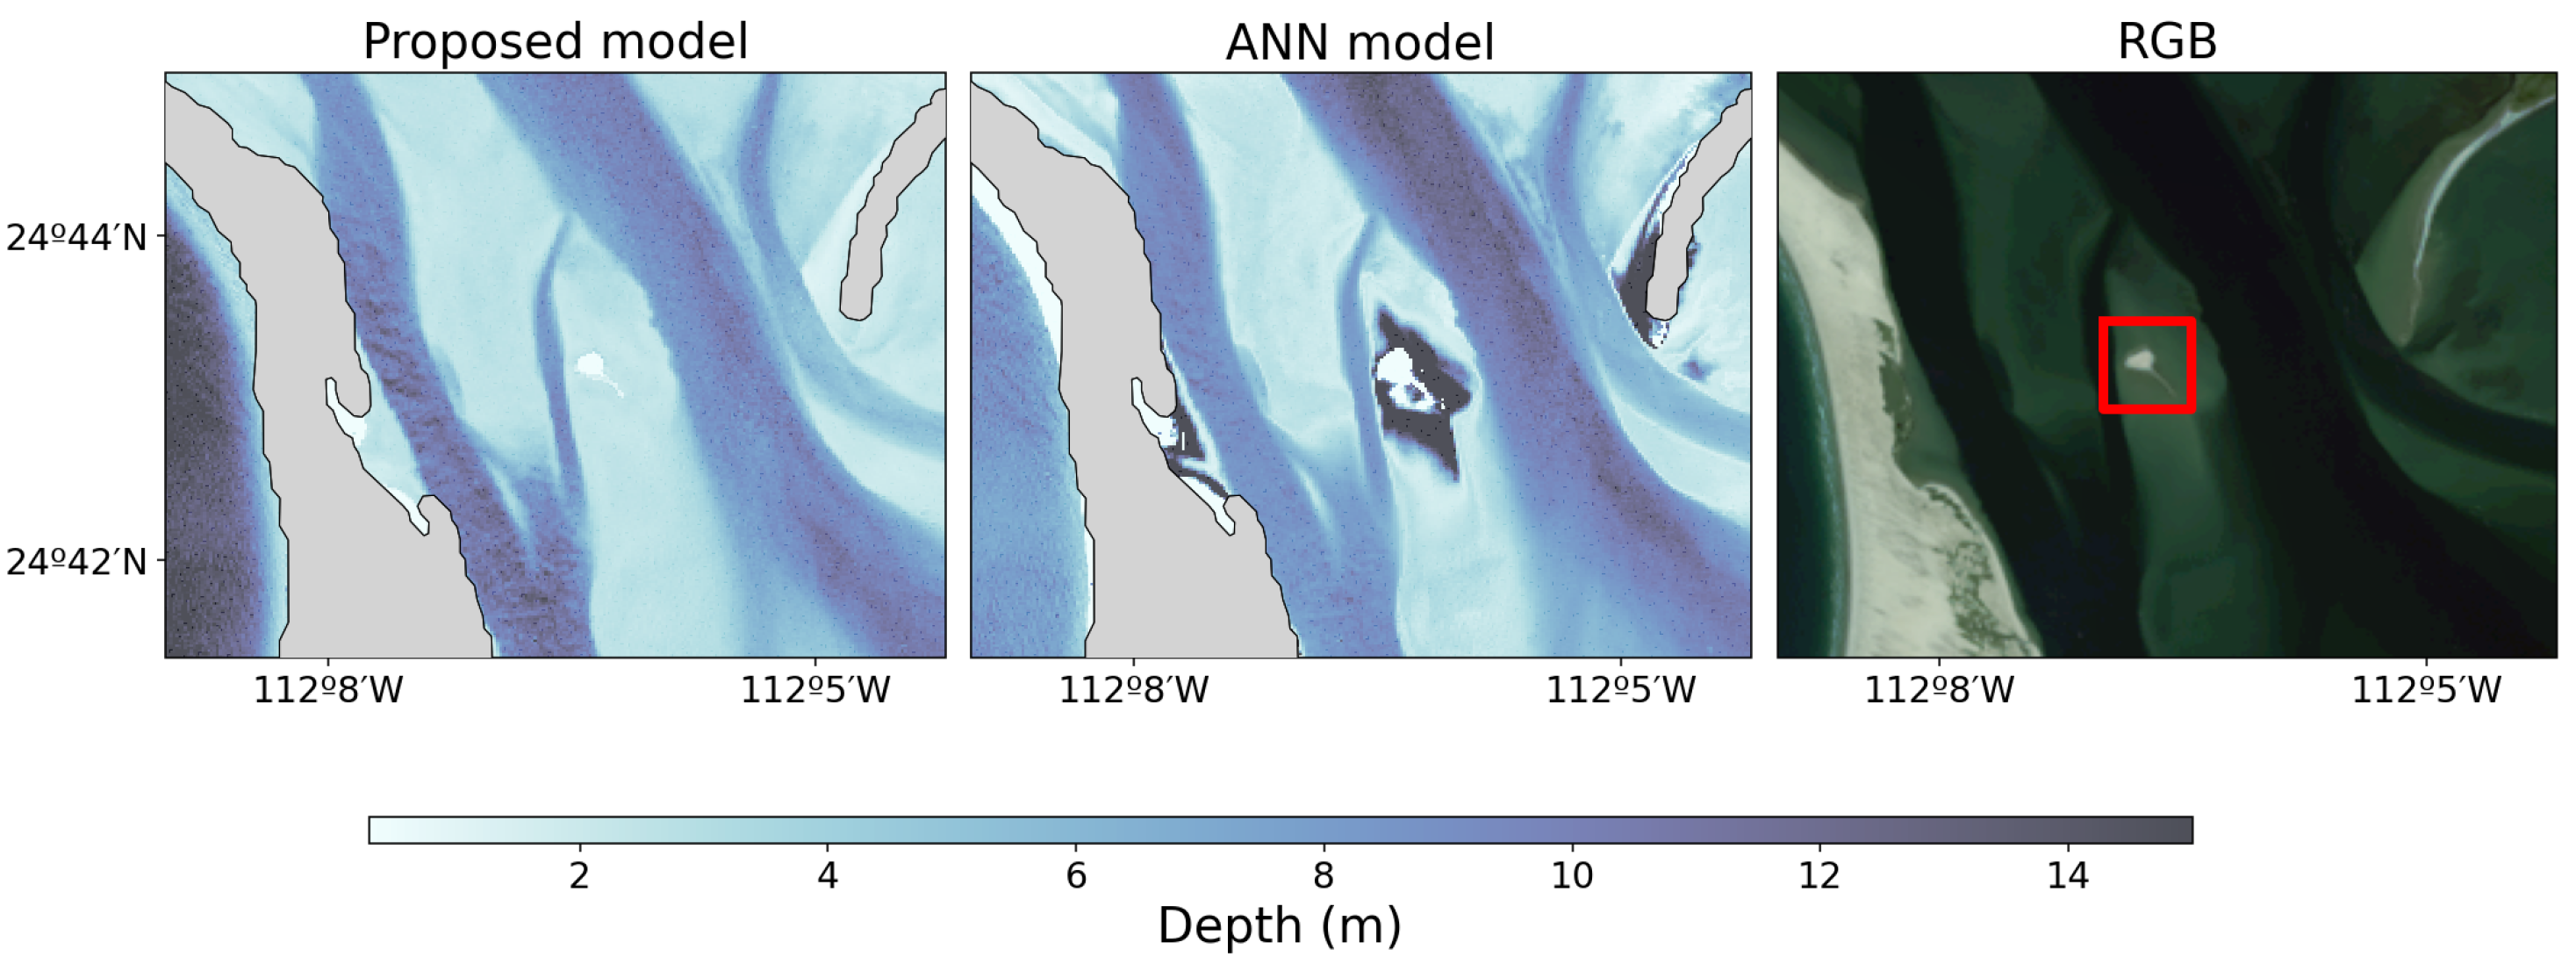
The first study area is the Magdalena-Almejas Lagoon System, located on the Pacific coast of Baja California Sur, Mexico, between 24°15′–25°20′ N and 111°20′–112°20′ W. This lagoon complex is partially separated from the Pacific Ocean by barrier islands and is one of the largest coastal lagoon systems in the North Pacific. The Magdalena-Almejas system can be divided into three main zones: (i) the northwestern “channels zone,” characterized by a complex morphology of estuaries, lagoons, and tidal channels; (ii) the central zone with Magdalena Bay, which represents the largest portion of the system; and (iii) the southeastern zone with Almejas Bay. Together, these subregions form a heterogeneous environment influenced by tidal exchange, fisheries, aquaculture, and port-related activities. This combination of ecological diversity and anthropogenic use makes it an important area for oceanographic and bathymetric studies. The polygon delimiting this study area is defined by the coordinates listed in
Table 2.
The second study area is the coastal zone surrounding Buck Island, in the U.S. Virgin Islands, located between 17°45′–17°50′ N and 64°41′–64°35′ W. Buck Island and its adjacent waters form part of a protected national monument characterized by clear shallow waters, coral reefs, and high ecological diversity. Unlike the Magdalena-Almejas Lagoon System, this site is an uninhabited island under strong governmental protection, subject to limited anthropogenic influence, and provides a more controlled natural setting. These features make Buck Island particularly suitable for testing satellite-derived bathymetry methods in clear-water conditions. The polygon defining this study area is presented in
Table 3.
Although both sites provide valuable testbeds for satellite-derived bathymetry, their benthic environments are markedly different. The Magdalena-Almejas Lagoon System is dominated by sandy sediments and areas of organic matter accumulation, with relatively turbid waters [
14]. In contrast, Buck Island features clear waters and a mosaic of habitats, including coral reefs, seagrass meadows, and hard bottoms [
1]. These contrasting conditions—one turbid, sediment-dominated lagoon system and one clear-water coral reef environment—are intended to test the robustness and adaptability of the proposed modeling framework.
2.2. Satellite Data and Preprocessing
Landsat 8 Operational Land Imager (OLI) scenes were selected for both study areas due to their 30 m spatial resolution, radiometric quality, and long-term availability. Although Copernicus Sentinel-2 offers higher geometric (10 m) and spectral resolution, Landsat 8 imagery was preferred because of its highly stable radiometric calibration, long temporal continuity, and the availability of the Level-1 Terrain Precision (L1TP) product, which provides systematic corrections using ground control points and digital elevation models. Some authors [
15] mention that both images can be effectively used for bathymetry with no alternative being reasonably superior in performance and working with a smaller volume of data in Landsat 8. A total of five images were acquired for the Magdalena-Almejas Lagoon System and two for Buck Island (
Table 4 and
Table 5). The selection was based on conditions that favor bathymetric retrieval: low turbidity (avoiding periods of high winds or sediment resuspension), less than 5% cloud cover, and tidal levels close to mean sea level (|MSL deviation| < 0.35 m for Magdalena-Almejas, verified with TPXO and tide tables [
16]). For Buck Island, a microtidal system, only images from calm meteorological conditions (winds < 5 m/s, based on NOAA data [
17]) were considered.
All imagery was obtained from the USGS Earth Explorer platform at the Level-1 Terrain Precision (L1TP) processing level. This dataset provides georeferenced and radiometrically calibrated data, but without atmospheric correction. To retrieve water-leaving reflectance, we applied the ACOLITE algorithm, which is designed for aquatic environments and corrects for atmospheric scattering, absorption, and sun-glint effects. This step ensures reflectance values suitable for shallow-water applications. In addition, reflectance values are converted to floating point numbers by the ACOLITE tool during atmospheric correction, ensuring the appropriate scaling and normalization of Landsat 8 data.
Additional preprocessing steps included cropping each scene to the polygons defining the study areas, reducing computational load, and focusing on the relevant coastal zones. Reflectance values were averaged across dates to reduce radiometric noise and transient variability associated with atmospheric conditions, illumination geometry, and water optical properties. This multitemporal approach enhances the signal-to-noise ratio, mitigates the effects of episodic events, and yields more stable and representative reflectance values for model calibration, thereby improving the robustness and generalization of the bathymetric estimation. In the case of Buck Island, only two images were used because the acquisition dates of the reference dataset were precisely known and the environmental conditions showed very low variability. Conversely, for the Magdalena-Almejas Lagoon System, a larger number of images were averaged due to greater uncertainty in the reference dates and higher temporal variability in water conditions.
Finally, a land mask was generated using the Normalized Difference Water Index (NDWI), calculated from green and near-infrared bands, with a threshold of NDWI > 0 to retain water pixels [
18]. This prevented contamination of the bathymetric analysis by land areas.
Images were further screened to exclude “bad-quality” pixels by combining detailed visual inspection with quantitative assessment. We conducted a systematic quality control of the study area subsets derived from the candidate Landsat 8 scenes listed in
Table 4 and
Table 5 using the QA_PIXEL standard described in the Landsat 8-9 Data Format Control Book [
19]. Collection 2 Level-1 QA_PIXEL bitmasks provided by USGS were used to generate cloud masks, excluding pixels flagged as cloudy, shadowed, or affected by cirrus. For each cropped scene, the relative cloud coverage was calculated with respect to valid pixels, yielding consistently low percentages in both study areas (all values below 0.5% for Magdalena-Almejas and below 0.1% for Buck Island). Furthermore, analysis of the QA_PIXEL unique values revealed that more than 93% of valid pixels corresponded to the high-confidence class for open water, indicating negligible contamination from clouds, shadows, snow, or other artifacts. Consequently, only the cropped subsets of these high-quality scenes (those listed in the tables) were retained for further processing, while other candidate acquisitions were discarded for not meeting these criteria.
To further validate the consistency of the retained subsets, spectral variance of the visible bands (red, green, and blue) was computed across valid pixels within each study area. In Magdalena-Almejas, mean variances were on the order of
, while Buck Island presented values of approximately
across all three bands. These low variances confirm the homogeneity of the cropped images and justify the averaging procedure applied to multiple acquisitions. By reducing residual temporal variability without introducing spurious noise, the averaging of reflectance values enhanced the signal-to-noise ratio and produced stable, high-quality inputs for subsequent bathymetric modeling following the approach in [
20]. This preprocessing workflow provided consistent, atmospherically corrected reflectance inputs for both study sites, ensuring comparability between the contrasting environments of a complex Lagoon System and a clear-water protected reef site.
2.3. Proposed Semiempirical Model
The estimation of bathymetry from satellite imagery is traditionally based on the exponential relationship between water depth and spectral reflectance, as described by the Beer–Lambert law. In this formulation, light intensity decreases exponentially with depth due to absorption and scattering, which makes logarithmic transformations a natural choice to linearize the reflectance–depth relationship [
2,
12]. Semiempirical models, such as those proposed by Lyzenga [
3] and Stumpf [
4], have successfully exploited this principle. Lyzenga’s method uses log-linear transformations of individual bands, while Stumpf’s widely used approach relies on the ratio of logarithms of two bands. Although both strategies provide transparency and interpretability, they are limited in their capacity to fully capture depth-sensitive spectral variability across diverse coastal environments.
In this work, we propose an alternative formulation based on log-ratio reflectance indices, defined as the logarithm of the ratio between two bands, rather than the ratio of logarithms. This distinction, although subtle, has significant implications: by applying the logarithm directly to the band ratio, the index simultaneously normalizes for illumination effects (as in ratio models) and linearizes the exponential depth dependence (as in log-transform models). This combination seeks to retain the physical interpretability of semiempirical approaches while enhancing stability under different optical conditions.
Two log-ratio reflectance indices are introduced:
where
G,
B, and
R represent green, blue, and red reflectance values, respectively. The green/blue ratio is sensitive to depth due to the relatively high penetration of green light and reduced absorption compared to other wavelengths, making it particularly suitable for shallow waters. The red/blue ratio, in contrast, captures complementary information from the rapid attenuation of red light, which is valuable for characterizing very shallow zones and enhancing residual contrasts.
To incorporate both indices effectively, we adopt a two-stage regression framework:
In the first stage, an exponential model is fitted between
(green/blue log-ratio) and depth:
where
Z is the estimated depth,
and
are regression parameters, and
denotes the residuals not explained by the model.
In the second stage, the residual
is modeled as a quadratic function of
(red/blue log-ratio):
where
,
, and
are regression parameters optimized from the data.
Combining both stages yields the final model:
This formulation leverages the dominant depth signal from the green/blue index while refining unexplained variance using complementary information from the red/blue index. By structuring the model in two steps, it explicitly accounts for nonlinearities and residual variability, improving predictive accuracy while retaining interpretability.
Model calibration was performed in MATLAB by developing custom functions that used the in situ reference points to minimize the squared error between predicted and observed depths using the Nelder–Mead simplex algorithm (fminsearch).
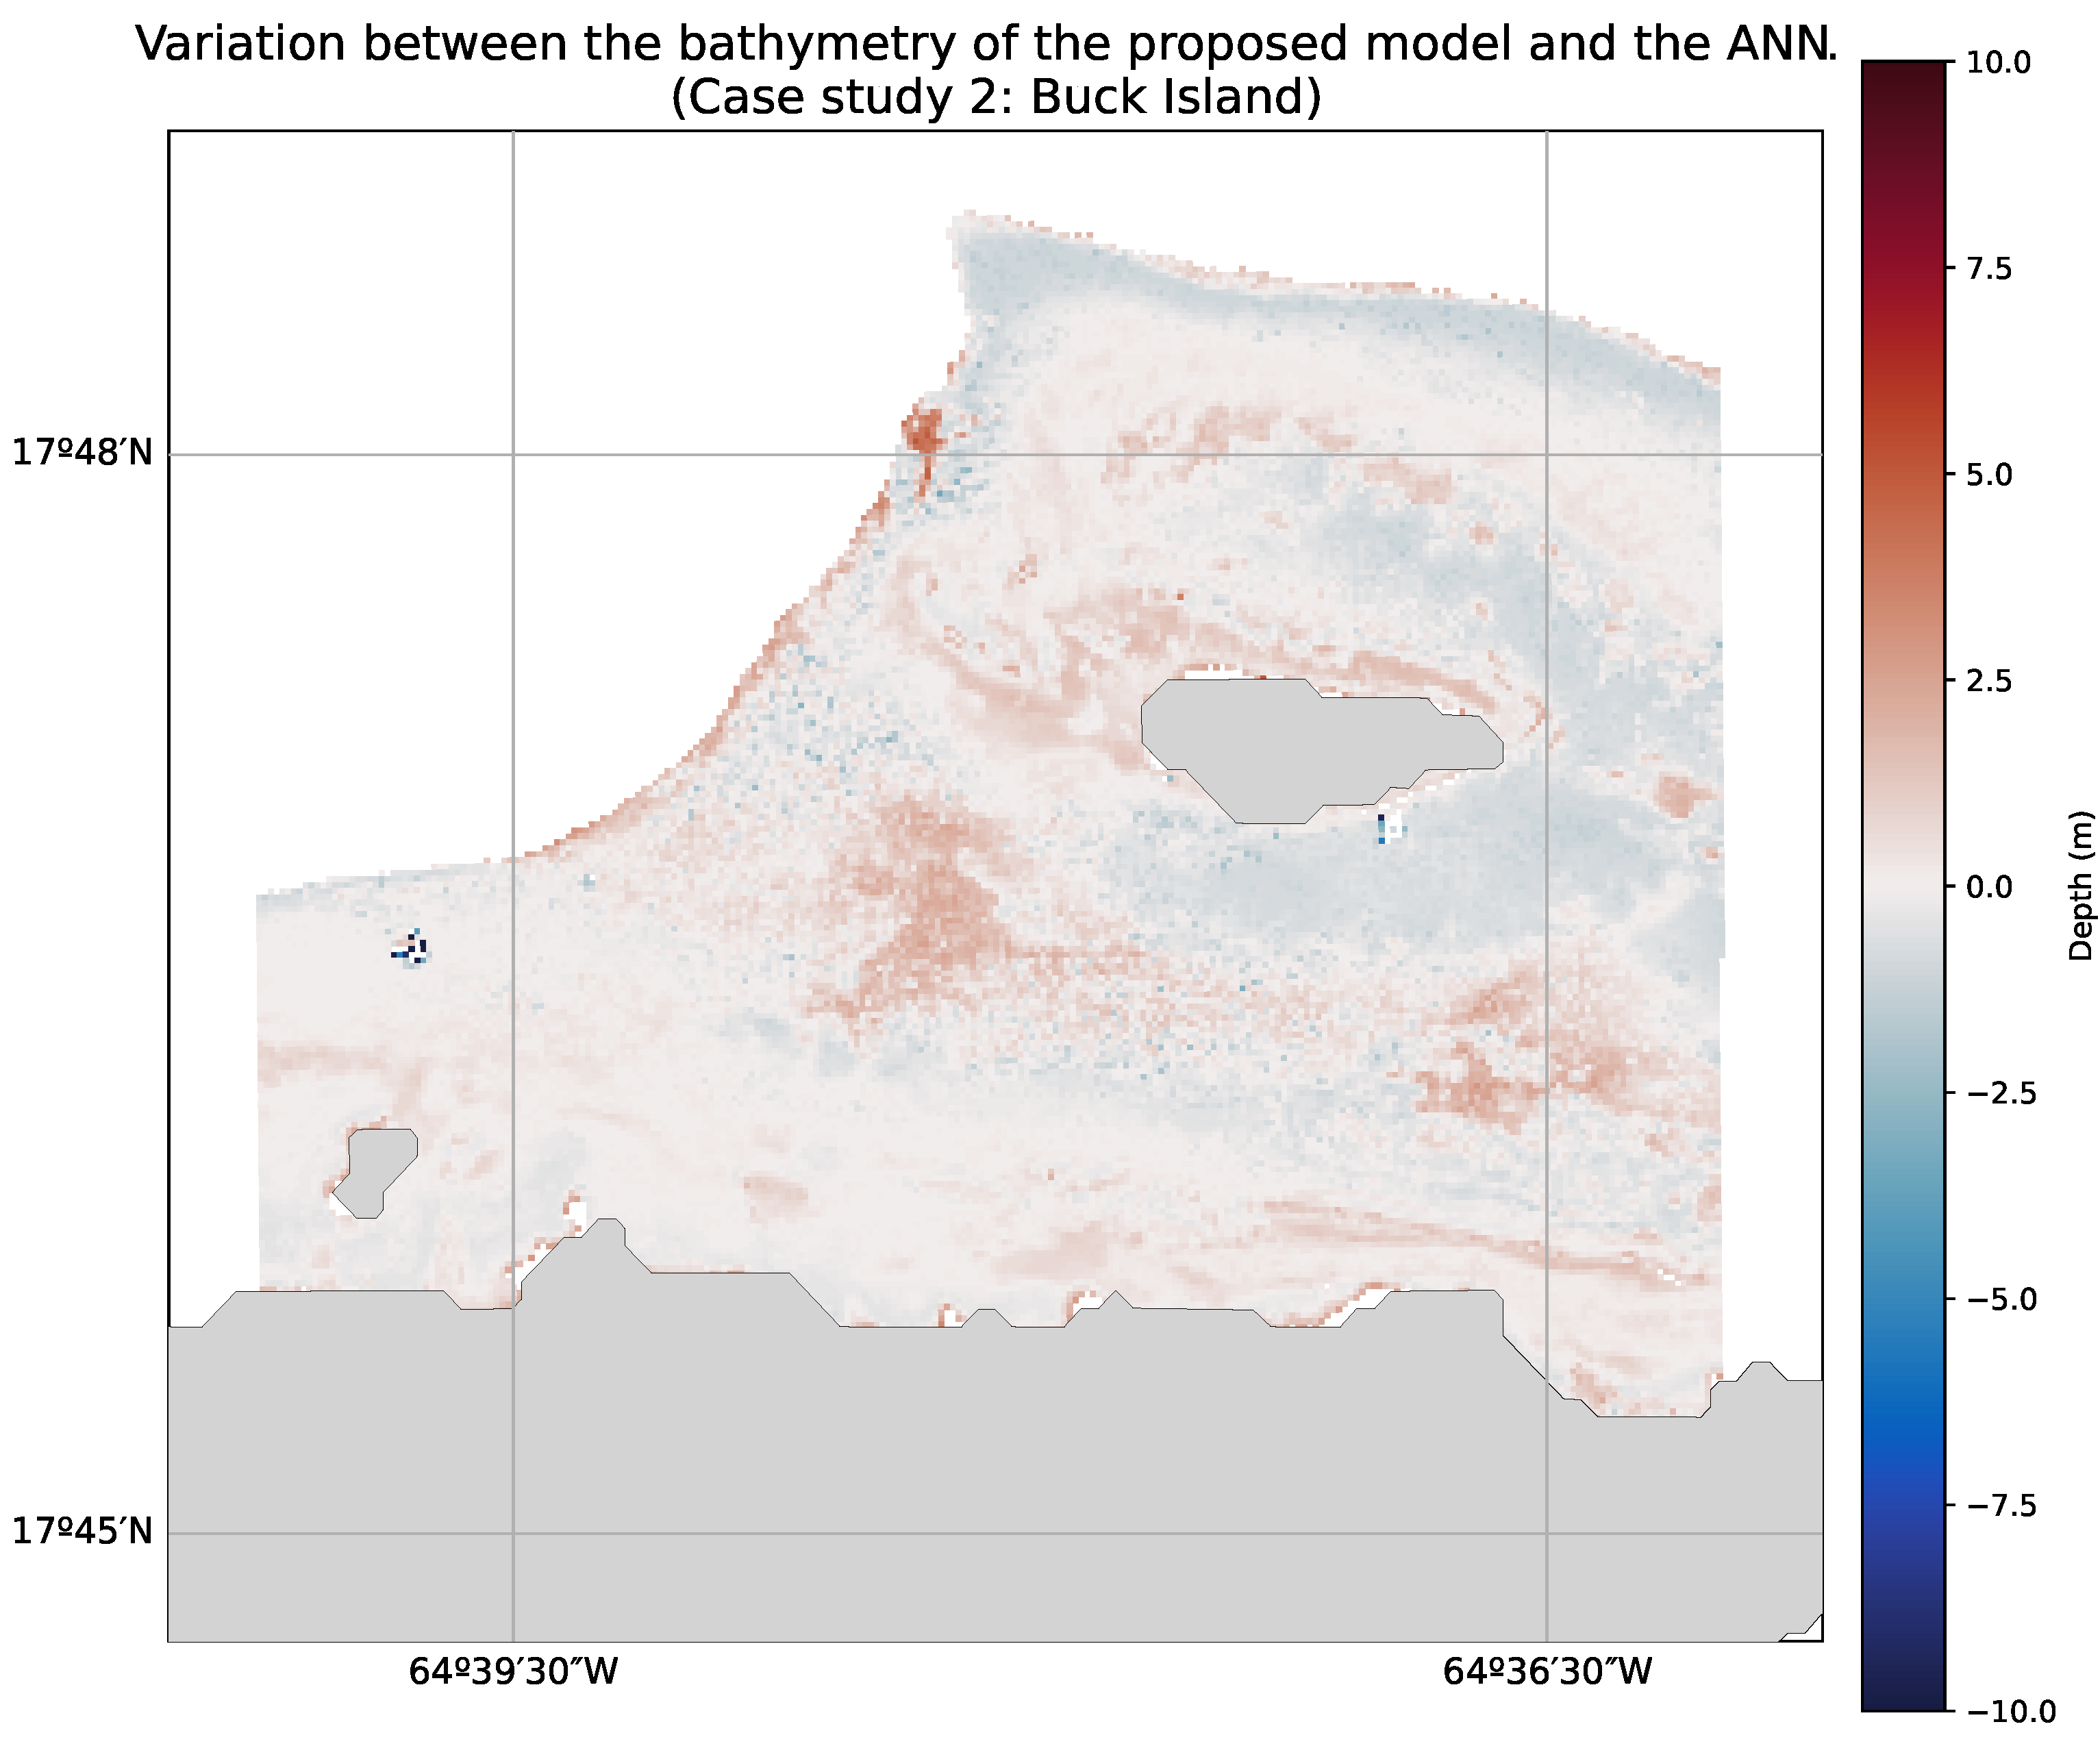
To benchmark the proposed method, we implemented several semiempirical models from the literature, including those by Lyzenga, Stumpf, and Hashim, as well as a machine learning-based ANN. All the semiempirical models were implemented in MATLAB and calibrated using the same optimization process as in the proposed method, whereas the ANN was trained using MATLAB’s default settings, i.e., one hidden layer of 20 neurons using a tansig transfer function, and a linear output layer (purelin). Training was performed with the Levenberg–Marquardt backpropagation algorithm (trainlm), using 70% of the data for training, 15% for validation, and 15% for testing. The performance function was the mean squared error (MSE), and early stopping was applied if the validation error failed to improve for six consecutive iterations (max_fail = 6). The maximum number of epochs was set to 1000, and the default MATLAB parameters for the Levenberg–Marquardt adjustment (mu initialization and update factors) were used.
Finally,
k-fold cross-validation was employed across all models to evaluate generalization capacity and reduce the risk of overfitting, ensuring a fair comparison between approaches. In this procedure, the available dataset is randomly partitioned into
k equally sized subsets (folds). At each iteration, one fold is reserved for validation while the remaining
folds are used for calibration; the process is repeated
k times so that every observation is used for both training and validation exactly once. The final performance metric is obtained by averaging across the
k iterations, which provides a robust estimate of model accuracy and stability [
21].
2.4. In Situ Data and Validation Strategy
High-quality in situ data are essential for calibrating and validating satellite-derived bathymetry models. In this study, reference measurements served both purposes: part of the dataset was used to estimate model parameters, while the remainder was reserved for independent validation.
For the Buck Island study area, a total of 34,692 points were collected by Leading Edge Geomatics using a Riegl VQ-880-G II sensor, covering depths from 0.01 m to 28.16 m. These airborne LiDAR-derived data, obtained between January and June 2019, provide highly reliable and accurate bathymetric information. Reflectance ranges were red (0.00008–0.3130), green (0.0087–0.3425), and blue (0.0150–0.3321). The abundance and quality of this dataset enable rigorous model testing under clear-water conditions.
According to the accuracy reports included in the metadata, the 2019 NOAA NGS topobathymetric LiDAR survey over Buck Island achieved a horizontal accuracy of ±0.70 m and a bathymetric vertical accuracy of ±0.24 m at the 95% confidence level. These values are well within the requirements of International Hydrographic Organization (IHO) S-44 Order 1a, and the horizontal accuracy even approaches the more stringent thresholds of the Special Order. The reported Non-Vegetated Vertical Accuracy (0.168 m) and Bathymetric RMSE
z (0.236 m) indicate that the dataset provides highly reliable depth measurements suitable for coastal mapping and navigation safety. A comparison between the dataset used and IHO S-44 requirements is presented in
Table 6.
Although the metadata does not explicitly assign a Category Zone of Confidence (CATZOC category), the achieved accuracies are consistent with the standards expected for high-quality hydrographic surveys (CATZOC A2/B) as shown in
Table 7. Therefore, this dataset can be considered highly trustworthy for both scientific and operational applications.
For the Magdalena-Almejas Lagoon System, direct measurements were not available, and depths were instead derived from digitized nautical charts. A total of 128 points were extracted, providing coverage across depths from 0.30 m to 25.6 m. Although limited in number, these points represent a valuable reference for assessing the model in a data-scarce context. The corresponding reflectance values for the RGB bands fall within the following intervals: red (0.0043–0.0505), green (0.0133–0.0758), and blue (0.0182–0.0562).
The nautical chart employed for the Magdalena-Almejas Lagoon System corresponds to a historical map published by the U.S. Defense Mapping Agency, based on surveys conducted by the U.S.S. Thetis with subsequent additions and corrections up to 1970. Depths are reported as spot soundings in fathoms, later digitized and converted to metric units for use in this study. Although these data predate the introduction of modern IHO S-44 standards and do not include a formal CATZOC classification, their use is justified by the lack of recent hydrographic surveys in the area, particularly the absence of open-access surveys. The available soundings thus constitute the only reference dataset for calibration and validation of satellite-derived bathymetry in this lagoon system. From a methodological perspective, this provides an opportunity to evaluate the robustness and transferability of the proposed approach under conditions of scarce and uncertain ground-truth data, complementing the high-quality LiDAR-derived dataset available for Buck Island.
Given the spatial resolution of Landsat 8 imagery (30 m), satellite pixels do not coincide exactly with point measurements. To minimize misalignment, the nearest pixel to each geographic coordinate was selected, ensuring the best possible match between reflectance and depth. For each in situ point, we calculate the coordinates of the center of each pixel and assign the in situ point to the pixel whose center is closest. We also verified that no pixel center is assigned to more than one in situ point, avoiding duplication and ensuring that reflectance values are matched consistently to reference depths.
For model development, the data were partitioned into 70% for calibration and 30% for independent validation. Within the calibration set, k-fold cross-validation was applied to optimize model parameters and assess stability. A value of was used for Buck Island, where the dataset is large, and for Magdalena-Almejas, to ensure sufficient data within each fold. This strategy balances robustness with computational feasibility while preventing overfitting.
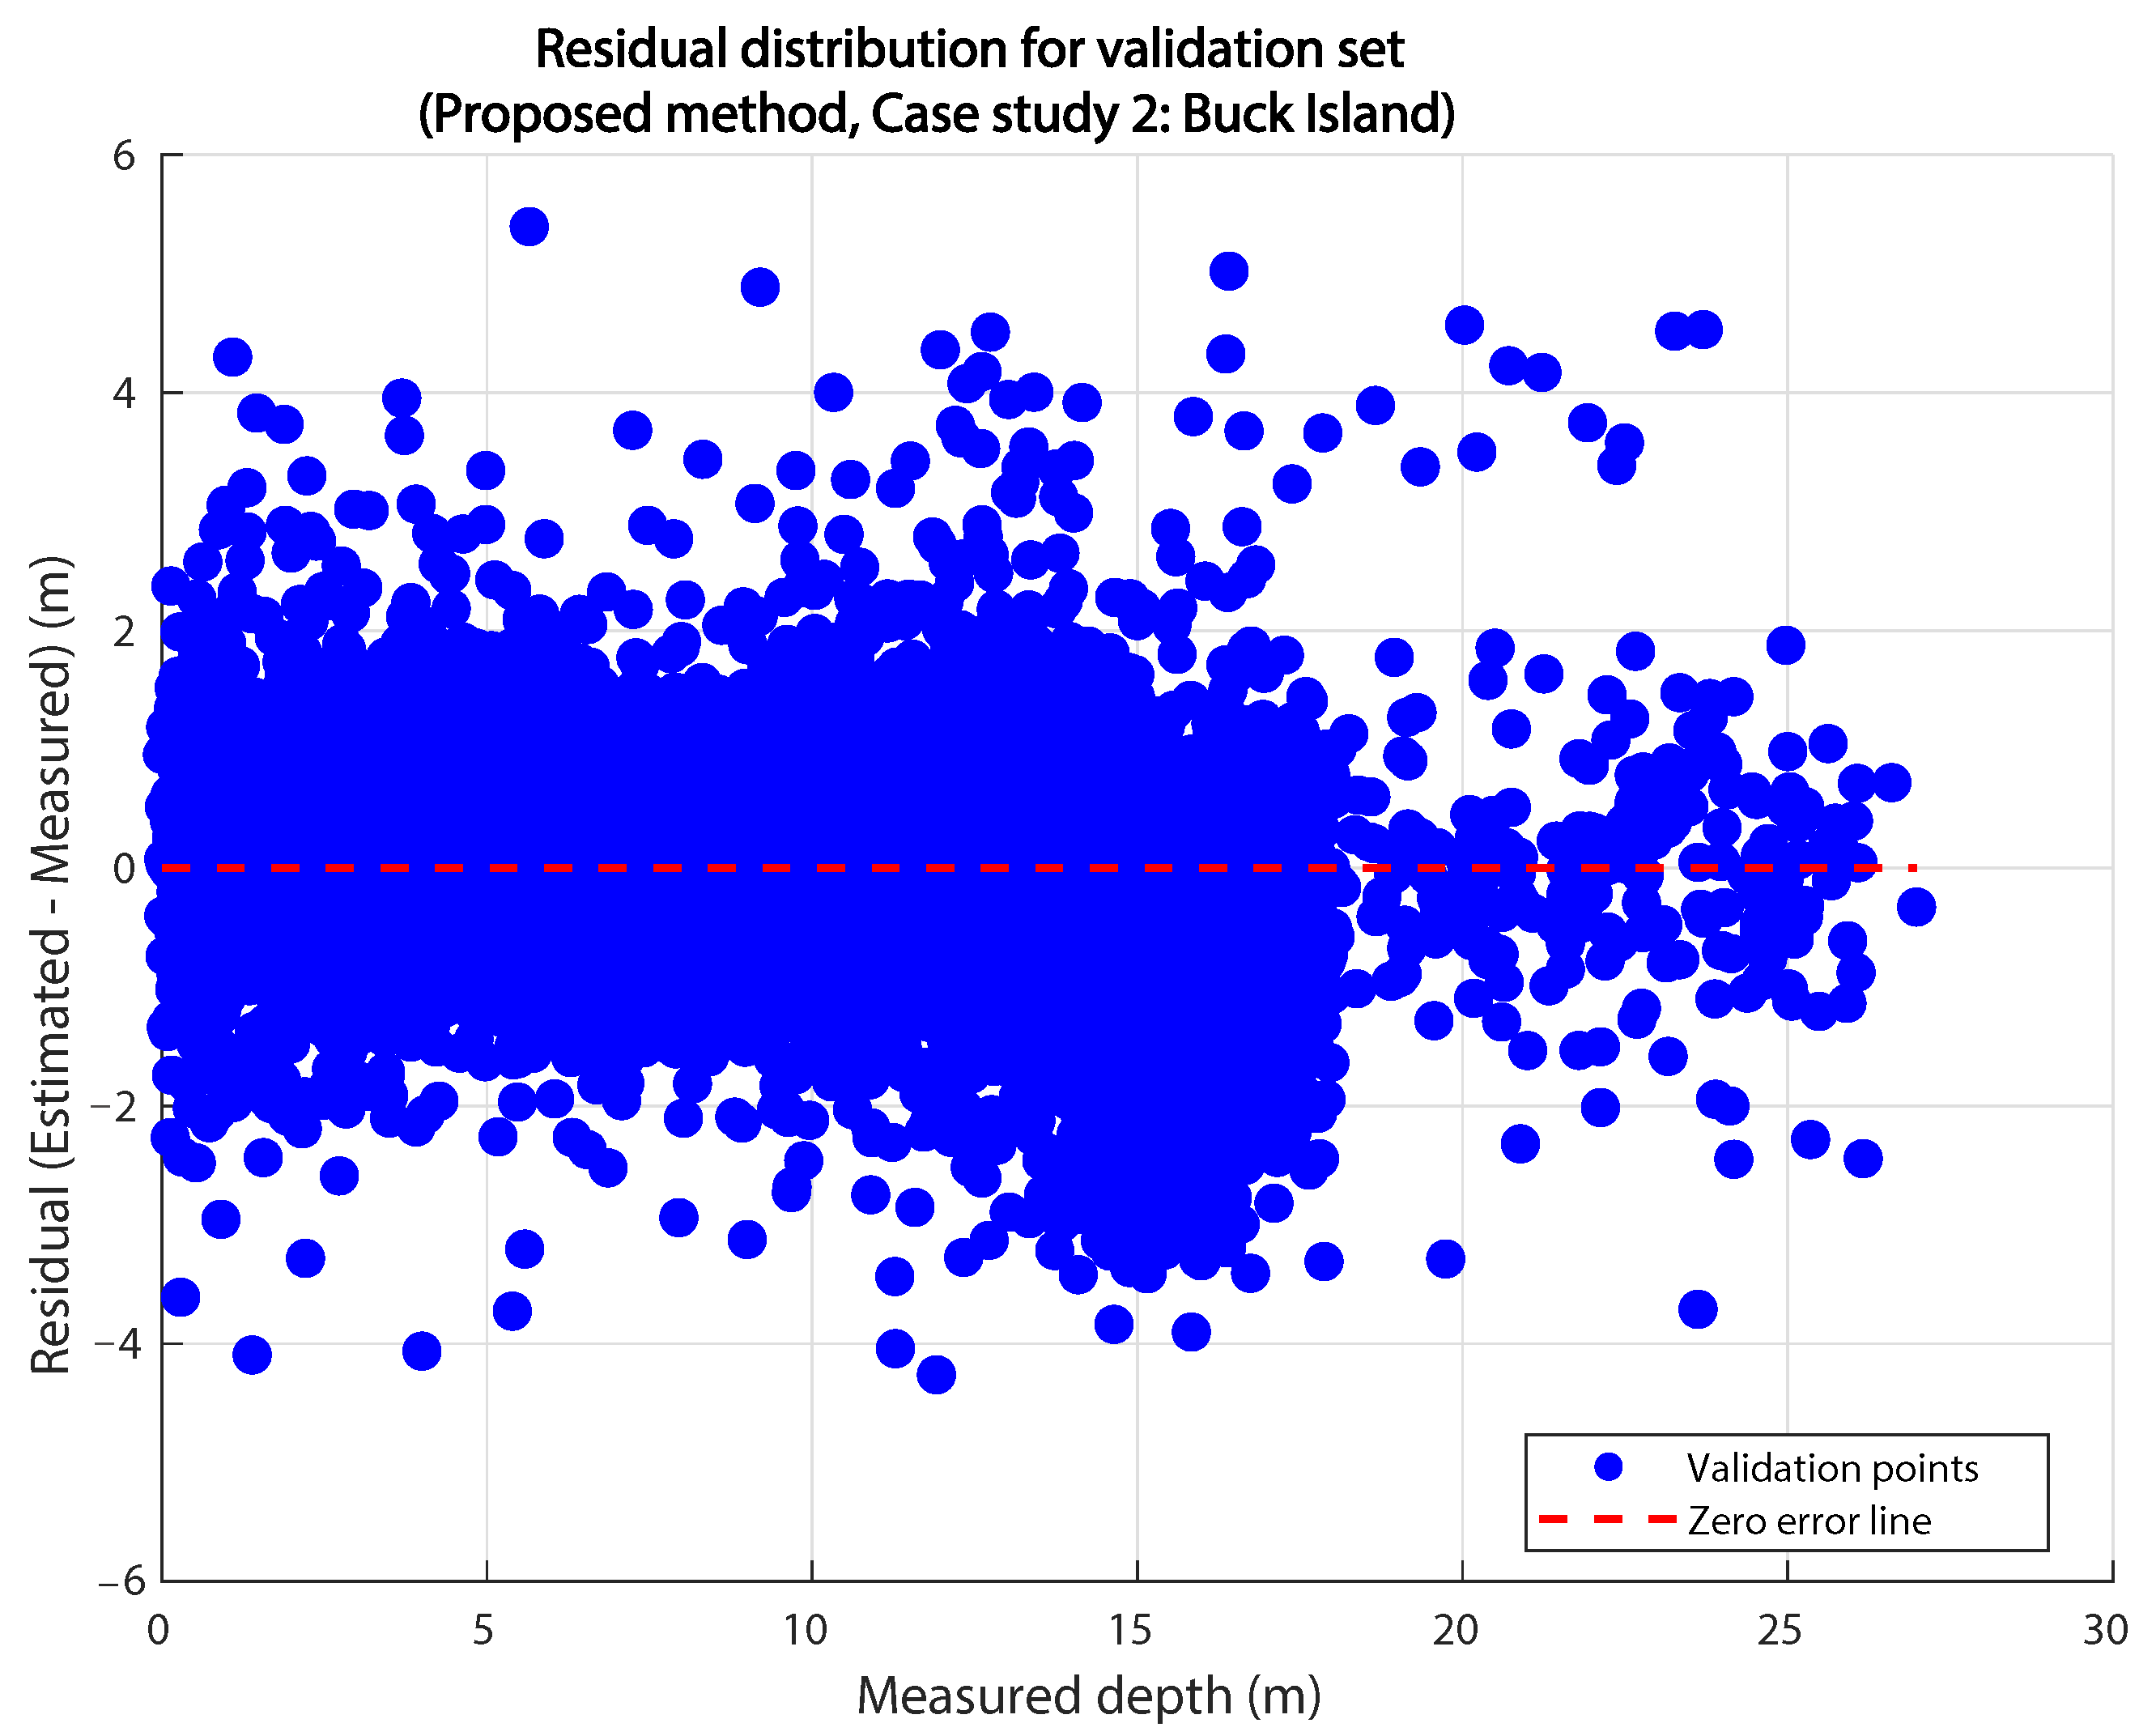
Model performance was evaluated using four complementary metrics: Root Mean Squared Error (RMSE), Mean Absolute Error (MAE), Coefficient of Determination (), and Bias (mean error). RMSE and MAE quantify the overall and average magnitudes of error, respectively; measures the proportion of variance explained; and Bias detects systematic under- or overestimation. In addition, confidence intervals for these indicators were calculated for statistical analysis. Together, these indicators provide a comprehensive assessment of model accuracy and reliability.
Figure 2 shows the distribution of in situ points in both study areas.
