1. Introduction
Coal remains a critical component of the global energy matrix, particularly in industrial and rapidly developing economies. Despite the ongoing transition toward renewable energy sources, coal still accounts for a substantial share of electricity generation and metallurgical processes, particularly in emerging economies. According to the International Energy Agency (IEA) [
1], global coal consumption reached a record 8.77 billion tonnes in 2024, driven largely by sustained demand in countries such as China and India. Underground coal mining, while economically indispensable, is associated with significant environmental and geomechanical consequences—chief among them being land subsidence [
2,
3].
Mining-induced subsidence occurs when the removal of underground material alters the natural stress regime, leading to the collapse or gradual settlement of overlying strata [
4,
5,
6]. This process often propagates to the surface, resulting in ground deformation that can severely damage infrastructure, disrupt ecosystems, and endanger human lives [
7,
8]. The associated economic costs include repairs to buildings, roads, pipelines, and utility networks, while environmental impacts range from altered hydrological regimes to irreversible soil degradation. Socially, such deformations may necessitate the relocation of affected populations, further compounding the societal burden in mining regions [
9,
10,
11]. The magnitude, extent, and temporal evolution of subsidence depend on various factors, including mining depth, extraction methods, geological conditions, and hydrogeological settings.
Traditional methods for monitoring ground subsidence, such as geodetic leveling [
12], total station surveys [
13], and Global Navigation Satellite Systems (GNSS) [
14], have been widely used for decades due to their high accuracy and direct observation capabilities. Geodetic leveling can achieve vertical precision at the millimeter scale, making it suitable for detecting subtle vertical displacements [
15,
16,
17]. However, these techniques are inherently point-based and labor-intensive, requiring extensive fieldwork for large-scale or remote applications. Total station surveys, while providing high spatial resolution, suffer from similar limitations and necessitate the establishment of a network of reference points, which may not be feasible in vast or rugged mining regions. GNSS offers continuous, three-dimensional displacement measurements, making it particularly useful for long-term monitoring. However, it is still point-based, and its effectiveness is often constrained by access to the study area, weather conditions, and the availability of stable reference stations. Despite their accuracy, these methods are spatially limited and may not be sufficient for large-scale deformation monitoring, especially in inaccessible areas or where infrastructure is sparse.
In contrast, Interferometric Synthetic Aperture Radar (InSAR) has emerged as a powerful remote sensing technique for detecting and quantifying ground deformation over large areas with high spatial resolution and sub-centimeter accuracy [
18,
19]. By exploiting phase differences between successive radar acquisitions from spaceborne platforms, In-SAR enables the measurement of surface displacement in the satellite’s line-of-sight direction. Unlike traditional ground-based methods, InSAR does not require physical access to the study area, making it particularly advantageous for monitoring inaccessible, hazardous, or expansive mining regions. Moreover, the archival availability of SAR datasets facilitates retrospective analysis of deformation trends, allowing for long-term monitoring even in regions with limited historical data. However, InSAR performance can be affected by decorrelation due to vegetation, atmospheric disturbances, and geometric limitations, such as layover and shadowing in steep terrains [
20,
21,
22]. Despite these challenges, advancements in time-series analysis techniques (e.g., permanent scattering interferometry (PSI) [
23] and the small baseline subset (SBAS) [
24]) have significantly enhanced the reliability and temporal resolution of deformation monitoring.
InSAR has been successfully applied in various mining regions globally, including Germany’s Ruhr basin [
25], China’s Shanxi province [
26,
27], and the Illinois basin in the United States [
28]. These studies have demonstrated the technique’s capability to delineate deformation zones, track mining-induced subsidence, and inform hazard mitigation strategies. In particular, recent studies have advanced the application of InSAR for monitoring ground deformation, demonstrating its effectiveness. Meinan Z. et al. [
29] demonstrated that combining persistent scatterer and distributed scatterer techniques in time-series SAR interferometry enables precise tracking of secondary subsidence in closed mines, offering a more comprehensive understanding of ground movements. Building on this, InSAR time-series analysis has also been applied to monitor and quantify subsidence in the Ningdong coal basin [
3], revealing significant surface deformation caused by mining activities. These findings not only offer valuable insights into the patterns of subsidence but also underscore the risks to local infrastructure and the environment, especially in regions with complex geological and limited infrastructure conditions.
Additionally, Zhang et al. [
30] demonstrated the synergy between Gaofen-3 and Sen-tinel-1A SAR data for detecting and monitoring mining-induced subsidence, demonstrating that the integration of multi-sensor SAR data improves accuracy and reliability of surface deformation tracking. This approach provides a cost-effective and efficient solution for long-term monitoring in regions where ground-based infrastructure is sparse. Similarly, research by another group [
31] utilizes SBAS-InSAR to analyze and monitor subsidence in Mongolia’s arid region, revealing its ability to detect long-term surface deformation and identify active subsidence zones. These findings are crucial for providing the necessary data to support sustainable mining practices and effective risk mitigation in regions with challenging environmental conditions.
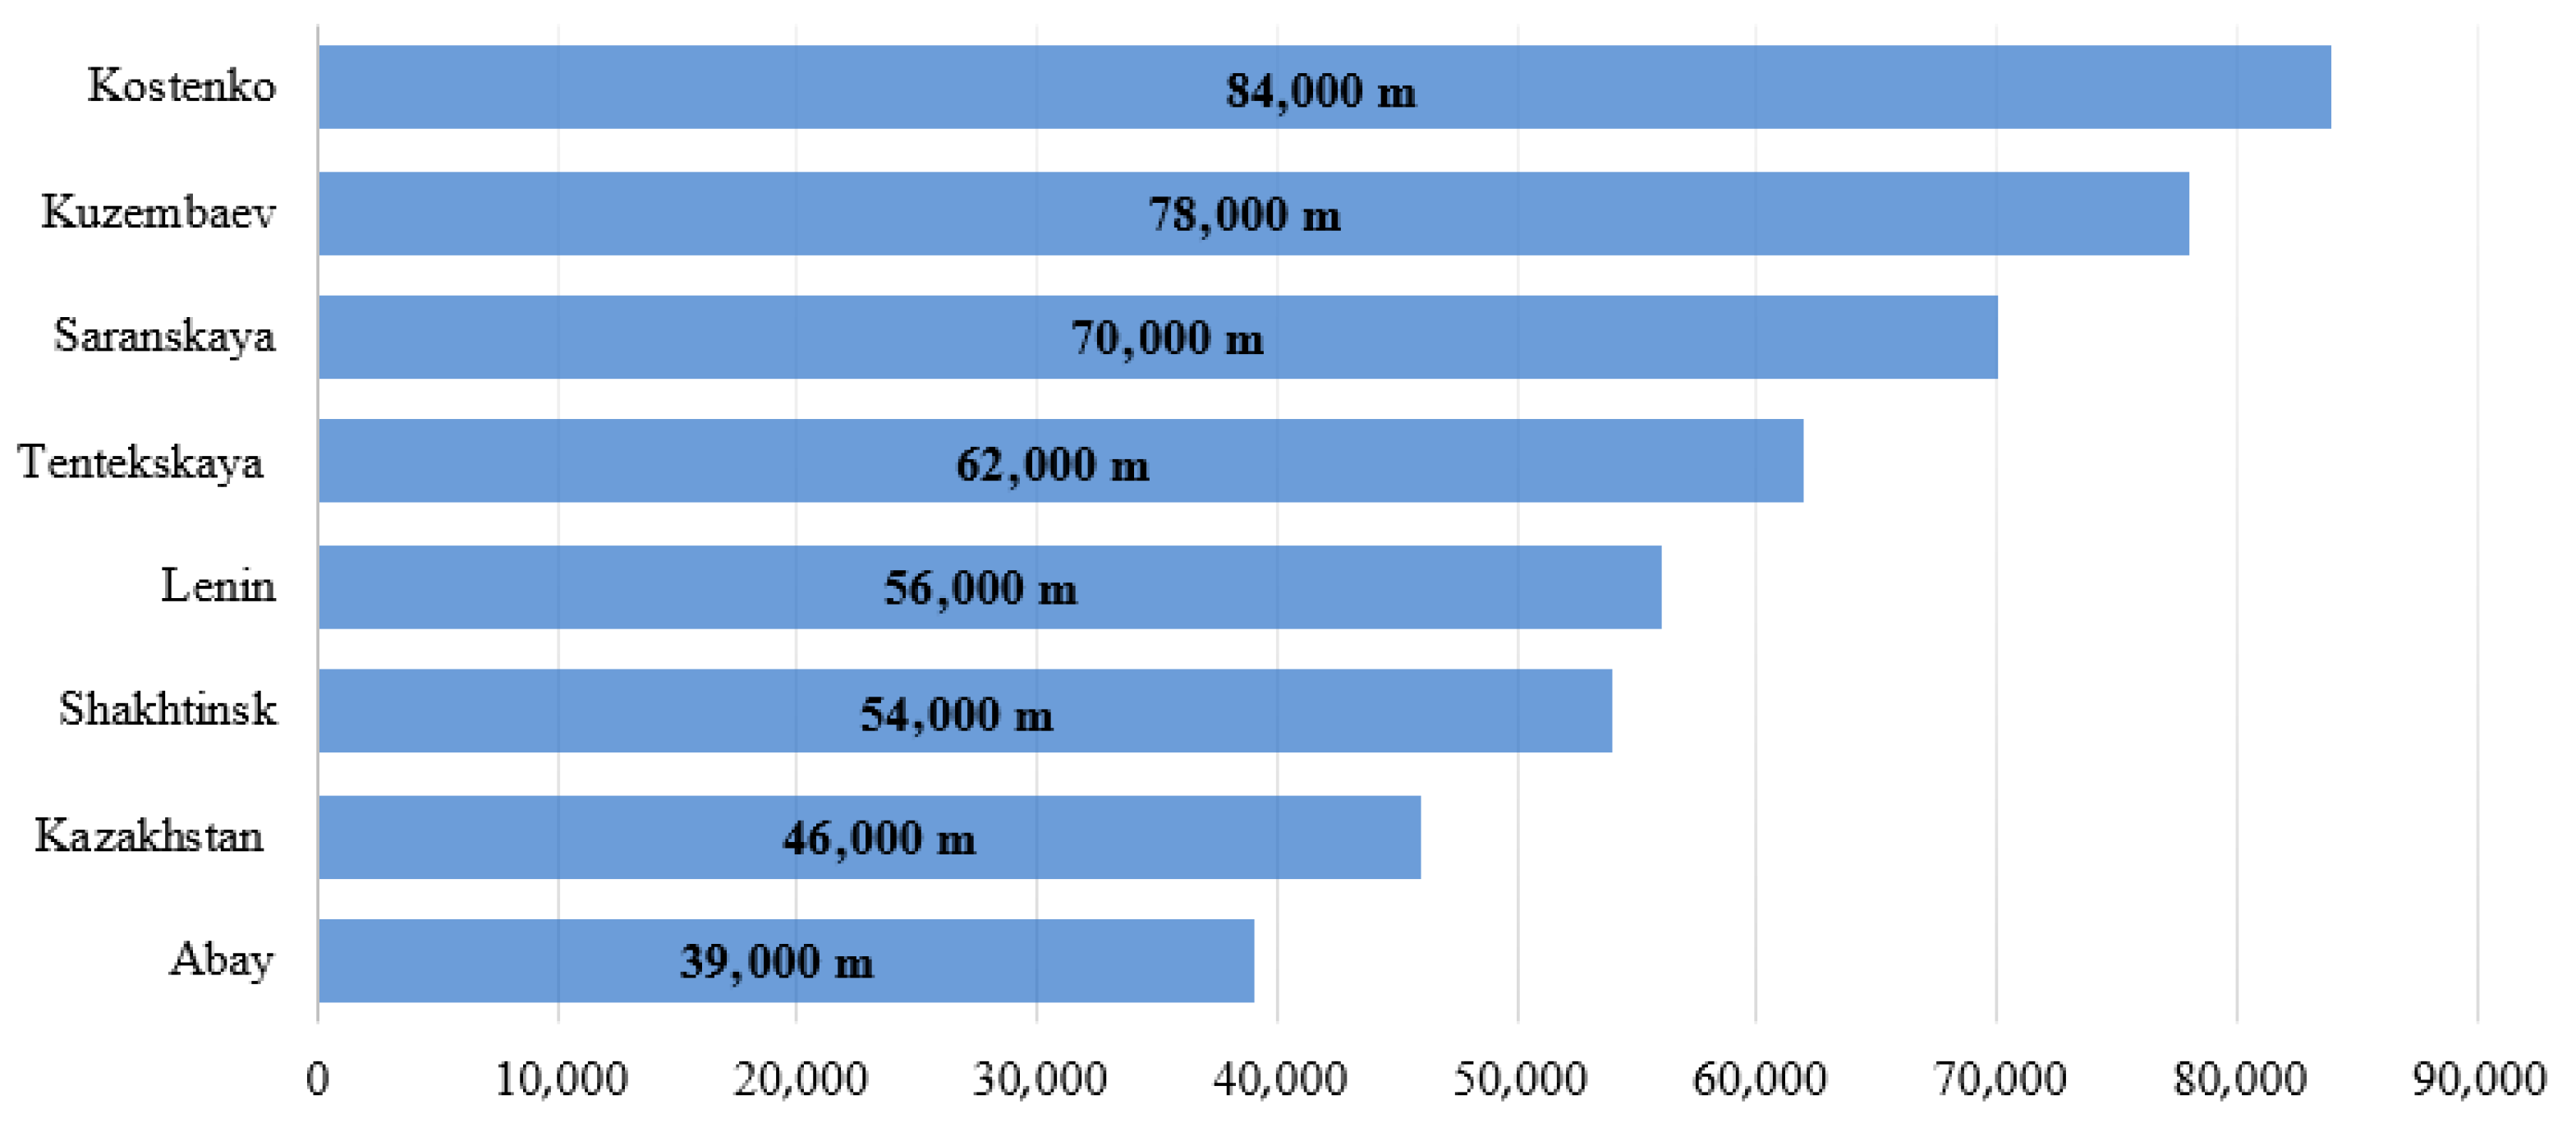
In this context, the Karaganda coal basin in Kazakhstan, one of the oldest in Central Asia, has been subject to intensive underground mining for over a century. Complex geological conditions, great working depths (more than 500 m) and outdated infrastructure make the region vulnerable to ground deformations. Progressive collapse of mined-out voids has led to large-scale subsidence, posing significant socio-economic and environmental risks to nearby urban infrastructure. Despite this, comprehensive monitoring in the region is limited.
This study aims to quantify and characterize ground deformations caused by underground coal mining in the Karaganda coal basin in order to gain a better understanding of ground subsidence processes and their long-term evolution. To achieve this objective, the advanced SBAS-InSAR technique was applied, enabling the analysis of satellite time series data with high accuracy. Two types of datasets were utilized: Sentinel-1 (C-band), which provides wide coverage and good temporal regularity for monitoring large areas, and TerraSAR-X (X-band), which offers ultra-high resolution (up to 1 m) and high sensitivity to small-scale deformations for detailed tracking of local movements. The integration of these different datasets allowed for multi-sensor analysis, significantly improving the reliability and accuracy of the results. Surface displacements in the satellite line-of-sight (LOS) direction and their temporal evolution were analyzed over the Kostenko, Kuzembaev, Aktasskaya, and Saranskaya mines during the period 2019–2021.
The results of this study have important practical significance and novelty, as this represents the first systematic application of InSAR technology for subsidence monitoring in coal deposits in Kazakhstan. The findings make it possible to assess geotechnical hazards and risks associated with mining activities, develop more effective risk management approaches based on accurate monitoring data, and support informed decision-making in land use planning, particularly in post-industrial regions where infrastructure is at risk. In addition, the obtained data can be used to create early warning systems and to promote sustainable development in Kazakhstan’s mining regions.
3. Materials and Methodology
3.1. SAR Data
This study utilizes SAR data from Sentinel-1 and TerraSAR-X satellites for the detection and monitoring of ground surface displacements in the Karaganda coal mining region (
Figure 1). Sentinel-1 SAR imagery was obtained from the freely accessible Alaska Satellite Facility (ASF) platform (
https://asf.alaska.edu/, accessed on 26 April 2022). A total of 43 images were selected from the descending orbit (Path 78, Frame 425), covering a five-year period from April 2019 to October 2021. Interferometric Wide (IW) mode data were used. TerraSAR-X data were provided by the German Aerospace Center (DLR—Deutsches Zentrum für Luft- und Raumfahrt) through its scientific data access program, following the approval of a research proposal aimed at assessing ground displacements in mining regions. A total of 120 TerraSAR-X SAR scenes were acquired over the Karaganda area, including 59 from ascending and 61 from descending orbits. The data cover the period from May 2019 to November 2021, with a seasonal restriction (approximately 8 months per year) to avoid snow cover. The following acquisition parameters were used: ascending orbit—Path 158, Frame 142; descending orbit—Path 136, Frame 441. The TSX images, which were acquired in StripMap mode with a spatial resolution of 3 m.
Data acquisition for both sensors was intentionally limited to snow-free months (approximately April to October), based on long-term climatological observations (see
Section 2.1). This seasonal restriction was applied to minimize temporal decorrelation effects. Previous studies have shown that snow cover—especially during melting periods or when redistributed by wind—can significantly degrade InSAR coherence by altering the phase delay and surface scattering characteristics, particularly in C- and X-band data [
44,
45]. Therefore, excluding winter acquisitions ensured better temporal coherence and improved the reliability of deformation analysis.
3.2. Processing Workflow
To retrieve ground surface deformation over the study area, the SBAS-InSAR technique was applied to two independent SAR datasets acquired from Sentinel-1 and TerraSAR-X satellites. This approach enables the detection of the temporal evolution of surface displacements by generating deformation time series and LOS velocity maps, based on a network of interferograms with small spatial and temporal baselines [
46].
SBAS-InSAR relies on a redundant network of image pairs with short spatial and moderate temporal separation. This configuration increases spatial coverage, particularly in non-urban areas, where traditional PS methods may fail due to low coherence. The technique extracts ground displacement trends from a large set of filtered and unwrapped interferograms, making it particularly effective for detecting long-term deformations [
47,
48]. However, due to the high number of interferometric pairs, the SBAS method is computationally intensive and requires more operator interaction compared to single-interferogram methods.
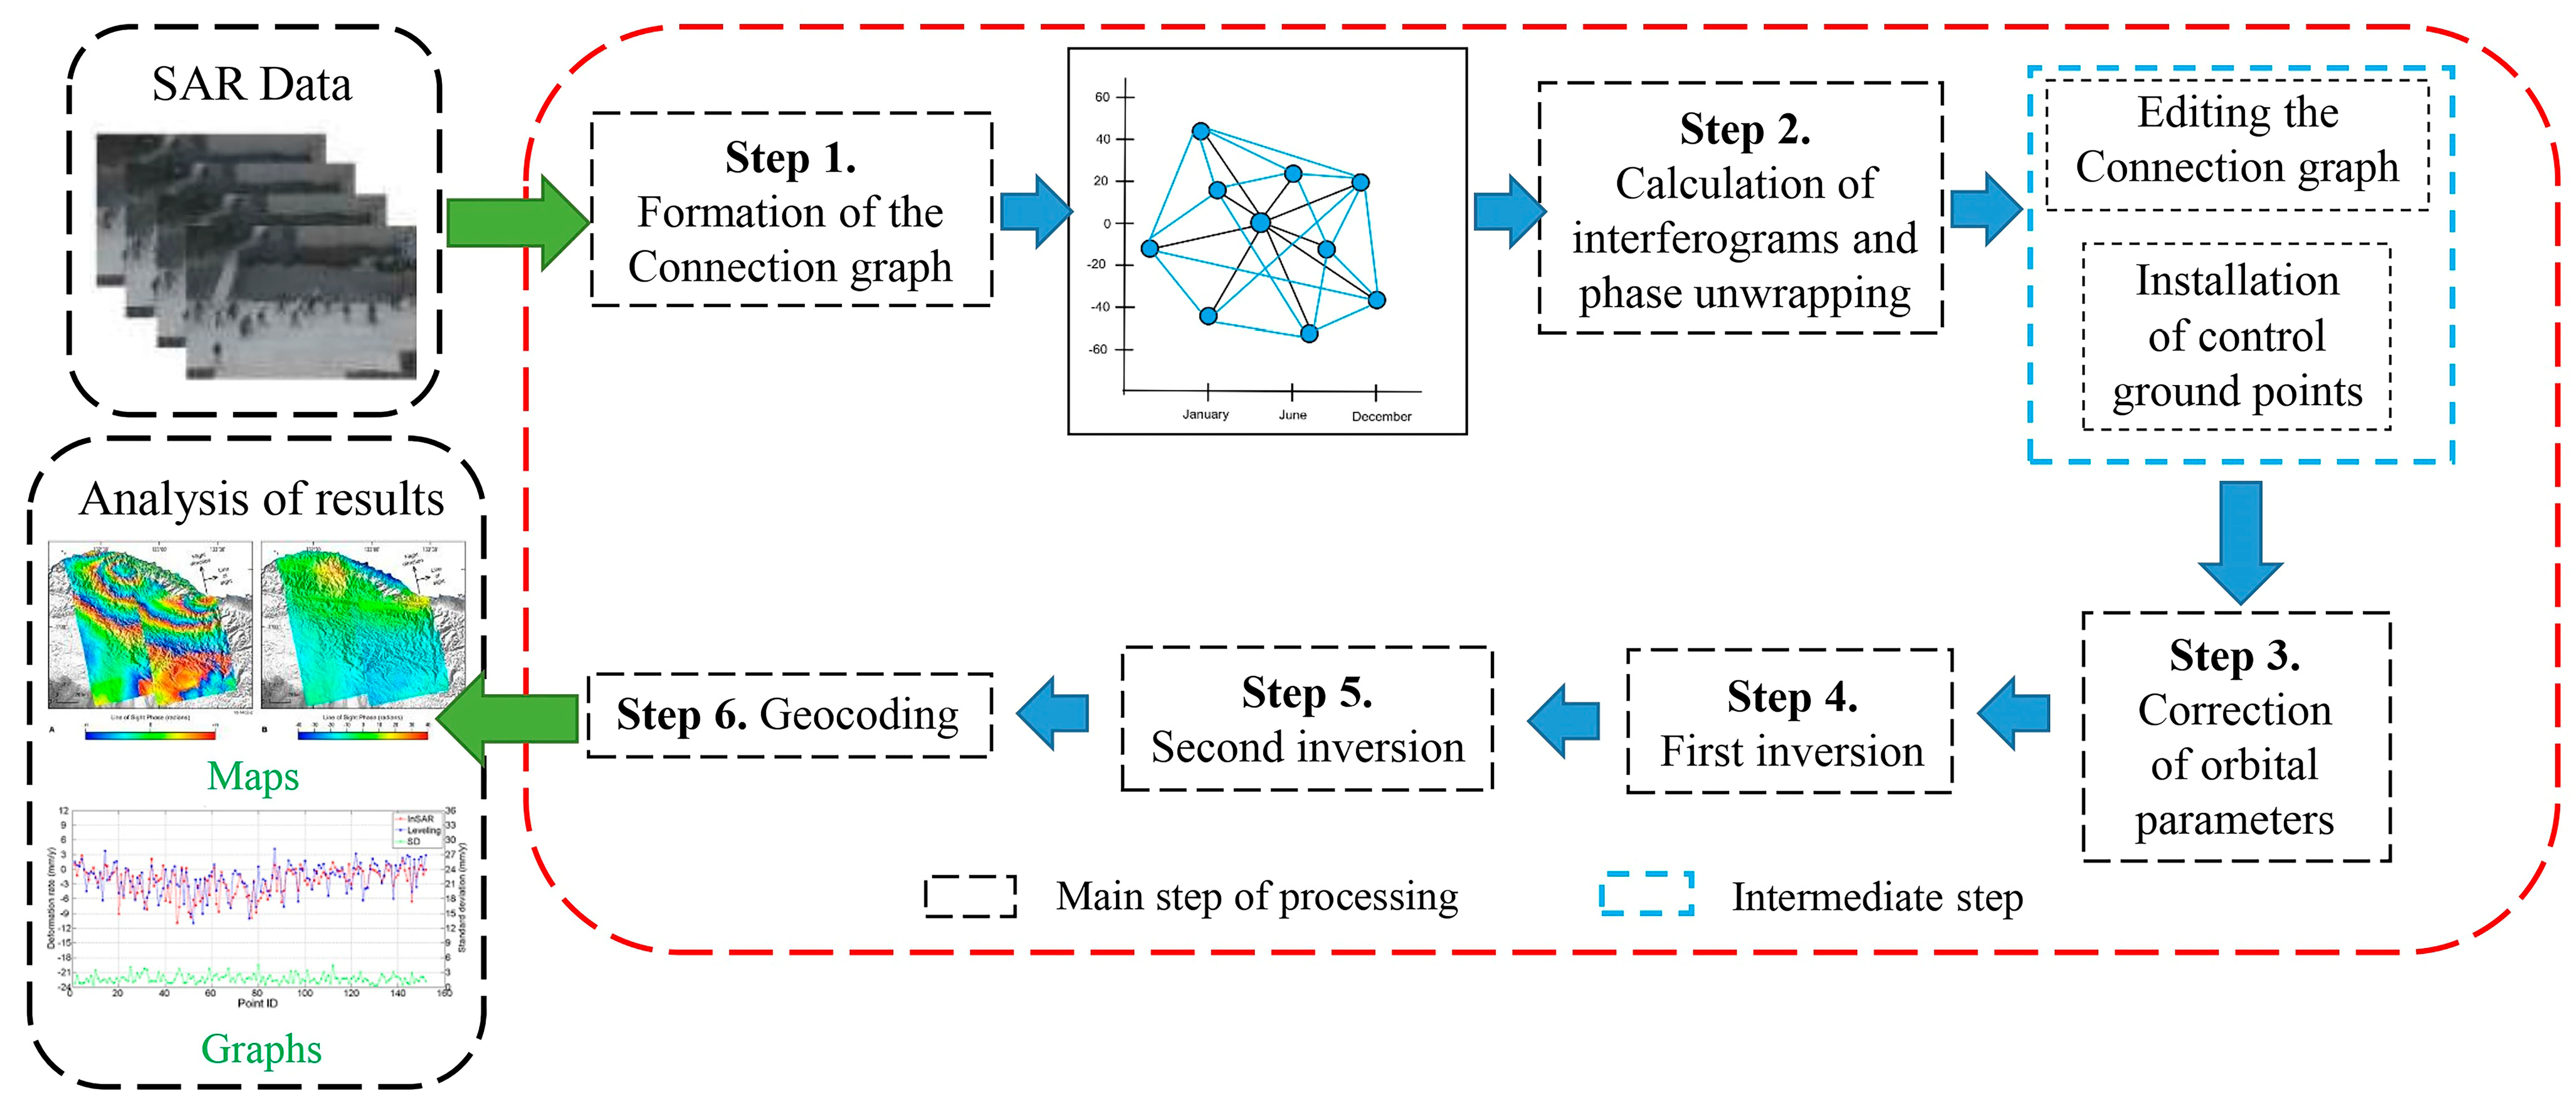
The entire interferometric processing workflow, comprising six step-by-step procedures [
49], was conducted using the SARscape multi-module extension of the ENVI software version 5.3 suite (
Figure 4).
Step 1—Formation of interferograms and connection graph
At the first stage, a connection graph was constructed to determine the optimal pairs of radar images for creating interferograms. These pairs were selected based on strict restrictions on temporal and spatial baselines. For Sentinel-1 data, the maximum temporal baseline was 36 days, and for TerraSAR-X it was 35 days. The normalized perpendicular baseline was limited to 45% of the critical one to ensure high interferometric coherence. One image was selected as a reference, relative to which all other images in the chain were co-registered with an accuracy of 1/100 pixel [
50].
After this, interferograms were created. Each interferogram is the result of a complex pixel-by-pixel multiplication of the main image and its complex conjugate subordinate image, which were previously geometrically aligned. Since each SAR image contains both amplitude and phase information, the resulting interferometric phase (Φ) is the phase difference between these images and consists of several components as shown in Equation (1) [
51]:
where
Փtopo—phase contribution due to topography observed from two slightly different viewing angles;
Փdef—phase shift caused by ground surface displacement between the two acquisitions;
Փatm—phase delay resulting from atmospheric effects, due to signal refraction along different atmospheric paths;
Փn—phase noise caused by electromagnetic interference and system noise.
This decomposition is crucial for understanding and isolating ground deformation signals in subsequent processing steps.
Step 2—Interferogram Generation and Phase Unwrapping: During this stage, interferograms were generated, filtered, and unwrapped simultaneously. The separation of the phase components Փtopo and Փdef was performed by synthesizing the topographic phase using an available Digital Elevation Model (DEM), resulting in a differential interferogram. In this output, each full color cycle (interferometric fringe), corresponding to a 2π phase change, represents ground surface displacements equal to half of the radar wavelength—or, alternatively, elevation differences determined for a given image pair by the ratio between the perpendicular baseline and the critical baseline.
To enhance the quality of the interferometric phase, the Goldstein adaptive spectral filter was applied. This filtering technique effectively reduces phase noise while preserving the fringe patterns necessary for deformation analysis [
52]. In cases where unwrapped interferograms contained excessive noise, this step was repeated with modified processing parameters.
The importance of this step lies in the detection and correction of artifacts such as inaccurate orbital parameters, low-coherence image pairs, atmospheric disturbances, and residual topographic effects.
Phase unwrapping was performed using the Delaney Minimum Cost Flow (MCF) algorithm [
53], which minimizes phase discontinuities by identifying optimal unwrapping paths through low-coherence regions. The unwrapped interferograms were then inverted using a least-squares adjustment of the temporal network to derive incremental displacement values. These values were subsequently integrated over time to reconstruct cumulative surface displacement time series.
Intermediate Step—Connection Graph Editing. At this stage, interferograms with poor phase unwrapping were identified—specifically, those containing phase discontinuities or “jumps.” If such distortions were located far from the area of interest, they could be corrected at a later stage. Otherwise, coherence thresholds for phase unwrapping were adjusted (either increased or decreased depending on the situation) to improve results. All interferograms with poor unwrapping were excluded from further processing, and a new connection graph was generated based on the corrected set of unwrapped interferograms.
Step 3—Refinement and Re-flattening: Phase distortions related to orbital errors were corrected using Ground Control Points (GCPs), which were selected based on unwrapped phase files. The GCP file was created separately, using one well-unwrapped interferogram as a reference. It is important to note that using a sufficiently large number of GCPs significantly improves the accuracy of the final products [
54].
Steps 4–5: First and Second Inversion: The first and second inversion steps involve transforming interferometric phase values into displacement values and their temporal derivatives. During these stages, the software automatically identifies radar signal persistent scatterers—points that maintain stable backscatter characteristics over time. The selection of persistent scatterers points is based on several threshold criteria, including amplitude correlation threshold, coherence threshold, spatial standard deviation of displacements from the first iteration, and others.
Once the persistent scatterers are identified, the software performs phase difference estimation and multitemporal phase unwrapping for these points. Since each phase difference encodes the amount of displacement that occurred between two acquisition dates, a temporal phase history is reconstructed for each persistent scatterers point.
Step 6—Geocoding: For all results obtained during the first and second inversion steps, a geocoding or orthorectification procedure was applied. As a result, vector point files and/or raster datasets were generated, with attribute tables containing the following information:
Displacement values for each acquisition date;
Average annual displacement velocity;
Cumulative displacement magnitude;
Coherence values.
4. Result
4.1. Mine-Specific Analysis of Ground Displacements
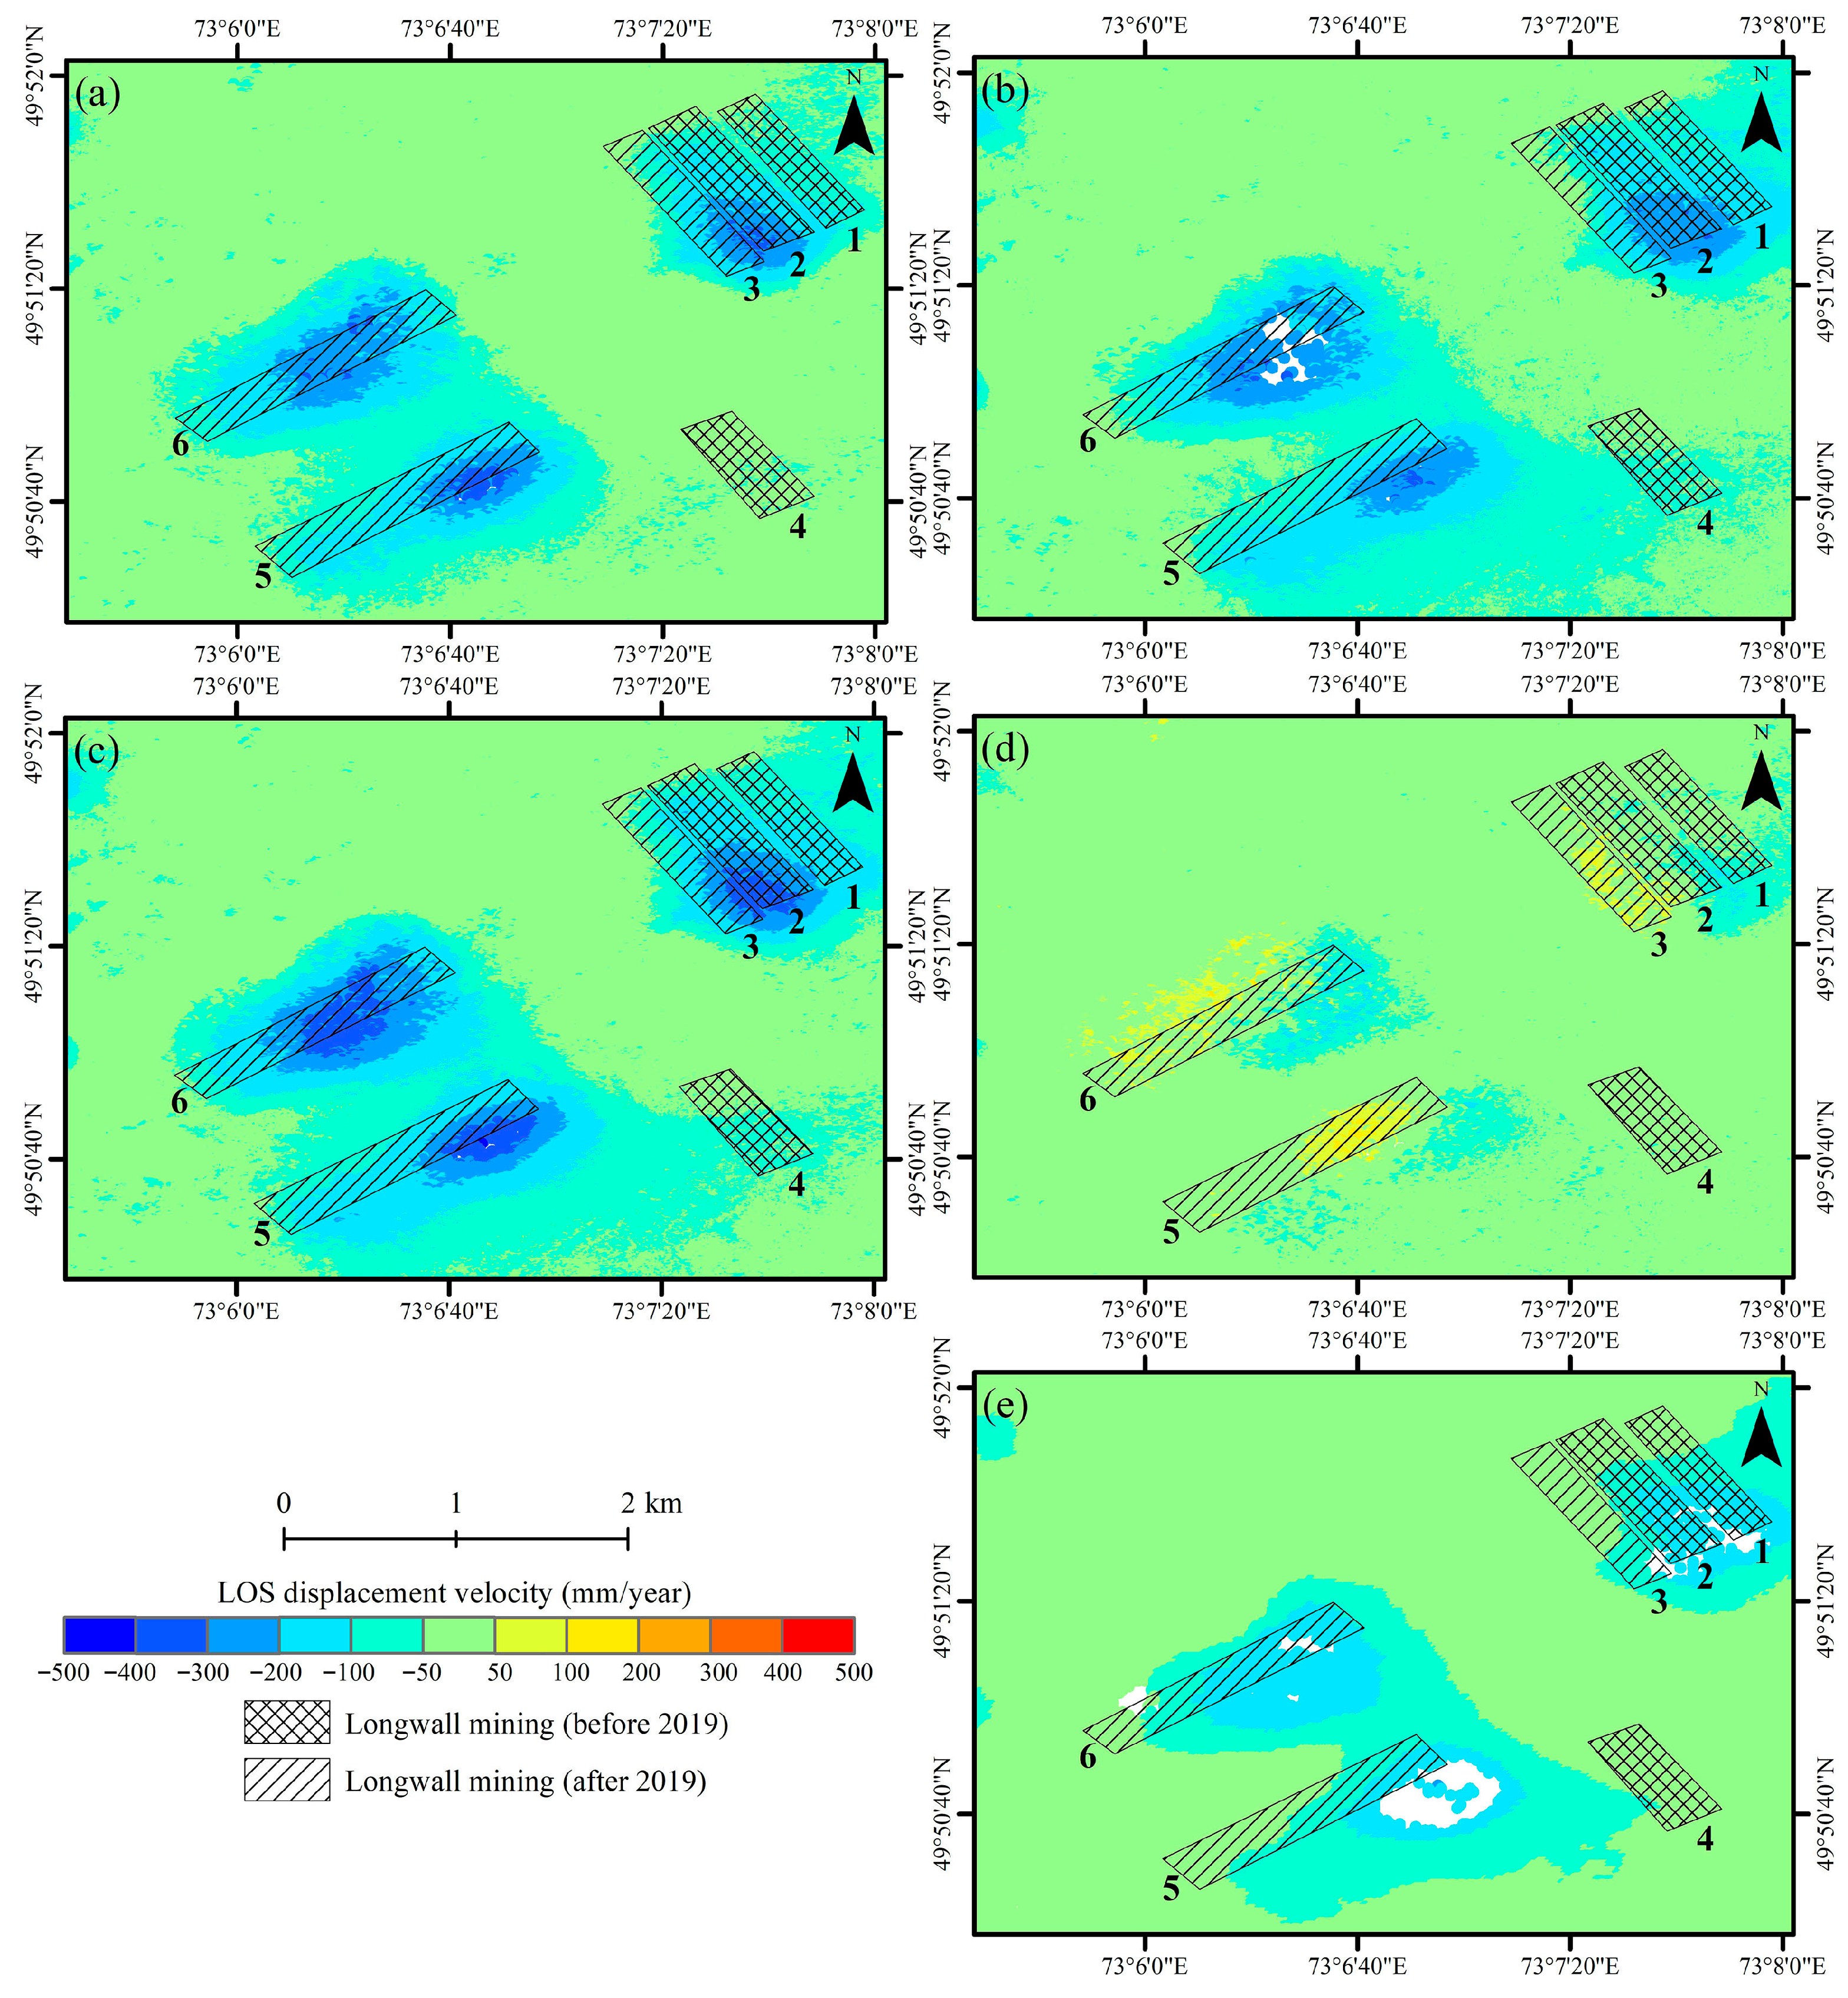
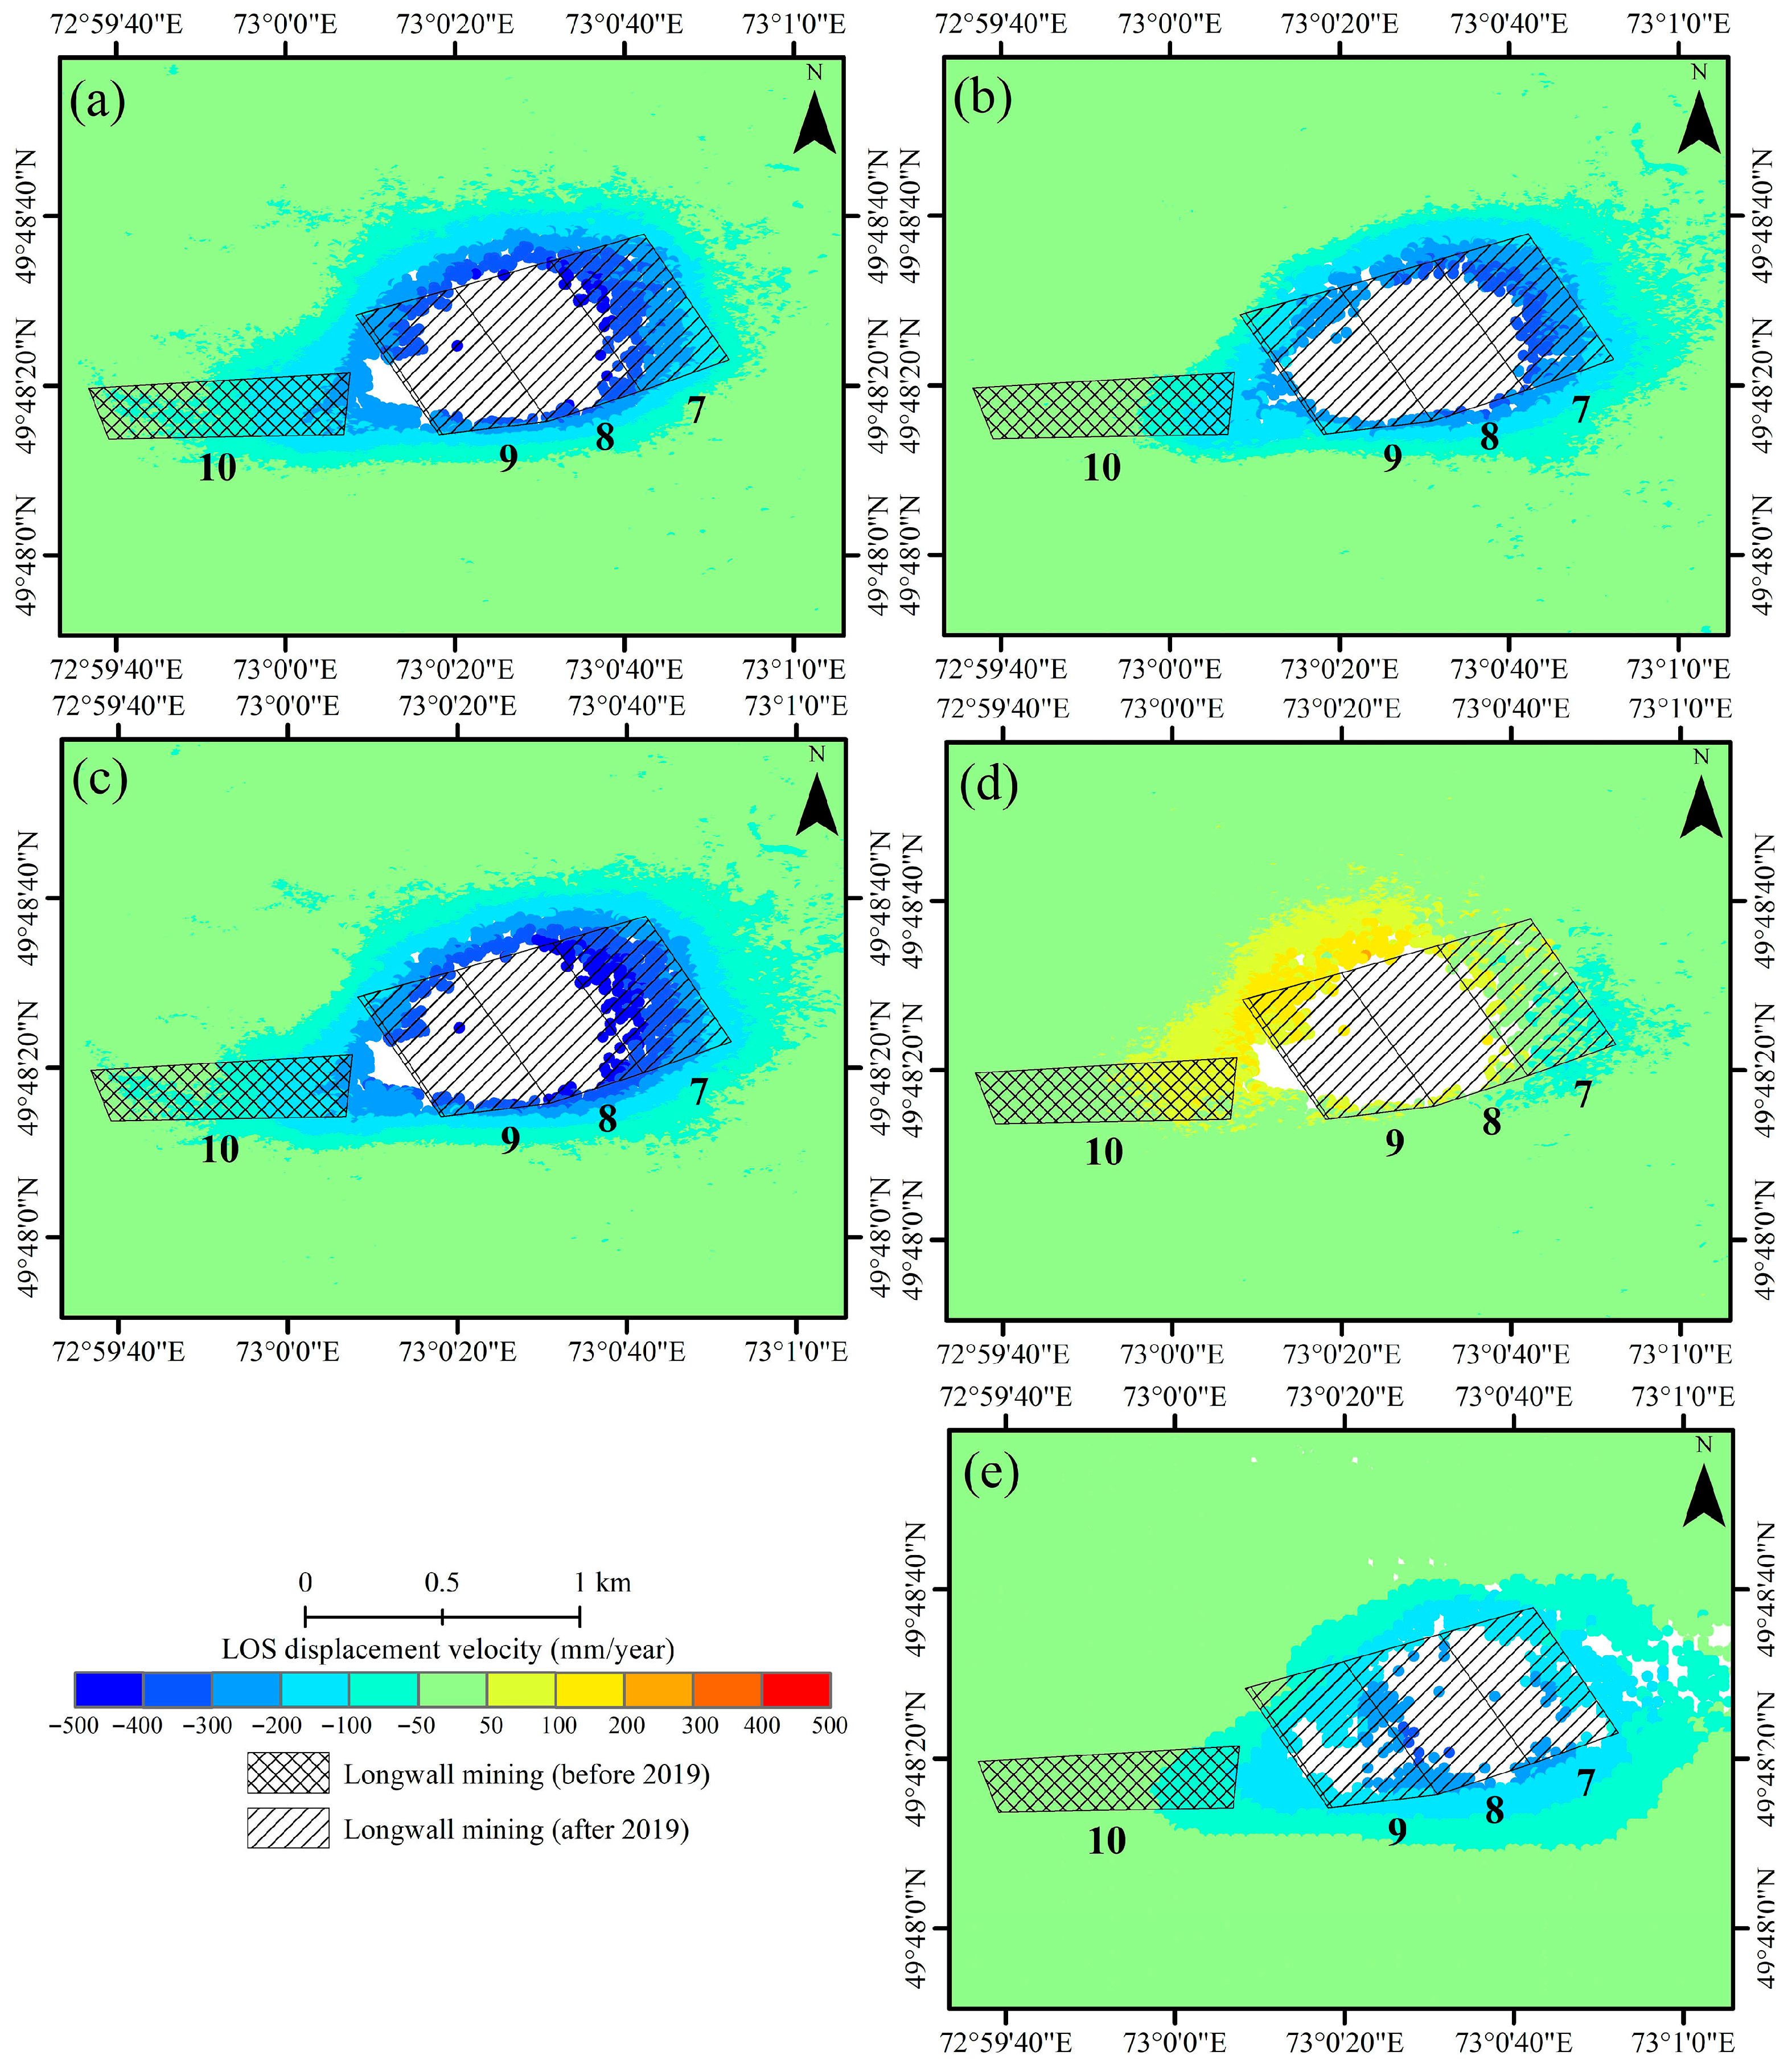
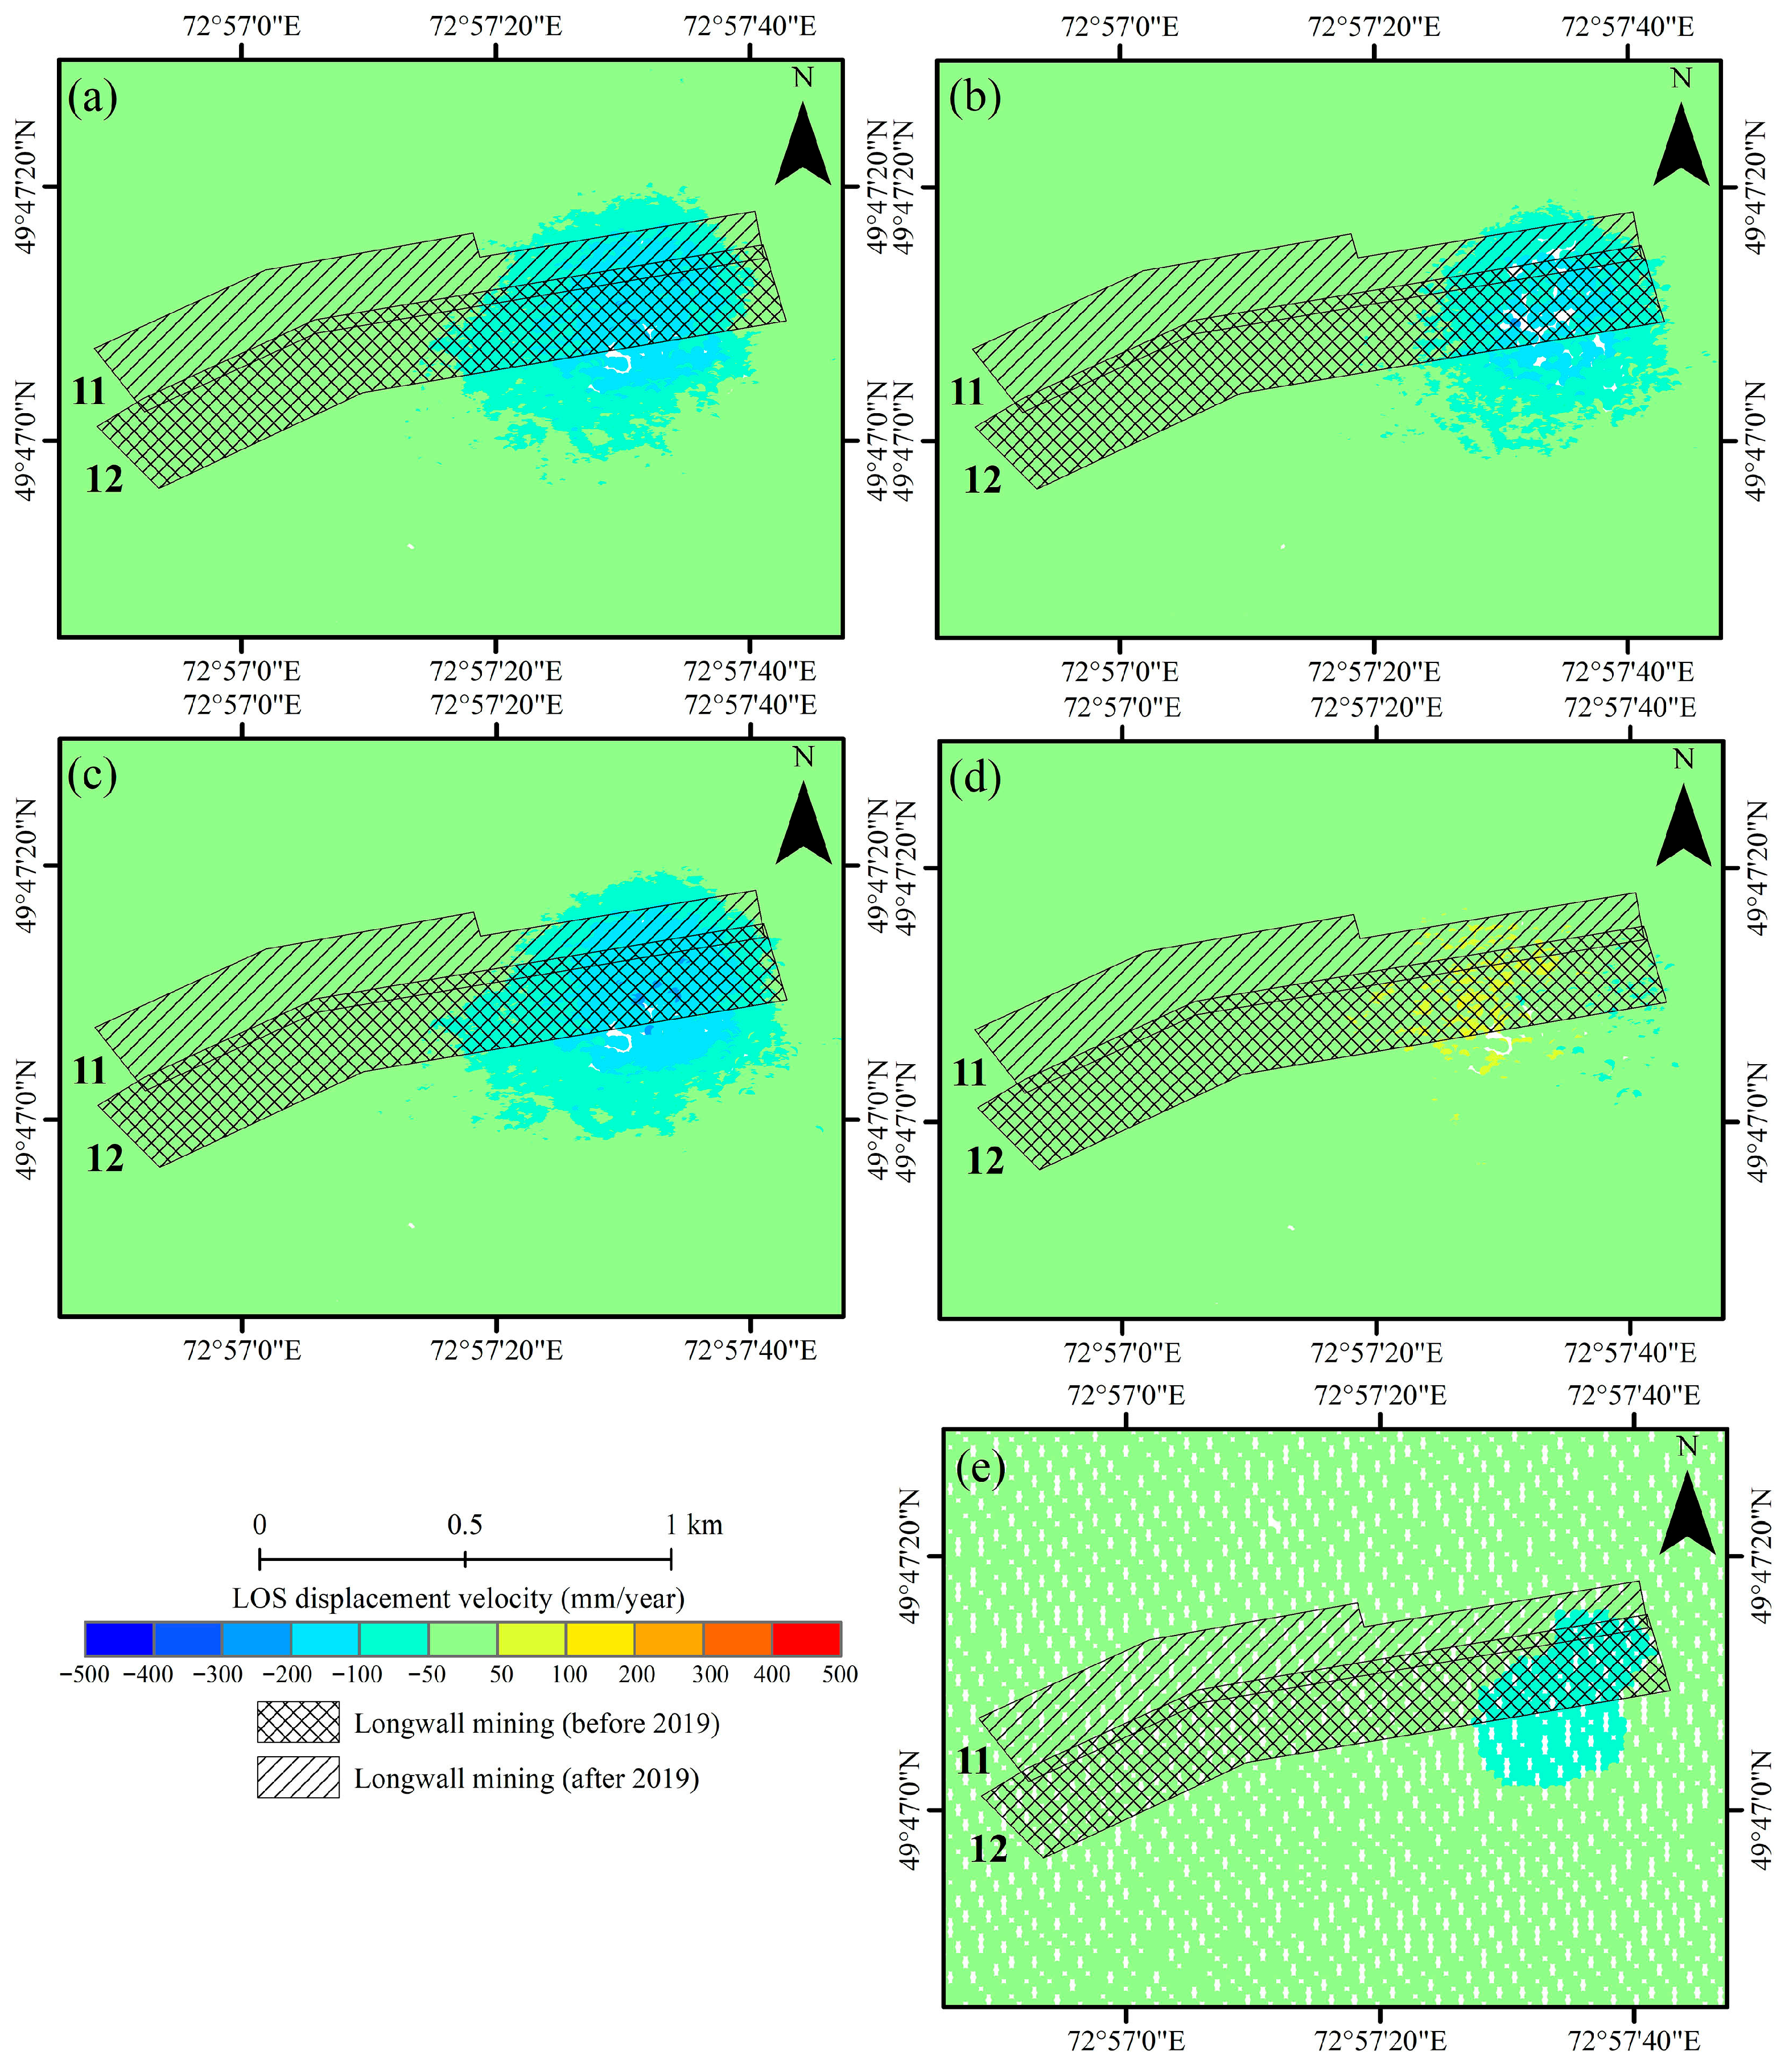
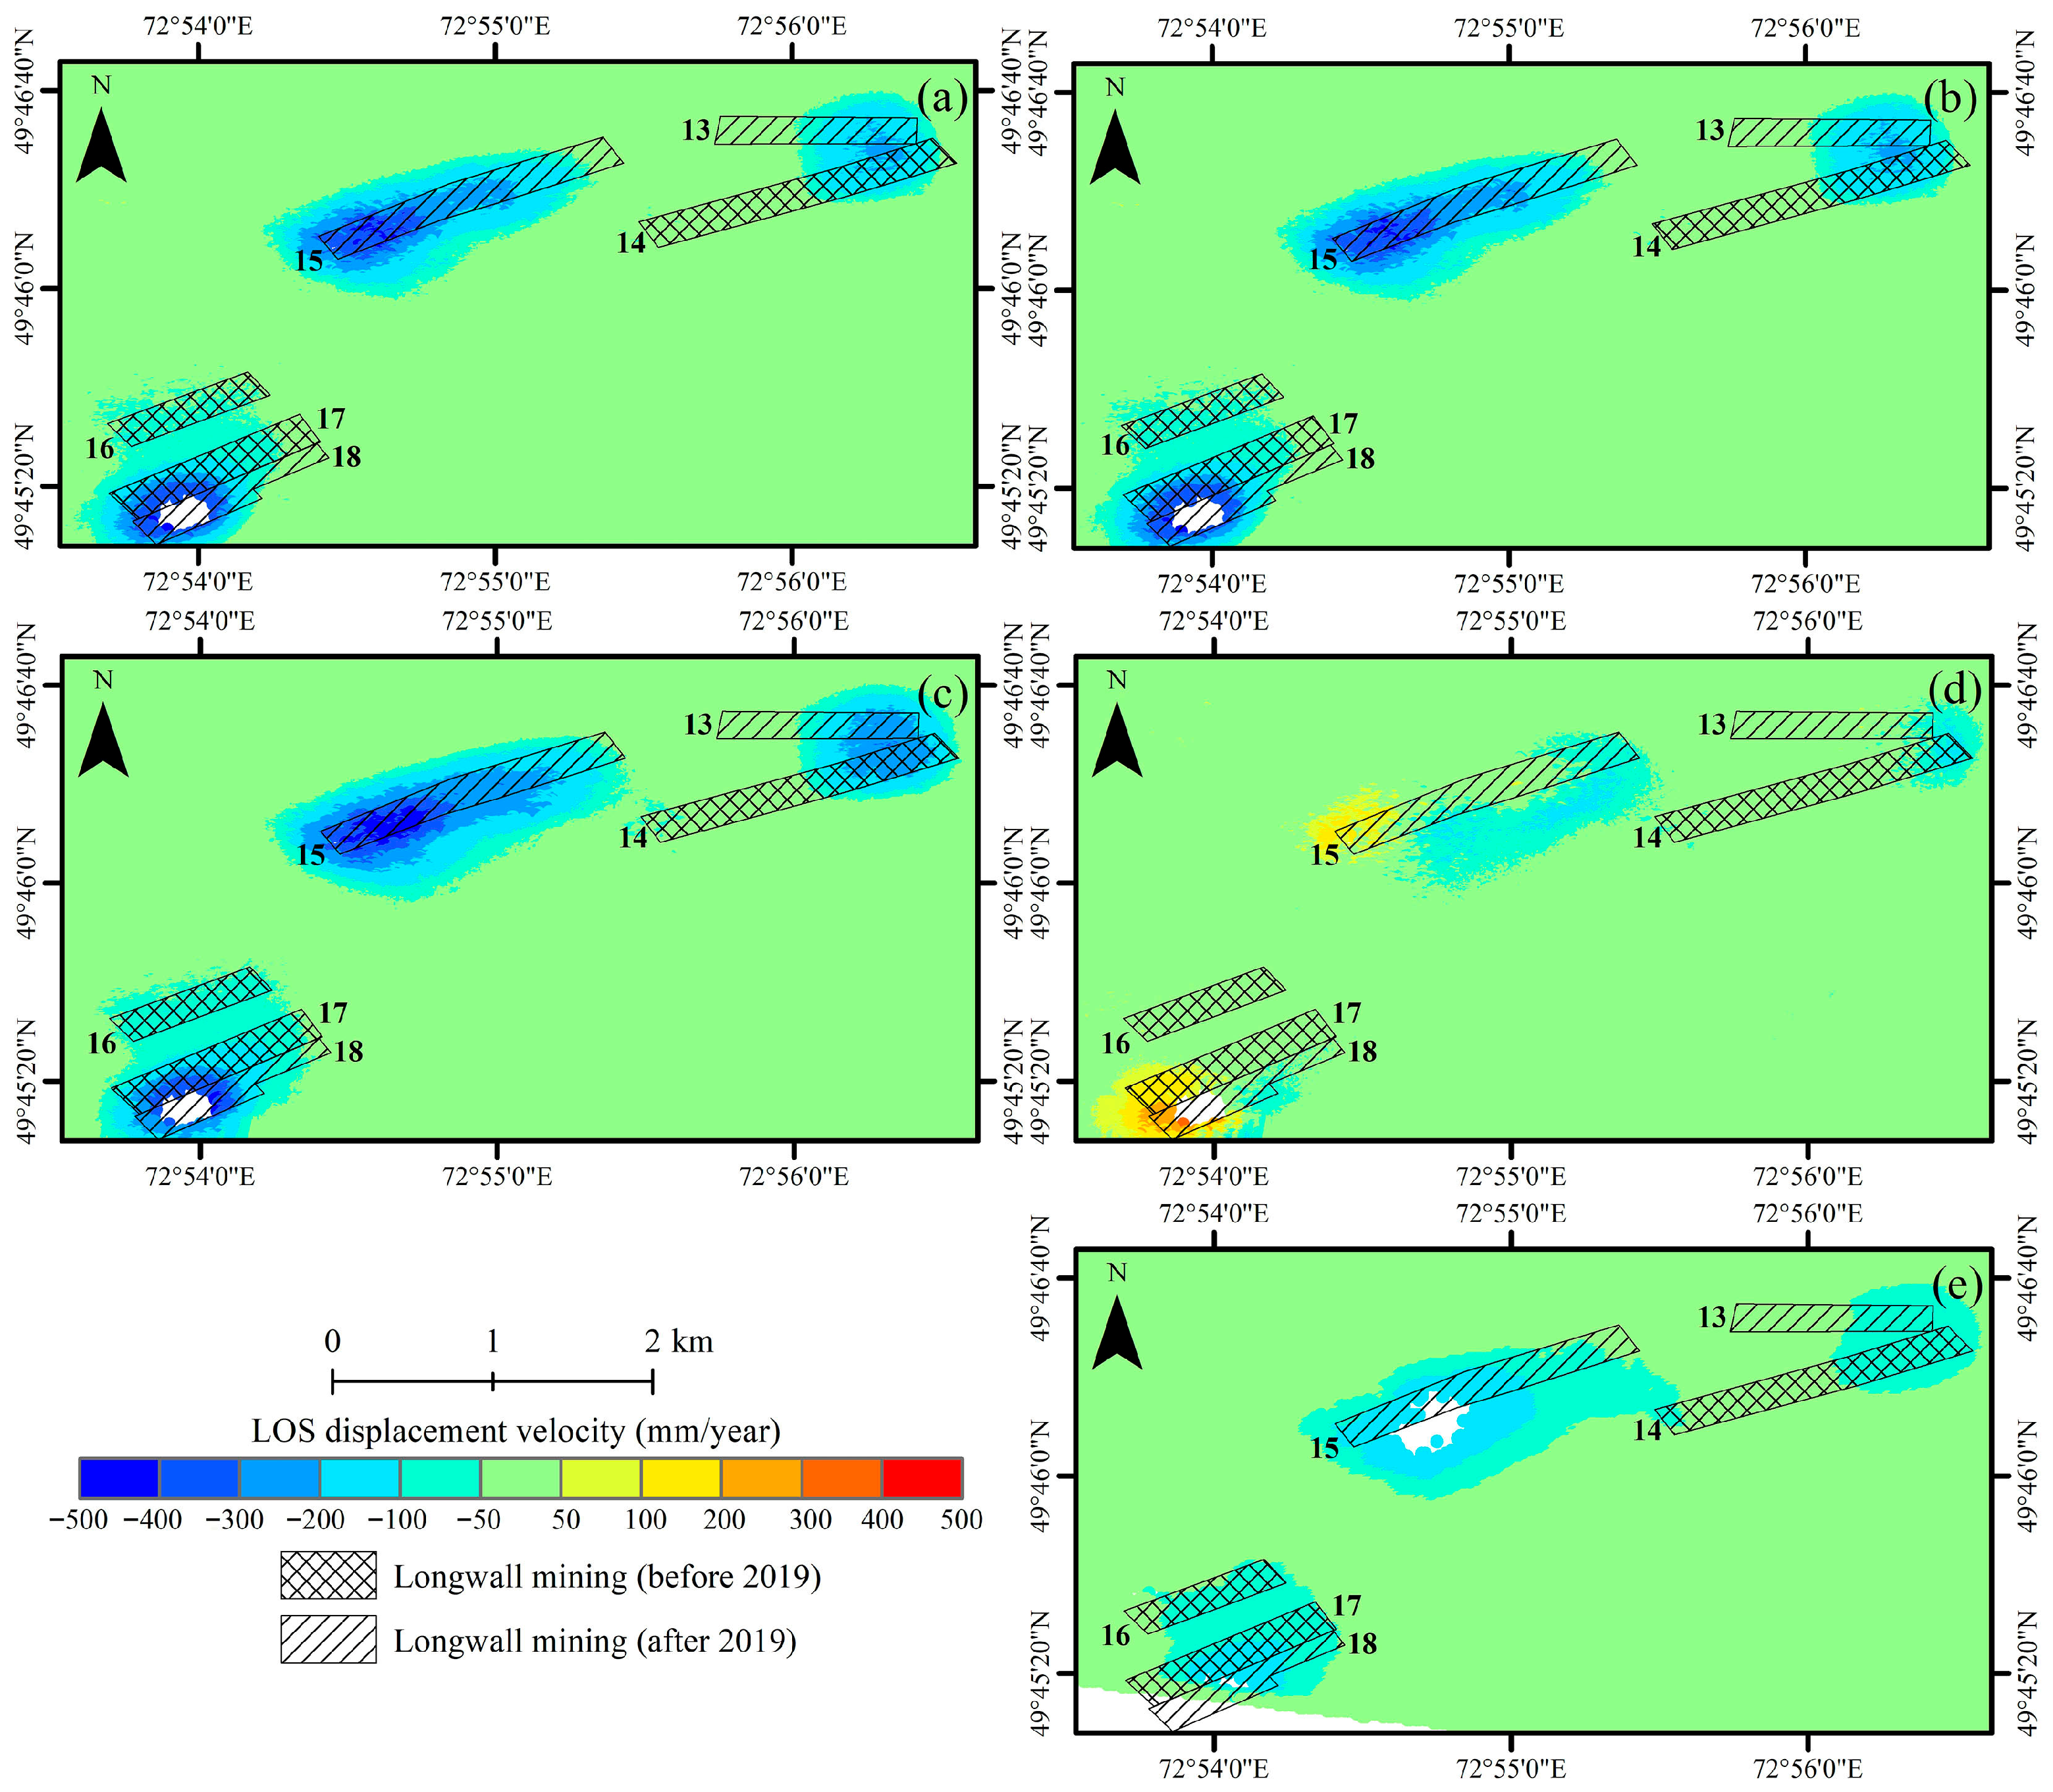
The results indicate that the studied area is geodynamically unstable, particularly in the vicinity of the mines. The findings provide an objective representation of the location of geodynamic zones with a high rate of deformation processes (
Figure 5,
Figure 6,
Figure 7 and
Figure 8). In the following, the displacement patterns for each mine are analyzed individually.
One of the largest and most active mines in the basin is the Kostenko mine, located within the city limits of Karaganda, between the Maikuduk and Novy Gorod districts. The deformation pattern forms a well-defined subsidence trough, with three distinct zones of maximum settlement within the mine area. Based on TerraSAR-X data, the maximum LOS displacement rate reached −361 mm/year in the ascending geometry and −341 mm/year in the descending geometry. Vertical displacement rates attained −405 mm/year. Horizontal displacements indicate a converging movement towards the center of the trough: the western flank exhibits an eastward shift of up to 191 mm/year, while the eastern flank moves westward by up to 140 mm/year. According to Sentinel-1 data, LOS displacement rates reached −201 mm/year.
The Kuzembayev coal mine has been in operation since 1959, and by the end of the TerraSAR-X observation period, it had been in continuous development for 62 years. The analysis identified a single large subsidence trough within the mine area, associated with the extraction of three closely spaced longwall panels. Based on TerraSAR-X data, the maximum LOS displacement rate reached −446 mm/year in the ascending geometry and −371 mm/year in the descending geometry. Vertical displacement rates attained −474 mm/year, while horizontal displacements reached 127 mm/year westward and 202 mm/year eastward. According to Sentinel-1 data, LOS displacement rates were up to −303 mm/year.
The Saranskaya mine was commissioned on 31 December 1955, with a design capacity of 900,000 tonnes of coal per year. The Aktasskaya mine, launched in 1958 with an annual capacity of 1.2 million tonnes, was merged with Saranskaya, along with the Sokurskaya mine, in 1998–1999.
For the Aktasskaya mine, the analysis revealed a small subsidence trough located on the eastern side of the mining area. Based on TerraSAR-X data, the maximum LOS displacement rate reached −224 mm/year in the ascending geometry and −202 mm/year in the descending geometry. Vertical displacement rates attained −258 mm/year, while horizontal displacements reached 89 mm/year westward and 115 mm/year eastward. According to Sentinel-1 data, LOS displacement rates were up to −69 mm/year.
The analysis revealed three distinct subsidence troughs within the Saranskaya mining area. Based on TerraSAR-X data, the maximum LOS displacement rate reached −460 mm/year in the ascending geometry and −463 mm/year in the descending geometry. Vertical displacement rates attained −517 mm/year, while horizontal displacements reached 201 mm/year westward and 309 mm/year eastward. According to Sentinel-1 data, LOS displacement rates were up to −175 mm/year.
4.2. Evaluation of TerraSAR-X and Sentinel-1 Data Accuracy: Quantitative and Qualitative Perspectives
Comparative analysis of deformation maps derived from Sentinel-1 and TerraSAR-X data reveals consistent patterns of ground subsidence in the areas of the Kostenko, Kuzembayev, and Saranskaya mines. In the Sentinel-1 results (
Figure 5,
Figure 6,
Figure 7 and
Figure 8), deformation zones are represented with smoother contours due to the coarser spatial resolution (~20 m). In contrast, the TerraSAR-X data (~3 m resolution) provide higher spatial detail and a more fragmented representation of displacement patterns. Localized zones of high-rate subsidence are detected in the same areas, while longwall panels 6, 7, 8, 9, and 18 (
Figure 5b,
Figure 6a,b, and
Figure 8a,b) exhibit a higher degree of decorrelation (white patches), most likely caused by intense and abrupt ground movements in active subsidence zones. Despite differences in spatial resolution, the size and location of the subsidence troughs are in good agreement between the two independent datasets.
For a full understanding of the development of the subsidence process, let us consider the graphs of cumulative LOS displacements from 2019 to 2021 based on both Sentinel-1 and TerraSAR-X data, located within the longwall panels. The comparison was performed on a pixel-by-pixel basis to ensure detailed assessment of displacement patterns.
Figure 9,
Figure 10 and
Figure 11 Graphs of cumulative LOS displacements for the longwall panels of the Kostenko mine, derived from TerraSAR-X and Sentinel-1 data:
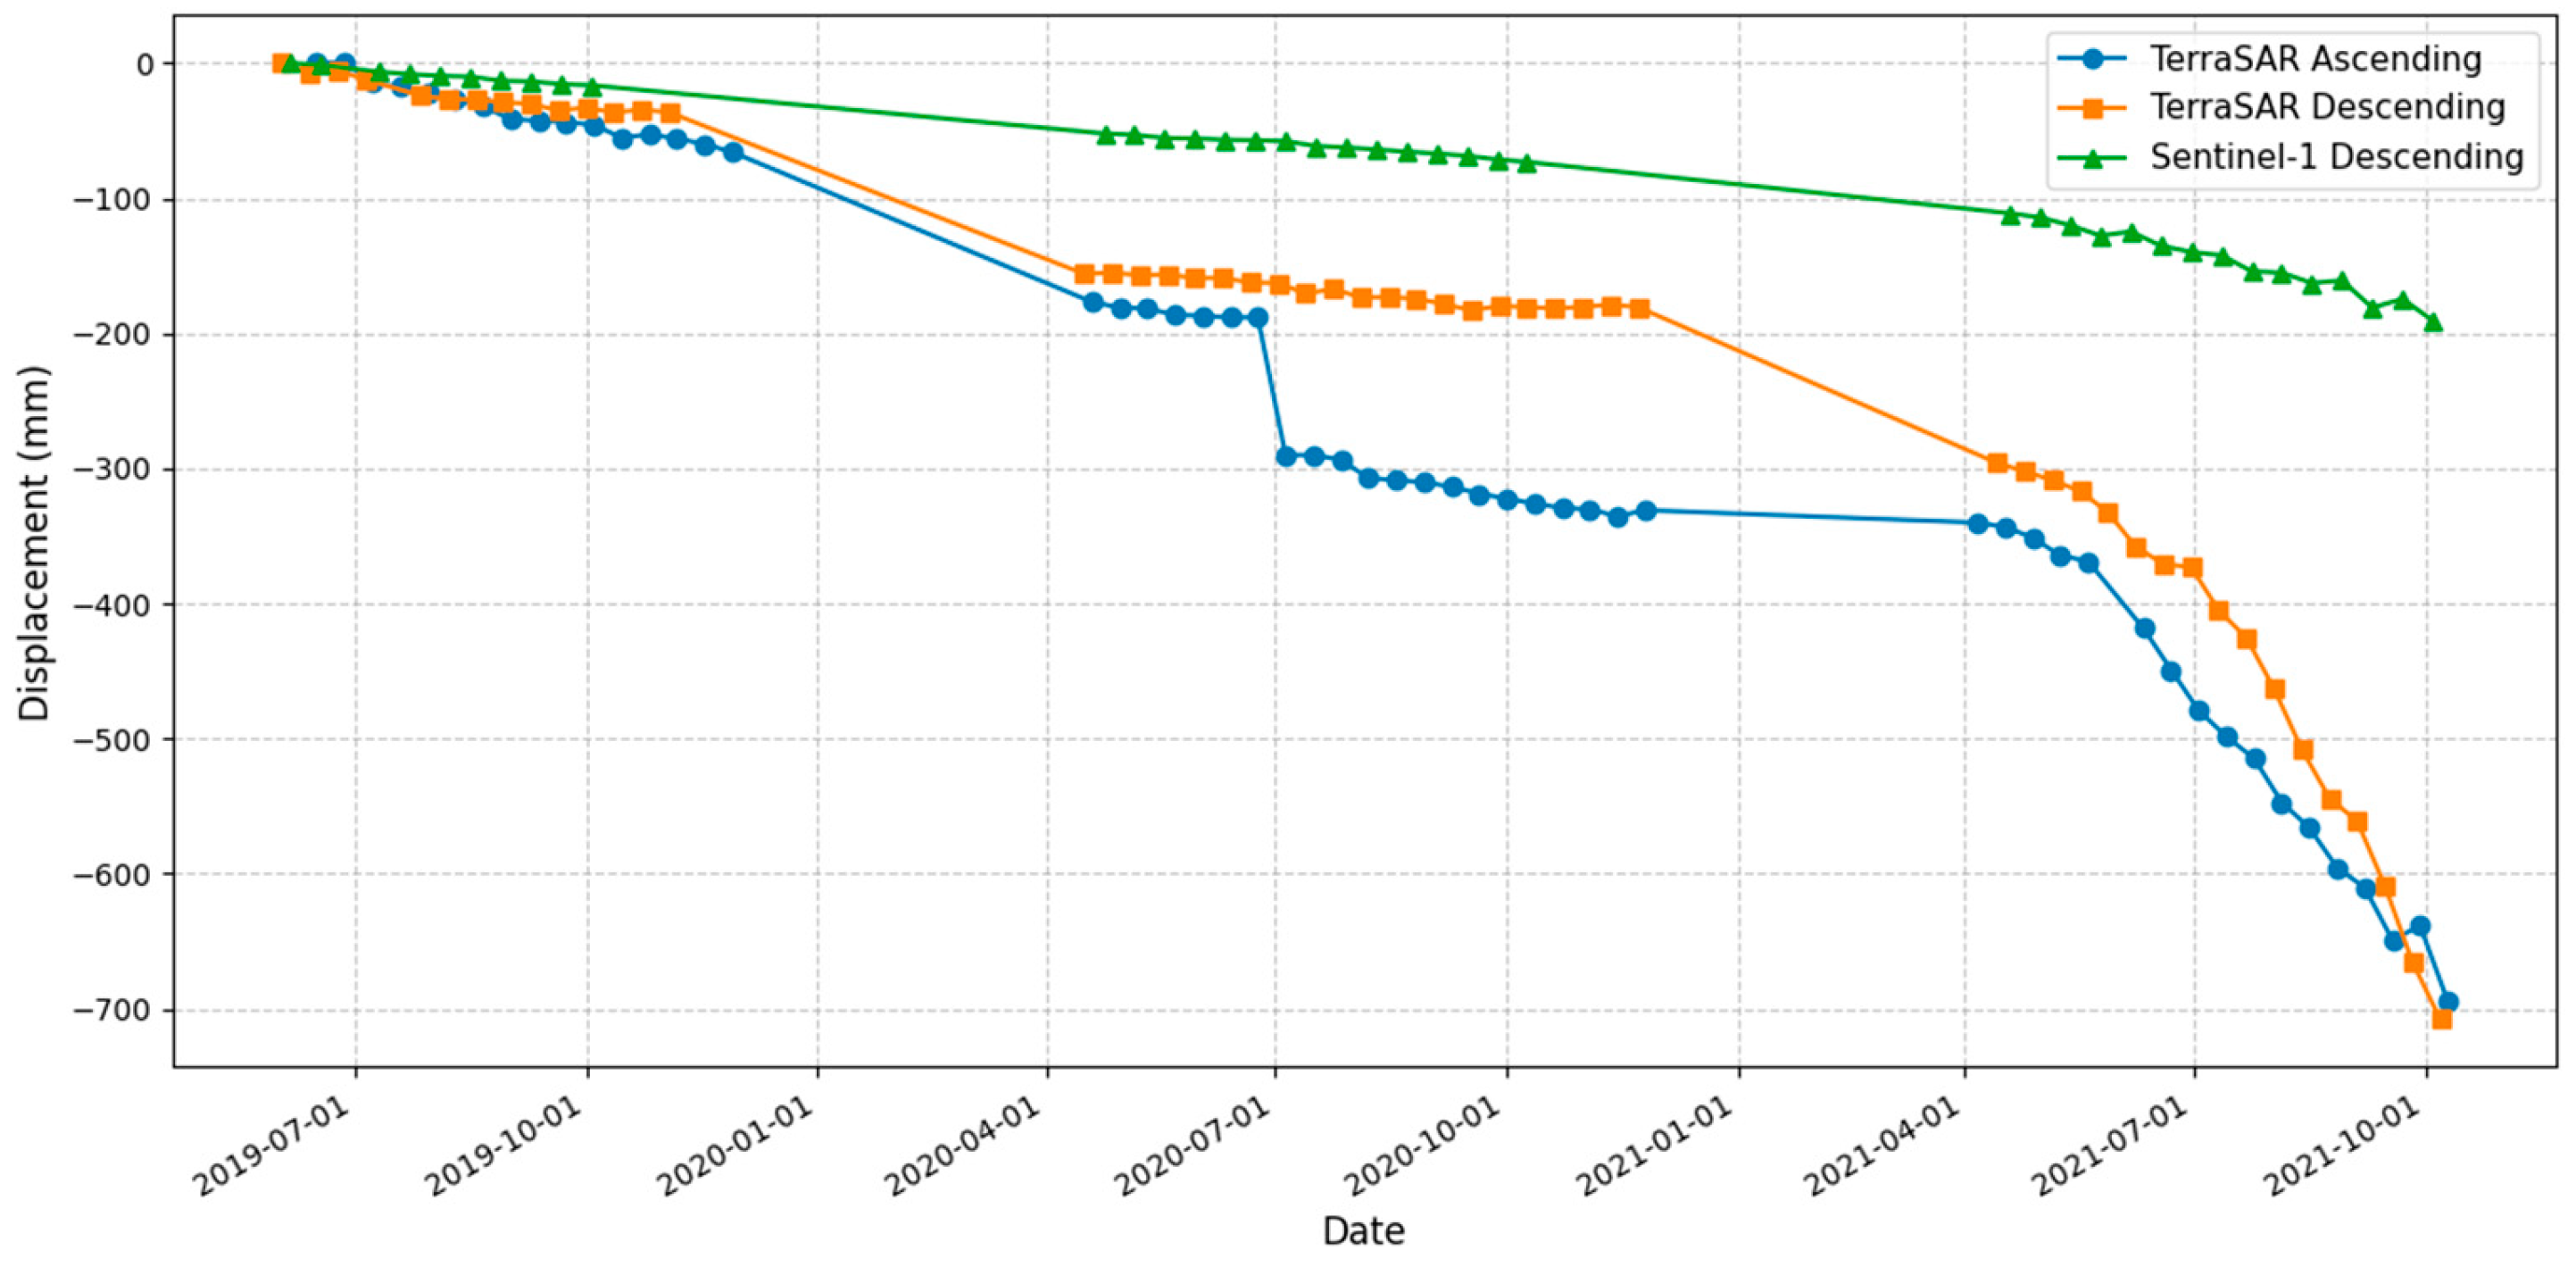
Kostenko Longwall No. 3 was mined over an 11-month period (October 2019 to September 2020), with a seam height of 3.0 m, a length of 893 m, and a width of 175.75 m. Over the three-year TerraSAR-X observation period, cumulative ground displacement approached −600 mm, while Sentinel-1 data indicated less than −200 mm of subsidence. During the active mining phase, TerraSAR-X measurements revealed approximately −450 mm of LOS displacement (
Figure 9).
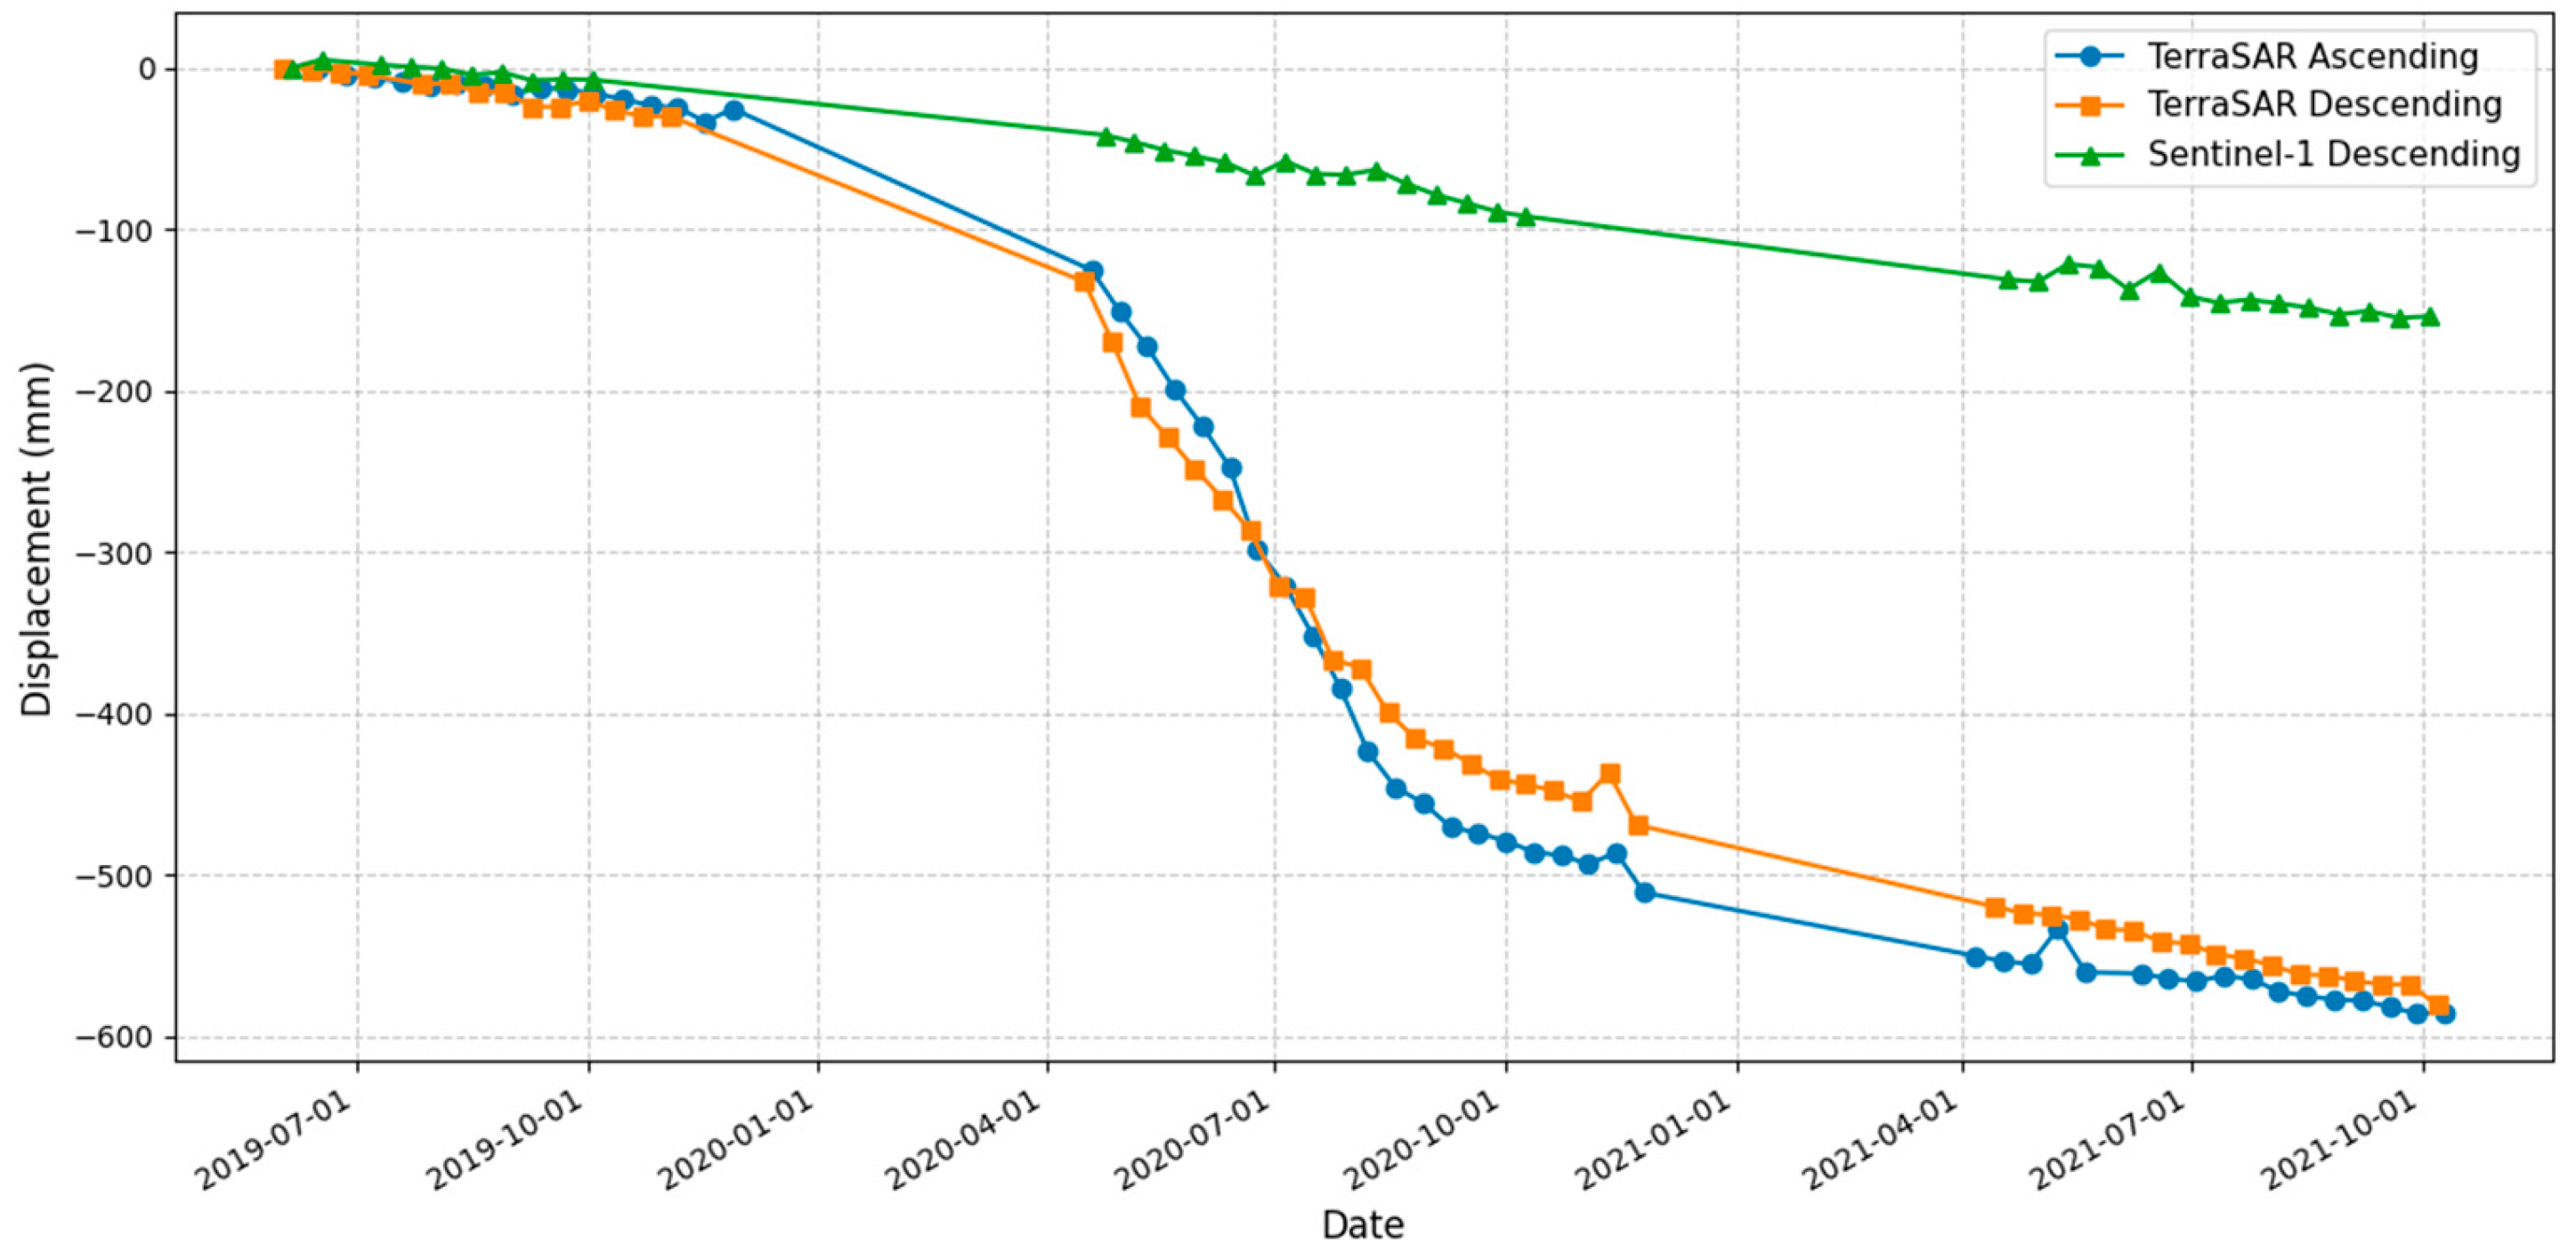
Kostenko Longwall No. 5 was developed between August 2019 and September 2020. It has a seam height of 2.65 m, a length of 1192 m, and a width of 210 m. During the observation period, cumulative LOS displacement exceeded −600 mm in TerraSAR-X data and about −320 mm in Sentinel-1 results. The monitoring timeline shows that subsidence accelerated during active mining: within nine months, surface displacements increased from nearly 0 mm to almost −500 mm (
Figure 10).
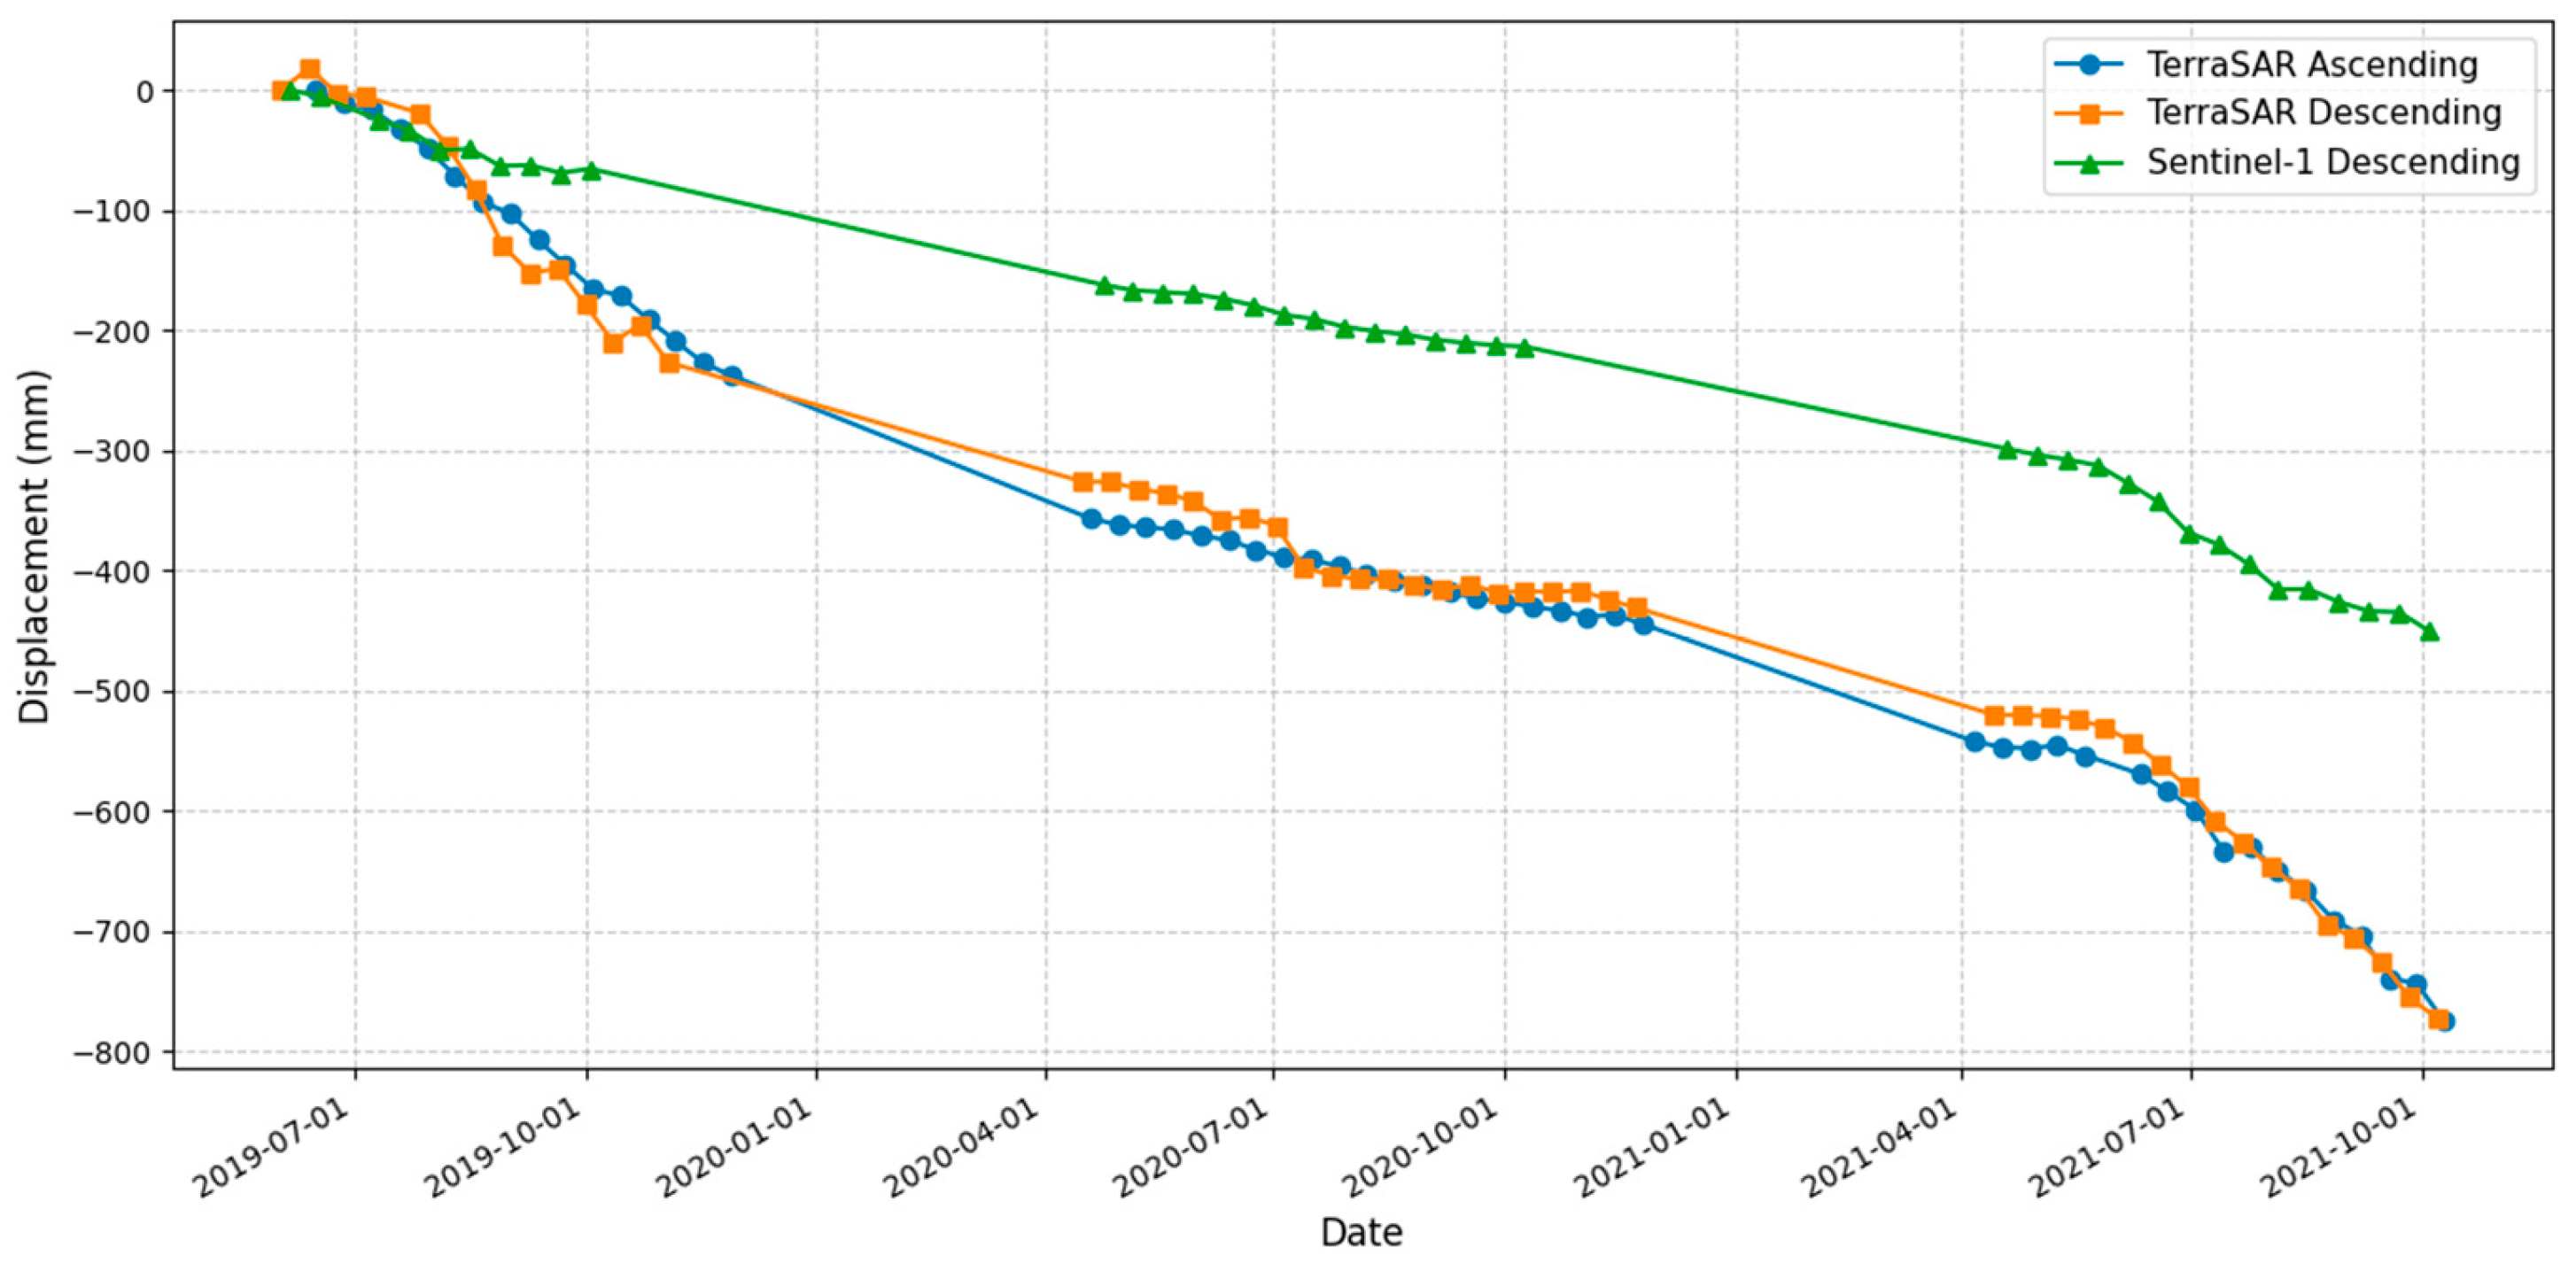
Kostenko Longwall No. 6 was developed from August 2020 to December 2021. It has a seam height of 2.5 m, a length of 1221 m, and a width of 190 m. Over the full observation period, cumulative LOS displacement exceeded −700 mm according to TerraSAR-X and about −400 mm based on Sentinel-1 data. At the beginning of the extraction, displacements had already reached nearly −300 mm, likely due to the influence of adjacent mined-out panels. During the 15 months of active longwall mining, an additional subsidence of about −400 mm was recorded (
Figure 11).
During the radar monitoring period, three longwalls—No. 7, 8, and 9—were actively mined. Longwall No. 10, however, had already been extracted earlier, between August 2018 and March 2019, prior to the start of InSAR observations. The deformation map (
Figure 6) reveals residual subsidence exceeding −200 mm/year in certain areas, most likely caused by post-mining ground adjustments.
A more detailed analysis of each longwall is presented below:
Longwall No. 7. This longwall was extracted between May 2020 and February 2021. It has a seam height of 4.2 m, a mining depth of 504.7 m, and a width of 241.55 m. Over the three-year radar observation period, cumulative displacement exceeded −800 mm according to TerraSAR-X data and about −500 mm according to Sentinel-1. During the active mining phase (nine months), subsidence reached approximately −500 mm in TerraSAR-X observations (
Figure 12).
Longwall No. 8, mined between June 2019 and March 2020, has a seam height of 3.9 m, depth of 540.81 m, and width of 251.27 m. The deformation in this area was so severe that it caused signal decorrelation, preventing the generation of coherent points over the longwall (
Figure 6). Considering that neighboring longwalls exhibit displacements exceeding −800 mm, it can be inferred that subsidence within Longwall No. 8 was even greater, which is consistent with its central location within the mining block.
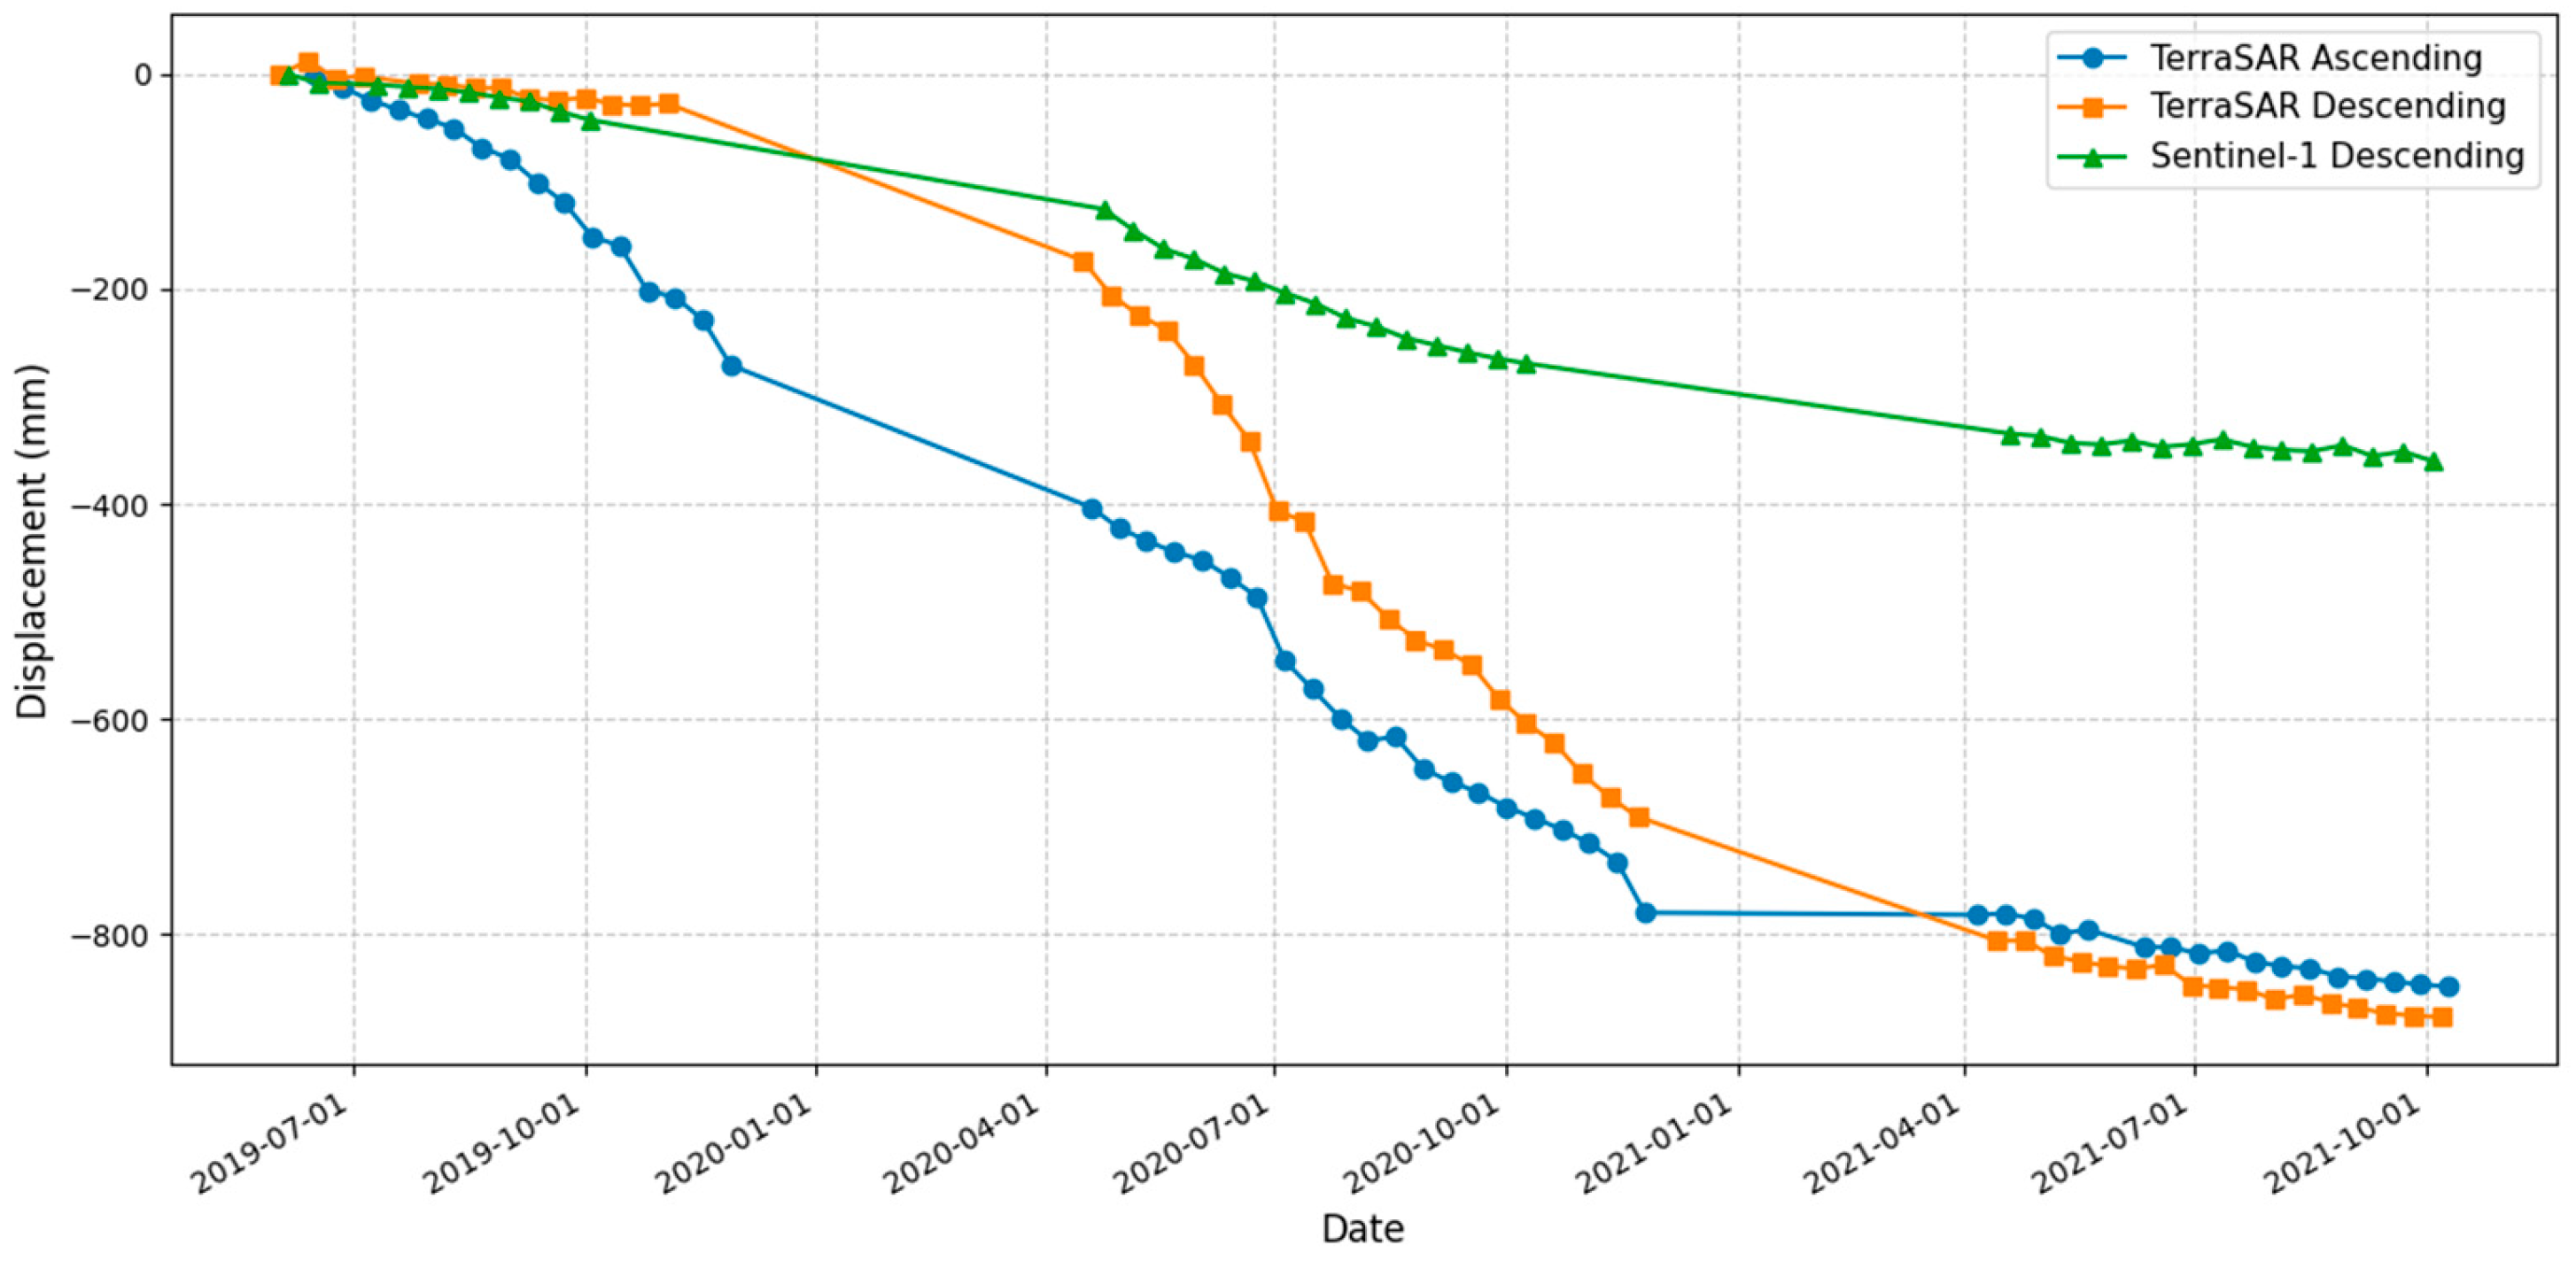
Longwall No. 9. This area was subject to two phases of development: June 2017 to March 2018, and May 2021 to December 2021. The respective seam heights were 3.6 m and 4.3 m, lengths were 489 m and 632.76 m, and widths were 249.44 m and 203.38 m. Over the three-year TerraSAR-X monitoring period, cumulative surface displacement reached approximately −800 mm, while Sentinel-1 data indicate a total displacement of about −450 mm (
Figure 13). The deformation graph indicates the following trends: in 2019 (June–November), subsidence increased by over −250 mm in just five months. In 2020 (April–November), drawdowns were comparatively lower, remaining under −100 mm. In 2021, a sharp decline is observed—from −550 mm to −800 mm within eight months. The significant subsidence in 2019 coincides with the development of Longwall No. 8. Given the close spatial proximity between the longwalls, mutual geomechanical influence is highly likely. Additionally, residual deformation following the 2017–2018 development phase may have contributed to the observed displacements.
Aktasskaya Longwall No. 11. Developed between April 2021 and October 2023, this longwall had a seam height of 3.5 m, a length of 1010 m, and a width of 205 m. Cumulative subsidence over the entire period exceeded −350 mm according to TerraSAR-X data, while Sentinel-1 measurements indicated a total displacement of about −120 mm. From the onset of mining and over the following seven months captured by radar observations, ground displacement reached approximately −170 mm. Notably, prior to the commencement of extraction, surface subsidence in this area had already reached about −200 mm, likely due to the influence of a nearby longwall mined before radar monitoring began (
Figure 14).
Over the three-year TerraSAR-X observation period, four longwalls were developed at the Saranskaya mine (
Figure 8):
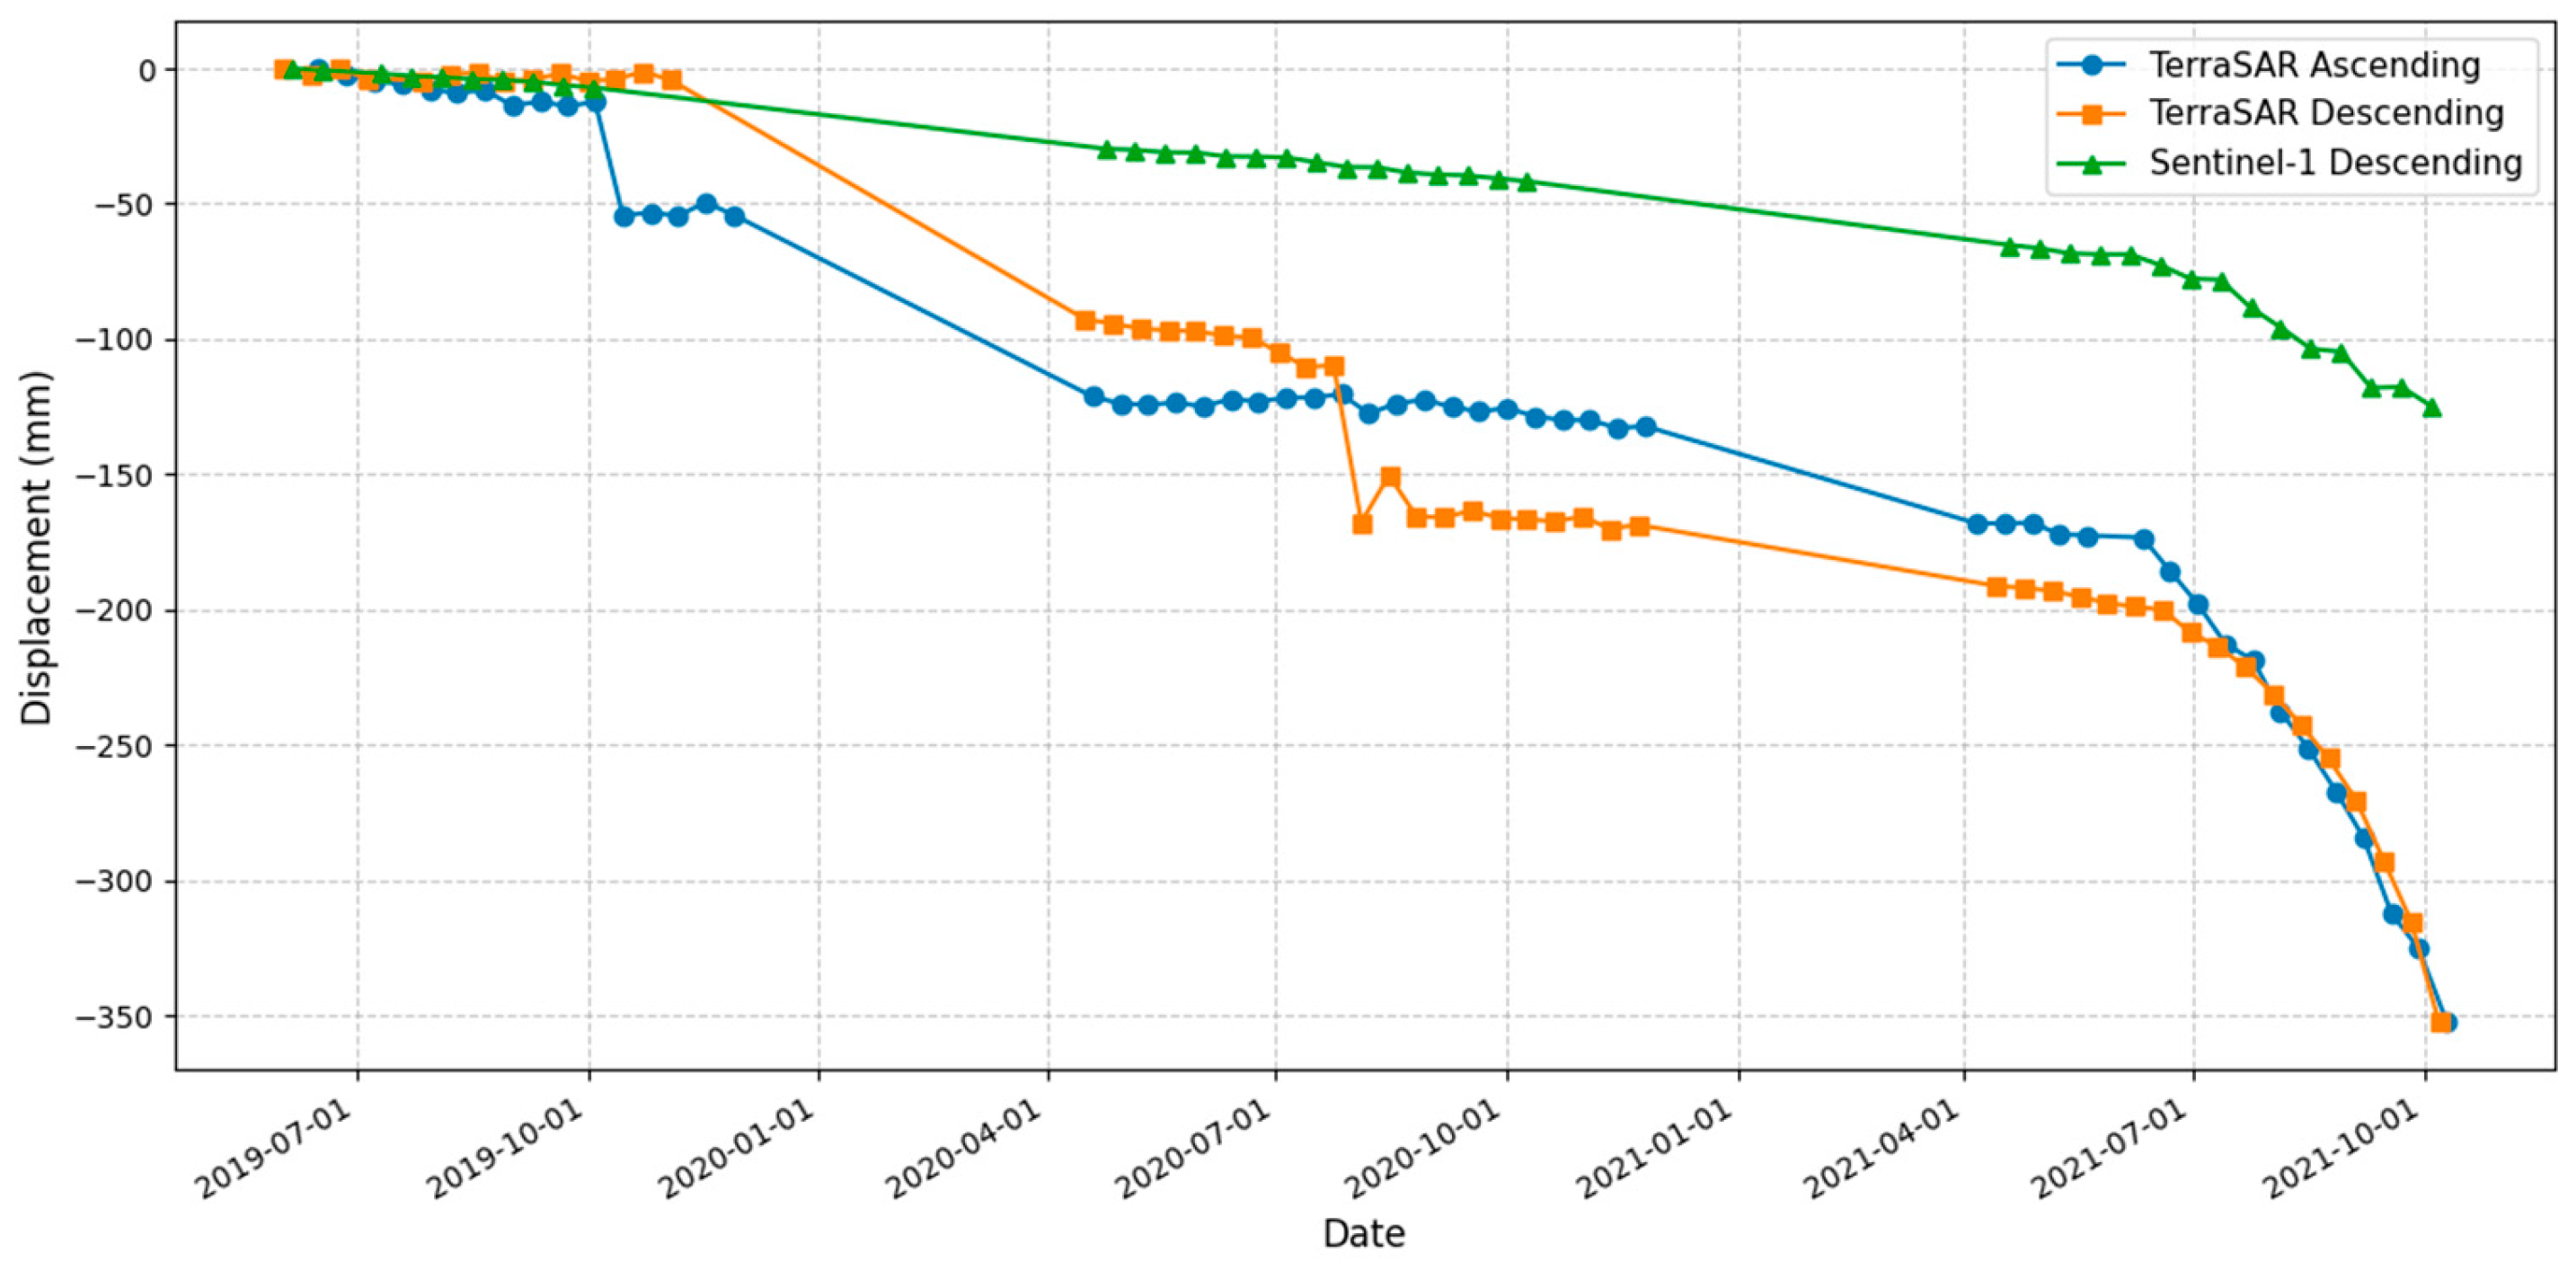
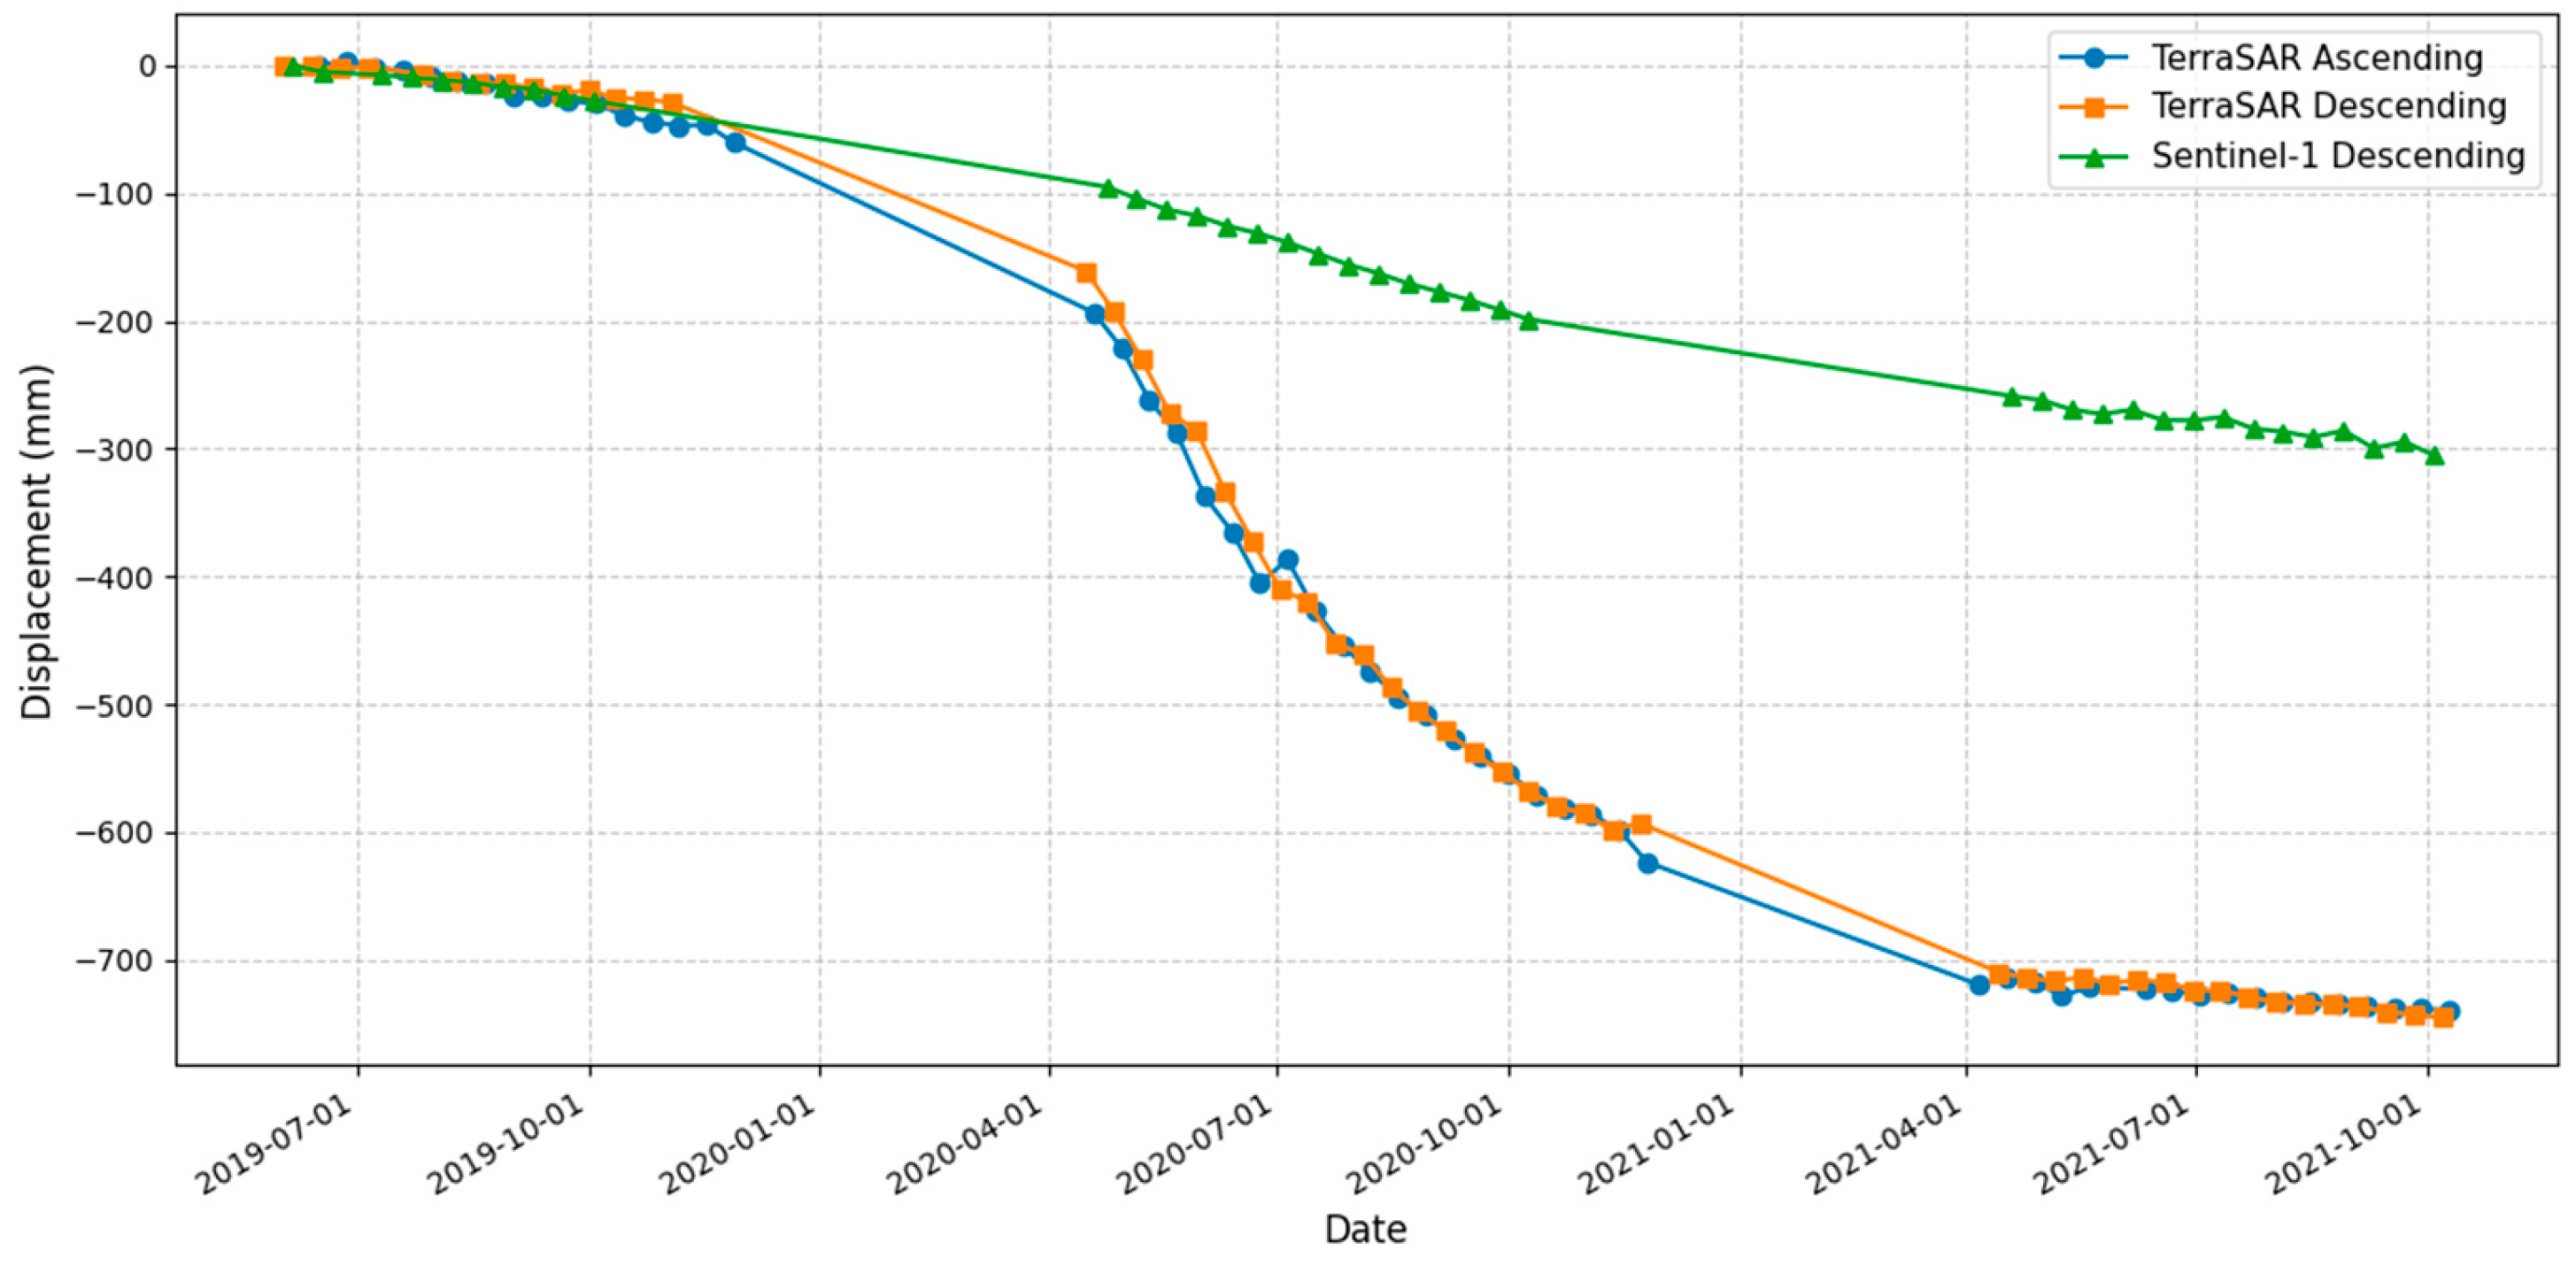
Longwall No. 13 was active from March 2021 to September 2022. The excavation measured 785.62 m in length, 185.28 m in width, and 3.1 m in height. TerraSAR-X observations cover only the initial phase of mining, from April to November 2021, during which displacements increased from approximately −350 mm to −700 mm. In contrast, Sentinel-1 data for the same period indicated a maximum displacement of about −100 mm. The TerraSAR-X time-series analysis clearly reveals a sharp acceleration of subsidence corresponding to the onset of mining activity (
Figure 15).
Longwall No. 15 was mined over the entire TerraSAR-X observation period, lasting 34 months from March 2019 to December 2021. The excavation measured 1297.6 m in length, 166.49 m in width, and 3.9 m in height. Between June 2019 and November 2021, the cumulative line-of-sight (LOS) displacement reached more than −800 mm according to TerraSAR-X data, while Sentinel-1 observations for the same period indicated a maximum displacement of nearly −400 mm (
Figure 16).
Longwall No. 18 was developed between June 2019 and March 2021 (21 months). The excavation measured 892.25 m in length, 186 m in width, and 3.9 m in height. During the mining period, surface displacement reached approximately −700 mm according to TerraSAR-X data, while Sentinel-1 data indicated a maximum displacement of about −250 mm. Analysis of the time-series graph shows that the rate of subsidence decreased markedly after mining ceased, with an additional displacement of only −50 mm recorded over the subsequent eight months (
Figure 17).
As an example, the analysis was carried out for the Kuzembayev mine area, covering 4.6 km
2, to assess the spatial density of coherent points (
Figure 18). A total of 13,660 coherent points were identified from Sentinel-1 data, corresponding to an average density of ~2970 points/km
2. In comparison, TerraSAR-X data yielded 913,142 coherent points in the ascending geometry (~198,509 points/km
2) and 902,660 coherent points in the descending geometry (~196,230 points/km
2), highlighting substantial differences in point density between the datasets.
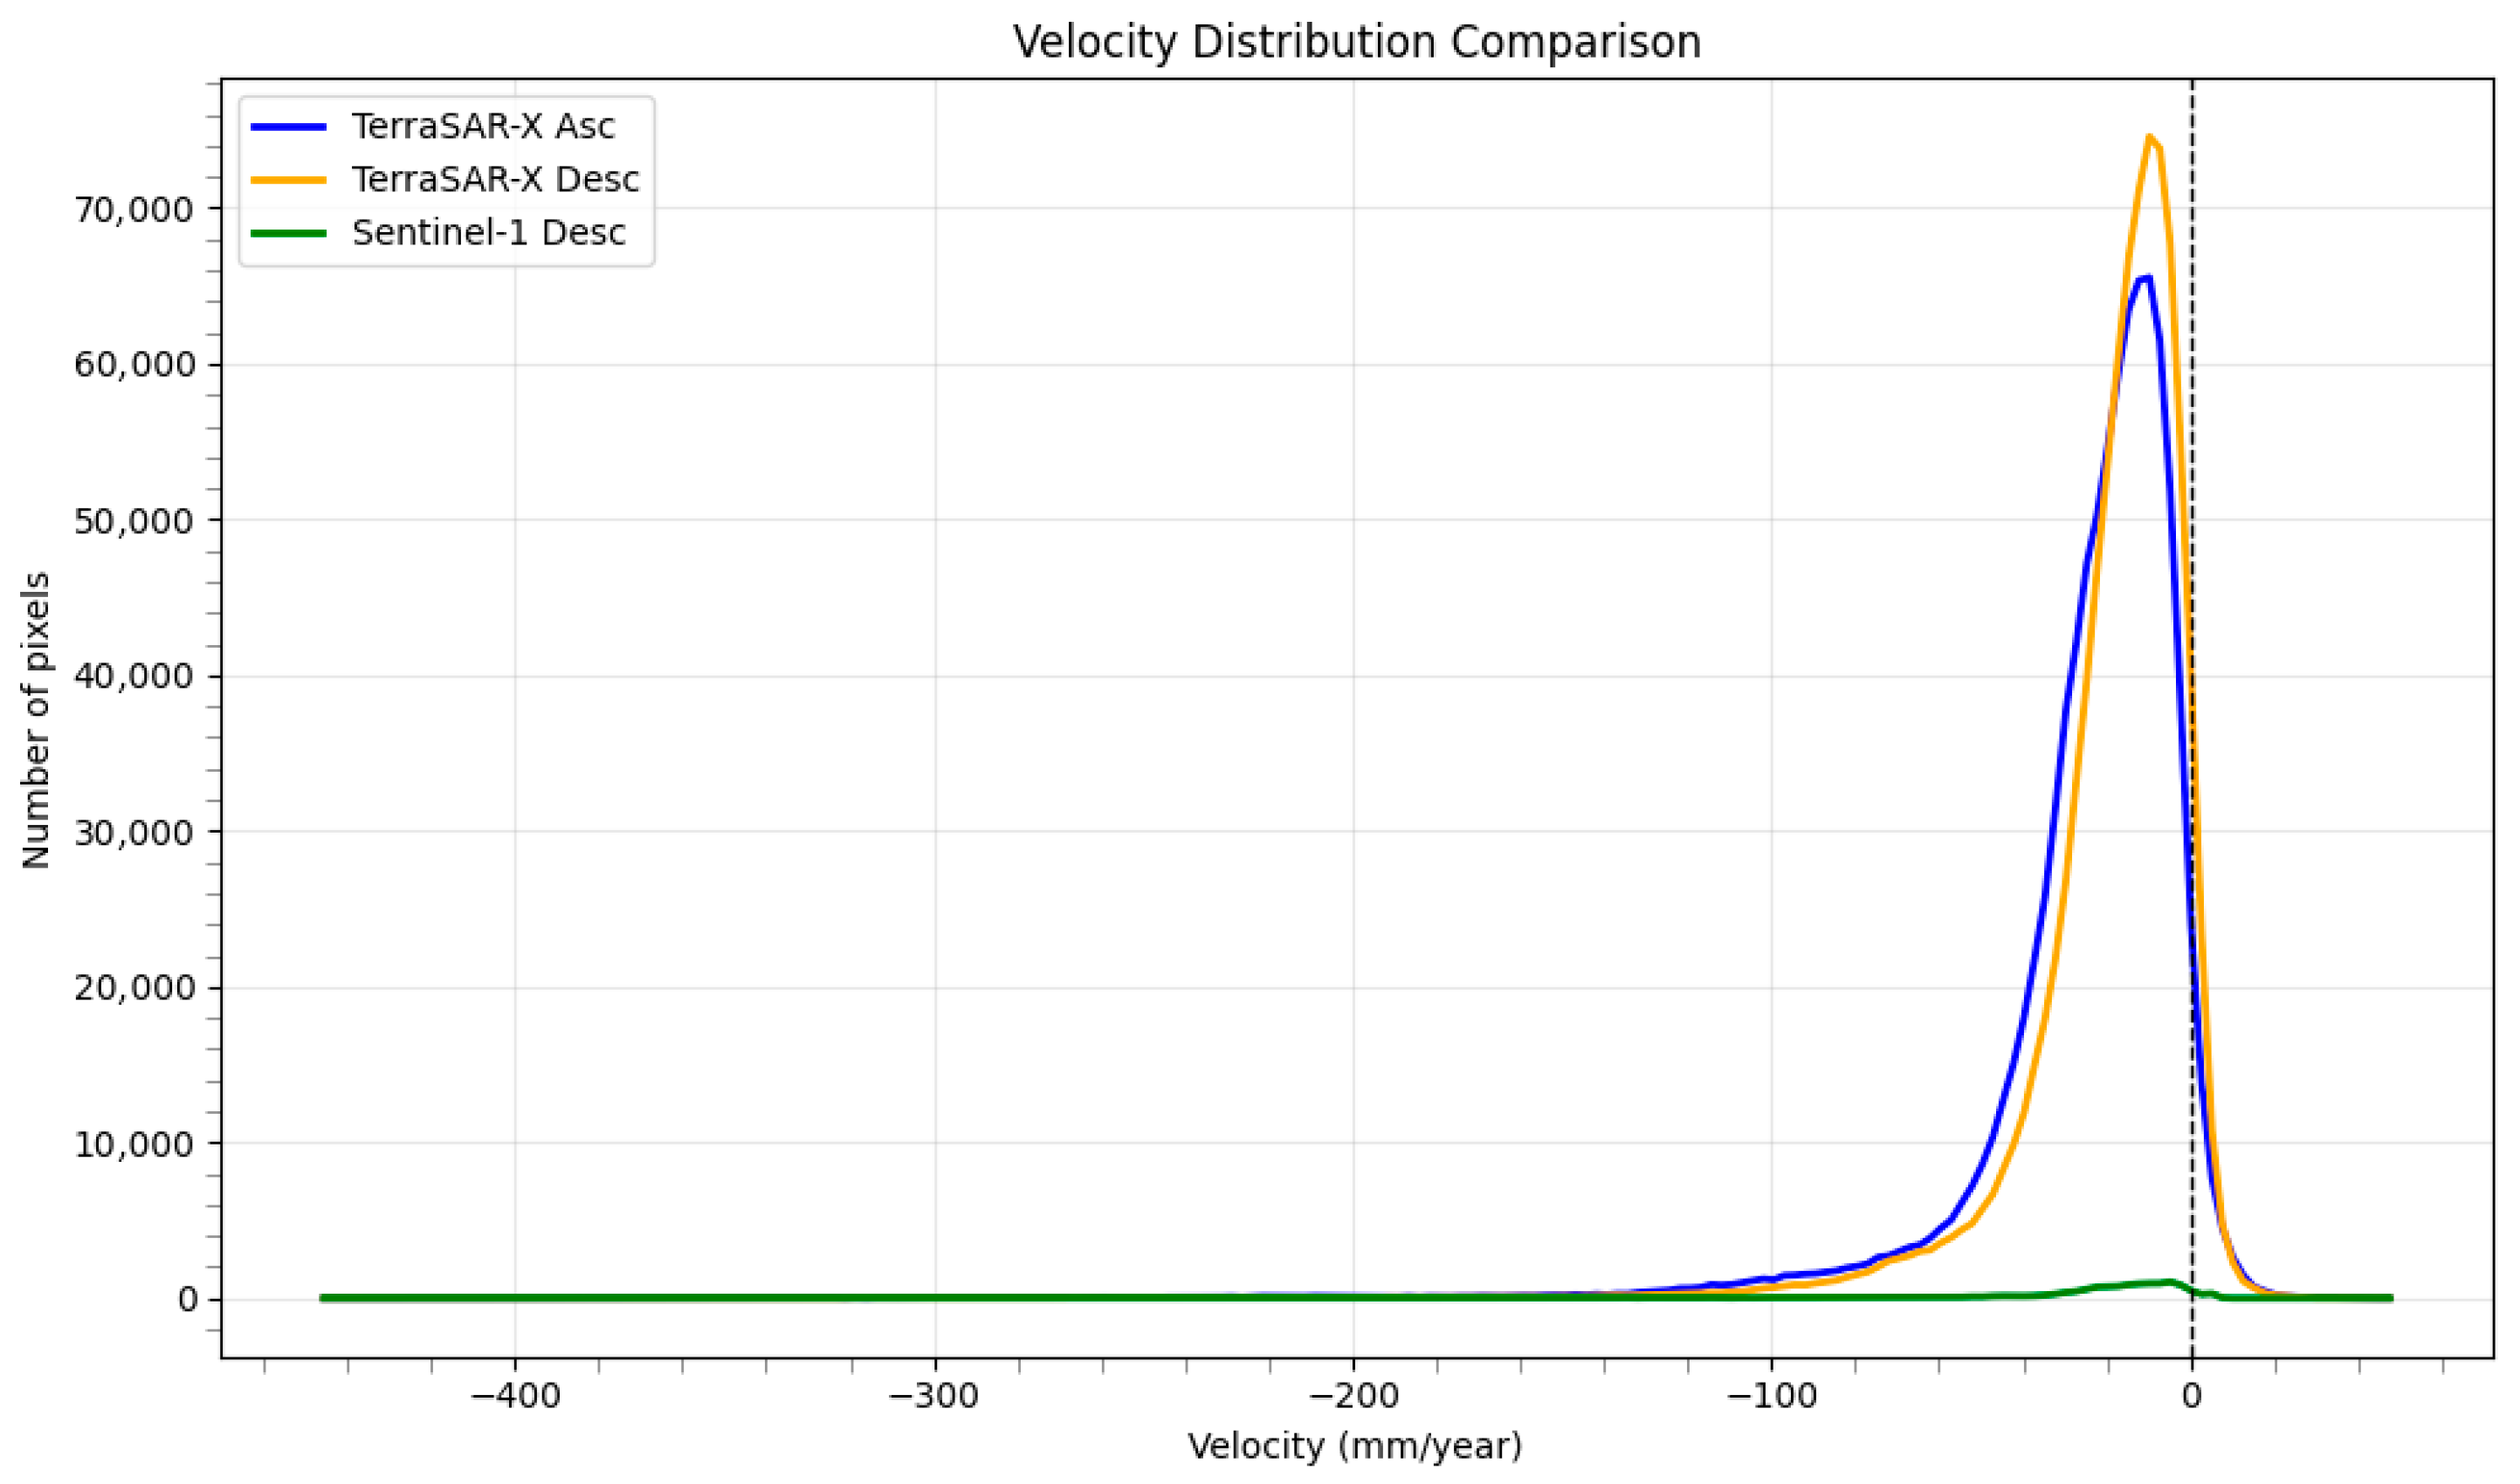
For a quantitative comparison of LOS displacement velocity distributions obtained from Sentinel-1 and TerraSAR-X satellites, the data were interpolated onto a common regular grid of 100 × 73 points using kriging with a linear variogram model (Variogram Model: Linear, Slope = 1, Aniso = 1.0).
The key reliability metric was the correlation coefficient calculated between the Sentinel-1 and TerraSAR-X results (
Figure 19):
0.9494 (TerraSAR-X ascending vs. TerraSAR-X descending),
0.9628 (TerraSAR-X descending vs. Sentinel-1 descending),
0.8978 (TerraSAR-X ascending vs. Sentinel-1 descending).
These values indicate an exceptionally high level of agreement and consistency between the datasets obtained from different satellites and processing methods.
The significance level (p-value) for all correlations equals 0 (p = 0), which is far below conventional statistical thresholds (e.g., 0.05, 0.01, or 0.001). A zero p-value implies that the likelihood of obtaining such high correlations by chance, in the absence of a real relationship, is virtually nonexistent. This allows us to reject the null hypothesis of variable independence and confirms that the correlations are highly statistically significant.
Thus, the results derived from Sentinel-1 and TerraSAR-X are mutually corroborating, providing strong confidence in the reliability of conclusions regarding the nature and magnitude of ground deformation above the studied mine. The main statistical parameters of the displacement velocity field derived from TerraSAR-X and Sentinel-1 data, as well as their cross-correlation, are presented in
Table 1 and
Table 2.
5. Discussion
Surface displacements. The SBAS-InSAR analysis of Sentinel-1 and TerraSAR-X datasets revealed significant ground deformations associated with underground coal mining in the Karaganda coal basin. The spatial patterns of displacement are consistent with the locations of active longwall panels, confirming the direct impact of mining activities on surface subsidence. Sentinel-1 data provided reliable detection of large-scale deformations, with cumulative LOS displacements exceeding −400 mm over the three-year period, whereas TerraSAR-X data, owing to its higher spatial resolution, captured localized cumulative displacements of more than −800 mm during the same timeframe.
The observed differences in displacement magnitude between Sentinel-1 and Ter-raSAR-X datasets can be explained by several factors. Sentinel-1 data, with lower spatial resolution (C-band), tend to smooth localized deformation signals, resulting in underestimation of peak subsidence values. In contrast, TerraSAR-X, with its higher spatial resolution (X-band), captures sharper gradients and localized maxima of displacement. Moreover, differences in wavelength sensitivity and coherence stability also affect the reliability of measurements in areas of rapid deformation. Temporal sampling and coverage further contribute to these discrepancies, with Sentinel-1 providing broader regional monitoring, while TerraSAR-X delivers more detailed characterization of localized ground movement. Taken together, these factors explain the higher maximum displacements recorded in TerraSAR-X results compared to Sentinel-1.
Nevertheless, the spatial distribution and the areal extent of localized subsidence zones are consistent in both Sentinel-1 and TerraSAR-X results. This agreement confirms that, despite differences in displacement magnitude caused by sensor characteristics, both datasets reliably capture the geometry of mining-induced deformations.
The InSAR results also demonstrated the potential to analyze the direction of longwall development. For example, in panels 11 and 13 (
Figure 7 and
Figure 8), the observations captured only the initial stages of mining, which are clearly reflected on the displacement maps as localized subsidence zones at the starting points of the longwalls. In addition, the displacement velocity maps provide valuable insights into the stability or attenuation of subsidence rates over previously mined panels such as 4, 10, 12, 14, and 16 (
Figure 5,
Figure 6,
Figure 7 and
Figure 8), where deformation progressively diminishes after mining completion. This highlights the capability of InSAR not only to track active subsidence but also to assess the post-mining evolution of ground stability.
The analysis of TerraSAR-X displacement time-series (
Figure 9,
Figure 10,
Figure 11,
Figure 12,
Figure 13,
Figure 14,
Figure 15,
Figure 16 and
Figure 17) clearly reflects the periods of longwall development, manifested as acceleration of ground movements. Furthermore, a gradual deceleration of subsidence is observed after mining completion, as illustrated in
Figure 9,
Figure 10,
Figure 12 and
Figure 17. In contrast, the displacement trends obtained from Sentinel-1 data exhibit a more linear pattern throughout the observation period, with no evident peaks corresponding to the initiation or cessation of longwall activities.
The availability of two TerraSAR-X acquisition geometries enabled the decomposition of LOS measurements into vertical and horizontal displacement components (
Figure 5,
Figure 6,
Figure 7 and
Figure 8). The results demonstrate that vertical displacements are the dominant component of the deformation field, resulting in the formation of multiple distinct subsidence troughs. The spatial distribution of vertical and horizontal displacements outlines these subsidence troughs clearly, with horizontal shifts converging toward their centers: the western flanks moving eastward and the eastern flanks moving westward. This pattern reflects the typical deformation mechanism associated with intensive underground coal extraction. The affected zones exhibit persistent and localized deformation, indicating ongoing subsurface movements likely driven by active mining operations. Furthermore, the spatial distribution of the observed displacements correlates closely with the documented locations of longwall extraction, confirming that these areas represent geodynamically hazardous zones.
The InSAR results are further corroborated by seismic events: 21 earthquakes with magnitudes of up to 3.5 were recorded between 2006 and 2018 (
Figure 3) were recorded within a 50 km radius of the mining field, despite the region being generally classified as aseismic. This indicates that long-term underground mining operations may act as a triggering factor for seismic activity. Given that coal mining in the Karaganda Basin has been ongoing for approximately 160 years, a persistent trend of cumulative subsidence has developed across the region, as confirmed by both Sentinel-1 and TerraSAR-X datasets.
Correlation between independent datasets. The histograms of LOS displacement velocities derived from Sentinel-1 and TerraSAR-X data (
Figure 18) show that the majority of measurement points fall within the range of approximately ±50 mm/yr. Despite the fact that pixel-by-pixel comparison of cumulative LOS displacements between TerraSAR-X and Sentinel-1 revealed notable differences (
Figure 9,
Figure 10,
Figure 11,
Figure 12,
Figure 13,
Figure 14,
Figure 15,
Figure 16 and
Figure 17), the correlation analysis shown in
Figure 19 indicates a high level of consistency between the two datasets. The highest agreement was obtained between the descending orbits of Sentinel-1 and TerraSAR-X (r = 0.9628), which provided the most comparable viewing geometries. This can be explained by the fact that points with stable displacement values correlate strongly, whereas discrepancies are primarily confined to localized deformation zones directly above active longwalls. Since these zones account for only a small proportion of the total number of measurement points, the overall correlation remains high. This suggests that Sentinel-1 data are well suited for regional-scale monitoring and for characterizing the general geodynamic state of the study area, but they are less effective for capturing rapid and large-magnitude ground movements.
The slight differences observed between the TerraSAR-X ascending and descending orbit time-series can be explained by the influence of the horizontal displacement component, which projects differently onto the line-of-sight depending on the viewing geometry. While vertical subsidence dominates the deformation field, even moderate horizontal shifts associated with panel convergence and lateral ground movements may contribute to these discrepancies. Such effects are particularly evident in areas of active longwall mining, where the combination of vertical settling and horizontal convergence generates a complex three-dimensional deformation pattern. Therefore, the complementary use of both ascending and descending geometries provides a more complete characterization of the subsidence process, allowing for the separation of vertical and horizontal displacement components.
Validation of results. A comparable study by Meldibekova et al. [
55], based on Sentinel-1 data and the SBAS method, reported cumulative subsidence of approximately −350 mm over a five-year period at the Kostenko mine. In contrast, in this study the maximum recorded displacement reaches −400 mm from Sentinel-1 data and −700 mm from TerraSAR-X data over a shorter three-year span. These higher values can be attributed to the complex geological structure of the Kostenko area and the fact that for more than a century it has been subjected to intensive underground coal mining, which has progressively weakened the overlying rock mass.
It is surrounded by several decommissioned mines, including the Gorbachev, Parkhomenko, and 20th mines, which have contributed to persistent regional waterlogging and chemical contamination of the upper soil layers. Despite the loss of its industrial and residential significance, mining activity continues at Kostenko, mainly targeting the thick K12 seam (7–8 m).
Over the past four years, mining has been conducted using longwall methods, with coal production gradually declining. Due to difficult geological and mining conditions, no new production levels have been introduced recently. Active ground deformation in the area is primarily driven by repeated coal extraction at different depths, which disrupts the internal tectonic structure of the overlying rock mass. Consequently, ground subsidence typically begins almost immediately after longwall development starts.
In the Old Town area near the Kostenko mine, historical ground deformation has already necessitated the relocation of residential buildings. Subsidence processes are ongoing and pose a continuous hazard due to unstable ground conditions and the risk of sinkhole formation.
At the Kuzembayev mine, the subsidence trough did not register its maximum values directly over the mined longwalls due to strong signal decorrelation (
Figure 6). This decorrelation is indicative of high-magnitude and rapid ground displacements, likely exceeding the coherence threshold of the SAR data. Nevertheless, the maximum registered displacement values exceeded −800 mm over the three-year observation period, which can be attributed to the simultaneous development of three adjacent longwalls during this timeframe.
A comparison with previous studies confirms the reliability of the results. In particular, Mozer et al. (2014) [
56] reported a subsidence trough at the Kuzembaev mine reaching up to −290 mm in depth and covering an area of approximately 700 × 500 m over just nine months of mining. In contrast, in this study, the subsidence area was significantly larger—approximately 2300 × 1500 m—which may be explained by repeated coal extraction at multiple depths and the cumulative effect of long-term deformation processes.
To verify and quantitatively assess the accuracy of the results obtained using the SBAS-InSAR method with Sentinel-1 and TerraSAR-X data, calculations of the maximum ground surface subsidence were performed using the standard formula 2 [
57].
where
is the relative value of maximum subsidence;
m is the extracted thickness of the seam (when filling the mined-out space—the effective thickness);
α is the angle of dip of the seam;
N1, N2 are the coefficients taking into account the degree of underworking of the strata.
For typical conditions of the Karaganda basin: for previously unworked strata = 0.75; for worked strata = 0.85. Coefficients N1 and N2 are determined depending on the ratio of the size of the workings, respectively, across the strike and along the strike of the formation to the average depth of development.
Based on the above formula and input data for individual longwall panels, the predicted maximum subsidence values were calculated for each mine. These results, along with the observed subsidence derived from InSAR data, are summarized in
Table 3.
According to the values presented in
Table 3, longwalls 3, 5, 8, 15, and 18 have already exceeded their projected maximum subsidence, indicating that these panels require continuous monitoring to ensure operational safety. In contrast, longwalls 6, 7, and 9 have not yet reached their expected maximum values. For longwalls 11 and 13, the satellite observations only captured the initial stages of extraction; nevertheless, in the case of longwall 13, cumulative displacements of −350 mm were recorded within just 9 months of an 18-month extraction cycle. This strongly suggests that subsidence in this panel is also likely to exceed the projected maximum.
Many characteristic features identified in this study align with international observations. For example, the inherited and prolonged nature of subsidence persisting for years after mining cessation is widely documented in various regions worldwide. The article [
58] describes cases where residual subsidence persisted for decades after mine closure, such as in the Houthalen area of Belgium, where subsidence rates of 2.8–8.7 mm/year were observed for 40–60 years’ post-closure, with a maximum subsidence of 72.2 mm. This is attributed to prolonged compaction of overburden and convergence of mined voids. Cui et al. [
59] identify three subsidence phases: active, attenuating, and residual, with Chinese case studies showing residual subsidence rates up to 30 mm/year lasting 7–12 years after closure. Additionally, Wu et al. [
60] demonstrate that repeated mining in closely spaced seams leads to an expanded impact zone and a 5.05% increase in maximum subsidence, indicating the cumulative effect of multiple mining operations. These international findings support the conclusion that subsidence in the Karaganda Basin persists and may even intensify years after mining, particularly in areas with repeated seam extraction at different depths.
Thus, multi-temporal InSAR analysis of Sentinel-1 and TerraSAR-X data is an effective tool for identifying zones of high geodynamic activity and quantitatively assessing deformations related to underground coal mining. These results are crucial for risk assessment, infrastructure planning, and environmental monitoring in post-industrial urbanized areas.
6. Conclusions
This study demonstrated the effectiveness of multi-temporal SBAS-InSAR analysis using Sentinel-1 and TerraSAR-X data for monitoring ground deformation in the Karaganda coal basin. Both datasets revealed significant subsidence directly associated with longwall coal mining, with cumulative displacements exceeding −400 mm from Sentinel-1 and −800 mm from TerraSAR-X over a three-year period. While Sentinel-1 proved reliable for regional-scale detection of large-scale deformation, TerraSAR-X provided higher-resolution insights into localized and rapid ground movements. The complementary use of the two sensors allowed for consistent mapping of the spatial extent and geometry of subsidence troughs across the Kostenko, Kuzembaev, Aktasskaya, and Saranskaya mines.
The decomposition of TerraSAR-X data into vertical and horizontal components confirmed that vertical displacement is the dominant deformation mechanism, with horizontal convergence toward trough centers further shaping the observed subsidence patterns. These results indicate ongoing and localized ground movements directly linked to underground coal extraction, highlighting the high geodynamic activity of the region. Importantly, 21 seismic events were recorded within a 50 km radius of the study area, despite the Karaganda Basin being classified as an aseismic region. This correlation suggests that long-term underground mining may act as a triggering factor for seismicity.
A comparison with empirical predictions and previous studies confirmed the reliability of the InSAR-derived results. Several longwalls, including panels at the Kostenko, Saranskaya and Kuzembaev mines, already exceeded their projected maximum subsidence, underscoring the need for continuous monitoring of hazardous zones. The observed persistence of deformation after mining completion aligns with international case studies, where residual subsidence may last for decades.
Overall, this research demonstrates that InSAR-based monitoring is a valuable tool for identifying hazardous deformation zones, supporting risk assessment, and informing safe urban and industrial development in post-mining areas of the Karaganda Basin. The integration of Sentinel-1 for large-scale surveillance and TerraSAR-X for detailed characterization offers a robust framework for long-term geodynamic monitoring in regions affected by intensive underground coal mining.


