Article

Spatial Variability and Geostatistical Modeling of Soil Physical Properties Under Eucalyptus globulus Plantations

by
Javier Giovanni Álvarez-Herrera
*,
Marilcen Jaime-Guerrero
and
Carlos Julio Fernández-Pérez
Grupo de Investigaciones Agrícolas (GIA), Facultad de Ciencias Agropecuarias, Universidad Pedagógica y Tecnológica de Colombia, Boyacá 150001, Colombia
*
Author to whom correspondence should be addressed.
Geomatics 2025, 5(3), 41; https://doi.org/10.3390/geomatics5030041
Submission received: 26 July 2025 / Revised: 27 August 2025 / Accepted: 2 September 2025 / Published: 4 September 2025

Abstract

Agricultural productivity is closely linked to the spatial variability of soil physical properties. However, high variability makes it difficult to implement effective management strategies, and the constant expansion of eucalyptus plantations in certain areas alters the soil’s physical properties. This study conducted a geostatistical analysis of the physical properties of a soil in Sogamoso, Boyacá (Colombia), which contains areas with different management practices and vegetation cover, among which the presence of Eucalyptus globulus stands out. Ninety-seven points were sampled in an area of 29.1 ha, with multiple land uses. The data were analyzed using descriptive statistics and geostatistical analysis, which determined the semivariogram parameters, the degree of spatial dependence, and the best-fitting interpolation model for mapping. A correlation analysis between variables was also performed. Analysis of variance showed no significant differences among vegetation covers (dense forest, grass-crop mosaic, weedy grassland, and crop mosaic), indicating structural homogeneity. The hydraulic conductivity (Ksat) had the highest coefficient of variation (CV), at 141.9%, while particle density had the lowest CV, at 9.25%. Ksat (exponential model, range = 207 m) and porosity (spherical model, range = 98 m) showed a strong spatial dependence. Ksat was lower in areas with eucalyptus (0.01 to 0.2 m day−1), attributed to hydrophobicity induced by organic compounds emitted by these plantations. Soil moisture contents showed lower values in areas with eucalyptus, corroborating their high water consumption. Soil aggregates were lower when eucalyptus plantations were on slopes greater than 15%. Porosity showed an inverse correlation with apparent density (r2 = −0.86).

1. Introduction

The study of the spatial variability of soil physical properties has gained significant importance in recent years, as it is crucial in areas such as precision agriculture, where it enables the optimization of resources like water, fertilizers, and agrochemicals, increasing application efficiencies and reducing both economic and environmental costs [1]. Similarly, it serves to identify soils prone to degradation caused by processes such as erosion and compaction, allowing for the development of management plans for soil conservation [2]. The field is rapidly advancing toward an integrated frameworks that combine real-time sensing, AI-driven modeling, and climate-aware geostatistics. Leading developments now include online dual-sensing systems, enabling quick field-scale characterization [3], as well as a process-based model that integrates geospatial variability with climate projections for predictive resilience [4]. Additionally, AI-enhanced interpolation combined with multi-criteria decision tools helps improve soil and land use planning. Hybrid GIS-geostatistical models also offer more accurate erosion predictions across different land use and slope conditions. In water resource management, understanding soil physical properties enables the planning of appropriate irrigation and the optimization of water resource conservation. Likewise, the use of geostatistical analysis tools, combined with technologies such as remote sensing and geographic information systems (GIS), enhances analytical capacity and decision-making [5]. Recent bibliometric reviews confirm the accelerating adoption of remote sensing, machine learning, and fuzzy kriging techniques [6], positioning the proposed study to make a meaningful contribution to this state-of-the-art trajectory.
Soil physical properties exhibit high spatial variability, even at small scales, making it challenging to develop adaptive management strategies that optimize resource use [1]. Furthermore, the introduction of forest species such as eucalyptus increases this variability due to the effects these trees have on soil degradation, reduced hydraulic conductivity, and increased bulk density, which causes phenomena such as compaction. According to Sarto et al. [7], eucalyptus plantations extract large amounts of water, decreasing soil moisture content. This value is influenced by the increasingly severe effects of climate change, which prolongs periods of drought and flooding, thereby altering soil structure and function. In this regard, Dzikiti et al. [8] determined that stand-level evapotranspiration in eucalyptus plantations can reach values of 833 mm per year. Likewise, Salazar et al. [9] mention that the introduction of eucalyptus trees increases the soil’s water-repellency due to the coating that organic compounds generate on the soil’s mineral components. This repellency causes a decrease in infiltration rates, which favors runoff and, consequently, soil erosion, thereby altering the hydrological cycle. Similarly, eucalyptus plantations significantly decrease the stability of soil aggregates in the short term, which in turn affects the soil’s potential fertility and its suitability for cultivating other crops [10].
In recent years, eucalyptus plantations have expanded significantly due to their use in the construction and industrial markets, and are currently replacing crops and other forms of plant cover. This tree species is characterized by being invasive, with rapid regrowth, and its allelopathic effects suppress the growth of different species, which decreases the biodiversity of the understory [11]. In Colombia, in the department of Boyacá, this introduced species is not only cultivated for logging but also used in the municipalities of Tópaga, Mongua, and Ombachita for the construction of coal mines [12]. Additionally, it spreads freely through living fences and windbreaks, covering wide areas [13].
The use of geostatistical tools has gained relevance, as they enable a better understanding of soil properties and more efficient resource utilization by facilitating a sense of spatial correlation [1]. Peng et al. [14] evaluated the behavior of soil aggregate stability and found that it showed higher values in the higher parts of the areas being assessed, decreasing with decreasing altitude. Ye et al. [15] mention that the weighted mean diameter (MWD) exhibits moderate to high variability, with coefficients of variation (CV) ranging from 27% to 50%. Likewise, Li et al. [16] obtained low plateau values, attributing this to the fact that environmental factors were the primary source of variation in soil aggregate stability. Similarly, the nugget effect was approximately 50%, indicating an intermediate level of spatial correlation in soil structure.
In this regard, Awal et al. [1] mention that saturated hydraulic conductivity (Ksat) exhibits moderate to high variability and does not fit a normal data distribution. It also presents a nugget effect proportion of 38% and a range of 32.5 m, implying that this property has moderate spatial dependence. Similarly, they report that volumetric moisture content (θV) has a range of 58 to 226 m, which allowed them to define irrigation sectors based on these distances. On the other hand, Álvarez-Herrera et al. [17] mention that particle density has a range of 75 m and exhibits a low spatial dependence level (SDL), in contrast to the behavior of bulk density, which has a high degree of spatial dependence, with a range of 18 m.
In this context, the use of geostatistical models allows for the identification of the spatial dependence between different sampled points, which facilitates the creation of maps that more accurately represent soil characteristics that directly influence water and nutrient availability, soil aggregate stability, and mechanical resistance to roots, which are essential for designing agronomic management practices, optimizing irrigation, and preventing degradation processes such as compaction and erosion [5]. Therefore, the present study aimed to perform a geostatistical analysis of the physical properties of the soil in an area with Eucalyptus globulus plantations, located in the township of Ombachita, in the municipality of Sogamoso (Colombia), under high tropical conditions, where soils are derived from volcanic ash and steep slopes and this can influence their effects in unique ways, unlike findings in temperate regions. The impact of the trees in this area has been little investigated, giving the research a novel aspect, as most previous studies were conducted in temperate or low-altitude regions. Furthermore, the results obtained will enable an evaluation of the impact of these plantations on soil properties and provide valuable tools for local communities to adopt more sustainable agricultural management practices tailored to their specific conditions.

2. Materials and Methods

2.1. Study Site and Sampling

The study was carried out in the upper Jiménez sector of the Ombachita district, within the municipality of Sogamoso, Boyacá Department, at coordinates 5°48′58″N, 72°53′57″W, covering 29.18 ha. Sampling took place at 97 georeferenced points arranged in a grid with approximately 50 m between each point (Figure 1). These points represent the vegetation cover in the study area. The area includes land covers with eucalyptus stands, livestock pastures, and agricultural plots, identified through field exploration, observation, and photography of the vegetation cover. This information was used to create a land cover map using the CORINE Land Cover (CLC) classification methodology, approved for Colombian ecosystems by the Agustín Codazzi Geographic Institute. The soils in the zone are classified as Inceptic Haplustalfs, Lithic Ustorthents, and Typic Dystrustepts (Figure 1). Haplustalfs are characterized by an argillic horizon with clay accumulation, which provides them with some natural fertility, and they are mainly used for forestry and short-cycle crops. Ustorthents are young soils with poorly developed horizons and lithic contact at depths of less than 50 cm, which limits their water-retention capacity and fertility. They are primarily used for extensive livestock farming. Dystrustepts are moderately developed soils with low base saturation. As a result, they are typically acidic soils with low fertility, and their agricultural use requires amendments and fertilization to enhance productivity [18].

2.2. Measurement of the Physical Properties of the Evaluated Soil

Saturated hydraulic conductivity (Ksat) was measured at each sampling point using a constant-head permeameter, which consisted of a 20 cm high, 11 cm diameter cylinder with a removable mesh at the bottom. After removing the first 10 cm of vegetation cover, the cylinder was inserted vertically into the soil to a depth of 30 cm, using gentle tapping to minimize disturbance to the natural soil structure. Once the sample was extracted, it was carefully prepared to fit the lower level of the cylinder base, thereby minimizing water loss and facilitating easier transportation to the laboratory. The sample was then saturated with water for 48 h [19]. The cylinder was placed in a setup designed to maintain a constant water layer above the soil surface, ensuring uniform flow. Ksat was calculated using Equation (1).
K s a t = V × L t × H × A
where V is the volume of water collected over two hours in cm3, L is the length of the cylinder (20 cm), t is the time (2 h), H is the depth of soil in the permeameter (cm), and A is the area of the permeameter (95 cm2).
The known-volume cylinder method was used to determine the bulk density (ρb), volumetric moisture content (θV), gravimetric moisture content (θg), porosity (ft), and aeration (A). A cylinder was introduced to a depth of 20 cm using a 404.02 undisturbed soil auger with 2″ × 2″ cylinders (AMS, Inc., American Falls, ID, USA). The mass of the moist soil was then determined, and the sample was oven-dried at 105 °C for 48 h until it reached a constant weight. Once dry, the mass of the dry soil was determined. Using these values and the particle density (ρs), obtained using the pycnometer method, the mass–volume relationships were calculated according to the equations shown in Table 1.
The dry weighted mean diameter (MWD), dry geometric mean diameter (GMD), and structural coefficient (Ks) were calculated following the method used by Ćirić et al. [20], where 500 g of dry soil was sieved through screens with openings of 10, 5, 3, 2, 1, 0.5, and 0.25 mm. The amount of soil collected on each sieve was then weighed according to the eight aggregate size groups within the sieves.

2.3. Statistical Analysis

A descriptive statistical analysis and a normality test were conducted on the data using the Kolmogorov–Smirnov goodness-of-fit test. The coefficient of variation (CV) was calculated according to Warrick and Nielsen [21], where CVs of less than 12% indicate low variability, CVs between 12% and 60% indicate medium variability, and CVs greater than 60% indicate high variability. An analysis of variance (ANOVA) was conducted to compare different soil cover types in the area and assess their impact on the soil’s physical properties.
In the geostatistical study, the theoretical model that best fit the semivariogram was selected. The spatial dependence level (SDL) was determined according to Cambardella et al. [22], using the relationship between the plateau and nugget effect [C0/(C + C0)], such that it is strong when it is less than 0.25, moderate between 0.25 and 0.75, and weak when it is greater than 0.75. The spatial autocorrelation of the parameters was analyzed using the theory of regionalized variables, in which a data set was fitted to a theoretical semivariogram model γ(h), defined by Equation (2).
γ ( h ) = 1 2 N ( h ) i = 1 n ( h ) Z ( X i ) Z X i + h 2
where γ(h) represents semivariance, N(h) represents the number of pairs of points separated by a distance h, Z(Xi) represents the attribute value at location Xi, and Z(Xi + h) represents the attribute value at a distance h from location Xi + h.
The interpolation method was selected based on the lowest standard error obtained by comparing the Kriging and inverse distance squared (IDW) methods, using Leave-One-Out Cross-Validation (LOOCV) to evaluate how well each method predicted soil physical properties. The relationship between the evaluated soil physical parameters was determined using Pearson’s correlation. The normality test and ANOVA were performed using SAS OnDemand for Academics 9.4M8 (SAS Institute Inc., Cary, NC, USA). Semivariograms were created with GS+ 10.0 software (Gamma Design Software, Plainwell, MI, USA). Maps, SHapley Additive exPlanations (SHAP) values, and figures were generated using the NumPy 2.3.1, Matplotlib 3.10.3, Seaborn 0.13.2, Shapely 2.2.1, pandas 2.3.1, GeoPandas 1.1.1, PyKrige 1.7.2, Shap 0.48.0, and SciPy (Pearsonr) libraries within the Visual Studio Code 1.98.2 environment, using Python 3.11, an open-source programming language.

3. Results

3.1. Comparison of Vegetation Covers

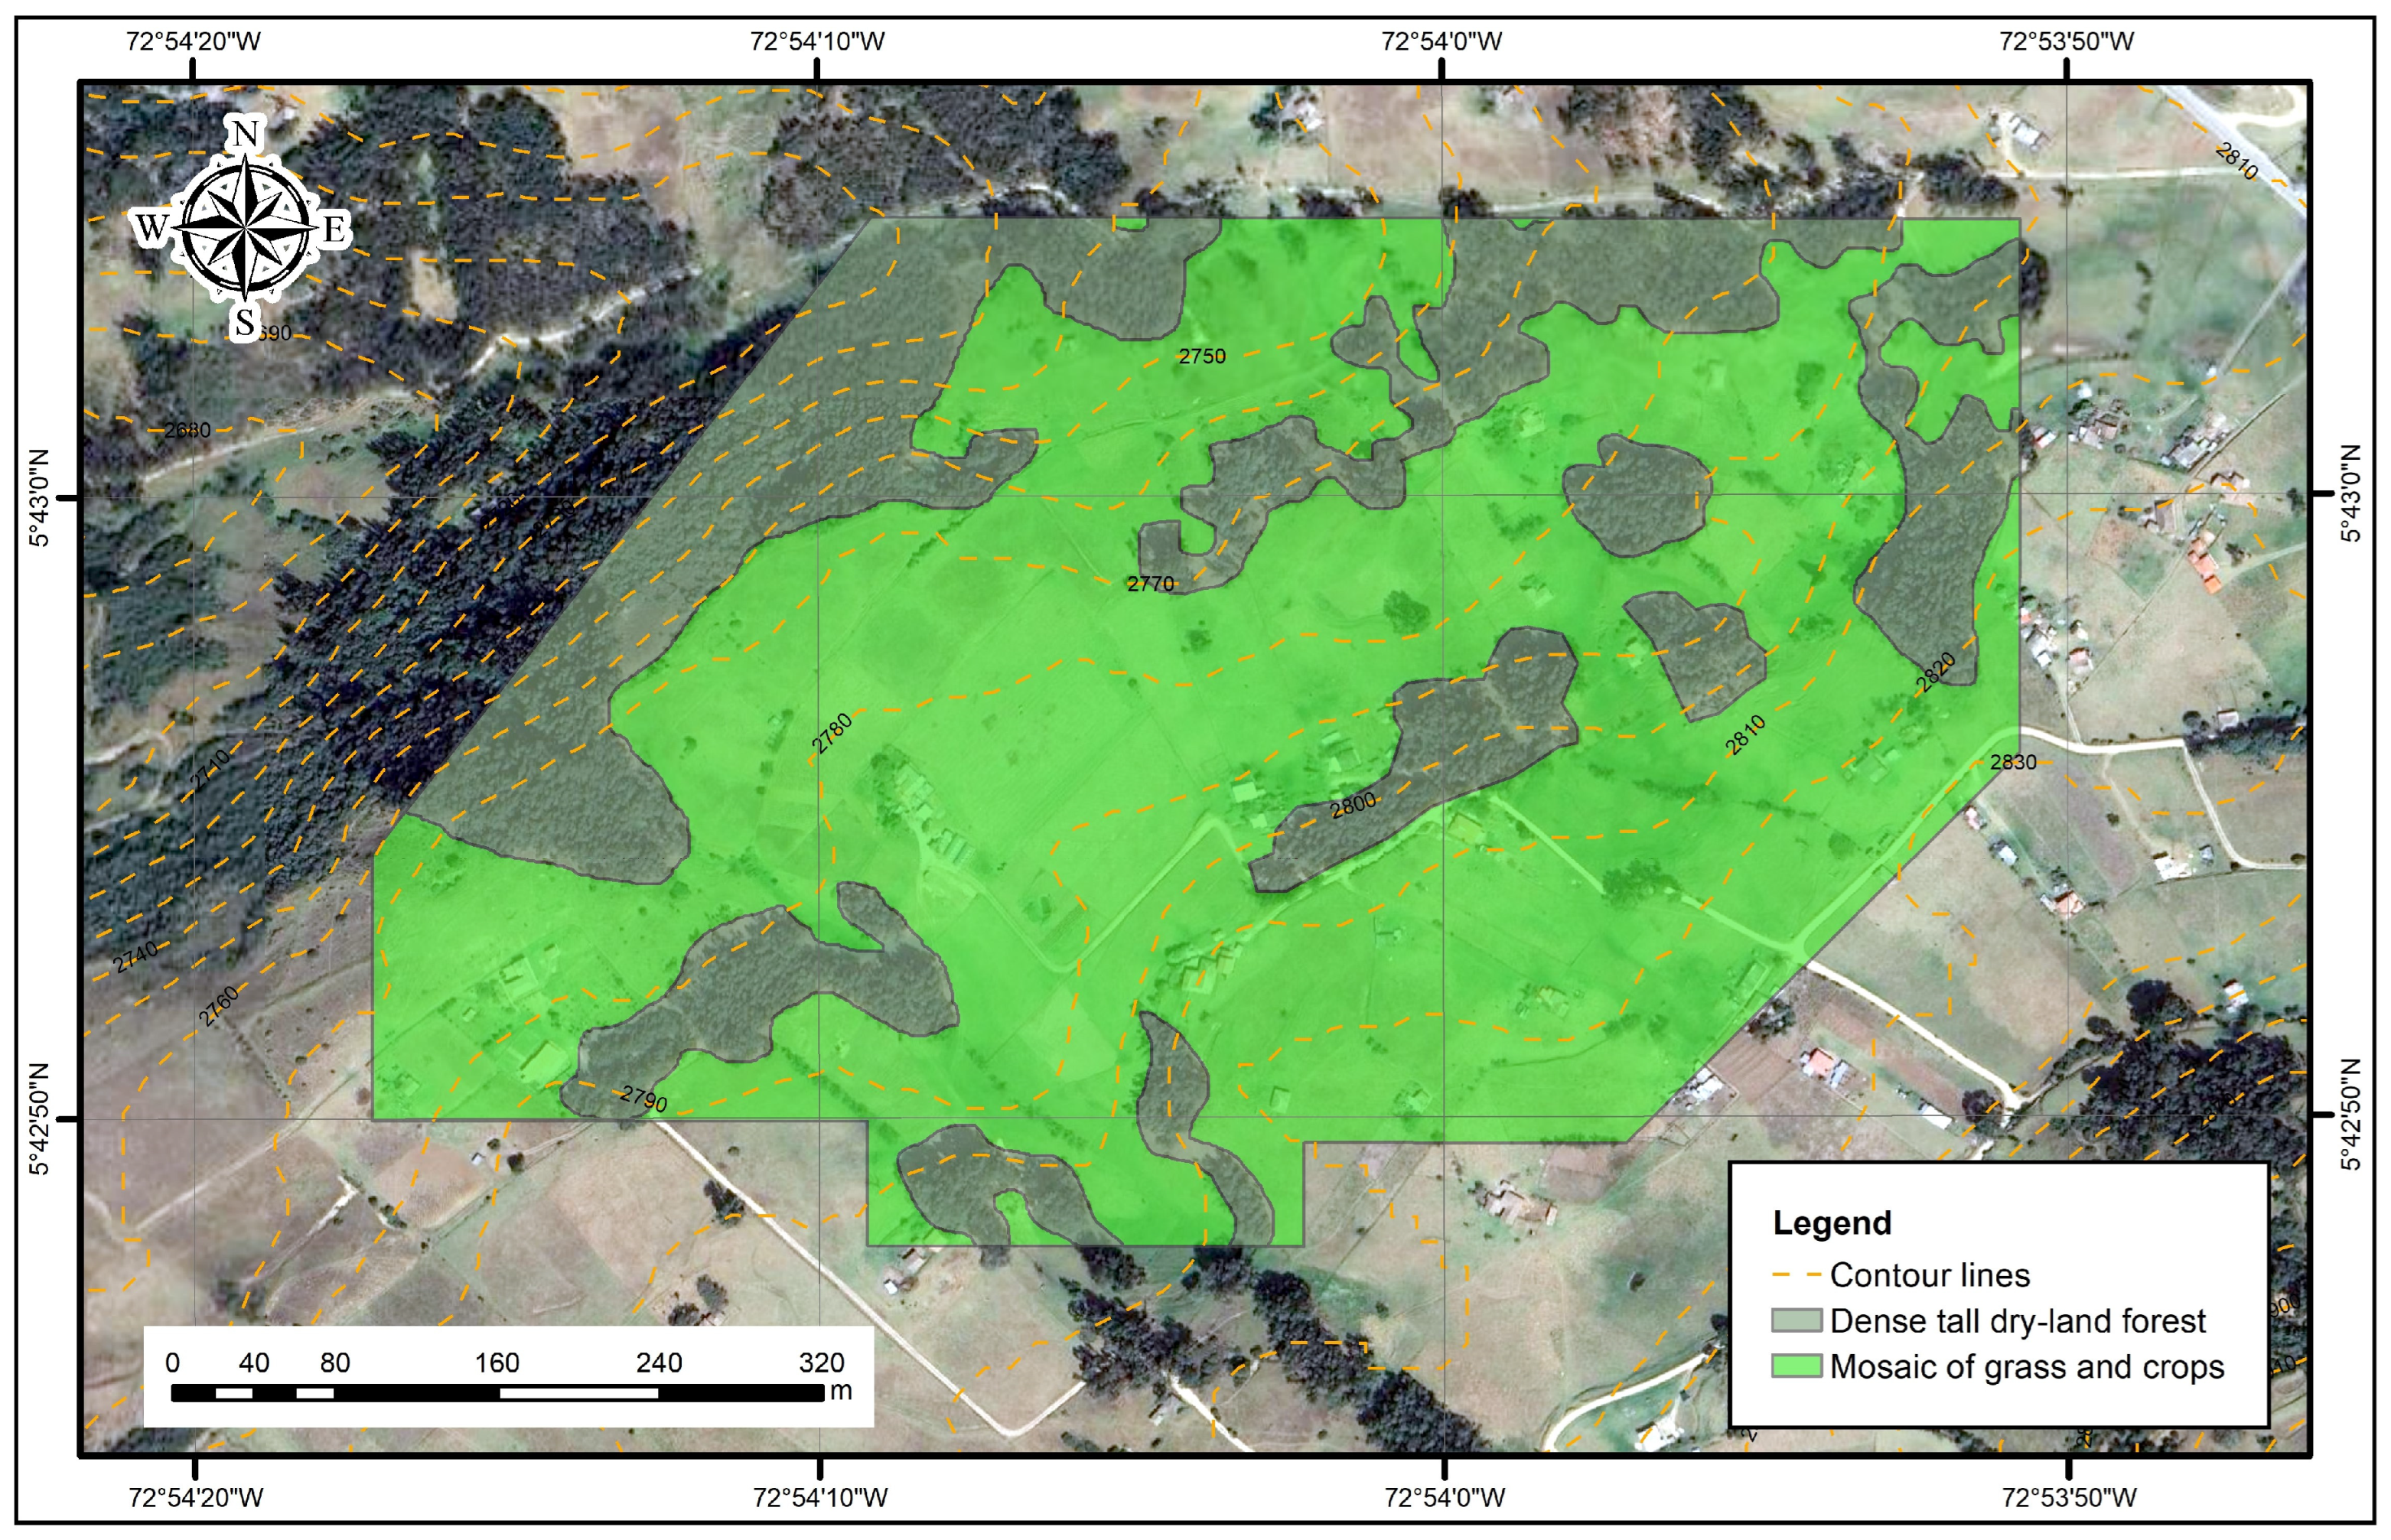
The grassland–crop mosaic covers 31.1% (8.8 ha) of the study area and is the most significant land cover type. It is followed by a dense terra firme forest, which spans 8.2 ha (28.1%), mainly consisting of Eucalyptus globulus forests of varying ages. In some areas, these forests are harvested for logs used in nearby coal mines. The weedy grassland accounts for 18.3%, and the crop mosaic covers 21.1%, together making up almost the entire area. The only other significant land cover is the discontinuous urban fabric, which covers 0.7 ha, or 2.4% of the total area (Figure 2). The vegetation cover map (Figure 2) indicates that the northwestern part of the area has a higher concentration of terra firme dense forest, primarily eucalyptus stands, on slopes with gradients ranging from 20% to 50%. In the northeastern part, a mix of eucalyptus stands, weedy pastures, and a mosaic of pastures and crops is found, with slopes ranging from 4% to 20%. The south–central and southeastern areas are mainly composed of a mosaic of pastures, crops, and weedy pastures, with small patches of eucalyptus stands. Slopes here also range between 4% and 20%. The southwestern part, primarily covered by a mosaic of crops, and the central–western area have the lowest slopes, ranging from 0.2% to 18%.
The ANOVA did not show significant differences between the different vegetation covers in the area for any of the soil physical properties (Table 2).

3.2. Descriptive Statistical Analysis

According to the Kolmogorov–Smirnov normality test, the bulk density (ρb) and the particle density (ρs) follow a normal distribution (Table 3), indicating that the average and median are similar and that there is a central tendency in the distribution of the data.
The volumetric moisture content (θV) and gravimetric moisture content (θg) exhibited a normal distribution, with mean values close to the medians. In contrast, porosity exhibited a non-normal distribution.
The MWD and GMD variables had CVs of 31.5% and 38.7%, respectively, considered medium, indicating heterogeneity caused by differences in tillage practices. The structural coefficient (Ks) had a CV of 62.9%, classified as high, indicating significant heterogeneity.

3.3. Geostatistical Analysis and Spatial Distribution of Soil Properties

3.3.1. Saturated Hydraulic Conductivity

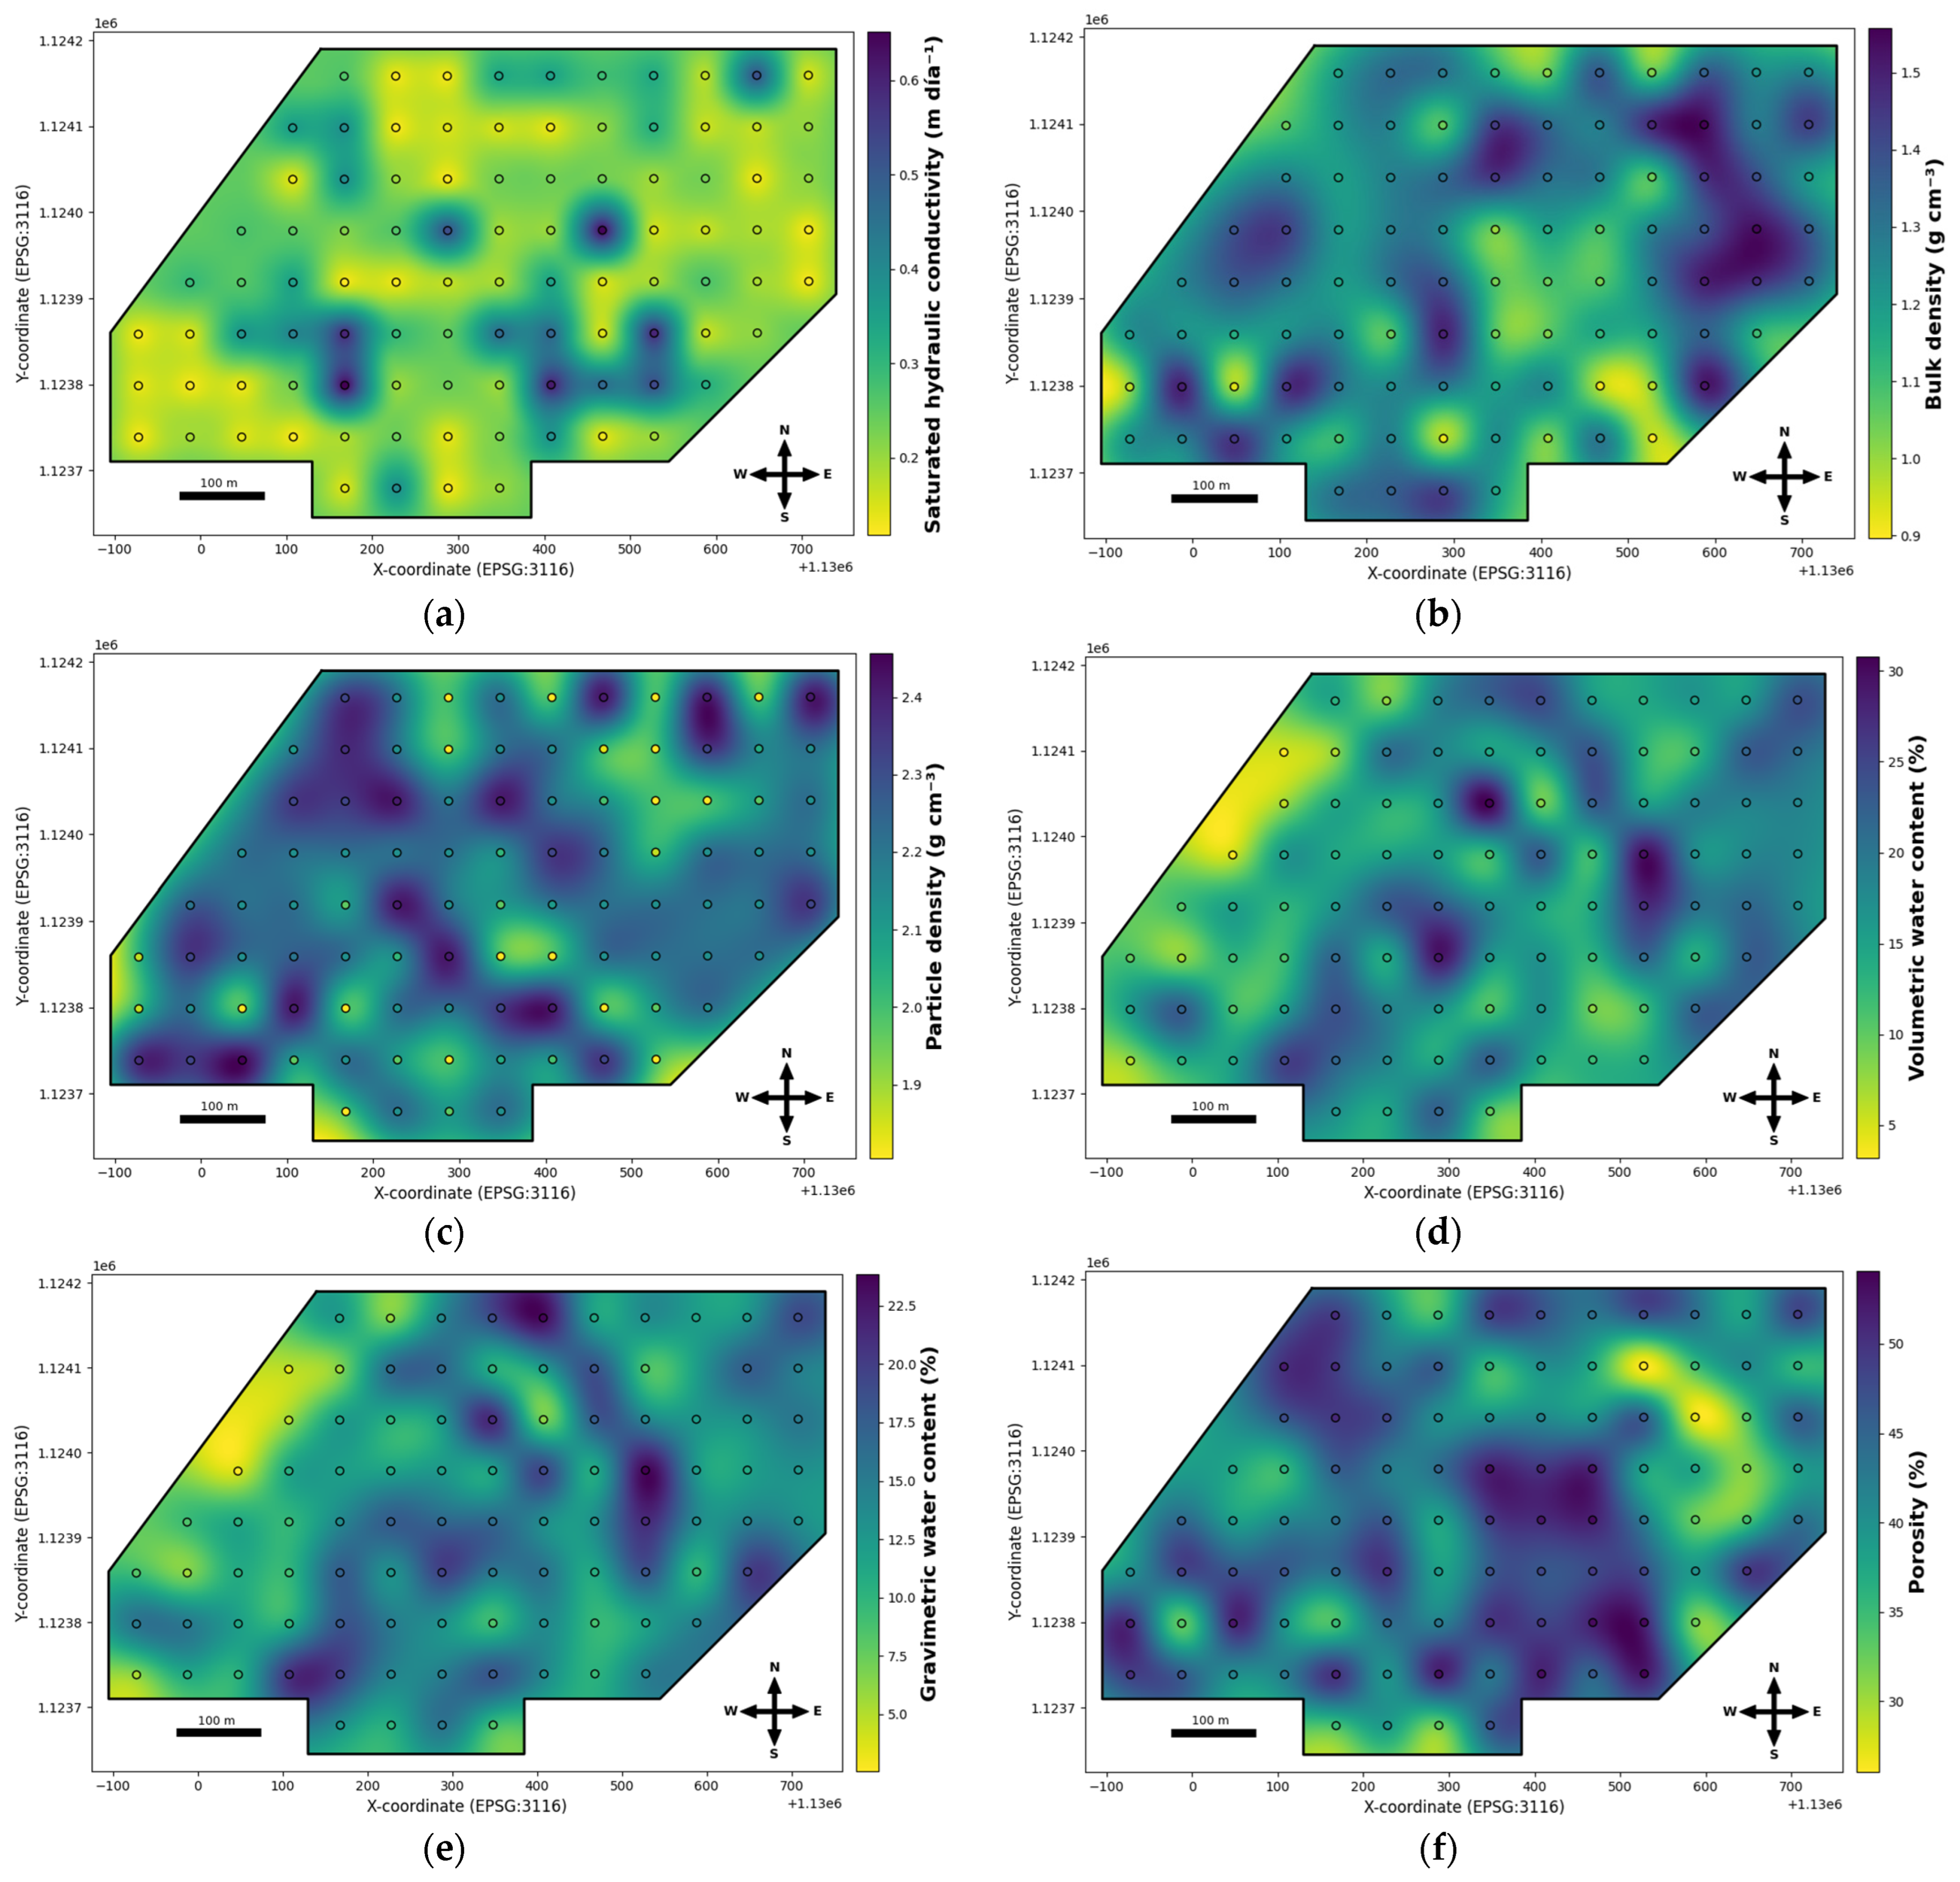
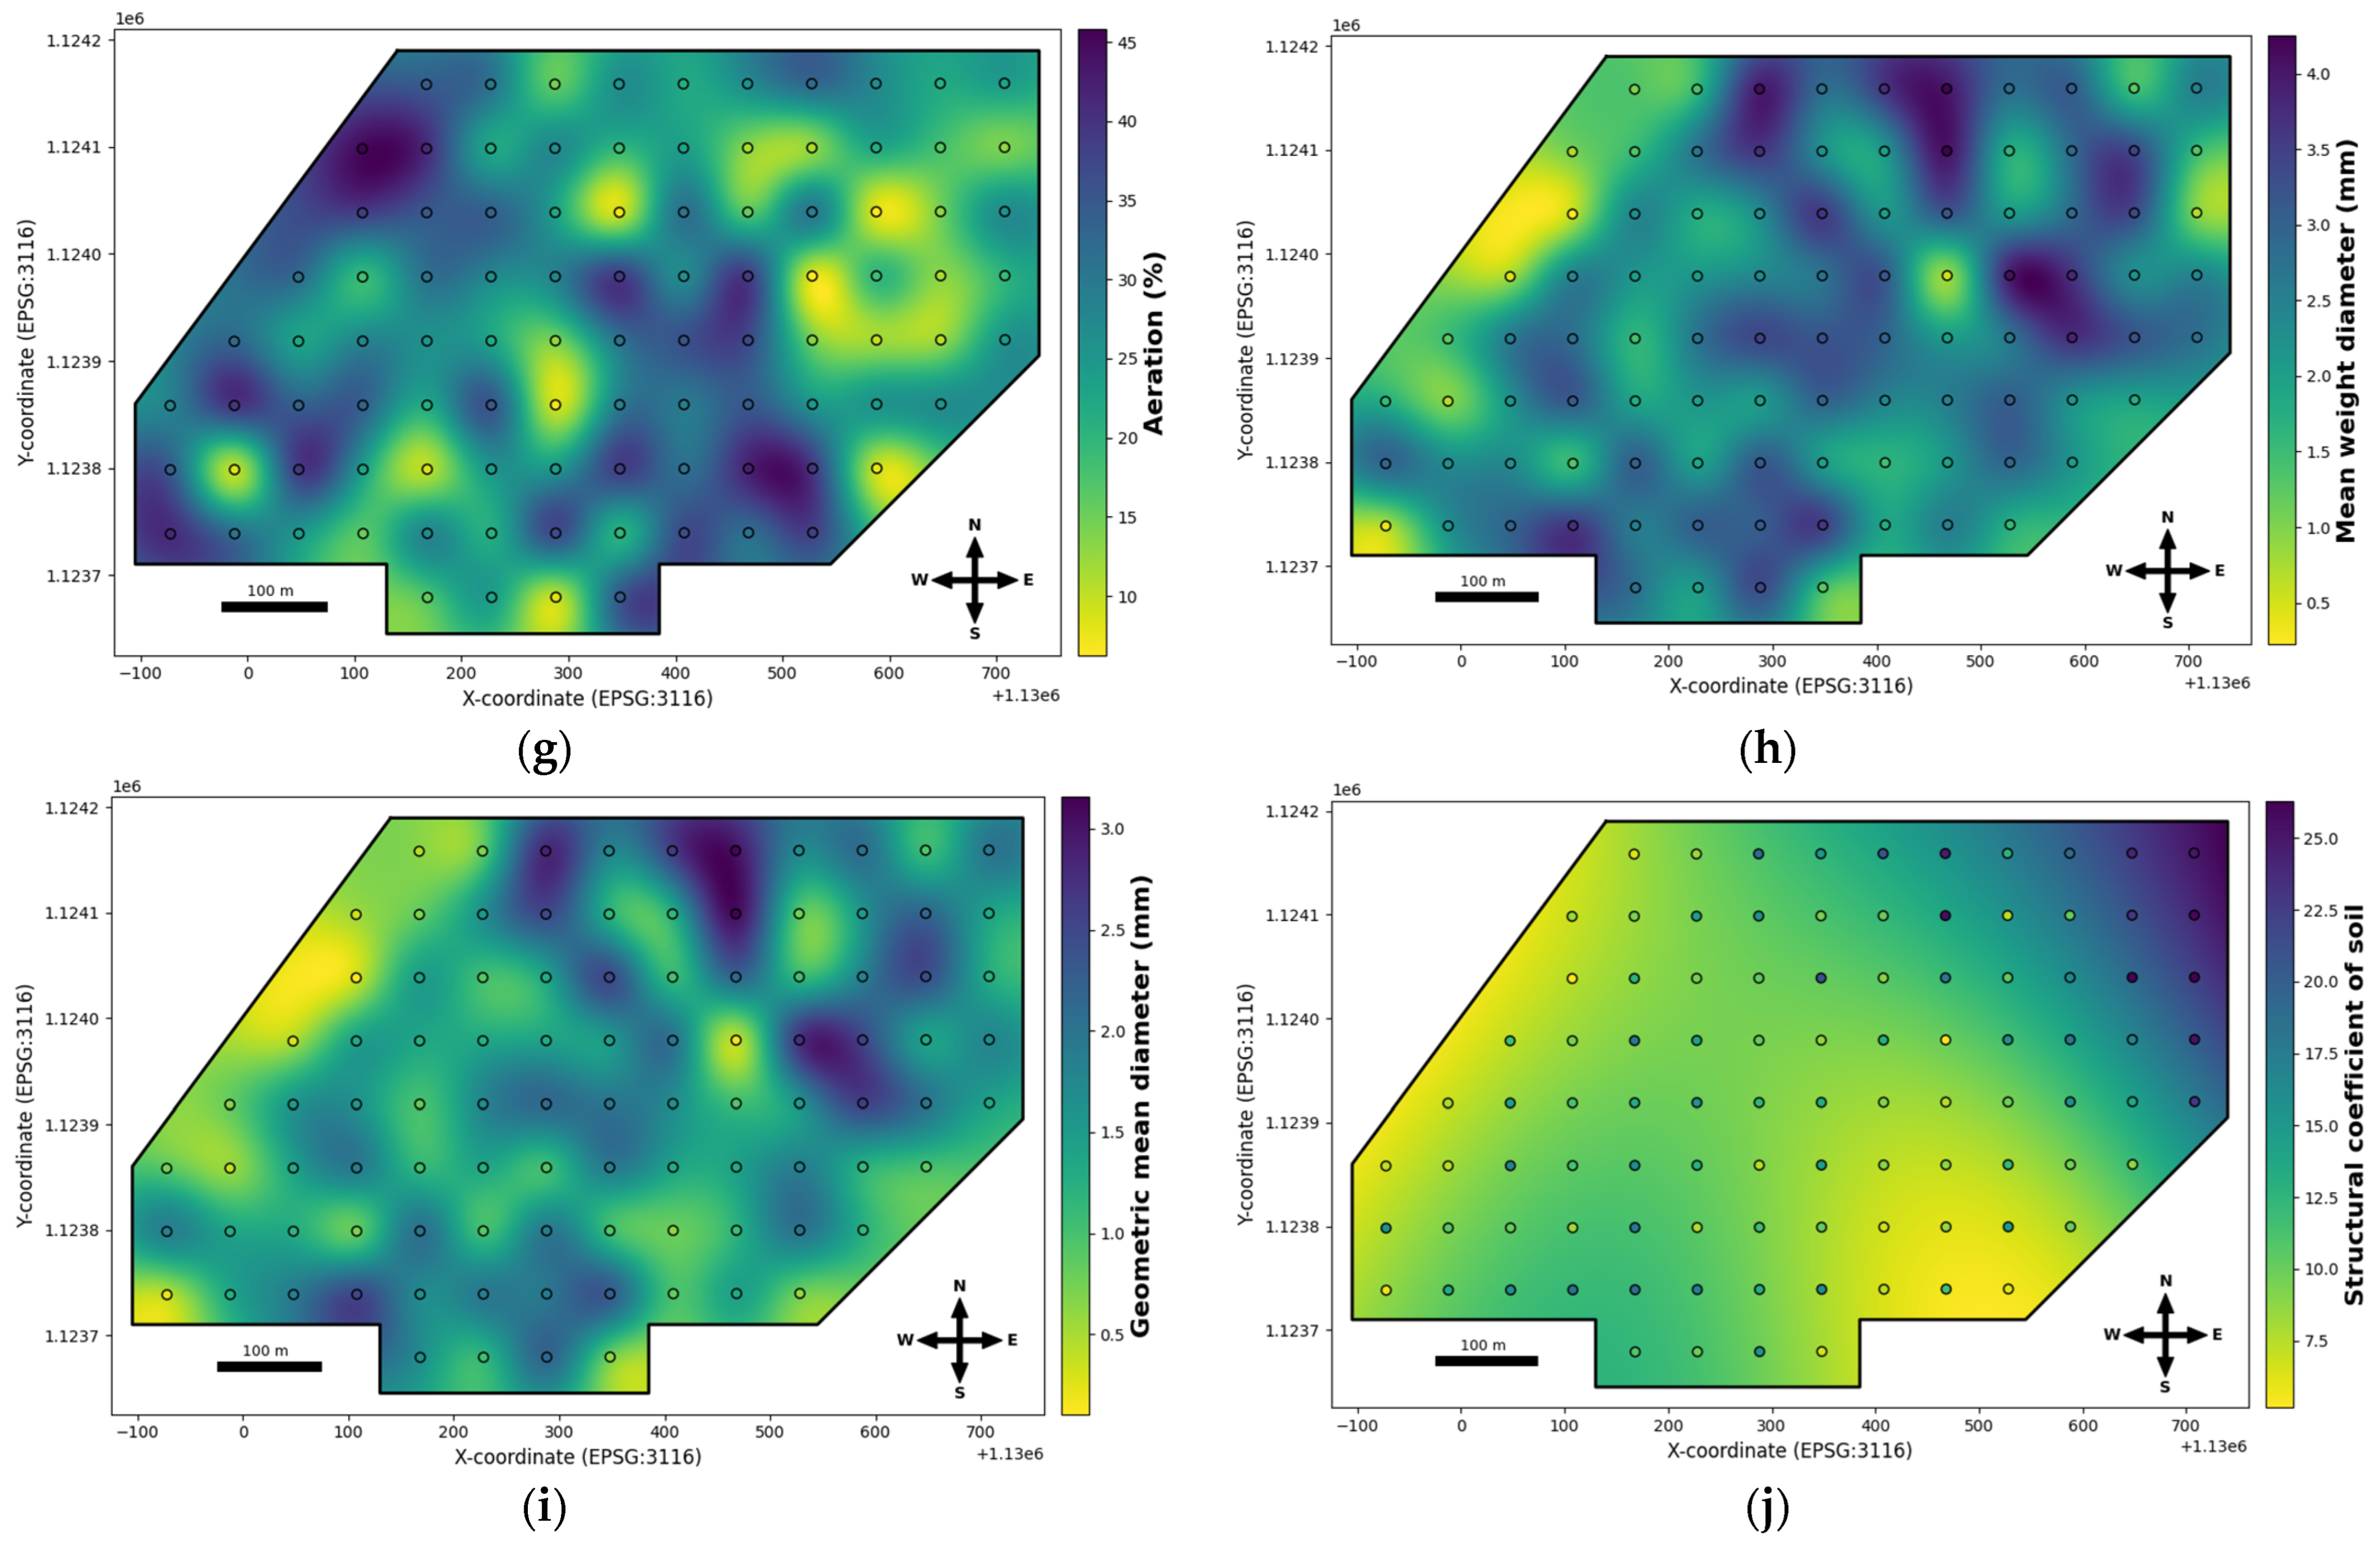
The semivariogram model that best fit Ksat was the spherical model (R2 = 0.304). The Kriging model was the best interpolant for Ksat (Table 4), although the low R2 in the semivariogram indicates that unaccounted factors (such as local heterogeneities) influence variability. Cross-validation (CV) is low for the Ksat model (8.2%), confirming moderate dispersion around the spatial distribution. In Figure 3a, the spatial distribution of Ksat is shown; the highest values are observed in the central southeast area, with averages close to 1 m day−1, while towards the southwest and the northeast regions, with a greater presence of eucalyptus trees, the lowest Ksat values are observed, ranging between 0.01 and 0.2 m day−1.

3.3.2. Bulk Density (ρb)

The semivariogram of ρb was fitted to a linear model (R2 = 0.886), which exhibits a low, near-plateau nugget effect, indicating weak spatial dependence. The extensive range (379 m) suggests that bulk density varies slightly across space. The IDW interpolation model (R2 = 0.726) outperformed the Kriging model, possibly due to the dominant linearity (Table 4). The CV for the ρb model is minimal (8.3%), supporting a homogeneous distribution, although the low GDE implies limitations for accurate geostatistical predictions.
Figure 3b shows a focus in the south–central zone where low ρb values (1.09–1.16 g cm−3) are present, and where grass–crop mosaic cover predominates.

3.3.3. Particle Density (ρs)

The ρs was fitted to a linear semivariogram model (R2 = 0.398) with a minimum SDL and a negative regression coefficient for the IDW interpolation model, indicating that it is a random variable that does not exhibit clear spatial patterns. This is reflected in a pure nugget effect, indicating no autocorrelation with any other nearby point.
Figure 3c shows a homogeneous focus in the southeastern zone, with values ranging between 2.2 and 2.3 g cm−3, similar to the overall average for the area. This indicates soils derived from volcanic ash with high organic matter contents, dominated by mosaic covers of grasses and crops. Towards the northwest, an area with densities above 2.4 g cm−3 is found, mainly containing eucalyptus forests.

3.3.4. Volumetric Moisture Content (θV) and Gravimetric Moisture Content (θg)

The best-fitting model for the θV semivariogram was the exponential (R2 = 0.828), characterized by a high nugget effect and a moderate SDL. The interpolation method with the highest fit was the IDW method. Cross-validation of the model confirmed moderate dispersion, typical of properties related to soil moisture, because this parameter is sensitive to external factors such as precipitation. The θg was fitted to an exponential semivariogram model with a low nugget effect, a high plateau indicating considerable variability, a strong SDL, and a range of 154 m. Figure 3d shows that the lowest θV values are found in the northwest zone (7.6% to 12.3%), which are indeed low, as agronomically, values below 30% indicate a soil moisture content deficit. Likewise, the θg model (Figure 3e) showed low values in the northwest zone of the map, similar to the θV distribution.

3.3.5. Total Porosity (ft)

The exponential model had the best fit to the porosity semivariogram (R2 = 0.914), with a low nugget effect relative to the plateau and a strong SDL (Table 4). The range suggests defined spatial patterns, possibly linked to stratigraphy or soil management. The interpolation model based on the IDW had the best fit, and the R2 of the semivariogram supports the model’s robustness. The cross-validation is considered moderate (14.8%), indicating controlled spatial variability, which is consistent with the high SDL, allowing for reliable interpolations useful for agronomic zoning.
The porosity distribution map (Figure 3f) showed the highest values in the center, southeast, and northwest regions, with percentages ranging from 52% to 62%. In contrast, the lowest values were found in the northeast and southwest areas, with percentages ranging from 26% to 44.5%. Overall, the average porosity recorded in the study area is high, and it is even higher in the soil under the mosaic crop cover, with no significant differences compared to other covers, such as eucalyptus forests and weedy pastures.

3.3.6. Aeration (A)

Similarly to the behavior of ft, the semivariogram for soil aeration was fitted to an exponential model (R2 = 0.914), characterized by a low nugget effect, an intermediate plateau, and strong spatial dependence, indicating structured variability. The IDW interpolation model demonstrated a good fit, indicating that this variable can be mapped with high accuracy. The cross-validation value of 19.4% is considered high, suggesting that it is a predictable variable; however, it remains sensitive to local changes in compaction and texture. Figure 3g shows that the highest aeration values are found in foci in the northwest and southeast, with values exceeding 35%. In contrast, a large area to the east has values below 25% aeration.

3.3.7. Mean Weight Diameter (MWD) and Geometric Mean Diameter (GMD)

The semivariogram was fitted to a linear model (R2 = 0.896) for MWD, exhibiting moderate nugget, plateau, and SDL effects. The wide range observed, along with the linear model, suggests that the distribution of soil aggregates shows weak spatial trends. The best-fitting interpolation model was IDW, consistent with the linear nature of the semivariogram, while the VC is low (8.8%), confirming stable soil aggregate size distribution; however, the proportion of the nugget effect limits geostatistical interpolation, so for MWD, sampling at smaller distances should be performed for more accurate mapping. Similarly to MWD, the GMD semivariogram was fitted to a linear model, showing a low nugget effect along with moderate plateau and SDL, where 67% of the variability is structured. The linear model and the wide range suggest that GMD is controlled by large-scale processes, such as the parent material, which influences aggregate formation. The IDW interpolation for GMD provided an acceptable fit, enabling more precise mapping of its distribution. Additionally, GMD is considered spatially more homogeneous than MDW due to its smaller nugget effect.
The lowest values for MWD and GMD are observed in the northwest and southeast (Figure 3h). In the northwestern area, which is almost entirely covered by eucalyptus forests, MWD values range from 0.48 to 2.2 mm, and GMD values range from 0.38 to 1.5 mm, indicating that eucalyptus forests negatively influence these soils when the slope percentage exceeds 15% (Figure 3i). This effect contrasts with the northeastern area, where the same tree species is present but slopes are less than 15%, and higher values are recorded for MWD and GMD, ranging from 1.8 to 3.3 mm and 2.6 to 4.1 mm, respectively.

3.3.8. Structural Coefficient (Ks)

The variable Ks showed a high nugget effect and an extremely high plateau, with a moderate SDL and a semivariogram fitting a Gaussian model (R2 = 0.989). This, along with the wide range, suggests that Ks is influenced by macroprocesses such as pedogenic factors or the accumulation of soil organic matter. Additionally, the interpolation demonstrated a good fit to the Kriging model and high cross-validation. Figure 3j presents the Ks map, where the lowest values are located in the western area, predominantly covered by eucalyptus forests, indicating the presence of more extreme diameters than average. This area has soils with poorly structured soils, characterized by Ks values less than 10. Conversely, the northeast area exhibits high Ks values that exceed the average of 17.5.

3.4. Correlation Analysis and Principal Component Analysis of Soil Physical Properties

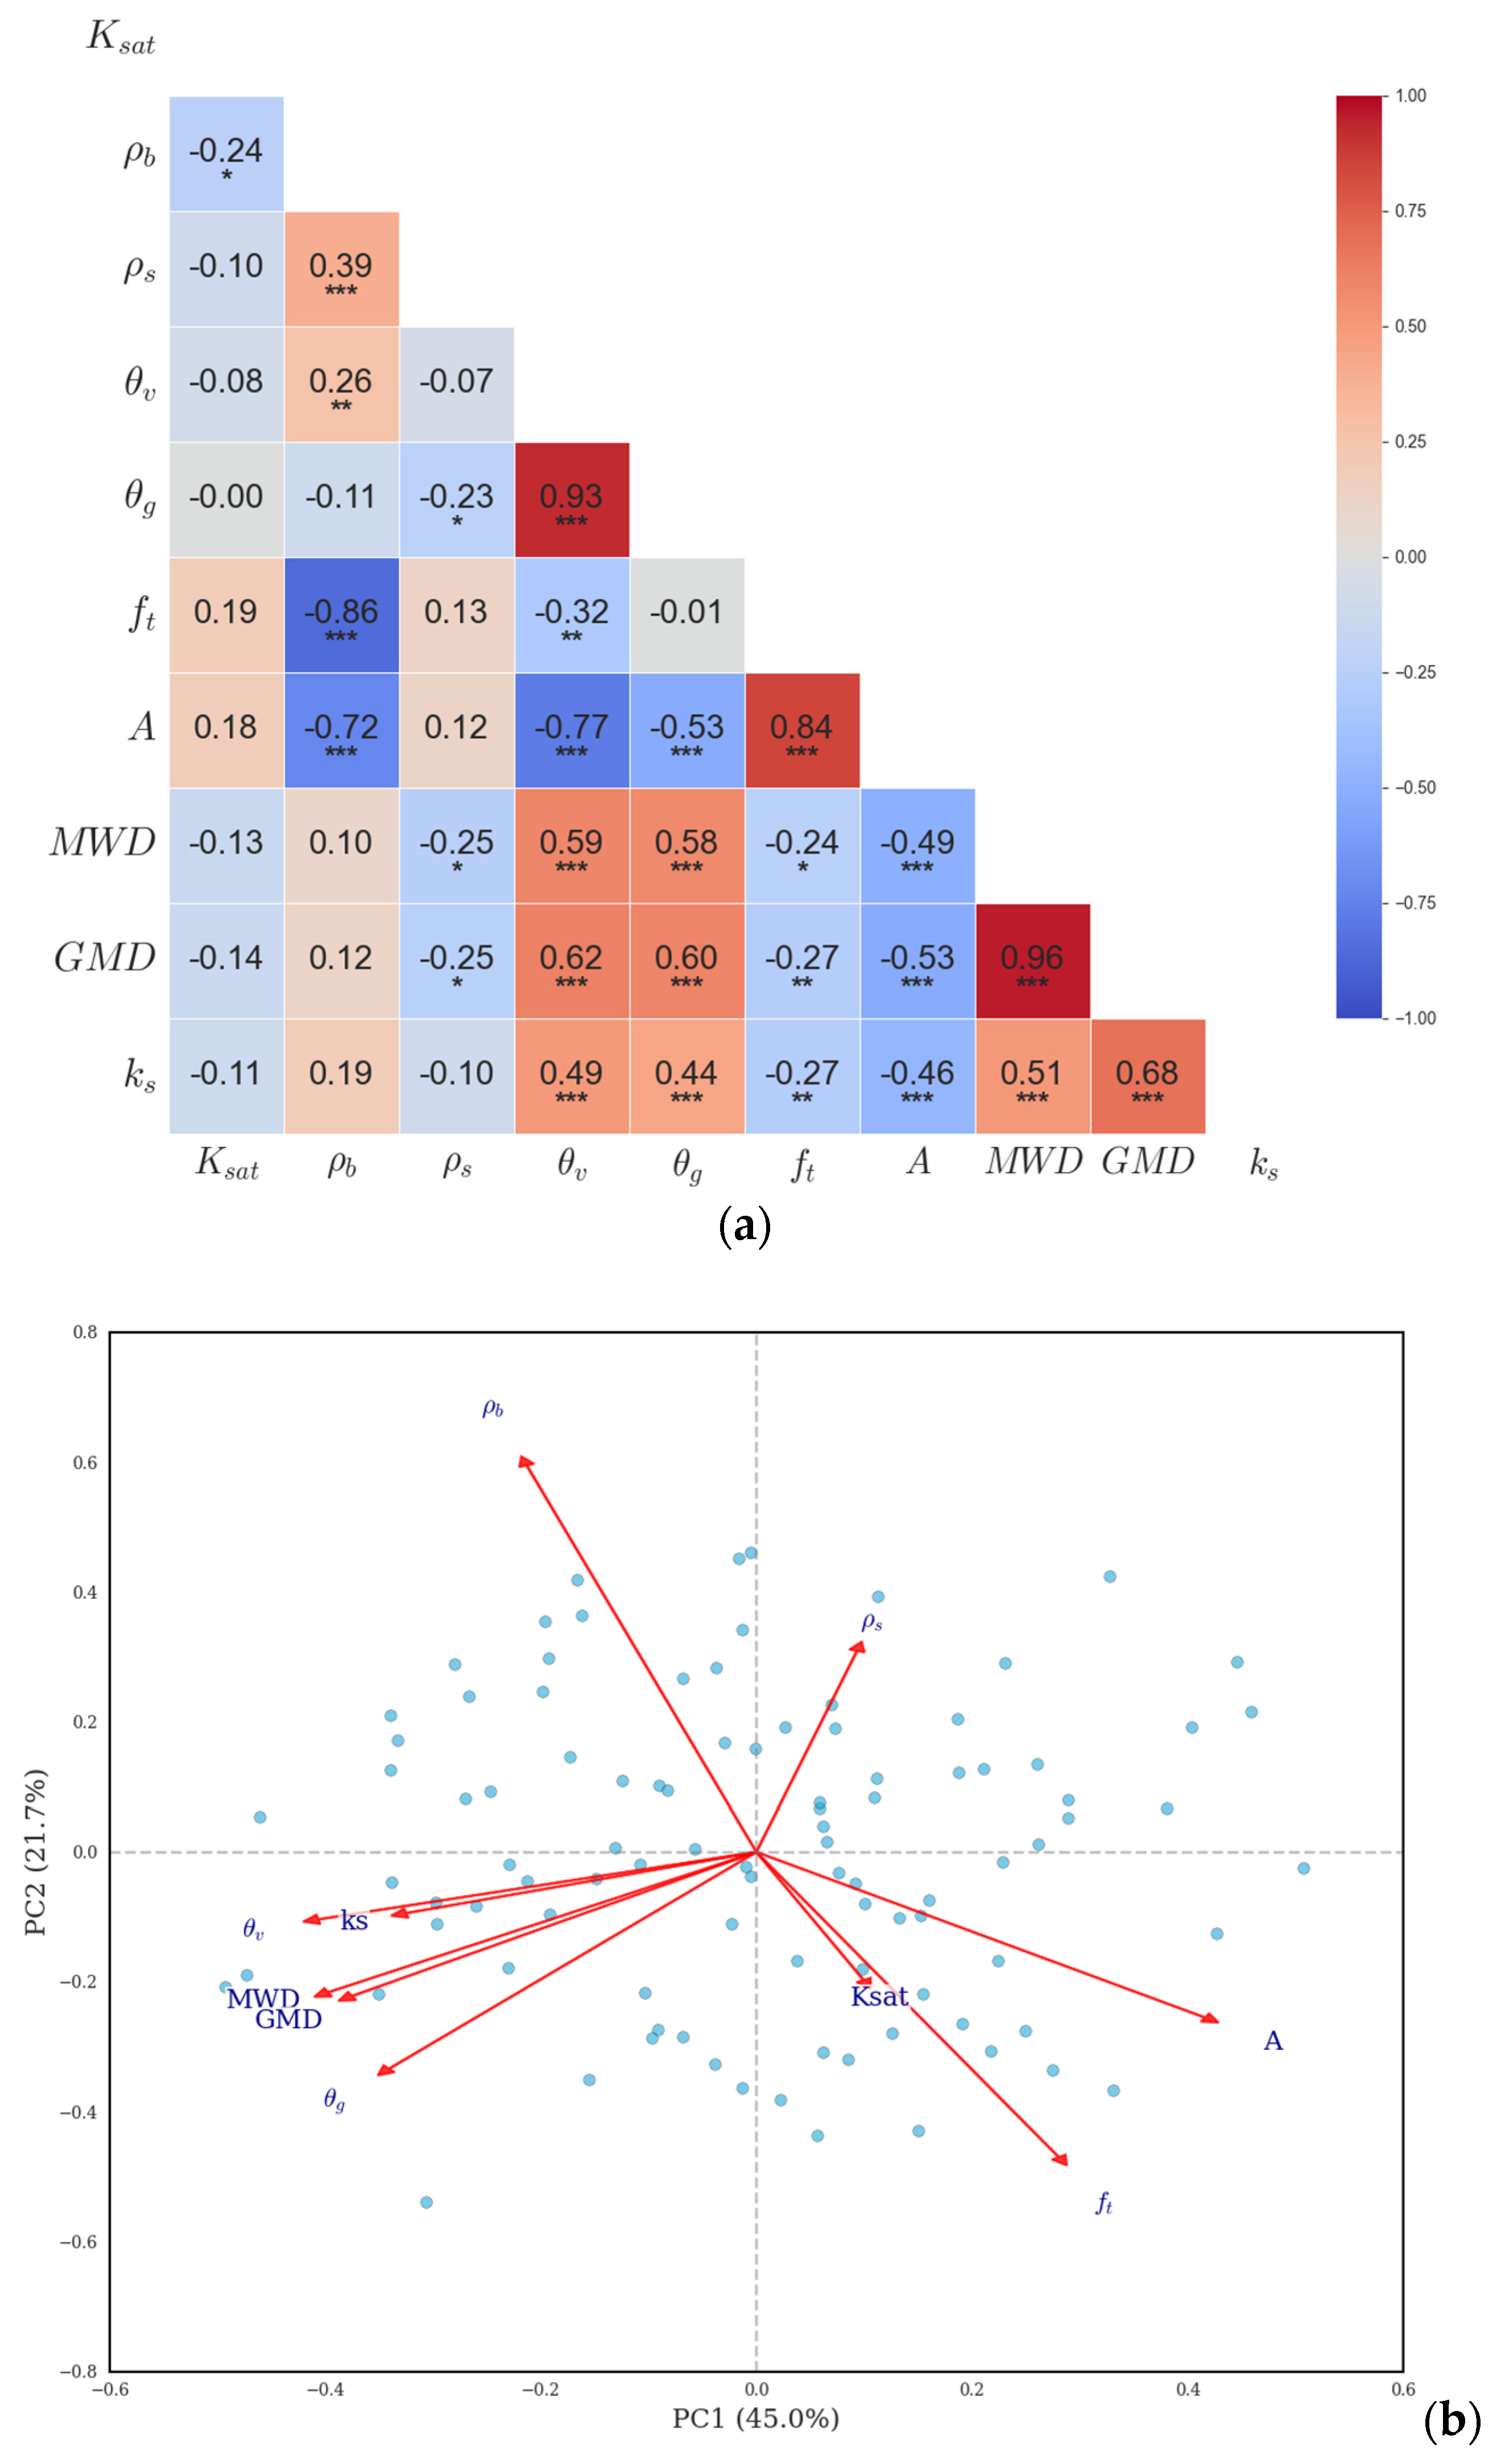
Hydraulic conductivity exhibited a weak but significant inverse relationship with bulk density (Figure 4a). Likewise, Ksat had a slight positive correlation with ft and aeration. Bulk density exhibited a strong inverse correlation with ft. Likewise, θV and θg had a high positive correlation. Aeration showed a strong inverse correlation with θV and was directly related to ft. The soil structural variables MWD and GMD have a high positive correlation with each other. Likewise, they correlated positively with θV and θg, and negatively with ft and aeration. A negative correlation was observed between ρs and θg.
Principal component analysis accounted for 87% of the total variability, with four components (Figure 4b). The first principal component (PC) explained that 44.98% of the total variance, PC2 (21.74%), was mainly influenced by bulk density. PC3 (10.53%) was primarily associated with true density, while PC4 (9.75%) reflected the positive effects of saturated hydraulic conductivity and volumetric moisture.

3.5. SHAP Values Analysis of Soil Physical Properties

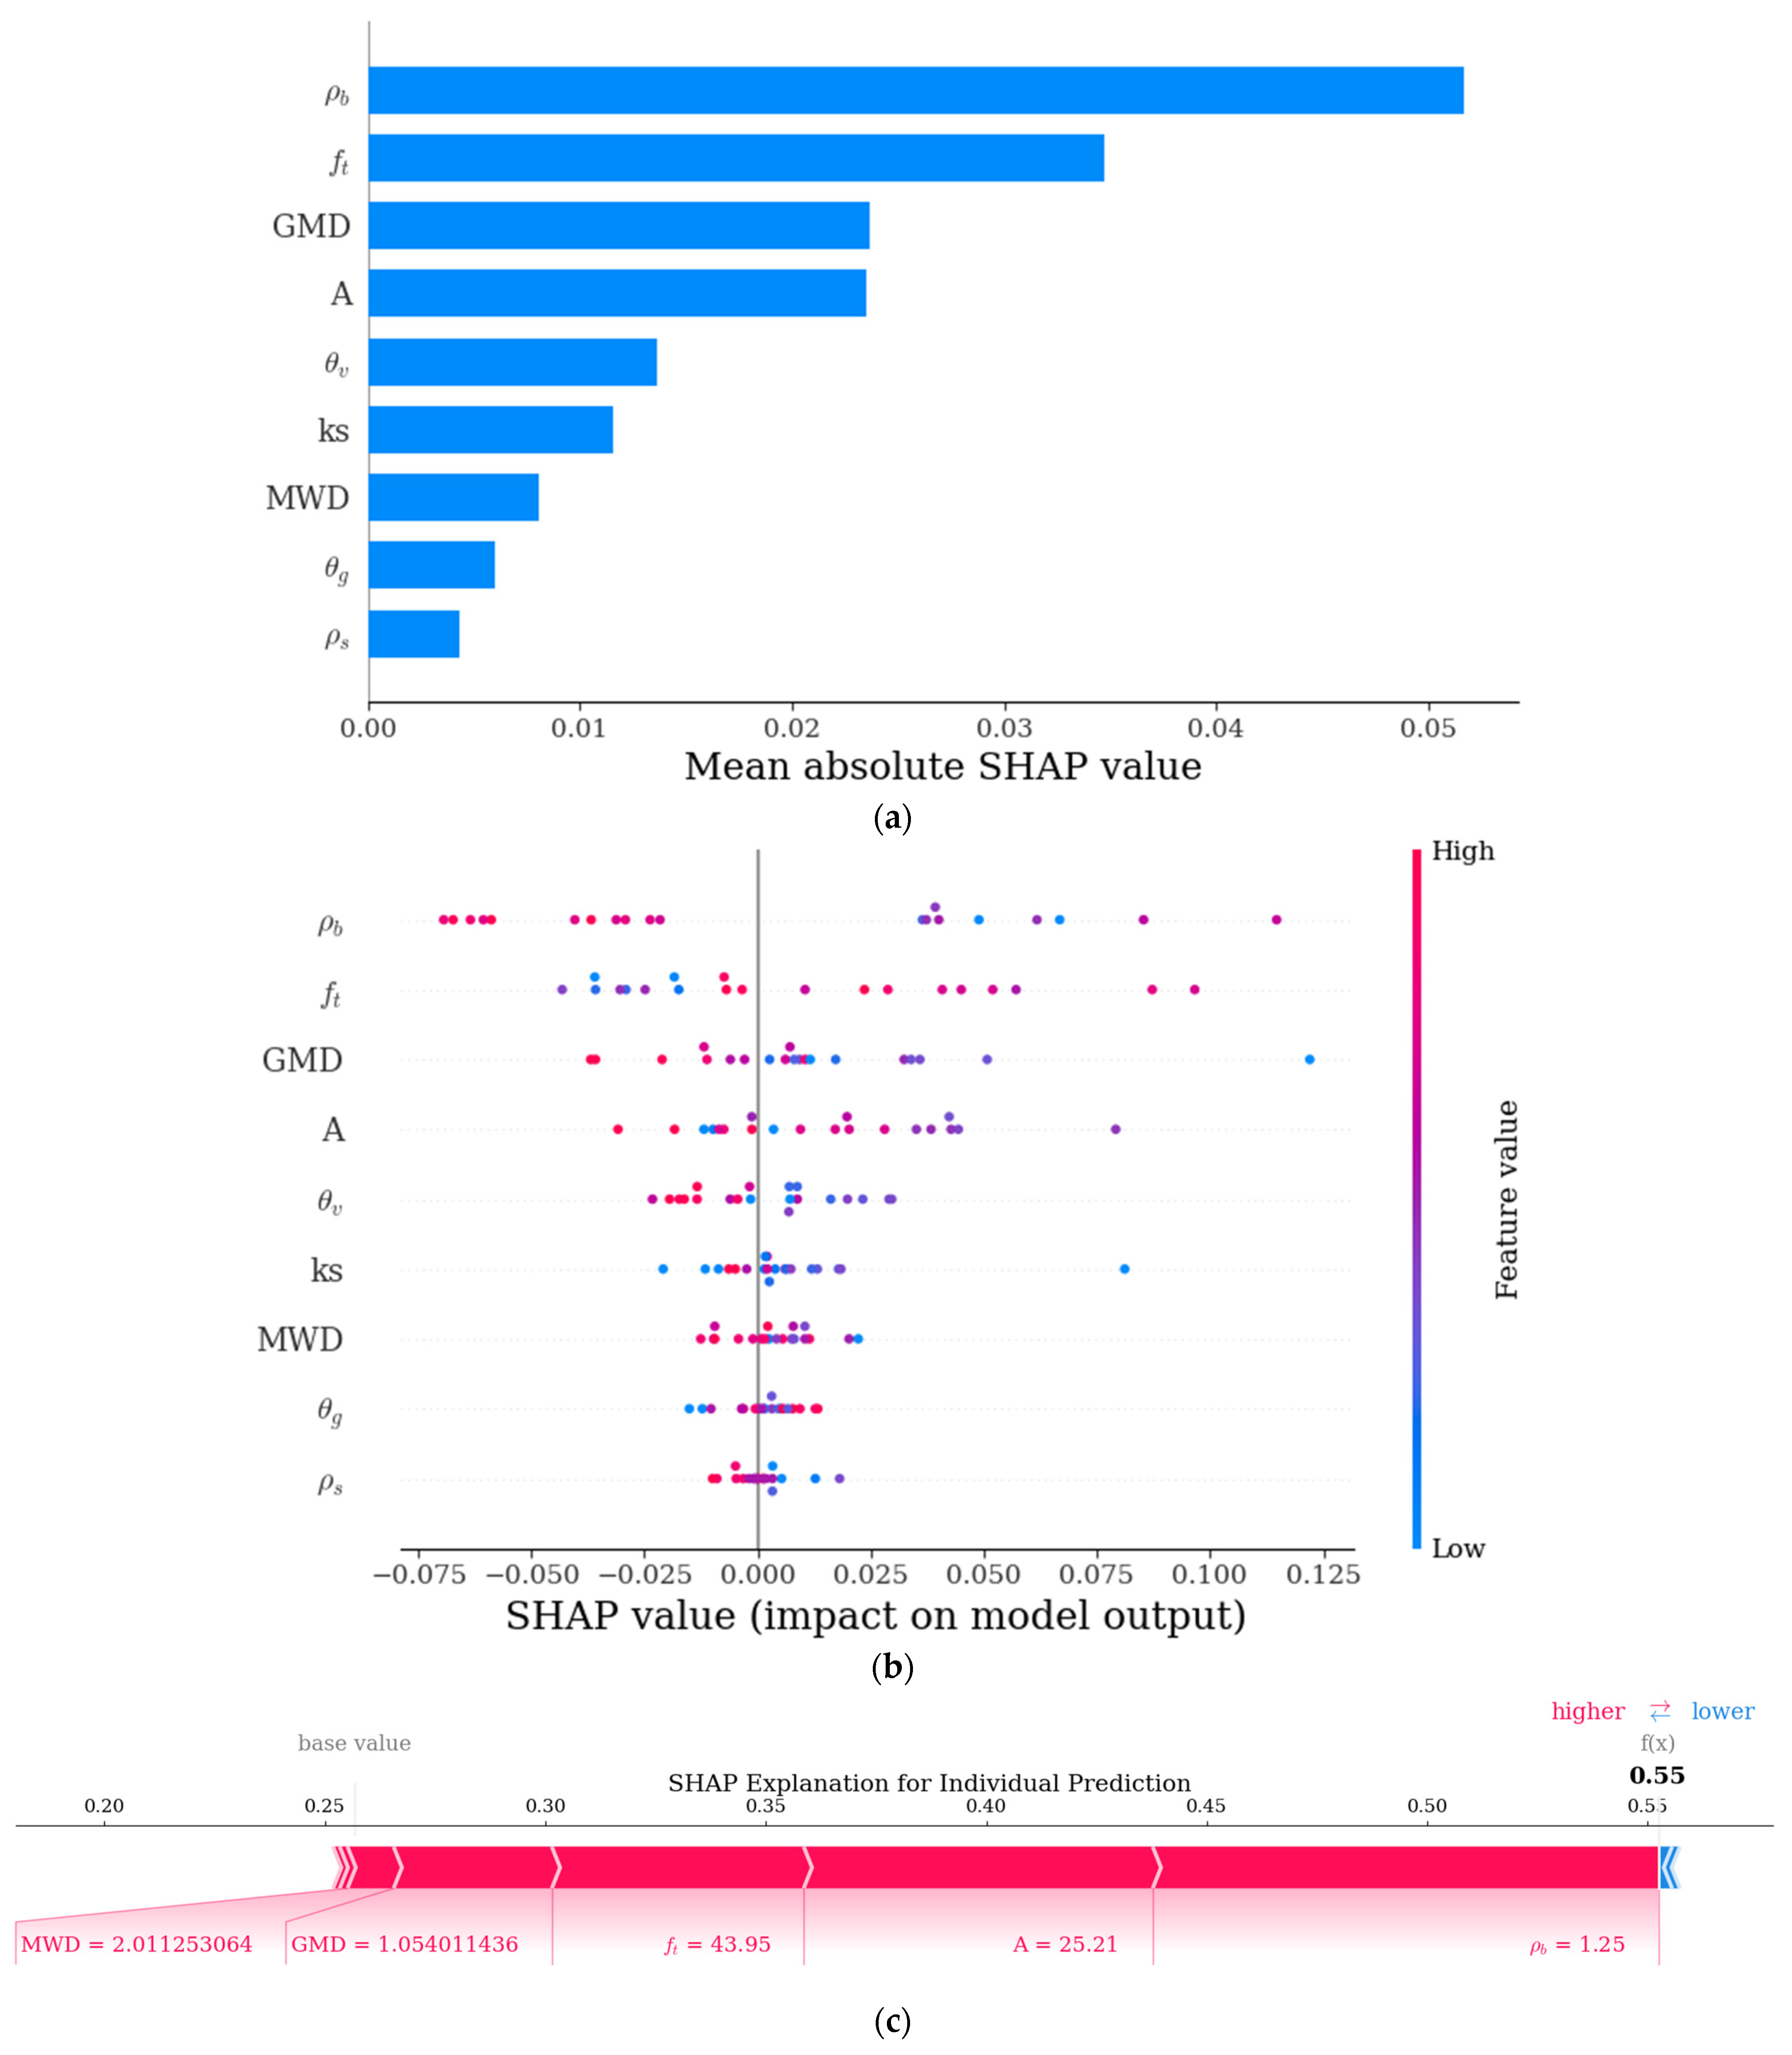
SHAP value analysis showed that ρb and ft are the most influential variables in Ksat, with relative contributions of 0.052 and 0.035, respectively (Figure 5a). Similarly, ρb displayed an inverse relationship with Ksat. Conversely, ft had a directly proportional effect on Ksat. GMD and aeration also exhibited a moderate influence (SHAP ~0.023). On the other hand, ρb was the variable with the lowest impact on Ksat (Figure 5b). In Figure 5c, it is apparent that none of the evaluated variables have a negative influence on the hydraulic conductivity values.

4. Discussion

4.1. Comparison of Vegetation Covers and Descriptive Statistics

The lack of significant differences between the vegetation covers suggests that the impacts of eucalyptus are not immediate and may be hidden by factors inherent to the soil. These factors create resilience in the physical properties against changes in vegetation cover [23]. In this context, Kooch et al. [24], after changing the vegetation cover for 30 years, found that soil quality did not improve. Similarly, the effect of plantations likely depends on the time of establishment and the ground conditions.
Ksat did not exhibit normality and had a high CV of 104.9% (Table 3), consistent with the results of Godoy et al. [25] and Soares et al. [26], who reported values of 122% and 99.4%, respectively, in Entisols of Brazil with agroforestry systems similar to those in this study. The CVs present an average value of 11.5% and 5.85% for ρb and ρs, respectively, which is similar to studies carried out in the same region (Chicamocha River Valley), where the CVs of the bulk densities are less than 16%. These CV values for ρs are low according to Warrick and Nielsen [21]; this is attributed to the relationship this property has with the genesis and formation of the soil. Similar CV values for density (8%) were obtained by Guatibonza et al. [19], which suggests that the different land uses in the study area have a greater impact on the ρb, while the ρs is more stable. In this regard, Moratelli et al. [27] mention that the ρb is affected by factors such as organic matter content, soil structure, and compaction, which are associated with soil management practices.
The skewness coefficients were 0.286 and 0.188, respectively, indicating a slight positive skewness. The kurtosis is near zero, suggesting the data is centered around the mean. The dispersion is moderate, as shown by the CV (Table 3), suggesting significant variability in soil water retention, a natural variation in moisture content typical of heterogeneous soils, and is linked with differences in soil texture and management practices [28].
Porosity showed a non-normal distribution, with a CV of 14.7%, close to the 15.8% reported by Guatibonza et al. [19]. Similarly, this variable exhibited negative skewness, with less pronounced tails and a platykurtic behavior indicated by its negative kurtosis value. Overall, the distribution suggests a lower central concentration, implying relatively homogeneous porosity, although some less porous soils contribute to the negative skewness. In this context, aeration displayed a normal distribution, with a CV of 36%, reflecting moderate variability influenced by porosity and compaction [29]. It also showed negative skewness and kurtosis, indicating a distribution slightly skewed toward higher values and flattened at the extremes. An aeration below 10% was also observed in the data, pointing to areas with potential limitations for plant root growth [30]. For MWD, negative skewness and kurtosis show a slight left tail, with fewer data points near the mean. In contrast, GMD exhibits positive skewness and negative kurtosis, characterized by a flatter right tail. Ćirić et al. [31] states that Ks is the ratio of aggregates with extreme diameters to those with average diameters, which relates to the resistance of aggregates to modification.

4.2. Geostatistical Analysis and Spatial Distribution of Soil Properties

4.2.1. Saturated Hydraulic Conductivity

The semivariogram for Ksat was characterized by a low nugget effect, indicating minimal variability at distances shorter than the sampling distance (Table 4). The plateau and range of 98 m suggest a strong SDL, indicating a dominant spatial structure over noise. In this regard, Salazar et al. [9] found that Ksat values decrease as the age of the eucalyptus plantation increases, since the maximum values were found in the first 3 years of age of the plantation (2.92 m day−1), while in soils with 32-year-old eucalyptus trees, the Ksat values were the lowest (0.001 m day−1). It is known that the presence of eucalyptus trees can reduce hydraulic conductivity by influencing various properties, such as soil water potential and water content, which are affected by soil texture, structure, particle size and distribution, and organic carbon content [32]. These plants release organic compounds that increase soil hydrophobicity, decreasing its infiltration capacity and, consequently, hydraulic conductivity [33].

4.2.2. Bulk Density (ρb) and Particle Density (ρs)

Low ρb values are associated with porous, well-aerated soils that drain efficiently and facilitate optimal root growth, thereby supporting healthy crop development. The highest ρb values are found in the northeast, an area with eucalyptus stands, grass–crop mosaics, and weedy pastures. In this context, high ρb values indicate soils that hinder crop root development due to reduced aeration and changes in hydrological functions, such as decreased water infiltration, which can lead to runoff and erosion, ultimately causing soil loss [34]. Bulk density serves as an indicator of soil compaction [35]; high values are considered those greater than 1.3 for fine-textured soils (clayey or clayey loam), 1.4 for medium-textured soils (loamy to silty loam), and 1.6 for coarse-textured soils (sandy loam) [36]. Although soil texture was not assessed at each sampling point, most studied areas had a clayey–silty particle size distribution. Salazar et al. [9] mention that the decrease in water infiltration rate is influenced by the increased water-repellency caused by organic substances released by eucalyptus trees, which results in higher apparent density due to the root system of these trees. Conversely, Monroy-Rodríguez et al. [28] point out that ρs is a property with minimal spatial variability, as it is closely tied to the mineralogical uniformity and origin of the soil.

4.2.3. Moisture Content

The range of 214 m found θV for indicates medium spatial correlation, but the high nugget effect suggests that variability is influenced by textural conditions, organic matter content, and vegetation cover [37]. According to Rasheed et al. [38], θg is key in practical irrigation management and in assessing soil water availability, which is essential for crop growth. In this regard, Zhao et al. [39] found that eucalyptus plantations decrease moisture content to a greater degree when compared to coconut plantations. They also stated that twenty-year-old eucalyptus plantations decrease soil moisture significantly more than plantations that are only one year old. In this regard, Daka and Geleta [40] stated that θV increases as the distance from the base of the eucalyptus tree increases, going from 16.6% at 5 m to 44.8% at 40 m in the first 15 cm of soil depth. This highlights the problems caused by eucalyptus plantations; low moisture content and low rainfall are not suitable conditions for implementing this plant species as its allelopathic competition is intensified. With its extensive roots, it reaches groundwater, depleting water reserves [41]. In this sense, Chu et al. [42] mention that, based on data from 73 studies, they found that soil moisture contents in eucalyptus plantations are, on average, 24% lower compared to those observed in soils with native forests.

4.2.4. Total Porosity (ft) and Aeration (A)

Soil porosity and pore size distribution directly influence soil hydraulic properties such as hydraulic conductivity, water retention, infiltration, and available water capacity [43]. This aligns with the results of Chu et al. [42], who found that porosity is higher in the A horizon of soil with native forests (58.9%) than in soils with eucalyptus (52.1%) and pine (51.3%) plantations. Similarly, in the B horizon, values of 52.1% (native forests), 47.5% (eucalyptus), and 46.4% (pines) were observed. These differences are attributed to the negative impact of these crops on soil organic matter content. In well-structured soil, the ideal porosity in the topsoil layer is approximately 50%, with a range of 30% to 60% [44]. A decrease in soil porosity increases compaction, reduces spaces that store air and water essential for root growth, limits infiltration and water retention, decreases aeration, and hinders root penetration—all of which negatively affect plant development. Additionally, compacted soils are more susceptible to erosion and structural degradation, which compromise fertility and agricultural productivity [45].
The aeration has a medium spatial influence, contrary to that observed by Guatibonza et al. [19], who obtained SDL ranges of 37 m. However, Monroy-Rodríguez et al. [28] reported ranges exceeding 1000 m, which may be due to the fact that these studies were conducted in flat areas, whereas the present study was carried out on a hillside. Overall, these aeration values are considered high and can be attributed to the presence of eucalyptus trees, which reduce excess humidity by absorbing water from the macropores, thereby increasing soil aeration and enhancing infiltration [46]. Conversely, Frene et al. [47] state that low soil aeration, resulting from compaction or excessive water, limits root growth and reduces the efficiency of fertilization. Therefore, evaluating the spatial variability of aeration helps in implementing management practices that optimize soil aggregate stability [48] and enhance crop productivity.

4.2.5. Aggregate Stability, and Structural Coefficient

The dominance of random variability for MWD is attributed to the different soil uses and management practices in the study area, as well as textural and relief differences [49].
In this context, Wang et al. [50] state that terrain slope affects soil aggregate stability by causing erosion processes that mainly break apart the surface macroaggregates, increasing their loss rate. They also note that aggregates larger than 1 mm are less prone to migration. Similarly, Bouslihim et al. [51] employed remote sensing and machine learning techniques to demonstrate that topographic parameters and organic matter content exhibit the strongest correlation with MWD values. Meanwhile, Ćirić et al. [20] state that aggregate size determines susceptibility to erosion; it is also likely that the reduction in aggregate size is caused by the loss of soil organic matter generated by runoff due to the high percentage of slope [52]. OM is considered essential for maintaining aggregate structure over time because it promotes soil microbial activity and acts as a cementing agent by producing humic substances and polysaccharides that bind mineral particles, forming larger, more stable aggregates [53].
Zeraatpisheh et al. [54] mention that OM is the most significant factor in the spatial variability of soil structural indices. The high nugget effect suggests that Ks is a variable with clear spatial patterns but some unexplained variability, possibly due to local heterogeneities in porosity and/or compaction. In this context, Ćirić et al. [20] evaluated various soil types and found that Ks ranged from 2.81 to 7.05, concluding that K values are lower in cultivated areas compared to grasslands, which in turn have lower Ks than native forests. Similarly, Ćirić et al. [31] state that converting forest soils to arable land significantly reduces aggregate stability.

4.3. Interpretation of Correlations and Model Contributions

4.3.1. Correlation and Principal Component Analysis

Hydraulic conductivity exhibited a weak but significant inverse relationship with bulk density (Figure 4a), suggesting that compaction restricts water movement in the soil. In this regard, Ramezani et al. [55] found that induced compaction altered soil hydraulic properties, with the most notable effect occurring in the top 20 cm of depth, where infiltration was reduced by 77.5% with intensive mechanization compared to the control. Likewise, Ksat had a slight positive correlation with ft and aeration, highlighting the importance of macropores in water flow.
Bulk density exhibited a strong inverse correlation with ft, indicating that compaction reduces pore space [56]. Likewise, θV and θg had a high positive correlation, as expected; however, they differ in their relationship with ρb, indicating that θV is more sensitive than θg to changes in density. Aeration showed a strong inverse correlation with θV, indicating that water is displaced from the macropores by air and vice versa. Additionally, aeration was directly related to ft, suggesting that pores act as pathways for gas exchange. When they are free of water, they permit oxygen diffusion, which supports root respiration. This confirms that porosity is a vital factor in soil aeration, which is essential for microbial activity [56].
The soil structural variables MWD and GMD have a high positive correlation with each other, validating their use as indicators of soil aggregate stability. Likewise, they correlated positively with θV and θg, and negatively with ft and aeration, indicating that soils with larger aggregate sizes tend to retain more water and have lower aeration rates. In this regard, Kim et al. [56] mention that soils with large aggregates develop macropores between aggregates and micropores within the aggregates, and that the most significant water retention occurs mainly in the micropores, where capillary forces retain water more strongly. Aeration depends on the macropores, so when some macropores fill with water, aeration decreases. For their part, Steponavičienė et al. [57] state that macropores are the factor that most affects water movement in the soil. Contrary to the literature, a negative correlation was observed between ρs and θg, suggesting the influence of eucalyptus crops, which are known for their high water absorption [39]. Similarly, the lack of a relationship between Ksat and the soil’s structural stability parameters may stem from the fact that eucalyptus trees have extensive and deep root systems [41], which create numerous macropores that are not reflected in the structural indices (MWD and GMD). These macropores probably influence water movement processes in the soil.
The principal components illustrate the interaction between soil structure parameters, density, and soil water dynamics, and are based on the work of Jarvis et al. [58], who state that soil structure influences processes such as solute and water movement, biological activity, and root growth, all of which impact crop production and ecosystem services.

4.3.2. Correlation and Principal Component Analysis

SHAP value analysis showed that ρb and ft are the most influential variables in Ksat. Similarly, ρb displayed an inverse relationship with Ksat, confirming that more compacted soils have a lower infiltration capacity [55]. Conversely, ft had a directly proportional effect on Ksat, emphasizing the importance of macropores in water flow. GMD and aeration also exhibited a moderate influence on water movement in the soil, indicating that soil structural stability indirectly affects Ksat [20]. However, the soil parameters that most positively affect Ksat are shown in red, supporting the conclusion that physical degradation in soils with Eucalyptus—particularly the increase in ρb and the reduction in ft—is a key factor in the Ksat behavior observed in the study area.

5. Conclusions

The lack of significant differences among vegetation covers suggests that soil physical properties primarily respond to intrinsic factors, such as texture and mineralogy, rather than current land use, highlighting the area’s edaphic resilience. Although no significant differences were found, eucalyptus influences hydrological and structural processes on steep slopes by decreasing saturated hydraulic conductivity (Ksat), moisture content, and aggregate size. These findings enhance our understanding of plant–soil interactions in the high tropics, where eucalyptus organic compounds and water extraction lead to hydrophobicity, which exacerbates soil degradation on slopes. A balance between water retention—primarily through micropores—and aeration—which is dependent on macropores—was confirmed, with negative correlations observed between volumetric water content and aeration, as well as between aggregate size and aeration. Exponential and spherical models of Ksat, porosity, and aeration facilitated the mapping of their spatial distribution (from 98 to 207 m), which is helpful for precision agriculture. The high variability of Ksat and the structural coefficient highlight the need for newer methods, such as high-density sampling and spatial uncertainty modeling, to support sustainable land use planning. It is recommended to limit the expansion of eucalyptus trees on slopes and to incorporate organic amendments that improve macroporosity and reduce soil degradation. Future research should incorporate AI-enhanced geostatistics and investigate the interactions among climate, soil, and vegetation cover to inform the adaptive management of agroecosystems.

Author Contributions

Conceptualization, J.G.Á.-H.; methodology, J.G.Á.-H. and C.J.F.-P.; software, J.G.Á.-H. and C.J.F.-P.; validation, M.J.-G.; formal analysis, J.G.Á.-H. and M.J.-G.; investigation, C.J.F.-P.; resources, J.G.Á.-H.; data curation, J.G.Á.-H. and M.J.-G.; writing—original draft preparation, C.J.F.-P. and M.J.-G.; writing—review and editing, J.G.Á.-H. and M.J.-G.; visualization, J.G.Á.-H. and M.J.-G.; supervision, J.G.Á.-H.; project administration, J.G.Á.-H.; funding acquisition, J.G.Á.-H. and M.J.-G. All authors have read and agreed to the published version of the manuscript.

Funding

This research was funded by the Research Directorate (DIN) of the Universidad Pedagógica y Tecnológica de Colombia, through project SGI 1683. The APC was funded through Call 01 of 2025 from the same institution.

Institutional Review Board Statement

Not applicable.

Informed Consent Statement

Not applicable.

Data Availability Statement

The data will be made available upon request.

Conflicts of Interest

The authors declare no conflicts of interest.

References

  1. Awal, R.; Safeeq, M.; Abbas, F.; Fares, S.; Deb, S.K.; Ahmad, A.; Fares, A. Soil physical properties spatial variability under long-term no-tillage corn. Agronomy 2019, 9, 750. [Google Scholar] [CrossRef]
  2. Meshesha, D.T.; Belay, A.W.; Tiruneh, G.A.; Adgo, E.; Alemayehu, T.Y.; Chandrakala, M.; Reichert, J.M. Exploring and modeling the spatial variability of soil erosion in Tana Basin, Northwestern Ethiopia. Appl. Environ. Soil Sci. 2024, 2024, 2102727. [Google Scholar] [CrossRef]
  3. Oladipupo, R.A.; Munnaf, M.A.; Sanganta, P.; Borundia, A.; Mouazen, A.M. A Novel On-Line Dual Sensing System for Soil Property Measurement and Mapping. Smart Agric. Technol. 2024, 9, 100640. [Google Scholar] [CrossRef]
  4. Della Peruta, R.; Mereu, V.; Spano, D.; Marras, S.; Vezy, R.; Trabucco, A. Projecting Trends of Arabica Coffee Yield under Climate Change: A Process-Based Modelling Study at Continental Scale. Agric. Syst. 2025, 227, 104353. [Google Scholar] [CrossRef]
  5. Yang, Y.; Peng, B.; Guan, K.; Pan, M.; Franz, T.E.; Cosh, M.H.; Bernacchi, C.J. Within-field soil moisture variability and time-invariant spatial structures of agricultural fields in the US Midwest. Vadose Zone J. 2024, 23, e20337. [Google Scholar] [CrossRef]
  6. Wang, Y.; Yuan, F.; Cammarano, D.; Liu, X.; Tian, Y.; Zhu, Y.; Cao, W.; Cao, Q. Integrating Machine Learning with Spatial Analysis for Enhanced Soil Interpolation: Balancing Accuracy and Visualization. Smart Agric. Technol. 2025, 11, 101032. [Google Scholar] [CrossRef]
  7. Sarto, M.V.M.; Borges, W.L.B.; Bassegio, D.; Nunes, M.R.; Rice, C.W.; Rosolem, C.A. Deep soil water content and forage production in a tropical agroforestry system. Agriculture 2022, 12, 359. [Google Scholar] [CrossRef]
  8. Dzikiti, S.; Gush, M.B.; Le Maitre, D.C.; Maherry, A.; Jovanovic, N.Z.; Ramoelo, A.; Cho, M.A. Quantifying potential water savings from clearing invasive alien Eucalyptus camaldulensis using in situ and high resolution remote sensing data in the Berg River Catchment, Western Cape, South Africa. For. Ecol. Manag. 2016, 361, 69–80. [Google Scholar] [CrossRef]
  9. Salazar, M.P.; Lozano, L.A.; Villarreal, R.; Bellora, G.L.; Villeda, C.A.M.; Churquina, N.; Polich, N.G.; Soracco, C.G. Soil water repellency under Eucalyptus stands of different age and its relationship with soil hydrological function and soil organic matter. Catena 2024, 246, 108441. [Google Scholar] [CrossRef]
  10. Wang, Y.; He, C.; Shi, Y.; Li, H.; Tang, Y.; Chen, B.; Ke, Q.; Wu, L.; Chen, L. Short-term cultivation limiting soil aggregate stability and macronutrient accumulation associated with glomalin-related soil protein in Eucalyptus urophylla × Eucalyptus grandis plantations. Sci. Total Environ. 2023, 878, 163187. [Google Scholar] [CrossRef]
  11. Tesfaw, A.; Teferi, E.; Senbeta, F.; Alemu, D. The spatial distribution and expansion of Eucalyptus in its hotspots: Implications on agricultural landscapes. Heliyon 2023, 9, e14393. [Google Scholar] [CrossRef]
  12. Zárate, J.A.; Gutiérrez, O.J. Caracterización de maderas usadas en Boyacá de acuerdo con el Reglamento Colombiano de Construcción Sismo Resistente. Rev. Fac. Ing. 2012, 21, 73–91. [Google Scholar]
  13. Guzmán, S.D.M.; Drummond, J.A.; Barreto, C.G. Undesirable Neighbours: Eucalyptus and Protected Areas. In Protected Area Management—Recent Advances; IntechOpen: London, UK, 2022. [Google Scholar] [CrossRef]
  14. Peng, J.; Xiao, L.; Xu, Z.; Chen, B.; Zhou, G.; Qiao, C.; Sun, C.; Wu, Z. Effects of Different Land Use Change on Soil Aggregate and Aggregate Associated Organic Carbon: A Meta-Analysis. Pol. J. Environ. Stud. 2024, 33, 5263–5274. [Google Scholar] [CrossRef]
  15. Ye, L.; Ji, L.; Chen, H.; Chen, X.; Tan, W. Spatial contribution of environmental factors to soil aggregate stability in a small catchment of the Loess Plateau, China. Agronomy 2022, 12, 2557. [Google Scholar] [CrossRef]
  16. Li, S.; Wang, B.; Zhang, X.; Wang, H.; Yi, Y.; Huang, X.; Li, H.; Zhu, P.; Han, W. Soil particle aggregation and aggregate stability associated with ion specificity and organic matter content. Geoderma 2023, 429, 116285. [Google Scholar] [CrossRef]
  17. Álvarez Herrera, J.G.; Ruiz Berrío, H.D.; Acosta Tova, D.F. Evaluación geoestadística de atributos hidrofísicos del suelo en la granja Tunguavita, Paipa, Colombia. Cienc. Ing. Neogranadina 2021, 31, 127–140. [Google Scholar] [CrossRef]
  18. Stolt, M.H.; Needelman, B.A. Fundamental Changes in Soil Taxonomy. Soil Sci. Soc. Am. J. 2015, 79, 1001–1007. [Google Scholar] [CrossRef]
  19. Guatibonza, M.; Álvarez-Herrera, J.G.; Sanabria, J.E. Distribución espacial de la conductividad hidráulica en un lote de la granja Tunguavita (Paipa, Colombia). Agron. Colomb. 2009, 27, 261–271. [Google Scholar]
  20. Ćirić, V.; Manojlović, M.; Nešić, L.; Belić, M. Soil dry aggregate size distribution: Effects of soil type and land use. J. Soil Sci. Plant Nutr. 2012, 12, 689–703. [Google Scholar] [CrossRef]
  21. Warrick, A.W.; Nielsen, D. Spatial variability of soil physical properties in the field. In Applications of Soil Physics; Academic Press: New York, NY, USA, 1980; pp. 319–344. [Google Scholar] [CrossRef]
  22. Cambardella, C.A.; Moorman, T.B.; Novak, J.M.; Parkin, T.B.; Karlen, D.L.; Turco, R.F.; Konopka, A.E. Field-scale variability of soil properties in central Iowa soils. Soil Sci. Soc. Am. J. 1994, 58, 1501–1511. [Google Scholar] [CrossRef]
  23. Catoni, M.; D’Amico, M.E.; Zanini, E.; Bonifacio, E. Effect of pedogenic processes and formation factors on organic matter stabilization in alpine forest soils. Geoderma 2016, 263, 151–160. [Google Scholar] [CrossRef]
  24. Kooch, Y.; Ghorbanzadeh, N.; Haghverdi, K.; Francaviglia, R. Soil Quality Cannot Be Improved after Thirty Years of Land Use Change from Forest to Rangeland. Sci. Total Environ. 2023, 856, 159132. [Google Scholar] [CrossRef]
  25. Godoy, V.A.; Zuquette, L.V.; Gómez-Hernández, J.J. Spatial variability of hydraulic conductivity and solute transport parameters and their spatial correlations to soil properties. Geoderma 2019, 339, 59–69. [Google Scholar] [CrossRef]
  26. Soares, M.F.; Centeno, L.N.; Timm, L.C.; Mello, C.R.; Kaiser, D.R.; Beskow, S. Identifying covariates to assess the spatial variability of saturated soil hydraulic conductivity using robust cokriging at the watershed scale. J. Soil Sci. Plant Nutr. 2020, 20, 1491–1502. [Google Scholar] [CrossRef]
  27. Moratelli, F.A.; Alves, M.A.B.; Borella, D.R.; Kraeski, A.; Almeida, F.T.D.; Zolin, C.A.; Hoshide, A.K.; Souza, A.P.D. Effects of land use on soil physical-hydric attributes in two watersheds in the southern Amazon, Brazil. Soil Syst. 2023, 7, 103. [Google Scholar] [CrossRef]
  28. Monroy-Rodríguez, F.L.; Álvarez-Herrera, J.G.; Alvarado-Sanabria, Ó.H. Distribución espacial de algunas propiedades físicas del suelo en un transecto de la granja Tunguavita, Paipa. Rev. UDCA Actual. Divulg. Cient. 2017, 20, 91–100. [Google Scholar]
  29. Mentges, M.I.; Reichert, J.M.; Rodrigues, M.F.; Awe, G.O.; Mentges, L.R. Capacity and intensity soil aeration properties affected by granulometry, moisture, and structure in no-tillage soils. Geoderma 2016, 263, 47–59. [Google Scholar] [CrossRef]
  30. Yalin, D.; Schwartz, A.; Tarchitzky, J.; Shenker, M. Soil oxygen and water dynamics underlying hypoxic conditions in the root-zone of avocado irrigated with treated wastewater in clay soil. Soil Tillage Res. 2021, 212, 105039. [Google Scholar] [CrossRef]
  31. Ćirić, V.; Manojlović, M.; Belić, M.; Nešić, L.; Seremešić, S. Effects of land use conversion on soil aggregate stability and organic carbon in different soils. Agrociencias 2013, 47, 539–552. Available online: https://agrociencia-colpos.org/index.php/agrociencia/article/view/1038/1038 (accessed on 25 July 2025).
  32. Holtz, R.D.; Baroutaji, A. Construction Materials: Soil and Natural Materials. In Reference Module in Materials Science and Materials Engineering; Elsevier: Amsterdam, The Netherlands, 2016. [Google Scholar] [CrossRef]
  33. Piyaruwan, H.I.G.S.; Jayasinghe, P.K.S.C.; Leelamanie, D.A.L. Water repellency in eucalyptus and pine plantation forest soils and its relation to groundwater levels estimated with multi-temporal modeling. J. Hydrol. Hydromech. 2020, 68, 382–391. [Google Scholar] [CrossRef]
  34. Priori, S.; Pellegrini, S.; Vignozzi, N.; Costantini, E.A. Soil physical-hydrological degradation in the root-zone of tree crops: Problems and solutions. Agronomy 2021, 11, 68. [Google Scholar] [CrossRef]
  35. Panagos, P.; De Rosa, D.; Liakos, L.; Labouyrie, M.; Borrelli, P.; Ballabio, C. Soil bulk density assessment in Europe. Agric. Ecosyst. Environ. 2024, 364, 108907. [Google Scholar] [CrossRef]
  36. Díaz, J.C. Relación espacial entre propiedades de suelos y estrés hídrico en caña de azúcar en la hacienda Churimal-Roldanillo-Valle del Cauca, Colombia. Suelos Ecuat. 2019, 49, 65–74. Available online: https://dialnet.unirioja.es/servlet/articulo?codigo=7831530 (accessed on 1 September 2025). [CrossRef]
  37. Li, D.; Shao, M.; Zhang, S.; Zhang, K. The dynamics of soil moisture balance components and their relations with the productivity of natural vegetation in an arid region of northwestern China. Ecol. Eng. 2020, 143, 105672. [Google Scholar] [CrossRef]
  38. Rasheed, M.W.; Tang, J.; Sarwar, A.; Shah, S.; Saddique, N.; Khan, M.U.; Khan, M.I.; Nawaz, S.; Shamshiri, R.R.; Aziz, M.; et al. Soil moisture measuring techniques and factors affecting the moisture dynamics: A comprehensive review. Sustainability 2022, 14, 11538. [Google Scholar] [CrossRef]
  39. Zhao, C.J.; Wu, Z.; Kang, M.Y.; Fan, W.B.; Lin, Z.; Zhuo, Z.Q. Variation of soil moisture content for Eucalyptus forests and its response to stand ages in Western Hainan. Acta Ecol. Sin. 2015, 35, 1734–1742. [Google Scholar] [CrossRef]
  40. Daka, Y.S.; Geleta, Z.T. Effect of Eucalyptus Tree on Selected Soil Physico-Chemical Properties in Gidami District, West Ethiopia. Preprint 2023. [Google Scholar] [CrossRef]
  41. Christina, M.; Nouvellon, Y.; Laclau, J.P.; Stape, J.L.; Bouillet, J.P.; Lambais, G.R.; Le Maire, G. Importance of deep water uptake in tropical eucalypt forest. Funct. Ecol. 2017, 31, 509–519. [Google Scholar] [CrossRef]
  42. Chu, S.; Jacobs, D.F.; Sloan, J.L.; Xue, L.; Wu, D.; Zeng, S. Changes in soil properties under Eucalyptus relative to Pinus massoniana and natural broadleaved forests in South China. J. For. Res. 2018, 29, 1299–1306. [Google Scholar] [CrossRef]
  43. Indoria, A.K.; Sharma, K.L.; Reddy, K.S. Hydraulic properties of soil under warming climate. In Climate Change and Soil Interactions; Elsevier: Amsterdam, The Netherlands, 2020; pp. 473–508. [Google Scholar] [CrossRef]
  44. Earl, J. Soil Physics: Fact Sheet 9. Local Land Services, New South Wales 2020. Available online: https://www.lls.nsw.gov.au/__data/assets/pdf_file/0009/1270539/9-Soil-Physics_FINAL.pdf (accessed on 25 July 2025).
  45. Shaheb, M.R.; Venkatesh, R.; Shearer, S.A. A review on the effect of soil compaction and its management for sustainable crop production. J. Biosyst. Eng. 2021, 46, 417–439. [Google Scholar] [CrossRef]
  46. Medeiros, P.L.D.; Pimenta, A.S.; Miranda, N.D.O.; Melo, R.R.D.; Amorim, J.D.S.; Azevedo, T.K.B.D. The myth that eucalyptus trees deplete soil water—A review. Forests 2025, 16, 423. [Google Scholar] [CrossRef]
  47. Frene, J.P.; Pandey, B.K.; Castrillo, G. Under pressure: Elucidating soil compaction and its effect on soil functions. Plant Soil 2024, 502, 267–278. [Google Scholar] [CrossRef]
  48. Futa, B.; Gmitrowicz-Iwan, J.; Skersienė, A.; Šlepetienė, A.; Parašotas, I. Innovative soil management strategies for sustainable agriculture. Sustainability 2024, 16, 9481. [Google Scholar] [CrossRef]
  49. Zhang, S.; Li, L.; Zhu, Z.; Zhang, P. Spatial distribution and relationship between slope micro-topography changes and soil aggregate stability under rainfall conditions. Water 2024, 16, 648. [Google Scholar] [CrossRef]
  50. Wang, Y.; Xu, Y.; Yang, H.; Shen, H.; Zhao, L.; Zhu, B.; Wang, J.; Guo, L. Effect of slope shape on soil aggregate stability of slope farmland in black soil region. Front. Environ. Sci. 2023, 11, 1127043. [Google Scholar] [CrossRef]
  51. Bouslihim, Y.; Rochdi, A.; Aboutayeb, R.; El Amrani-Paaza, N.; Miftah, A.; Hssaini, L. Soil aggregate stability mapping using remote sensing and GIS-based machine learning technique. Front. Earth Sci. 2021, 9, 748859. [Google Scholar] [CrossRef]
  52. Gan, F.; Shi, H.; Gou, J.; Zhang, L.; Dai, Q.; Yan, Y. Responses of soil aggregate stability and soil erosion resistance to different bedrock strata dip and land use types in the karst trough valley of Southwest China. Int. Soil Water Conserv. Res. 2024, 12, 684–696. [Google Scholar] [CrossRef]
  53. Maffia, A.; Oliva, M.; Marra, F.; Mallamaci, C.; Nardi, S.; Muscolo, A. Humic substances: Bridging ecology and agriculture for a greener future. Agronomy 2025, 15, 410. [Google Scholar] [CrossRef]
  54. Zeraatpisheh, M.; Ayoubi, S.; Mirbagheri, Z.; Mosaddeghi, M.R.; Xu, M. Spatial prediction of soil aggregate stability and soil organic carbon in aggregate fractions using machine learning algorithms and environmental variables. Geoderma Reg. 2021, 27, e00440. [Google Scholar] [CrossRef]
  55. Ramezani, N.; Sayyad, G.A.; Barzegar, A.R. Tractor Wheel Compaction Effect on Soil Water Infiltration, Hydraulic Conductivity and Bulk Density. Malays. J. Soil Sci. 2017, 21, 47–61. Available online: https://www.msss.com.my/mjss/Full%20Text/vol21/4.Ramezani.pdf (accessed on 25 July 2025).
  56. Kim, K.; Gil, J.; Ostrom, N.E.; Gandhi, H.; Oerther, M.S.; Kuzyakov, Y.; Guber, A.K.; Kravchenko, A.N. Soil pore architecture and rhizosphere legacy define N2O production in root detritusphere. Soil Biol. Biochem. 2022, 166, 108565. [Google Scholar] [CrossRef]
  57. Steponavičienė, V.; Bogužas, V.; Sinkevičienė, A.; Skinulienė, L.; Vaisvalavičius, R.; Sinkevičius, A. Soil water capacity, pore size distribution, and CO2 emission in different soil tillage systems and straw retention. Plants 2022, 11, 614. [Google Scholar] [CrossRef] [PubMed]
  58. Jarvis, N.; Coucheney, E.; Lewan, E.; Klöffel, T.; Meurer, K.H.; Keller, T.; Larsbo, M. Interactions between Soil Structure Dynamics, Hydrological Processes, and Organic Matter Cycling: A New Soil-Crop Model. Eur. J. Soil Sci. 2024, 75, e13455. [Google Scholar] [CrossRef]
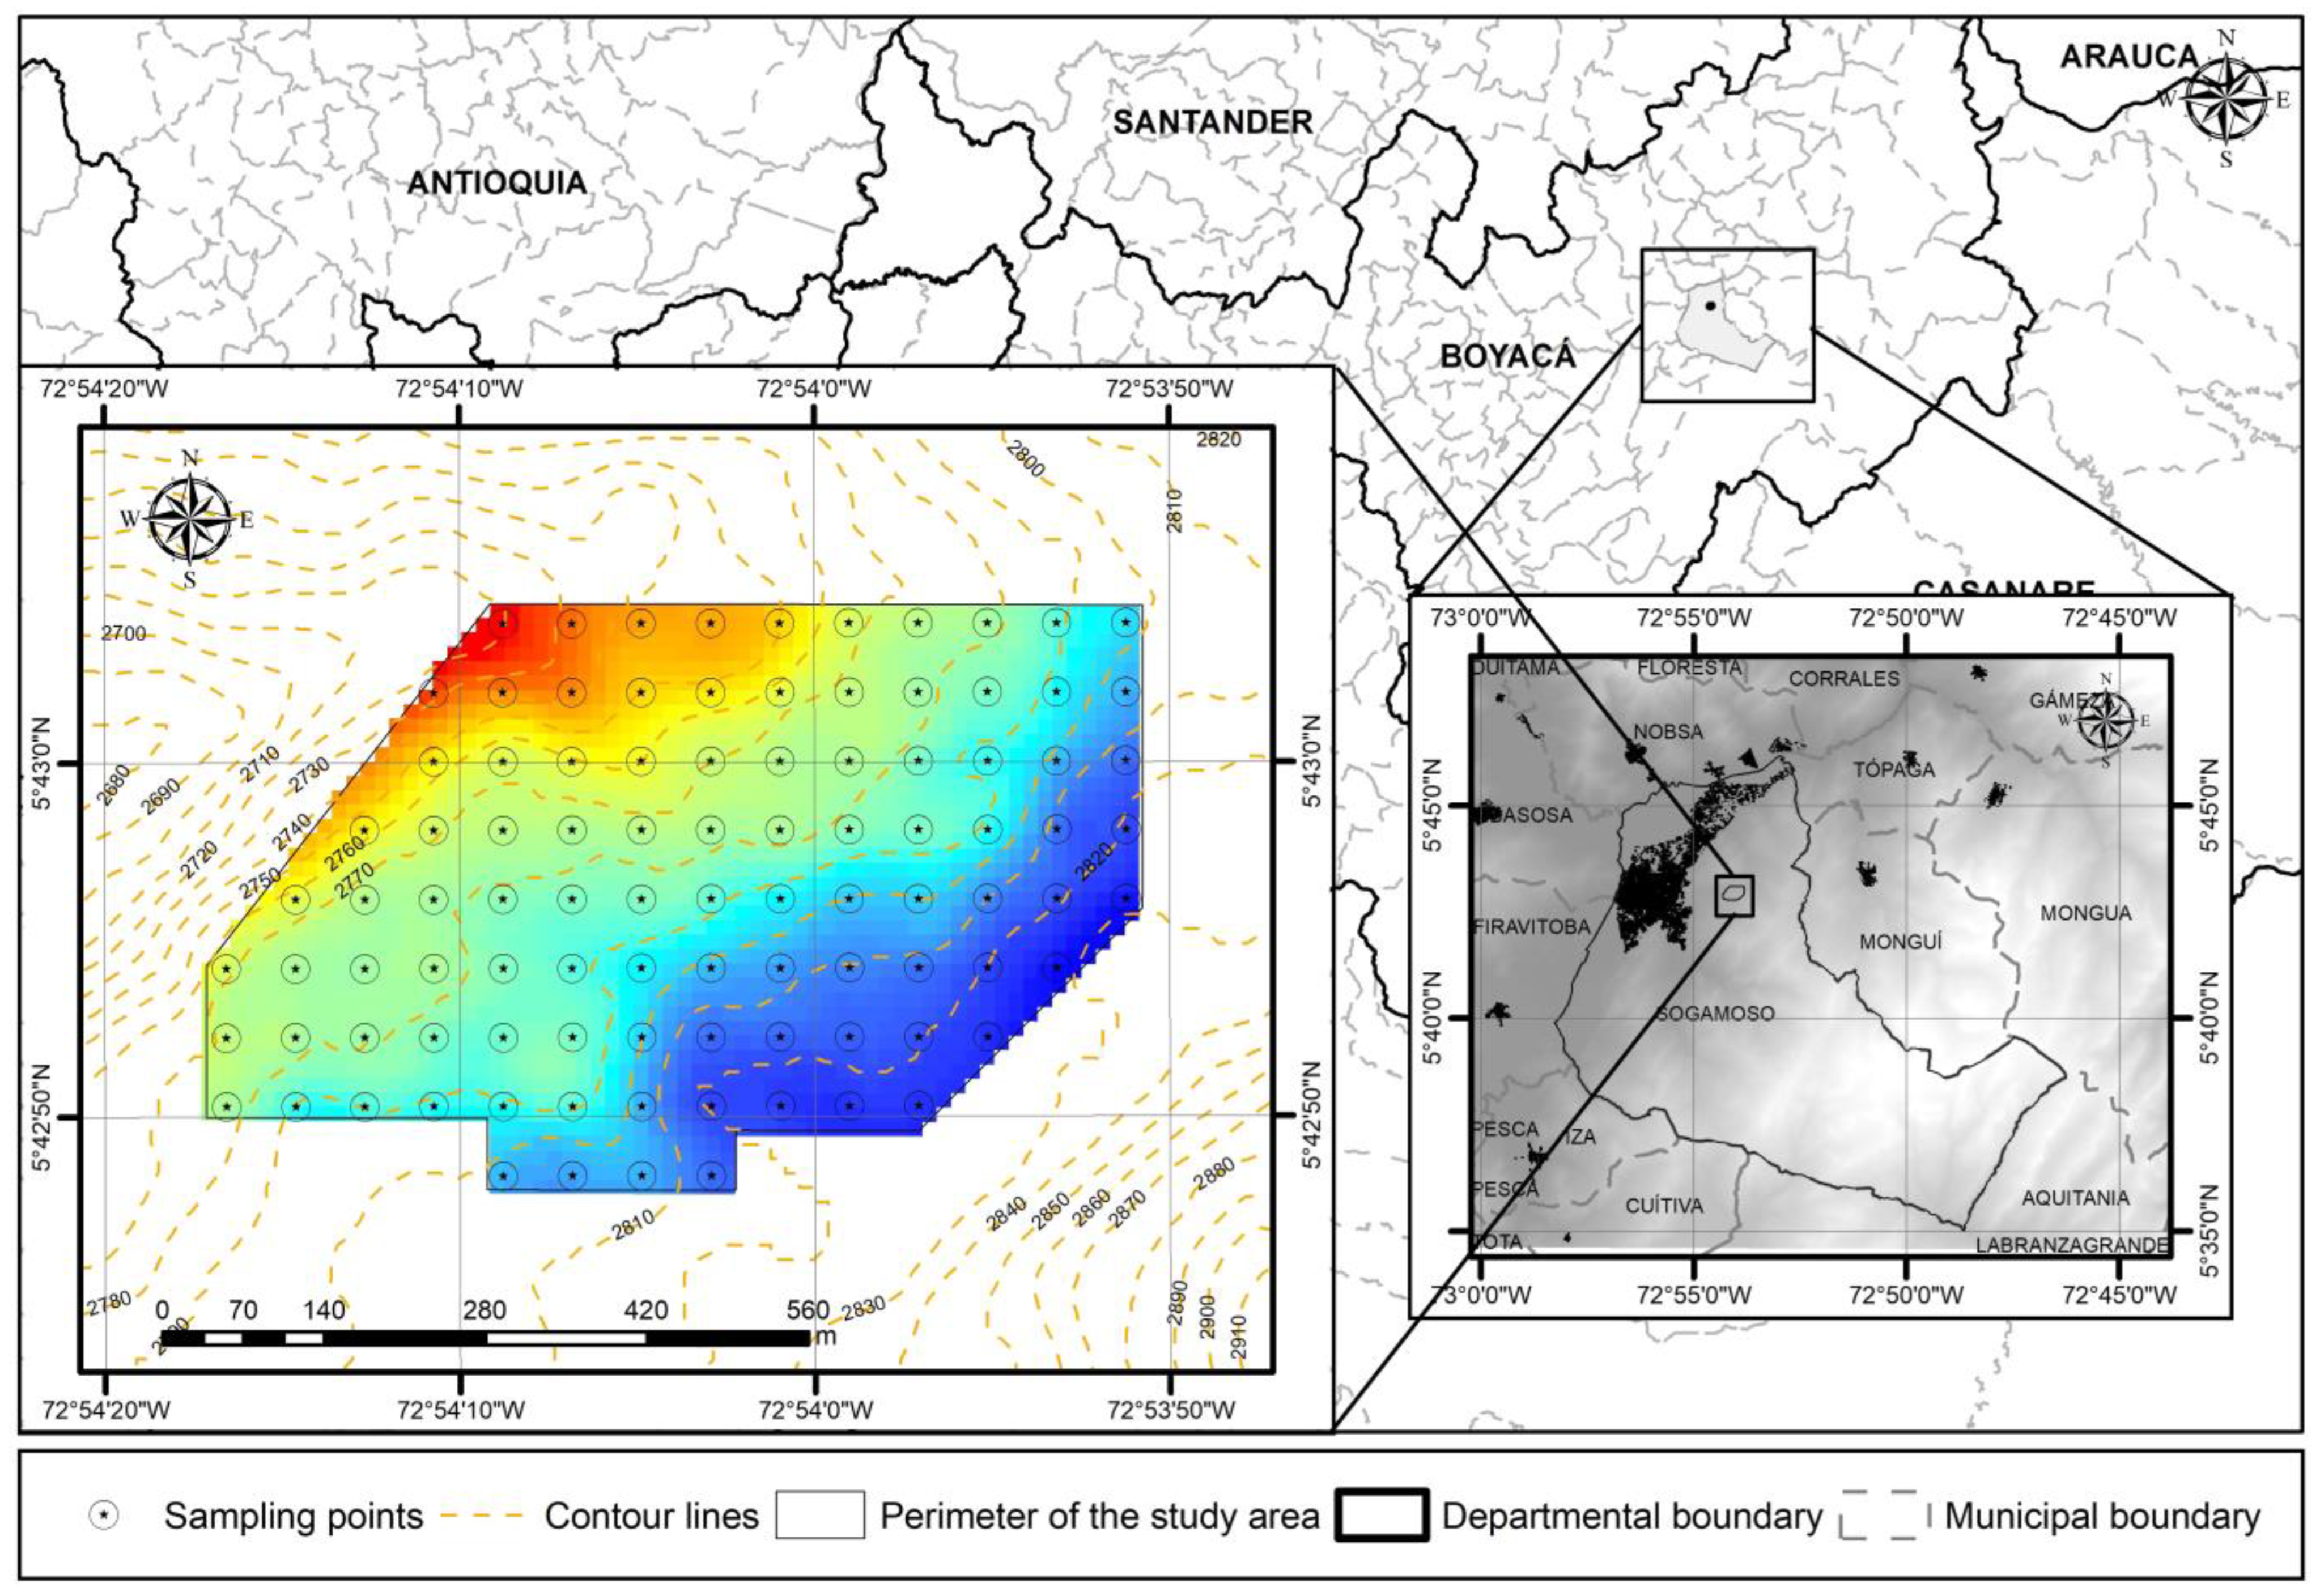
Figure 1. Location of the area and sampling points.
Geomatics 05 00041 g001
Figure 2. Map of vegetation cover classification in the study area.
Geomatics 05 00041 g002
Figure 3. Modeling of (a) saturated hydraulic conductivity; (b) bulk density; (c) ρS: particle density; (d) volumetric water content; (e) gravimetric water content; (f) porosity; (g) aeration; (h) mean weight diameter; (i) geometric mean diameter; (j) structural coefficient of soil.
Geomatics 05 00041 g003aGeomatics 05 00041 g003b
Figure 4. (a) Coefficients of correlation (b) and principal components of the soil physical properties. * significant for normality (*: p < 0.05, **: p < 0.01, ***: p < 0.001).
Geomatics 05 00041 g004
Figure 5. SHAP analysis results showing (a) the relative importance of soil physical properties, (b) nonlinear relationships between soil properties and Kₛₐₜ (positive values increase predicted conductivity), and (c) a representative example of individual property contributions to a specific prediction. Values in (a) represent mean SHAP. In (b), color intensity indicates property values (red = high; blue = low).
Geomatics 05 00041 g005
Table 1. Equations used for soil properties.
ParameterEquationUnits
Bulk density ρ b = m a s s d r y   s o i l V t g cm−3
Particle density ρ s = m a s s d r y   s o i l V s g cm−3
Volumetric water content θ V = V w V t × 100 %
Gravimetric water content θ g = ( mass wet   soil mass dry   soil ) mass dry   soil × 100 %
Porosity f t = 1 ρ b ρ s × 100 %
Aeration A = V a V t × 100 %
Mean weight diameter M W D = i = 1 n X i W i mm
Geometric mean diameter G M D = e i = 1 n ( W i × l n X i ) W i mm
Structural coefficient of soil K s = a b ---
VT: total volume of the soil sample; Vs: soil volume; Vw: water volume; Va: air volume; Wi: weight percentage of each of the aggregate sizes concerning the total sample; Xi: mean diameter of each of the aggregate sizes; a is the weight percentage of aggregates between 0.25 and 10 mm and b is the weight percentage of aggregates <0.25 mm and >10 mm.
Table 2. Comparison of soil physical properties for different vegetation covers.
ParameterDense Forest
(n = 24)
Mosaic of Grasses and Crops
(n = 31)
Weedy Pastures
(n = 23)
Mosaic of Crops
(n = 19)
Ksat0.2580 a0.3251 a0.2143 a0.1574 a
ρb1.2542 a1.2439 a1.2987 a1.2305 a
ρs2.2204 a2.1584 a2.2230 a2.2211 a
θV15.2738 a16.9739 a18.7583 a16.1495 a
θg12.1417 a13.6942 a14.7243 a13.0442 a
ft43.4146 a42.2723 a41.6083 a44.7216 a
Aeration28.1392 a25.2977 a22.8513 a28.5705 a
MWD2.2581 a2.5434 a2.7451 a2.2498 a
GMD1.4383 a1.5766 a1.7394 a1.3563 a
Ks10.9850 a10.6387 a13.2048 a9.0968 a
Ksat: saturated hydraulic conductivity; ρb: bulk density; ρS: particle density; θV: volumetric water content; θg: gravimetric water content; ft: porosity; MWD: mean weight diameter; GMD: geometric mean diameter; Ks: structural coefficient of soil. Different lowercase letters indicate differences between vegetation covers, according to the Tukey test (p < 0.05).
Table 3. Descriptive statistics of the parameter evaluated from 97 soil samples.
ParameterUnitMeanMedianMin.Max.SkewnessKurtosisCV (%)N
Ksatm day−10.2490.1550.0011.0141.3411.070104.49ns
ρbg cm−31.2571.2600.9601.540−0.064−0.63411.30*
ρsg cm−32.2012.2202.0002.440−0.074−0.7935.85ns
θV%16.81516.2005.18030.5100.2860.02330.78*
θg%13.42713.1703.99023.4100.189−0.04029.70*
ft%42.87743.76026.12052.130−0.509−0.44014.27ns
Aeration%26.06226.5508.45045.010−0.182−0.80535.21*
MWDmm2.4632.4730.6404.028−0.195−0.36231.54*
GMDmm1.5381.4230.3533.0480.333−0.22238.72*
Ks---11.0319.9301.06026.9200.781−0.12160.54ns
Ksat: saturated hydraulic conductivity; ρb: bulk density; ρS: particle density; θV: volumetric water content; θg: gravimetric water content; ft: porosity; MWD: mean weight diameter; GMD: geometric mean diameter; Ks: structural coefficient of soil; CV: coefficient of variation; N: normality; ns: no significant; * significant for normality of Shapiro–Wilk (p < 0.05).
Table 4. Parameters of the fitted semivariograms for the measured soil attributes.
ParameterModelNugget (C0)Sill
(C + C0)
Range
(m)
SDL
(C0/C + C0)
Interpolation
Method
r2
KsatSpherical 0.00460.072980.064Kriging0.682
ρbLinear0.01660.0223790.755IDW0.726
ρsLinear0.01480.0173790.873IDW−0.192
θVExponential5.4716.242140.337IDW0.998
θgExponential2.6627.51540.097IDW0.939
ftExponential5.1039.42070.129IDW0.858
AerationExponential10.188.011950.115IDW0.987
MWDLinear0.4340.6413790.677IDW0.832
GMDLinear0.2600.3863790.674IDW0.797
KsGaussian24.5949.194700.499Kriging0.940
Ksat: saturated hydraulic conductivity; ρb: bulk density; ρS: particle density; θV: volumetric water content; θg: gravimetric water content; ft: porosity; MWD: mean weight diameter; GMD: geometric mean diameter; Ks: structural coefficient of soil; SDL: spatial dependence level; IWD: inverse distance weighting; r2: coefficient of the interpolation model regression.
Disclaimer/Publisher’s Note: The statements, opinions and data contained in all publications are solely those of the individual author(s) and contributor(s) and not of MDPI and/or the editor(s). MDPI and/or the editor(s) disclaim responsibility for any injury to people or property resulting from any ideas, methods, instructions or products referred to in the content.